1
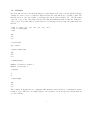
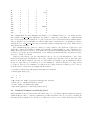
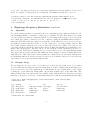
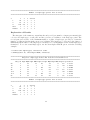
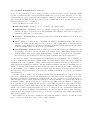
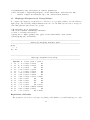
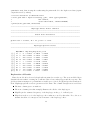
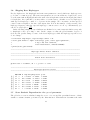
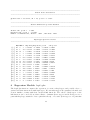
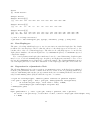
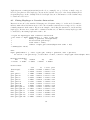
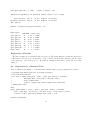
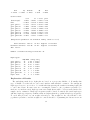
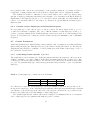
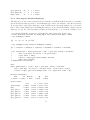
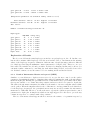
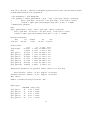
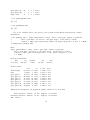
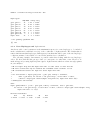
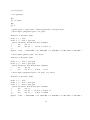
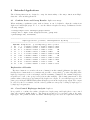
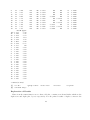
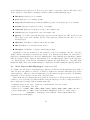
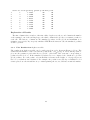
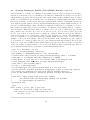
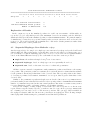
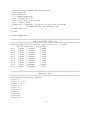
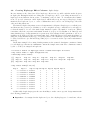
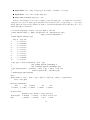
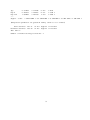
Locus Scan-statistic Simulated P-values ================================================================================ loc-1 loc-2 loc-3 loc-4 loc-5 loc-6 loc-7 loc-8 loc-9 loc-10 loc-11 sim.p-val 0 0 0 0 0 0 0 0 0 0 0 Loci with max scan statistic: Max-Stat Simulated Global p-value: Number of Simulations: 2 0 100 Explanation of Results In the output we report the simulated p-values for each locus test statistic. Additionally, we report the loci (or locus) which provided the maximum observed test statistic, and the Max-Stat Simulated Global p-value is the simulated p-value for that maximum statistic. We print the number of simulations, because they are performed until p-value precision criteria are met, as described in section 5.9. We would typically allow simulations to run under default parameters rather than limiting to 100 by the control parameters. 8.5 Sequential Haplotype Scan Methods: seqhap Another approach for choosing loci for haplotype associations is by seqhap, as described in Yu and Schaid, 2007 [12]. The seqhap method performs three tests for association of a binary trait over a set of bi-allelic loci. When evaluating each locus, loci close to it are added in a sequential manner based on the Mantel-Haenszel test [13]. For each marker locus, three tests are provided: single locus, the traditional single-locus χ21 test of association, sequential haplotype, based on a haplotype test for sequentially chosen loci, sequential sum, based on the sum of a series of conditional χ2 statistics. All three tests are assessed for significance with permutation p-values, in addition to the asymptotic p-value. The point-wise p-value for a statistic at a locus is the fraction of times that the statistic for the permuted data is larger than that for the observed data. The regional p-value is the chance of observing a permuted test statistic, maximized over a region, that is greater than that for the observed data. Similar to the permutation p-values in haplo.score as described in section 5.9, permutations are performed until a precision threshold is reached for the regional p-values. A minimum and maximum number of permutations specified in the sim.control parameter list ensure a certain accuracy is met for every simulation p-value, yet having a limit to avoid infinite run-time. Below is an example of using seqhap on data with case-control response for a chromosome region. First set up the binary response, y, with 0=control, 1=case, then a genotype matrix with two columns per locus, and a vector of chromosome positions. The genotype data is available in the seqhap.dat dataset while the chromosome positions are in seqhap.pos. The following example runs seqhap with default settings for permutations and threshold parameters. 51