1
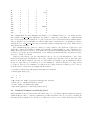
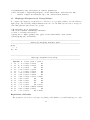
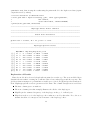
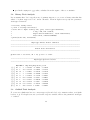
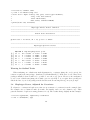
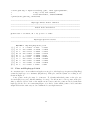
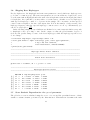
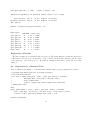
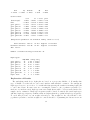
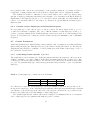
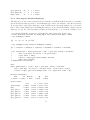
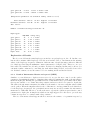
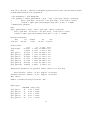
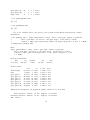
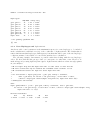
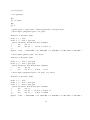
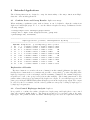
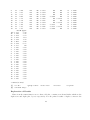
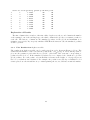
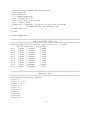
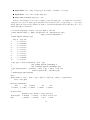
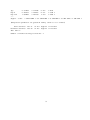
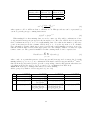
p-val is the asymptotic χ21 p-value, calculated from the square of the score statistic. 5.2 Binary Trait Analysis Let us assume that ”low” responders are of primary interest, so we create a binary trait that has values of 1 when resp.cat is ”low”, and 0 otherwise. Then in haplo.score specify the parameter trait.type=”binomial”. > > > + + + > # scores, binary trait y.bin <- 1*(resp.cat=="low") score.bin <- haplo.score(y.bin, geno, trait.type="binomial", x.adj = NA, min.count=5, haplo.effect="additive", locus.label=label, miss.val=0, simulate=FALSE) print(score.bin, nlines=10) -------------------------------------------------------------------------------Haplotype Effect Model: additive --------------------------------------------------------------------------------------------------------------------------------------------------------------Global Score Statistics -------------------------------------------------------------------------------global-stat = 33.70125, df = 18, p-val = 0.01371 -------------------------------------------------------------------------------Haplotype-specific Scores -------------------------------------------------------------------------------- [1,] [2,] [3,] [4,] [5,] [6,] [7,] [8,] [9,] [10,] 5.3 DQB 62 51 63 21 32 32 51 31 31 51 DRB 2 1 13 7 4 4 1 11 11 1 B 7 35 7 7 7 62 27 35 51 44 Hap-Freq 0.05098 0.03018 0.01655 0.01246 0.01678 0.02349 0.01505 0.01754 0.01137 0.01731 Hap-Score -2.19387 -1.58421 -1.56008 -1.47495 -1.00091 -0.6799 -0.66509 -0.5838 -0.43721 0.00826 p-val 0.02824 0.11315 0.11874 0.14023 0.31687 0.49657 0.50599 0.55936 0.66196 0.99341 Ordinal Trait Analysis To create an ordinal trait, here we convert resp.cat (described above) to numeric values, y.ord (with levels 1, 2, 3). For haplo.score, use y.ord as the response variable, and set the parameter trait.type = ”ordinal”. 19