1
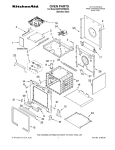
MONITORING TURBIDITY
AT DREDGING SITES
A GUIDE TO UNDERSTANDING AND ESTABLISHING TURBIDITY AS A REAL-TIME MONITORING SOLUTION
WHAT’S INSIDE
01
Environmental Dredging: Overview of USACE Guidelines
02
A Real-Time Solution
04
Turbidity Technology
06
Typical Turbidity Monitoring System
08
Points of Compliance
10
Data Management
12
Quality Assurance
14
Recommended Equipment
16
Purchase or Rent?
17
About Fondriest Environmental
18
System Configuration Tool
WHY MONITORING MATTERS
Dredging is a common and economically viable solution for the removal and subsequent treatment of contaminated sediment. If executed
properly, dredging can yield positive environmental results without harming water quality conditions. Dredging operations should aim
to remove sediment as efficiently as possible while diminishing short-term environmental impacts, most notably the re-suspension of
potentially contaminated sediments.
To minimize sediment re-suspension and contaminant release, a monitoring system should be established. Sediment can easily be dislodged
by dredging and dispersed into the water column. This re-suspension may damage water quality both in the immediate vicinity as well
as downstream as it travels with the current. Additionally, if the suspended sediment is contaminated, it can release toxins into the water
and air. Effective monitoring of re-suspended sediments for the duration of dredging operations is crucial to maintaining acceptable water
quality levels for both wildlife and humans.
For this reason, the U.S. Army Corps of Engineers (USACE) and Environmental Protection Agency (EPA) offer extensive guidelines for estimating the environmental consequences of a dredge. The guides also emphasize the need to monitor these effects as the dredging operation
occurs in order to keep any re-suspension and transport under control. These monitoring efforts allow project managers to respond if resuspended sediment levels exceed pre-established parameters by slowing down or altering the dredging.
For the complete USACE’s Technical Guidelines for Environmental Dredging of Contaminated Sediments, visit:
http://el.erdc.usace.army.mil/elpubs/pdf/trel08-29.pdf
For the complete EPA’s Contaminated Sediment Remediation Guidance for Hazardous Waste Sites, visit:
http://www.epa.gov/superfund/health/conmedia/sediment/pdfs/guidance.pdf
ENVIRONMENTAL
DREDGING
Overview of USACE Guidelines
Environmental dredging is defined as: “the removal of contaminated sediments from a water body for purposes of sediment remediation” (USACE).
While there are several approaches to dealing with contaminated sediment,
dredging is frequently the cleanup method of choice for projects under the
Comprehensive Environmental Response, Compensation, and Liability Act
(CERCLA), also known as the “Superfund” program.
As no two projects are identical, the specific environmental limits set for
a dredging project will vary. Several influencing factors include location,
sediment composition, acting regulatory agencies and environmental
laws. To assist with this effort, the U.S. Army Corps of Engineers (USACE)
has generated a comprehensive set of guidelines to evaluate environmental
dredging as a solution for sediment remediation projects. While the EPA’s
remediation guide addresses all possible steps and alternatives for dealing
with contaminated sediment, the USACE’s guide focuses specifically on the
dredging component.
These guidelines provide detailed steps regarding the establishment
of a dredging operation, from the preliminary evaluation to the process,
methods and control procedures. In doing so, this guide establishes a hierarchy of objectives regarding the technical aspects of a remedial dredging
operation. These objectives aim not only to minimize sediment re-suspension, release and residuals, but also to maintain a cost-effective strategy in
both the short and long term.
Both of these guidelines stress the importance of implementing a monitoring strategy that provides rapid feedback, allowing dredge operators
to respond to high re-suspension levels before they become problematic.
Established limits for sediment re-suspension (maximum allowable levels
for water quality and released contaminants), may be a part of dredging
regulations established in consultation with stakeholders, or by federal acts
and regulatory agencies.
The USACE recommends drafting a comprehensive monitoring plan that
includes equipment and techniques to use, protocols for sampling, where
to place sampling devices and details about how to interpret the monitoring data. Furthermore, the guidelines suggest creating a management plan
that describes the specific actions to be taken based on the results of the
monitoring. This may include increasing monitoring locations/sampling frequency to further assess impacts, implementing operational controls (i.e.,
stopping or slowing down dredge work), altering debris management or
changing equipment. To this end, the USACE technical guidelines advise
incorporating real-time feedback on re-suspension into the monitoring plan
to make early identification of problems possible. The most rapid and efficient management responses are achievable with this real-time data.
A REAL-TIME
SOLUTION
Measuring Turbidity
Measuring total suspended solids (TSS) directly is the
best method for evaluating sediment concentrations.
However, it is not feasible for real-time applications
such as monitoring sediment re-suspension during
dredging operations. At present, TSS can only be
accurately measured by collecting water samples and
conducting laboratory tests, which require filtering
the sediment from the water, drying and weighing it.
This procedure is too time-consuming for monitoring
dredge sites, considering the quick feedback required
to allow timely control measures. This is particularly
true in cases when the dredged sediment contains
contaminants that pose an added risk to wildlife and
people. To achieve this real-time monitoring, turbidity,
a measure of water clarity, is substituted for TSS.
Turbidity data can be substituted for total suspended solids because it is
an indirect measure of the particle density in the water. When monitoring
dredging operations, turbidity readings can approximate levels of re-suspension and indicate the likelihood of released contaminants in real time.
As an optical measurement, turbidity monitoring requires a light source and
a photodetector.
The light source in the instrument generates an incident light beam, which
is scattered in all directions by particles in the water. The more particles
present in the water, the more the light will scatter. A photodetector is set
up to measure the amount of light scattered at a specified angle. Most turbidity instruments use nephelometry, which requires a 90-degree angle for
measurement. This is considered the most accurate method and is approved
by both the Environmental Protection Agency (EPA) and International Organization for Standardization (ISO) quality design standards. Other detector
angles, such as backscatter, can provide useful data but they are not considered approved methods.
Real-time turbidity data are achieved with the use of a dynamic turbidity
instrument, also known as a turbidity sensor. These sensors are submerged
in a body of water for continuous turbidity monitoring. Turbidity meters,
on the other hand, use a water sample instead of measuring in the water
directly. This means they cannot be used in-situ for real-time data. While turbidity meters can be used to check data quality, they are not recommended
as primary monitoring sources for dredging applications.
Most turbidity sensors are connected to a buoy-based sonde or a data logger
for recording data. This is the preferred turbidity monitoring method by the
U. S. Geological Survey, as in-situ measurements more accurately represent
surface water conditions than sampling methods. In addition, the real-time
availability of data from submersible sensors improves control measure
response times when turbidity levels change.
SAMPLE
LIGHT BEAM
TRANSMITTED
LIGHT
90°
APERTURE
SCATTERED
LIGHT
LENS
DETECTOR
2
MONI TO RING TURBI DI T Y
Turbidity sensors can use nephelometric (90 degree) or backscatter (>90
degree) technology to measure the amount of light scattered by particles in
water. The sensor is designed with two optical windows, generally located
on the same flat surface of the sensor. The light source and the photodetector are located below the optical windows, and are tilted to achieve the
desired scattered-light angle. The single flat surface means that a turbidity
sensor can be wiped, or cleaned remotely, during a deployment. Regularly
wiping the sensor windows prevents fouling (attachment of inorganic material such as silt or biological material such as algae or barnacles). Wipers can
be built into the sensor, or attached to a separate brushing mechanism.
Fouling on the sensor windows can yield artificially high turbidity readings
as the material can block light from entering the water or from returning
to the detector.
The solution to all of these variables is in the turbidity unit. The USGS and
ASTM have developed a list of ten different turbidity units, each intended
for use with a specific instrument design. As turbidity instrument designs
vary by light source and measurement angle, these factors will determine
which units should be used. If the light source or the angle changes, so will
the recommended unit. Three of these units are commonly used in dredge
turbidity monitoring, listed at the bottom of this page.
Each instrument design has its own designated unit, and the misappropriation of turbidity units, particularly NTU, diminishes their accuracy and usefulness. Unfortunately, most turbidity data in the U.S. have been reported in
NTUs over the past two decades, regardless of their light source or detector geometry. The USGS’s revised turbidity protocol (2004) is working to
improve the comparability of turbidity data by requiring that reported units
match the instrument design.
As mentioned earlier, the U.S. Environmental Protection Agency (USEPA) and
the International Organization for Standardization (ISO) have established
specific requirements for turbidity instrument designs. The quality design
standards are known as EPA Method 180.1 and ISO 7027. As the EPA Method
180.1 requires a tungsten lamp light source and a 90-degree measurement
angle, it falls under the nephelometric, white-light turbidimeter category.
Thus, instruments in compliance with EPA Method 180.1 report in NTU:
Nephelometric Turbidity Units.
Turbidity Units and Reporting
Thanks to the multitude of instrument designs, turbidity reporting can
quickly become confusing. There is also a large amount of misinformation
regarding approved standard compliance and which turbidity units should
be used in reporting. Turbidity units are only useful and accurate if they are
reported correctly – with correspondence to a specific instrument design.
On their own, turbidity units (including NTU and FNU) have no inherent
value, physical or otherwise. They are a qualitative, rather than a quantitative, measurement.
Turbidity, and thus particle density, is a function of the amount of light that
is scattered at specific angles. However, the physical properties of these
particles – shape, color and distribution – can affect the measurement. This
means that two water samples with the same level of suspended solids but
with varying particle compositions could result in different turbidity readings. In addition, longer and shorter light wavelengths interact with and
reflect off of particles in different ways. This means that two instruments with
different light sources may not measure the same level of turbidity in the
same water sample. Finally, the measurement angle within an instrument
is only accurate within a specific turbidity range. Some angles are accurate
for lower turbidity levels, while others are intended for very high measurements.
ISO 7027 requires a near-infrared LED light source and a nephelometric measurement angle, so instruments in compliance with this design report in
FNU: Formazin Nephelometric Units. Formazin is the recommended calibration standard for many of these instruments. The third well-known design is
not compliant with any approved design standards. Instruments that follow
the backscatter, near-IR turbidimeter design should report in FBU: Formazin
Backscatter Units.
Most submersible turbidity sensors use a near-infrared LED light source due
to the low power draw, and thus should report in FNU or FBU. Turbidity
meters (used for data quality assurance) may contain a white light (400-680)
instead of a near infrared light. These instruments report in NTU.
Common Turbidity Monitoring Instrument Design
Unit
Nephelometric white-light turbidimeter
NTU
Nephelometric near-IR turbidimeter
FNU
Backscatter, near-IR turbidimeter
FBU
F ON DR IE ST.COM
3
TURBIDITY
TECHNOLOGY
Nephelometry
Regardless of the sensor chosen, it is important to
use the same sensor model throughout a project for
internally consistent data. While inter-instrument relationship models can be developed, data from different
instrument designs are not directly comparable. Each
sensor will read varying amounts of light scatter from
suspended particles due to the differences in light
source and measurement angle. In turn, the sensors
will output varying results despite measuring the
same water sample. In addition to cost considerations,
sensor choice should be based on expected or potential turbidity readings (low, high or a wide range), and
whether or not compliant and comparable data would
be useful.
Most nephelometric turbidity sensors comply with ISO 7027 guidelines.
While other sensor designs exist, compliance with ISO 7027 ensures accurate and comparable turbidity readings. In addition to the high sensitivity,
the relationship between nephelometric light scatter and particle density is
fairly linear. However, it becomes non-linear above 40 NTU and inaccurate at
higher turbidities. To account for this, some sensors offer a secondary algorithm for measurements over 1000 NTU. This yields less precise readings, but
the accuracy is improved over non-adjusted nephelometric sensors.
Nephelometry is a measurement method with a light source and a photodetector set at a 90-degree angle from each other. This is the angle that is most
sensitive to light scatter as it is not affected by particle size.
signal reaching the detector
NEPHELOMETRIC (90°) scatter detector
backscatter detector
0
2000
4000
6000
8000
10000
TURBIDITY (NTU)
from the incident light). At this time, no current design standard has been set
for these sensors. As such, any scattered light detection centered between
90-180 degrees from the transmitted light can be accepted as a backscatter
sensor. Without a standardized quality guide for these instruments, any data
received are not comparable to any other instrument.
Method Compliance
Many turbidity monitoring projects want data to be EPA compliant. However,
no true, EPA 180.1 compliant submersible turbidity sensors exist. For in-situ
monitoring, the USGS instead recommends ISO 7027 compliant sensors.
The requirement of a tungsten lamp light source makes any dynamic EPA
Method 180.1 instrumentation impractical. Tungsten lamps have a high
power draw, require warm-up time and have an energy output that deteriorates with age. This means that instruments in compliance with this method
will require frequent calibrations and bulb replacements. While this is simple
enough with a handheld meter, it becomes impractical in a submersible
sensor.
On the other hand, LED light sources are compact and have a smaller power
draw. LEDs also have a longer lifetime than tungsten lamps, no warm-up
period and they can be modulated to reject ambient light. Modulating,
or rapidly pulsing, a light source reduces errors due to ambient light. This
makes LED light sources ideal for long-term deployments. However, sensors
with an LED light source should be compensated for temperature. While
turbidity itself is not affected by temperature, the LED is. Changes in the
internal temperature will affect the optical power output of the LED. As temperature increases, output intensity (brightness) will decrease, which in turn
affects the measured turbidity reading. Some turbidity sensors include an
1.04
A backscatter sensor uses a photodetector centered past the 90-degree
angle (90-180 degrees from the transmitted light). Backscatter sensors have
several advantages: 1) a wide measurement range; 2) improved accuracy
at higher turbidities (over 1000 NTU); 3) a tolerance for a varying particle
sizes. Between 1000-4000 NTU, backscatter technology is nearly perfectly
linear. However, during periods of low turbidity, a backscatter sensor will not
be as accurate as a nephelometric instrument. Backscatter sensors are also
more prone to color interference due to particle darkness value (the ability
to reflect near-IR bands).
The largest disadvantage for backscatter sensors, however, is the lack of
comparability. The USGS and several backscatter sensor manufacturers have
attempted to define appropriate backscatter angles (e.g. 135-180 degrees
4
MONI TO RING TURBI DI T Y
NORMALIZED TURBIDITY OUTPUT
Backscatter
NOT TEMPERATURE COMPENSATED
1.03
TEMPERATURE COMPENSATED
1.02
1.01
1
In addition to the longevity and stability of an LED light source, near-infrared
LEDs (780-900 nm) offer further advantages by reducing color interference.
Near-infrared wavelengths are less likely to be absorbed by particles in the
water, and thus will have a lower error value than broadband light (which
can be partially absorbed). This means that colored dissolved material in
the water, such as a dye or humic stain, will not affect ISO 7027 compliant sensors. White/Broadband light instruments however, (including EPA
Method 180.1 turbidity meters) will be affected if color is present.
Due to the advantages of a near-infrared LED, most nephelometric turbidity
sensors follow ISO 7027 guidelines. While other designs, including backscatter, also use a near-infrared LED, ISO 7027 compliance ensures accurate and
comparable turbidity data.
NTU and mg/L: Unit Conversions
For relation to an EPA-approved method (measurements in NTU), an EPAapproved turbidity meter can be used to spot sample at regular intervals for
quality assurance of the sensor data. These data can then be used establish a
correlation between the sensor data and the EPA-approved data. However,
a calculated model between data sets is only valid for the location where
measurements were taken. At other locations, suspended particles may vary
in size, material and distribution, and any constructed conversion will no
longer be accurate.
60
fnu
50
ntu
40
30
20
10
0
10
20
30
40
50
60
70
site number
0.09
0.08
0.07
0.06
internal thermistor to compensate for these effects, while others offer the
ability to make adjustments in the software. For sensors that do not compensate for temperature, a minor drift can be seen in the turbidity readings
as the temperature of the LED rises.
TURBIDITY (FNU, NTU)
The most commonly used turbidity monitoring
systems will use a submersible sensor to monitor
for sediment re-suspension. These turbidity sensors
can use nephelometry or backscatter technology to
measure the amount of light scattered by particles in
the water.
28
30
32
34
36
38
40
TEMPERATURE (°C)
42
44
46
Likewise, models can be created to calculate total suspended solids from
turbidity. TSS samples will need to be collected and measured to establish
a relationship between turbidity and suspended solids. In most situations, a
relationship is derived though a single or multiple linear regression model.
Once a regression model has been approved, it can be used to predict TSS
concentrations.
F ON DR IE ST.COM
5
TYPICAL TURBIDITY
MONITORING SYSTEM
Telemetry
Telemetry provides access to data in real time.
The wireless communication can be radio-toshore, cellular or satellite based.
When dredging, it is necessary to monitor sediment
re-suspension levels to prevent damage to the local
ecosystem and minimize the spread of contaminants.
This is usually done with a turbidity monitoring station
upstream (for background data) and two stations
downstream (at locations affected by the dredging).
To be effective, measurement data should be provided
in real time. The easiest and most efficient way to do
this is with a buoy-based turbidity monitoring system.
A data buoy can house sensors at multiple depths in
the deepest part of the waterway, providing more
comprehensive data than a shore-based system. This
system can then securely transmit the data to the
Internet in real time for access from any computer.
Buoy systems are flexible and customizable based on
the dredging project requirements. They can house
as many sensors as needed, and all equipment is
powered via a marine battery and recharging solar
panel system. With multiple telemetry options to
choose from, continuous real-time data are available
from any computer. This ensures that the dredging
operations progress smoothly, and any control measures can be implemented immediately if parameter
limits are exceeded.
Dredge
Dredges are excavators used to
remove contaminated sediment
from the water. They can be
hydraulic, mechanical or a hybrid.
Most are mounted on a spud
barge. An additional barge may be
needed for sediment disposal.
Data Buoy
Live Data
A data buoy is a floating platform
that supports real-time monitoring
instruments such as sensors and data
loggers. In addition to housing the
monitoring equipment, the buoy
supplies all power and can transmit
sensor data in real time.
24/7 instant access to project data
is available through a cloud-based
datacenter. Monitoring data can be
viewed in real time, or as a graph to see
trends. Real-time automated alerts can
be sent via text or email when turbidity
levels exceed pre-defined limits.
Turbidity Sensor
Turbidity data are substituted
for TSS as it can be measured
instantaneously. Most turbidity
sensors are compliant with ISO 7027
and have a wiper to prevent fouling.
Sensors can hang at multiple levels in
the water column, alone or in a multiparameter sonde.
6
MONI TO RING TURBI DI T Y
Mooring Hardware
Data buoys can be anchored with a
single or two-point mooring based on
application requirements.
F ON DR IE ST.COM
7
POINTS OF
COMPLIANCE
Where turbidity monitoring systems should be located
will depend largely on the site conditions of the
dredging project. The number of monitoring locations required for a dredging operation can vary, but
a common monitoring setup relies on three measurement locations. The chosen measurement locations
are known as points of compliance. At these points,
the USACE suggests using stationary or towed turbidity sensors in conjunction with water column sampling.
Selecting the Location
Buoy Mooring
As suggested by the name, stationary systems are set at fixed locations.
These systems can be placed on structure or on an anchored buoy in the
water. Seawalls are a common example of a structure that can be used, as
turbidity monitoring sensors can be mounted in a perforated PVC pipe along
the seawall. However, site conditions often make it difficult or impractical to
mount the monitoring equipment along the shore. In addition, relying solely
on shoreline solutions may not accurately represent re-suspension levels and
sediment transport due to the nature of water currents. For these reasons,
buoy-based systems offer the most comprehensive and cost-effective solution. Data buoys provide a stable platform for turbidity monitoring, with the
ability to house multiple sensors at different depths in the water column.
In addition, they can carry a data logger, solar-powered battery pack, and
telemetry (wireless communications) systems for extended deployments.
A buoy-based system must be moored to ensure that it remains stationary.
The buoy is usually moored via a stainless steel mooring line, bottom chain
and anchor. It is recommended to moor the buoy in the deepest part of
the waterway to ensure the most inclusive measurements. This allows for
multiple measurement depths and will best reflect the characteristics of
the water body as a whole.
Anchored buoys are usually located both up and downstream of the dredging operation. The downstream buoy(s) measure re-suspended sediment
and sediment transport in areas at risk, while the upstream (and off-site)
buoy serves as a control for suitable turbidity levels. These buoys can come
in different sizes based on the environmental conditions and the number
of sensors suspended from the buoy. Data buoys with 150- to 450-lb. net
buoyancy are generally adequate for monitoring projects on rivers, inland
lakes and protected waters. Larger platforms may be required in coastal
and Great Lakes deployments that are subject to more extreme conditions
and wave action.
Towed sensors are known as “floating” points of compliance, as they move
with the dredging operation. While these can be attached directly to the
dredging equipment, they can also be deployed on a buoy system a set
distance away from the dredge location. The buoy systems then move with
the dredge as the project progresses, remaining the same distance away
from the active dredging site.
Pre-Deployment
For accurate data, all sensors should be calibrated shortly before the project
begins. If using a buoy-based system, the platforms should be fully assembled on shore prior to deployment. This includes attaching any sensors,
towers, solar panels and additional ballast weights if needed. Furthermore,
the complete turbidity monitoring system (sensors, data logger, telemetry,
software) should be tested before the buoy is put in the water. While this
process ensures that all equipment is functioning within specifications, it
also gives everyone the chance to familiarize themselves with the system
prior to deployment. Issues are always easier to deal with before the buoy
platform is deployed in the water.
8
MONI TO RING TURBI DI T Y
Buoy-based systems are typically moored as either a single-point or twopoint mooring, based on environmental and application-specific factors.
Single-Point Mooring
Single-point moorings are not common, but they require the least amount
of mooring equipment. This setup can be deployed in very calm waters with
minimal instruments. A single-point mooring should only be used when all
sensors and equipment are housed within an instrument cage or deployment pipe. Hanging sensors risk getting damaged or entangled with the
anchor line. A cage or pipe protects the instruments from entanglement,
subsurface debris and currents without affecting sensor readings.
In a single-point configuration, a mooring line connects the buoy directly to
a bottom chain and anchor. The sensors are typically housed within a central
deployment pipe or attached to a rigid instrument cage. The anchor, bottom
chain and mooring line are assembled and attached to the buoy prior to
deploying the system.
Two-Point Mooring
Two-point moorings are the most common deployment configuration. This
is the recommended setup if sensors will be hanging at multiple depths
in the water column. In a two-point setup, the mooring lines are pulled
away from the data buoy by two smaller marker buoys. This configuration
leaves the water column below the buoy available for sensors, without risk
of entanglement with anchor lines. It also offers greater stability if there are
currents or wave action at the location.
A two-point mooring requires a larger deployment area than a single-point
mooring, as the marker buoys are typically set about ten feet away from the
data buoy. Additional mooring lines run from the marker buoys to bottom
chains and anchors at the seafloor. The increased system stability from the
two anchor setup is well worth the extra equipment, as is the expanded area
for hanging sensors. If there is significant subsurface debris or other risks
present, deployment pipes or instrument cages can still be used.
F ON DR IE ST.COM
9
DATA
MANAGEMENT
A major part of any monitoring project is collecting and accessing the data. While it is possible to
simply record measurements onsite, the ability to
log, send and view monitoring data in real time is
far more efficient.
Data Logger
As the name implies, a data logger is an instrument that stores data. In environmental monitoring applications, data loggers can be used not only to
collect data from sensors and sondes, but to control sampling rates and
transmit data to a central location in real time.
While sondes often have the ability to log their own data, a separate, dedicated data logger can gather data from any and all attached sensors, while
ensuring that no data are lost. If telemetry (wireless communication) is available, the logger can remotely control sensor sampling rates and transmit
collected data to a central project computer. Data loggers with telemetry
technology can provide real-time turbidity data and remote access via a
cellular modem, radio transmission or satellite modem.
When housed in a data buoy, a data logger is charged by the buoy’s solar
power system. If a solar panel system or external battery is not available,
the logger can be self-powered using alkaline batteries. Data loggers can
be configured with a number of sensor ports for connection to industrystandard digital and analog interfaces, including RS-485, SDI-12 or 0-2.5
VDC. Turbidity sensors can connect to a logger directly or through a multiparameter sonde. A data logger can also handle additional water quality
sensors, temperature strings or Doppler velocity meters if they are required
for the dredging application.
Telemetry
Telemetry, or wireless communication, is a useful tool for monitoring turbidity in real time. Common telemetry options are cellular and radio, though
satellite telemetry can be used in more remote locations. The deciding factor
when determining the most cost-effective telemetry option should be the
local site conditions and proximity to a project computer. All three of these
options permit real-time updates regarding water quality during a dredging operation.
Radio telemetry is recommended when all equipment is in close proximity. If
equipped with a license-free spread-spectrum radio, a data logger can communicate with a shore-side radio base station. This range may vary depending on the logger and base station used. Spread-spectrum radio technology
may allow a range as far as five miles (line-of-sight) or a few hundred feet
(non-line-of-sight). The radio base station serves as a central hub for any
buoy-based data logger in range, with the ability to send the collected data
to a project computer.
Cellular telemetry offers more geographic flexibility than radio, though it
does require a cellular data plan. This small, additional cost permits data
transmissions from anywhere that receives a cellular signal. With cellular
10
MONI TO RING TURBI DI T Y
telemetry, monitoring stations do not need to be in close proximity, nor is a
shore-side base station required. Instead, all the data can be accessed wirelessly via the Internet. Data loggers may be equipped with cellular modems
from different providers, including AT&T, Verizon and Sprint.
For remote applications where radio and cellular telemetry are not feasible,
satellite telemetry can be used. The Iridium communications network maintains a dynamic, cross-linked constellation of Low Earth Orbiting (LEO) satellites, providing coverage all over the world. This means that data loggers
with an Iridium satellite modem can transmit data in real time from anywhere on Earth. As with cellular networks, the data are sent to a central
gateway, which then transfers the data over the Internet to any project
computer or cell phone.
Real-Time Online Datacenter
The easiest way to share and view turbidity monitoring data is through a
web-based datacenter. An online datacenter offers 24/7 instant access to
project data via any web browser. Turbidity monitoring and other data can
be exported into the datacenter directly from the data logger, or through
the project software.
This project management service can be password protected or public, and
allows users access to the collected data in real time. In addition to any
dredging-specific information, the online interface can provide dynamic
area maps, overlaid with weather information, recent and historical data,
time series graphs and statistical summaries. Visitors can interact with the
project maps and view real-time monitoring data or turbidity level trends
over time.
But these cloud-based datacenters are more than just a pretty face. Many
can be programmed to send out automated alarm notifications when turbidity levels exceed pre-defined limits. These limits are determined by collecting background data prior to dredging using spot-sampling equipment.
Once an allowable turbidity range has been set, the data are entered into the
online database. If turbidity levels exceed this recommended range during
dredging operations, the datacenter will immediately issue an alert (text
and/or email) to the appropriate project manager or operator.
With the availability of real-time data and the datacenter’s auto-alert system,
dredge operators can be notified immediately when turbidity levels rise. This
means that timely control procedures can be implemented to slow down,
alter or stop the dredging operation until levels fall below the maximum
allowable limit. The online datacenter can also transmit this alert back to the
data logger in order to respond to the exceeded turbidity range. Automated
responses may include taking more frequent readings during high turbidity
periods, then resuming regular log intervals when levels return to normal.
F ON DR IE ST.COM
11
QUALITY
ASSURANCE
Accurate data ensure that dredging operations
remain in compliance with set regulations. To maintain that accuracy and keep equipment functioning within specifications, best practice recommends
cleaning and calibrating the instruments at regular
intervals. It is also recommended to cross-check
sensor accuracy against a separate instrument. This
cross-checked data can then be used to show compliance against an EPA approved method, if needed.
System Maintenance
Performance Verification
Regardless of the turbidity equipment chosen to monitor a dredging site,
periodic maintenance and calibration is required. Instrument maintentence
includes cleaning the instruments (especially if a sensor is not self-wiping),
and replacing any deteriorating o-rings to prevent water ingress. If using
additional parameter sensors (such as conductivity), further field servicing
may be required. Maintenance intervals are largely dependent on site conditions and other variables, such as the potential for biofouling. Common
calibration and maintenance intervals are on a weekly or bi-weekly basis.
In addition to keeping turbidity equipment calibrated, it’s important to periodically verify that the sensors are providing accurate turbidity data. The
best way to achieve this is by checking turbidity in the same area using a
separate, portable monitoring system. This is also known as spot sampling.
Turbidity sensors usually require a two-point calibration — one at 0 NTU/
FNU and another at a higher turbidity value (often 126 NTU/124 FNU). The 0
NTU value can be obtained using de-ionized water, though 0 NTU/FNU standard solutions do exist. The high range calibration should use an approved
standard such as a commercial or prepared Formazin, or commercial AMCOAEPA standards. For greater accuracy and a wider range, turbidity sensors
can follow a three-point calibration (e.g. 0 NTU, 100 NTU and 1000 NTU).
Regardless of the number of points used, it is important to always include
0 NTU/FNU as the first point. For best results, use only freshly prepared or
purchased turbidity standard, as they degrade over time. Any diluted standard should only be used on the day it is made.
In case of sensor failure or damage, it is useful to have spare sensors or
sondes on hand. These can be field swapped during calibration or routine
maintenance checks. Having a spare turbidity sensor available will reduce
downtime due to unforeseen sensor failure, which could cause critical and
costly interruptions to safe dredging operations.
There are two portable turbidity measurement methods available for spot
sampling. The first method uses a sensor (much like the one used in the
buoy-based monitoring system) and a handheld display. The turbidity
sensor can be attached directly to a handheld display or through a sonde
to the display to show real-time data. Sondes are useful instruments if
other parameters, such as pH, dissolved oxygen or conductivity should be
recorded as well. The sonde or sensor can be lowered into the water column
to a depth that matches the in-place sensors. While it is at that depth, a
turbidity measurement can be taken. The data from this portable system
can then be compared to the in-place monitoring system and checked for
discrepancies. As with the buoy-based system, this method reports in FNU
or FBU based on the sensor used. While FNU readings are approved by ISO
7027, neither option is approved by the EPA.
The second method uses a handheld turbidity meter. This method requires
taking a water sample, and then inserting it into the meter for a reading. As
this method uses a sample instead of an in-situ measurement, it is often not
representative of the surface water as a whole. This is especially a hindrance
when quality checking monitoring systems that measure turbidity at multiple depths along the water column. While handheld meters are not submersible, many styles are compliant with EPA method 180.1. This means that
the long-term data can be cross-checked against an EPA-approved method.
However, while correlations can be made between data sets, care should
be taken when comparing data between the meter and the buoy-based
monitoring system. Turbidity instruments are inherently not comparable,
and comparative models are only accurate for the specific sample location.
For greater details regarding maintenance requirements and sensor calibration, the manufacturer’s user manual should be referenced.
12
MONI TO RING TURBI DI T Y
F ON DR IE ST.COM
13
RECOMMENDED
EQUIPMENT
While there are plenty of turbidity monitoring
instruments on the market, some stand out above
the rest. Fondriest Environmental has selected these
products as the best in their field for their quality,
reliability and value. Together, they provide an
advanced and powerful real-time turbidity monitoring system. For a sensor or sonde, accuracy is
of utmost importance and the YSI EXO2 does not
disappoint. The rugged NexSens CB-450 offers
long-term durability with 30 W of solar power, 450
pounds of buoyancy and a choice of instrument
mounts for multiple sensors. Alone, real-time data
are good, but with remote data collection, 24/7
access from any computer, instant alarm notifications and trend tracking, the intuitive WQData Live
takes real-time data to the next level.
YSI EXO2 Multi-Parameter Sonde
NexSens CB-450 Data Buoy
The YSI EXO represents the next generation of water quality instruments
from YSI. The advanced sonde platform offers a wide range of capabilities to those dedicated to monitoring natural aquatic environments such
as oceans, estuaries, rivers, lakes and groundwater. With a highly efficient
power management platform, robust construction and chemistry free
anti-fouling system, EXO allows accurate data collection for up to 90 days
between service intervals.
The NexSens CB-450 Data Buoy is designed for deployment in lakes, rivers,
coastal waters, harbors, estuaries and other freshwater or marine environments. The floating platform supports both topside and subsurface environmental monitoring sensors including weather stations, wave sensors,
thermistor strings, multi-parameter sondes, Doppler current profilers and
other monitoring instruments.
The EXO2 sonde includes six sensor ports and a central anti-fouling wiper
option. Sensor parameters include temperature, conductivity, depth, dissolved oxygen, pH, ORP, total algae (phycocyanin and chlorophyll), turbidity
and fluorescent dissolved organic matter (fDOM). The sonde can also output
4 calculated parameters including salinity, specific conductance, total dissolved solids (TDS) and total suspended solids (TSS).
All EXO sensors are digital sensors with onboard signal processing and
memory. Built-in sensor diagnostic and calibration data allow users to calibrate multiple sensors in one sonde and distribute to various other sondes
in the field. Wet-mateable connectors allow for swaps in wet conditions,
while active port monitoring automatically detects each sensor and verifies operation.
The buoy is constructed of an inner core of cross-linked polyethylene foam
with a tough polyurea skin. A topside 20” tall stainless steel tower includes
three 10-watt 12VDC unbreakable solar panels, and a center 10” ID x 18” tall
instrument well accommodates batteries, data loggers, sensors and more.
Three 4” pass-through holes with female
NPT bottom threads allow for quick
connection of instrument deployment
pipes and custom sensor mounts.
The stainless steel frame supports
both single-point and multi-point
moorings.
The CB-450 Data Buoy is
optimized for use with
NexSens data loggers.
Wireless telemetr y
options include Wi-Fi,
spread spectrum radio,
cellular and Iridium
satellite. Compatible
digital and analog sensor
interfaces include RS-232,
RS-485, SDI-12, VDC, mA and
pulse count. The top of the instrument well includes 8 pass-through
ports for power and sensor interface.
Each port offers a UW receptacle with
double O-ring seal for a reliable waterproof
connection.
NexSens WQData LIVE Web Datacenter
WQData LIVE is a web-based project management service that allows users
24/7 instant access to data collected from NexSens remote environmental data logging & telemetry systems. More than just an online database,
WQData LIVE offers the ability to generate automated reports, configure
alarms to notify project personnel when data values exceed threshold limits,
create FieldBooks to store calibration forms, notes and media and much
more. Projects are password protected with the ability to configure a public
portal or presentation view to share data with the general public. Project
Administrators have the ability to edit project descriptions and information, while users given Collaborator access are limited to data viewing and
form entry.
The Google Maps view shows all project sites on a map with zoom, scroll
and drag capability. Mousing over a site on the map displays the most recent
data values, and clicking on the site navigates to a display showing the last
reading or tabular data that can be downloaded to Excel and sent via email
or FTP. FieldBooks can be created to store notes recorded during field visits,
including forms to store calibration data, which can be submitted from the
WQData LIVE mobile app. This eliminates the need for conventional fieldbooks while keeping critical project information in a single, easy-to-access
location. Site photos can even be placed onto FieldBook pages or uploaded
into the project’s Media page.
The WQData LIVE report feature allows data to be shown both graphically
and in a tabular format. Report templates can be saved so that specific
information can quickly be referenced. Project alarms send email or text
messages to project staff for immediate notification of critical conditions.
With this unique set of features, WQData LIVE provides everything needed
to effectively manage an environmental monitoring application.
14
MONI TO RING TURBI DI T Y
F ON DR IE ST.COM
15
PURCHASE
OR RENT?
ABOUT
FONDRIEST
When managing a large or long-term dredging
project, purchasing several turbidity monitoring systems is often the most economical option.
However, for short-term dredging projects on a
tight budget, it may not be practical to purchase the
necessary turbidity monitoring equipment. In these
situations, it is much more prudent to rent real-time
monitoring systems. With several lease duration and
extension options available, the flexibility of renting
turbidity monitoring systems may still be cost-effective for the larger dredging applications as well.
Company
Turbidity monitoring equipment can be rented
instrument by instrument, or as an entire system,
calibrated and ready to deploy on arrival. Rental
equipment can include sensors, sondes, handheld
displays, data buoys and web-based datacenter
access. Real-time telemetry via radio-to-shore, cellular and satellite can also be incorporated. A large
rental pool also means that most turbidity monitoring equipment can be shipped same-day for quick
deployment and emergency situations.
We work closely with NexSens Technology, a company that specializes in the
design and manufacture of real-time environmental measurement systems.
A variety of sensor, platform and telemetry options are available to fit the
unique needs of each project. We can provide complete integrated solutions
and support projects from conception to completion. An extensive fleet of
rental equipment is also available for short-term project needs.
Just as with Fondriest purchases, rental projects
have access to a knowledgeable support staff who
will provide personalized service before, during and
after the project.
Located in the Lower Great Lakes and Ohio River Valley region, Fondriest
Environmental is a leading distributor and integrator of equipment for
natural resource professionals and outdoor enthusiasts. Our team of specialists can help customers understand the products they are buying and
make the correct decisions out in the field. We seek to understand project
needs, devise a comprehensive solution, provide the equipment and knowhow to implement it and then offer long-term project support for whatever
needs arise.
Capabilities
Certifications
Fondriest Environmental is a Certified Repair Center for YSI, NexSens & FishSens, offering quick turnaround, affordable labor rates and personalized
service. Our knowledgeable technicians are available for phone, email and
onsite support when the need arises.
Publications
We cover many customer projects in our Environmental Monitor magazine,
which is updated daily online and printed quarterly. We also produce Lake
Scientist, an interactive online resource providing research articles and
news on lake ecology. Informational pages on environmental parameters
and applications are available in the Measurement Sciences section of our
website. And FishSens Magazine, available online, provides anglers, boaters
and fisheries professionals with the latest fish science news.
Commitment
Fondriest Environmental, Inc.
2091 Exchange Court
Fairborn, OH 45324
tel: 888.426.2151
fax: 937.426.1125
[email protected]
16
MONI TO RING TURBI DI T Y
A commitment to integrity and longstanding customer relations are the
standard, rather than the exception, at Fondriest Environmental. We support
professionals, educators and researchers who continuously work to monitor
and protect our global resources by providing them with the products and
services needed to face today’s environmental challenges. Our team of solution-driven experts has years of field experience and a keen eye for finding
the best equipment for each application.
Contact Information
To reach an application specialist, please call (888) 426.2151 or email
[email protected]
F ON DR IE ST.COM
17
SYSTEM CONFIGURATION TOOL
Site Location
Fondriest application specialists will assist with tailoring buoy configuration and equipment
choices on a site-by-site basis to ensure reliability and proper data management. The questionnaire below can help you get started. Once completed, this form can be faxed to (937)
426.1125 or, if completed digitally, emailed to [email protected].
The location of a monitoring system can affect what buoy configuration best suits the conditions. Please select in what type of water body the system
will reside.
Contact Information
Approximate Depth
Name:
The mooring hardware and cable lengths used for a deployment depends on the distance to the sea floor. An application specialist can develop the
best mooring plan to accomodate the approximate water depth.
Organization:
Telephone:
Email:
Site Conditions
Lake
< 5 ft.
River
Coastal
Other
Between 5 and 25 ft.
Please Specify
Between 25 and 50 ft.
Between 50 and 100 ft.
> 100 ft.
Water Column Measurements
Measuring turbidity at a single mid-level depth is often sufficient for dredge monitoring. In some cases, however, regulatory agencies may require
readings at multiple depths.
Single Depth
Multiple Depths
Please Specify
Describe the site conditions in a paragraph or two. Please include details regarding levels of wind, waves and boat traffic experienced in the area.
Telemetry
License-free spread-spectrum radio telemetry allows communication with a shore-side NexSens radio base station as far as five miles line-of-sight from
the monitoring site. Cellular telemetry allows greater geographic flexibility and is able to transmit from almost anywhere in the U.S., but it includes
the cost of a cellular data plan. Satellite telemetry can be used nearly anywhere in the world, but it tends to have the highest data cost compared with
cellular telemetry.
Cellular
Radio
Satellite
None
Quality Assurance
A multi-parameter sonde with turbidity sensor connected to a handheld display is an ideal way to verify the accuracy of a turbidity monitoring system
and uses the ISO 7027 method. Alternatively, there are portable turbidimeters that can measure using the EPA-approved 180.1 method.
Multi-parameter sonde & handheld display (ISO 7027 Method)
Portable turbidimeter (EPA 180.1 Method)
Project Length (Rental vs. Purchase)
Although it often makes sense to purchase systems outright, many short-term dredging projects make it cost-prohibitive. Fondriest Environmental
offers real-time turbidity monitoring systems with weekly and monthly rental rates to accommodate these operations. An application specialist can
make recommendations on what choice is most cost-effective.
1-3 Months
18
MONI TO RING TURBI DI T Y
3-6 Months
6-12 Months
>1 Year Please Specify
F ON DR IE ST.COM
19
when your
research
demands
quality data
PRSRT STD
US POSTAGE
PAID
DAYTON, OH
PERMIT# 860
Fondriest Environmental, Inc.
2091 Exchange Court
Fairborn, OH 45324
P 888.426.2151
F 937.426.1125
E [email protected]
TAKE YOUR PROJECT TO THE NEXT LEVEL.
CONTACT A FONDRIEST APPLICATION SPECIALIST
888.426.2151