1
Monitoring Unix and Windows
Servers
eG Enterprise 6
Restricted Rights Legend
The information contained in this document is confidential and subject to change without notice. No part of this
document may be reproduced or disclosed to others without the prior permission of eG Innovations Inc. eG
Innovations Inc. makes no warranty of any kind with regard to the software and documentation, including, but not
limited to, the implied warranties of merchantability and fitness for a particular purpose.
Trademarks
Microsoft Windows, Windows NT, Windows 2000, Windows 2003 and Windows 2008 are either registered trademarks
or trademarks of Microsoft Corporation in United States and/or other countries.
The names of actual companies and products mentioned herein may be the trademarks of their respective owners.
Copyright
©2014 eG Innovations Inc. All rights reserved.
Table of Contents
INTRODUCTION .................................................................................................................................................................................... 1
MONITORING UNIX SERVERS......................................................................................................................................................... 5
2.1
Monitoring Linux Servers ......................................................................................................................................................... 6
2.1.1
The Operating System Layer ............................................................................................................................................ 6
2.1.2
The Network Layer ......................................................................................................................................................... 60
2.1.3
The Tcp Layer.................................................................................................................................................................. 63
2.1.4
The Udp Layer ................................................................................................................................................................. 69
2.1.5
The Application Processes Layer ................................................................................................................................... 70
2.2
Monitoring Solaris Servers ..................................................................................................................................................... 96
2.2.1
The Operating System Layer .......................................................................................................................................... 96
2.2.2
The Network Layer ....................................................................................................................................................... 112
2.2.3
The Tcp Layer................................................................................................................................................................ 112
2.2.4
The Application Processes Layer ................................................................................................................................. 113
2.3
Monitoring AIX Servers........................................................................................................................................................ 113
2.3.1
The Operating System Layer ........................................................................................................................................ 114
2.3.2
The Network Layer ....................................................................................................................................................... 123
2.3.3
The Tcp Layer................................................................................................................................................................ 123
2.3.4
The Application Processes Layer ................................................................................................................................. 124
2.4
Monitoring HPUX Servers .................................................................................................................................................... 131
2.4.1
The Operating System Layer ........................................................................................................................................ 131
2.4.2
The Network Layer ....................................................................................................................................................... 135
2.4.3
The Tcp Layer................................................................................................................................................................ 135
2.4.4
The Application Processes Layer ................................................................................................................................. 136
MONITORING WINDOWS SERVERS .......................................................................................................................................... 137
3.1
The Operating System Layer ................................................................................................................................................ 138
3.1.1
Memory Usage Test ...................................................................................................................................................... 138
3.1.2
System Details Test ....................................................................................................................................................... 143
3.1.3
Disk Space Test ............................................................................................................................................................. 146
3.1.4
Disk Activity Test ......................................................................................................................................................... 148
3.1.5
Memory Details Test ..................................................................................................................................................... 151
3.1.6
Page Files Test ............................................................................................................................................................... 154
3.1.7
OS Details Test .............................................................................................................................................................. 155
3.1.8
HandlesUsage Test ........................................................................................................................................................ 158
3.1.9
DNS Changes Test ........................................................................................................................................................ 159
3.1.10
Windows Disk Alignment Test .................................................................................................................................... 160
3.1.11
Disk Users Quota Test .................................................................................................................................................. 161
3.1.12
Tests Disabled by Default ............................................................................................................................................. 166
3.2
3.2.1
3.3
3.3.1
3.4
The Network Layer ................................................................................................................................................................ 177
Windows Network Traffic Test .................................................................................................................................... 178
The Tcp Layer ........................................................................................................................................................................ 180
TcpTraffic Test .............................................................................................................................................................. 180
The OS Cluster Layer ............................................................................................................................................................ 181
3.4.1
Cluster Nodes Test ........................................................................................................................................................ 182
3.4.2
Cluster Networks Test ................................................................................................................................................... 184
3.4.3
Cluster Disks Test ......................................................................................................................................................... 185
3.4.4
Cluster Services/Applications Test .............................................................................................................................. 188
3.4.5
Cluster Storage Summary Test ..................................................................................................................................... 196
3.4.6
Cluster Shared Volumes Test ....................................................................................................................................... 199
3.4.7
Cluster Status Test ......................................................................................................................................................... 202
3.5
3.5.1
3.6
The Application Processes Layer ......................................................................................................................................... 205
Windows Processes Test ............................................................................................................................................... 205
The Windows Service Layer ................................................................................................................................................. 209
3.6.1
Windows Services Test ................................................................................................................................................. 210
3.6.2
Application Event Log Test .......................................................................................................................................... 215
3.6.3
System Event Log Test ................................................................................................................................................. 225
3.6.4
Security Log Test .......................................................................................................................................................... 229
CONCLUSION ..................................................................................................................................................................................... 235
Table of Figures
Figure 2. 1: The Linux monitoring model .........................................................................................................................................................5
Figure 2.2: Tests that map to the Operating System layer of a Linux server ........................................................................................................7
Figure 2.3: The top 10 CPU consuming processes........................................................................................................................................... 18
Figure 2.4: The detailed diagnosis of the Free_memory measure listing the top 10 memory consuming processes .............................................. 19
Figure 2.5: The detailed diagnosis of the Number of semaphore sets measure................................................................................................... 31
Figure 2.6: Detailed diagnosis of the Running processes measure .................................................................................................................... 52
Figure 2.7: The detailed diagnosis of the Runnable processes measure ............................................................................................................. 52
Figure 2.8: The detailed diagnosis of the Zombie processes measure ............................................................................................................... 53
Figure 2.9: The detailed diagnosis of the Stopped processes measure ............................................................................................................... 53
Figure 2.10: The tests that map to the Network layer of a Linux server ............................................................................................................ 60
Figure 2.11: Detailed diagnosis of the Average delay measure listing the hop-by-hop connectivity and delay..................................................... 62
Figure 2.12: The test mapped to the Tcp layer of a Linux server ...................................................................................................................... 63
Figure 2.13: The detailed diagnosis of the Current Connections measure.......................................................................................................... 65
Figure 2.14: Tests mapping to the Udp layer of a Linux server ........................................................................................................................ 69
Figure 2.15: The Processes test that tracks the health of the Application Processes layer of a Linux server......................................................... 70
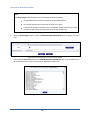
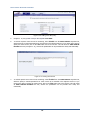
Figure 2.16: Configuring the Processes test .................................................................................................................................................... 81
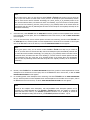
Figure 2.17: Auto-configuring the processes to be monitored .......................................................................................................................... 81
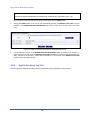
Figure 2.18: List of auto-discovered processes ................................................................................................................................................ 82
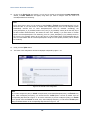
Figure 2.19: The detailed view of processes.................................................................................................................................................... 82
Figure 2.20: Multiple auto-discovered processes configured for monitoring ..................................................................................................... 83
Figure 2.21: Tests that map to the Operating System layer of a Solaris server ................................................................................................... 97
Figure 2.22: The tests that map to the Network layer of a Solaris server ......................................................................................................... 112
Figure 2.23: The test mapped to the Tcp layer of a Solaris server ................................................................................................................... 113
Figure 2.24: The Processes test that tracks the health of the Application Processes layer of a Solaris server ..................................................... 113
Figure 2.25: Tests that map to the Operating System layer of an AIX server................................................................................................... 114
Figure 2.26: The tests that map to the Network layer of an AIX server ........................................................................................................... 123
Figure 2.27: The test mapped to the Tcp layer of an AIX server..................................................................................................................... 124
Figure 2.28: The Processes test that tracks the health of the Application Processes layer of an AIX server ....................................................... 124
Figure 2.29: Tests that map to the Operating System layer of an HPUX server ............................................................................................... 131
Figure 2.30: The tests that map to the Network layer of an HPUX server ....................................................................................................... 135
Figure 2.31: The test mapped to the Tcp layer of an HPUX server ................................................................................................................. 135
Figure 2.32: The Processes test that tracks the health of the Application Processes layer of an HPUX server ................................................... 136
Figure 3. 1: Layer model for a Windows server ............................................................................................................................................ 137
Figure 3. 2: The tests associated with the Operating System layer of a Windows Generic server...................................................................... 138
Figure 3.3: The detailed diagnosis of the Disk Activity test ........................................................................................................................... 151
Figure 3. 4: The detailed diagnosis of the Handles used by processes measure................................................................................................ 159
Figure 3. 5: The detailed diagnosis of the Processes using handles above limit measure .................................................................................. 159
Figure 3. 6: Tests associated with the Network layer of a Windows Generic server ......................................................................................... 177
Figure 3. 7: The tests mapped to the Tcp layer of a Windows Generic server.................................................................................................. 180
Figure 3.8: The tests mapped to the OS Cluster layer .................................................................................................................................... 182
Figure 3.9: The detailed diagnosis of the Cluster disk status measure ............................................................................................................. 188
Figure 3.10: The detailed diagnosis of the Service/application status measure ................................................................................................ 194
Figure 3.11: The detailed diagnosis of the Server status measure ................................................................................................................... 195
Figure 3.12: The detailed diagnosis of the IP status measure.......................................................................................................................... 195
Figure 3.13: The detailed diagnosis of the Has the owner changed? measure .................................................................................................. 195
Figure 3.14: The detailed diagnosis of the Total disk space measure .............................................................................................................. 195
Figure 3.15: The detailed diagnosis of the Failed resources measure .............................................................................................................. 195
Figure 3.16: The detailed diagnosis of the Offline resources measure............................................................................................................. 196
Figure 3.17: The detailed diagnosis of the Total disk count measure .............................................................................................................. 199
Figure 3.18: The detailed diagnosis of the Used disks in cluster measure ....................................................................................................... 199
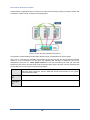
Figure 3.19: How the Cluster Shared Volume works? ................................................................................................................................... 200
Figure 3.20: The detailed diagnosis of the Number of services/applications measure ...................................................................................... 205
Figure 3.21: The detailed diagnosis of the Number of nodes measure............................................................................................................. 205
Figure 3. 22: The tests mapped to the Application Processes layer of a Windows Generic server ..................................................................... 205
Figure 3. 23: The tests mapped to the Windows Service layer of a Windows Generic server ........................................................................... 210
Figure 3.24: Configuring the WindowsServices test ...................................................................................................................................... 213
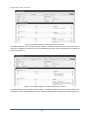
Figure 3.25: Auto-configuring the services to be monitored........................................................................................................................... 214
Figure 3.26: List of auto-discovered services ................................................................................................................................................ 214
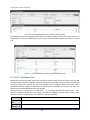
Figure 3.27: Multiple auto-discovered services configured for monitoring ..................................................................................................... 215
Figure 3. 28: Configuring an ApplicationEvents test ..................................................................................................................................... 221
Figure 3. 29: List of policies ........................................................................................................................................................................ 221
Figure 3. 30: Adding a new filter policy ....................................................................................................................................................... 222
Figure 3. 31: Viewing the text area............................................................................................................................................................... 222
Figure 3. 32: Results of the configuration ..................................................................................................................................................... 224
INTRODUCTION
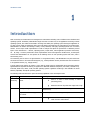
Introduction
Most current day IT infrastructures are heterogeneous environments including a mix of different server hardware and
operating systems. Sometimes, administrators might not want to monitor any of the applications executing on these
operating systems, but would be interested in knowing how healthy the operating system hosting the application is.
To cater to these needs, eG Enterprise offers 100% web-based, integrated moni of heterogeneous IT infrastructures.
Administrators can monitor and manage a variety of Unix, Windows, and legacy operating systems from a common
console. A novel layer model representation is used to analyze and depict the performance of different protocol
layers of the infrastructure – network, operating system, TCP/IP stack, critical application processes and services,
etc. By using a common performance model representation across heterogeneous infrastructures, eG Enterprise
ensures that administrators are not exposed to the differing nature of each operating system and hence, have a
short learning curve.
The monitoring can be done in an agent-based or in an agentless manner, and administrators can pick and choose
the servers that have to be monitored with agents (e.g., critical production servers) and those that can be monitored
in an agentless manner (e.g., staging servers).
A single agent license suffices to monitor a server and the agent license is transportable across operating systems.
Agent-based and agentless monitoring is supported for Microsoft Windows 2000/2003, Sun Solaris, Red Hat Linux,
Free BSD, SuSE Linux, HPUX, Tru64, and AIX operating systems. Agentless monitoring is also available for Novell
Netware, OpenVMS, and OS/400 operating systems.
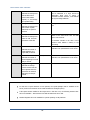
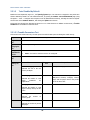
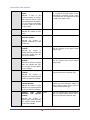
The following table summarizes the system monitoring capabilities of the eG Enterprise Suite.
Capability
Metric
CPU
Monitoring
CPU utilization per processor of a
server
Description
Know if a server is sized correctly in terms of
processing power;
Determine times of day when CPU usage level is high
Run queue length of a server
Determine how many processes are contending for CPU resources
simultaneously
Top 10 CPU consuming processes
on a server
Know which processes are causing a CPU spike on the server
Top 10 servers by CPU utilization
Know which servers have high CPU utilization, and
which ones are under-utilized
1
INTRODUCTION
Memory
Monitoring
Free memory availability
Track free memory availability on your servers;
Determine if your servers are adequately sized in
terms of memory availability
Swap memory usage
Top 10 processes
memory on the server
I/O
Monitoring
Determine servers with high swap usage
consuming
Know which processes are taking up memory on a
server
Top 10 servers by memory usage
Know which servers have the lowest free memory
available and hence, may be candidates for memory
upgrades
Blocked processes
Track the number of processes blocked on I/O;
Indicates if there is an I/O bottleneck on the server
Disk activity
Track the percentage of time that the disks on a
server are heavily used.
Compare the relative busy times of the disks on a
server to know if you can better balance the load
across the disks of a server
Uptime
Monitoring
Disk read/write times
Monitor disk read and write times to detect instances
when a disk is slowing down (Windows only)
Disk queue length
Track the number of processes queued on each disk
drive to determine disk drives that may be
responsible for slow downs
Top 10 processes by disk activity
Determine which
reads/writes
Current uptime
Determine how long a server has been up;
processes
are
causing
disk
Track times when a server was rebooted;
Determine times when unplanned reboots happened;
Disk Space
Monitoring
Top 10 servers by uptime
Know which servers have not been rebooted for a
long time;
Total capacity
Know the total capacity of each of the disk partitions
of a server
Free space
Track the free space on each of the disk partitions of
a server;
Proactively be alerted of high disk space levels on a
server;
2
INTRODUCTION
Page
Usage
File
Network
Traffic
Monitoring
Current usage
Monitor and alert on page file usage of a Windows
server;
Bandwidth usage
Track the bandwidth usage of each of the network
interfaces of a server (Windows only);
Identify network interfaces that have excessive usage
Outbound queue length
Determine queuing on each of the network interfaces
of a server;
Identify network interfaces that may be causing a
slowdown;
Incoming and outgoing traffic
Track the traffic into and out of a server through each
interface;
Identify servers
maximum traffic;
Network
Monitoring
Packet loss
and
network
interfaces
with
Track the quality of a network connection to a server;
Identify times when excessive packet loss happens;
TCP
Monitoring
Average delay
Determine the average delay of packets to a server;
Availability
Determine times when a server is not reachable over
the network;
Current connections
Track currently established
server;
Incoming/outgoing TCP connection
rate
Monitor the server workload by tracking the rate of
TCP connections to and from a server
TCP retransmissions
Track the percentage of TCP segments retransmitted
from the server to clients;
TCP connections to a
Be alerted when TCP retransmits are high and
therefore, are likely to cause significant slowdowns in
application performance;
Process
Monitoring
Processes running
Track the number of processes of a specific
application that are running simultaneously;
Identify times when a specific application process is
not running
CPU usage
Monitor the CPU usage of an application over time;
Determine times when an application is taking
excessive CPU resources.
3
INTRODUCTION
Memory usage
Track the memory usage of an application over time;
Identify if an application has a memory leak or not;
Threads
Track the number of threads running for an
application’s process (Windows only);
Handles
Track the number of handles held by an application
over time (Windows only);
Identify if a process has handle leaks;
Windows
Services
Monitoring
Availability
Determine if a service is running or not
Server Log
Monitoring
New events
Track the number of information, warning, and error
events logged in the Microsoft Windows System and
Application event logs;
Correlate events in the Windows event logs with
other activity on the server (e.g., service failure)
Obtain details of the events in the event logs;
Security success and failure events
Monitor all events logged in the Microsoft Windows
Security log;
Obtain details of all failure events;
Autocorrection
Events in /var/adm/messages log
Track and be alerted of all errors logged in the
/var/adm/messages log of a Unix system
Automatic restart of failed services
Determine Windows services that should be running
automatically; Monitor if these services are up or not,
and restart any failed service automatically
This document details the monitoring models that eG Enterprise offers for monitoring Windows and Unix systems.
4
MONITORING UNIX SERVERS
Monitoring Unix Servers
For hosts running flavors of Unix, eG Enterprise offers specialized monitoring models - one each for every Unix-based
operating system that is supported by eG Enterprise. These are, namely:
Linux
Solaris
AIX
HPUX
Note:
Only a Basic Monitor license is required for using each of the above-mentioned monitoring
models, regardless of the monitoring approach you employ - i.e., agent-based or agentless.
In addition to the above models, a Generic server model is also available, which can be used for
monitoring any generic Unix host - this again consumes a Basic Monitor license only.
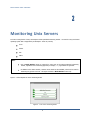
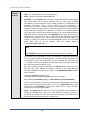
Figure 2. 1 below depicts the Linux monitoring model.
Figure 2. 1: The Linux monitoring model
5
MONITORING UNIX SERVERS
The key advantage of this monitoring model is that it is consistent across all the Unix-based operating systems that
the eG agent supports – in other words., the Linux, Solaris, AIX, and HPUX models offered out-of-the-box by the eG
Enterprise suite are represented by the same set of layers depicted by Figure 2. 1.
Note:
Figure 2. 1 also represents the Generic server model offered by eG Enterprise.
However, the tests mapped to each layer and the metrics they report may differ from one OS-specific model to
another.
This chapter discusses each of these OS-specific models in detail.
2.1 Monitoring Linux Servers
Figure 2. 1 displays the layer model of a Linux server. While the Operating System layer represents the state of the
host system on which the application executes, the Network layer represents the state of the network links to and
from the host system. Depending on whether the application relies on the Transmission Control Protocol (TCP) or the
User Datagram Protocol (UDP), either the Tcp or the Udp layers is used to represent the status of the transport
protocol. The Application Processes layer tracks the status of key processes executing on the host system.
2.1.1
The Operating System Layer
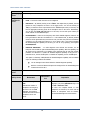
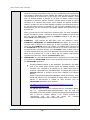
Since the status of a host depends on its CPU, memory, and disk utilization, the eG Enterprise suite uses a
SystemDetails test that tracks the CPU and memory utilization and DiskActivity and DiskSpace tests that monitor the
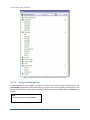
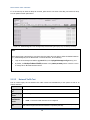
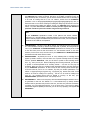
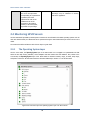
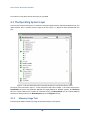
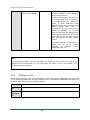
disk utilization. Figure 2.2 illustrates the tests that map to the Operating System layer. While the SystemDetails test
tracks the overall health of the target host, the DiskActivity and DiskSpace tests report the states of each of the disk
partitions of the host individually.
6
MONITORING UNIX SERVERS
Figure 2.2: Tests that map to the Operating System layer of a Linux server
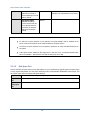
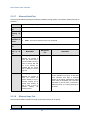
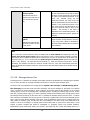
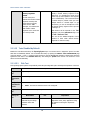
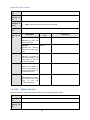
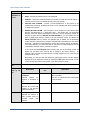
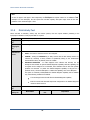
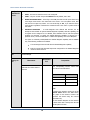
2.1.1.1
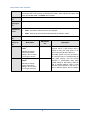
Server Load Average Test
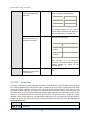
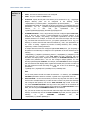
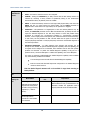
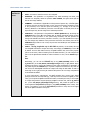
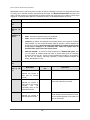
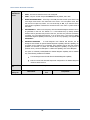
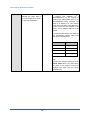
In UNIX computing, the system load is a measure of the amount of work that a computer system performs. The
load average represents the average system load over a period of time. This test reports the average load of Unix
systems by reporting three metrics, which represent the system load during the last one-, five-, and fifteen-minute
periods.
Note:
This test executes only on Unix systems.
7
MONITORING UNIX SERVERS
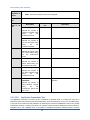
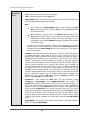
Purpose
The load average represents the average system load over a period of time. This test reports
the average load of Unix systems by reporting three metrics, which represent the system load
during the last one-, five-, and fifteen-minute periods.
Target of the
test
Any Unix host system
Agent
deploying the
test
An internal agent
Configurable
parameters for
the test
1.
TEST PERIOD - How often should the test be executed
2.
HOST - The host for which the test is to be configured.
3.
PORT - Refers to the port used by the specified host. By default, it is NULL.
Outputs of the
test
Measurements
made by the
test
One set of results for each host monitored
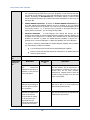
Measurement
Average load in the last
1 min:
Measurement
Unit
Number
Indicates the average
number of processes
waiting in the run-queue
over the past 1 minute.
Average load in the last
5 mins:
Number
Indicates the average
number of processes
waiting in the run-queue
over the past 5 minutes.
8
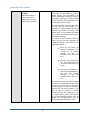
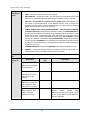
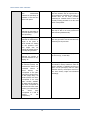
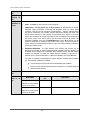
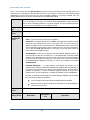
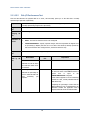
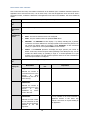
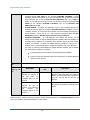
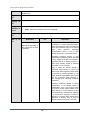
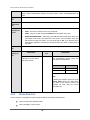
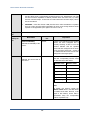
Interpretation
For an idle computer, the value of these
measures will be 0. Each process using or
waiting for CPU (the ready queue or run
queue) will increment these values by 1.
Most UNIX systems count only processes in
the running (on CPU) or runnable (waiting for
CPU) states. However, Linux also includes
processes in uninterruptible sleep states
(usually waiting for disk activity), which can
lead to markedly different results if many
processes remain blocked in I/O due to a
busy or stalled I/O system. This, for example,
MONITORING UNIX SERVERS
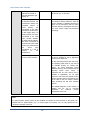
Average load in the last
15 mins:
Number
Indicates the average
number of processes
waiting in the run-queue
over the past 15 minutes.
includes processes blocking due to an NFS
server failure or to slow media (e.g., USB 1.x
storage devices). Such circumstances can
result in significantly increasing the value of
this measure, which may not reflect an actual
increase in CPU use, but will still give an idea
on how long users have to wait.
For single-CPU systems that are CPU-bound,
one can think of load average as a
percentage of system utilization during the
respective time period. For systems with
multiple CPUs, one must divide the number
by the number of processors in order to get a
comparable percentage.
For example, if these measures report the
values 1.73, 0.50, and 7.98, respectively, on
a single-CPU system, these values can be
interpreted as follows:
during the last minute, the
CPU was overloaded by 73%
(1 CPU with 1.73 runnable
processes, so that 0.73
processes had to wait for a
turn)
during the last 5 minutes, the
CPU was underloaded 50%
(no processes had to wait for
a turn)
during the last 15 minutes, the
CPU was overloaded 698% (1
CPU with 7.98 runnable
processes, so that 6.98
processes had to wait for a
turn)
This means that this CPU could have handled
all of the work scheduled for the last minute
if it were 1.73 times as fast, or if there were
two (the ceiling of 1.73) times as many CPUs,
but that over the last five minutes it was
twice as fast as necessary to prevent
runnable processes from waiting their turn.
In a system with four CPUs, a load average
of 3.73 would indicate that there were, on
average, 3.73 processes ready to run, and
each one could be scheduled into a CPU.
9
MONITORING UNIX SERVERS
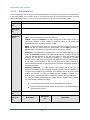
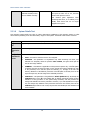
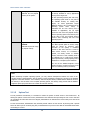
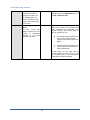
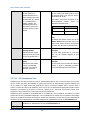
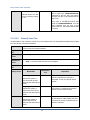
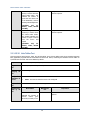
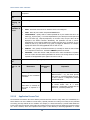
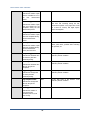
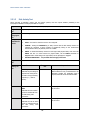
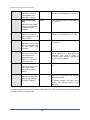
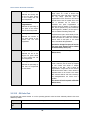
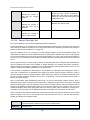
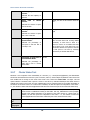
2.1.1.2
Disk Activity Test
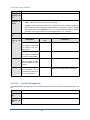
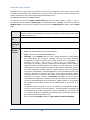
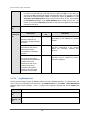
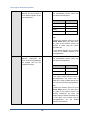
On Linux systems, the test will return the input/output utilization of each "device" on the system. The device name is
in the format "hdiskn" for 2.2 kernels, where "n" is the device number. For newer Linux kernels though, the device
name is displayed as "devm-n", where m is the major number of the device, and n a distinctive number.
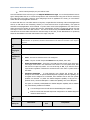
Purpose
Returns the input/output utilization of each "device" on the system
Target of the
test
Any host system
Agent
deploying the
test
An internal agent
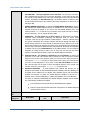
Configurable
parameters for
the test
1.
TEST PERIOD - How often should the test be executed
2.
HOST - The host for which the test is to be configured.
3.
USEEXE - Setting the USEEXE flag to true, ensures that the disk activity metrics are
collected by executing a binary instead of dynamically linking to the Performance
instrumentation library. By default, this is set to false.
4.
DISKS- To obtain disk activity metrics for both logical and physical disks, enter all in the
DISKS text box. To collect metrics for physical disks, set the DISKS parameter to
Physical and to collect metrics for logical disks, set the parameter to Logical.
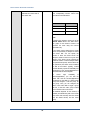
5.
USE SUDO – This parameter is of significance to Linux and Solaris platforms only. By
default, the USE SUDO parameter is set to No. This indicates that, by default, this test will
report the detailed diagnosis for the Disk busy measure of each disk partition being
monitored by executing the /usr/bin/iotop command or /usr/sbin/iotop command.
However, in some highly secure environments, this command cannot be executed directly.
In such cases, set this parameter to Yes. This will enable the eG agent to execute the
sudo/usr/bin/iotop command or sudo/usr/sbin/iotop and retrieve the detailed diagnosis of
the Disk busy measure.
6.
DETAILED DIAGNOSIS - To make diagnosis more efficient and accurate, the eG
Enterprise suite embeds an optional detailed diagnostic capability. With this capability, the
eG agents can be configured to run detailed, more elaborate tests as and when specific
problems are detected. To enable the detailed diagnosis capability of this test for a
particular server, choose the On option. To disable the capability, click on the Off option.
The option to selectively enable/disable the detailed diagnosis capability will be available
only if the following conditions are fulfilled:
The eG manager license should allow the detailed diagnosis capability
Both the normal and abnormal frequencies configured for the detailed diagnosis
measures should not be 0.
Outputs of the
test
Measurements
made by the
test
One set of results for each host monitored
Measurement
Measurement
Unit
10
Interpretation
MONITORING UNIX SERVERS
Disk busy:
Percent
Indicates the percentage of
elapsed time during which
the disk is busy processing
requests (i.e., reads or
writes).
Comparing the percentage of time that the
different disks are busy, an administrator can
determine whether the application load is
properly balanced across the different disks.
The detailed diagnosis of this measure will
reveal the top-10 I/O-intensive processes
executing on the host.
Disk read time: Indicates
the average time in
seconds of a read of data
from the disk.
Secs
Disk write time:
Indicates the average time
in seconds of a write of
data from the disk.
Secs
Data read rate from
disk:
KB/Sec
A very high value indicates an I/O bottleneck
on the server.
KB/Sec
A very high value indicates an I/O bottleneck
on the server.
Secs
A sudden rise in the value of this measure
can be attributed to a large amount of
information being input or output. A
consistent increase however, could indicate
an I/O processing bottleneck.
Secs
Ideally, the value of this measure should be
low.
Secs
The value of this measure is the sum of the
values of the Disk service time and Disk
queue time measures.
Indicates the rate at which
bytes are transferred from
the disk during read
operations.
Data write rate to disk:
Indicates the rate at which
bytes are transferred from
the disk during write
operations.
Disk service time:
Indicates the average time
that this disk took to
service each transfer
request ( i.e., the average
I/O operation time)
Disk queue time:
Indicates the average time
that transfer requests
waited idly on queue for
this disk.
Disk I/O time:
Indicates the avarage time
taken for read and write
operations of this disk.
Disk read rate:
A consistent increase in the value of this
measure could indicate a latency in I/O
processing.
Reads/Sec
Indicates the number of
reads happening on a
logical disk per second.
11
A dramatic increase in this value may be
indicative of an I/O bottleneck on the server.
MONITORING UNIX SERVERS
Disk write rate:
Writes/Sec
Indicates the number of
writes happening on a local
disk per second.
Avg queue length:
Indicates the average
number of both read and
write requests that were
queued for the selected
disk during the sample
interval.
A dramatic increase in this value may be
indicative of an I/O bottleneck on the server.
Number
Note:
For this test to report measures on Unix systems, the sysstat package must be installed on the
server (check for the existence of the iostat command on the target system).
For this test to report measures on Linux systems in particular, the iotop command should exist on
the system.
If the sysstat version installed on the target server is less than 4.0.7, the following measures also
will not be available – Data read rate from disk and Data write rate to disk.
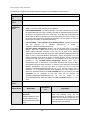
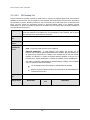
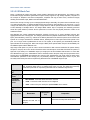
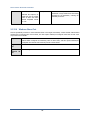
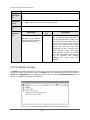
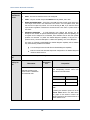
2.1.1.3
Disk Space Test
This test monitors the space usage of every disk partition on a host. While this test typically reports the space usage
of every physical disk partition on a host, when monitoring hosts running Windows 2008/Vista/7 hosts however, this
test reports usage metrics of physical and logical partitions.
Purpose
To measure the space usage of every disk partition on a host
Target of the
test
Any host system
Agent
deploying the
test
An internal agent
12
MONITORING UNIX SERVERS
Configurable
parameters for
the test
Outputs of the
test
Measurements
made by the
test
1.
TEST PERIOD - How often should the test be executed
2.
HOST - The host for which the test is to be configured.
3.
DISCOVER NFS – Set this flag to Yes, if you want the test to automatically discover NFS
drives on your system and report their status as well. By default, this flag is set to No.
4.
EXCLUDE – This parameter is of significance to Unix systems. Against this parameter, you
can provide a comma-separated list of disk partitions that you want to exclude from
monitoring. On Unix systems, you can use this parameter to exclude temporary partitions
that the Unix system itself creates from monitoring.
5.
DOMAIN, DOMAIN USER, AND DOMAIN PASSWORD – These parameters are applicable
to Windows systems only. When monitoring a Windows system, if the DISCOVER NFS flag
of this test is set to Yes, then the test should be configured with the privileges of a valid
domain user in order to auto-discover NFS drives and report their usage and status. In
such a case therefore, specify a valid Windows domain name against DOMAIN , provide
the name of a valid user in that domain against DOMAIN USER, and specify the password
of that user against PASSWORD. Once the domain user credentials are provided, the test
auto-discovers all those NFS drives on the target Windows system to which the configured
domain user has access.
6.
CONFIRM PASSWORD – Retype the PASSWORD of the configured domain user here.
7.
TIMEOUT – - Specify the maximum duration (in seconds) for which the test will wait for a
response from the server. The default timeout period is 30 seconds
One set of results for each physical/logical disk partition and/or NFS drive on the host monitored
Measurement
Total capacity:
Measurement
Unit
Interpretation
MB
Indicates the total capacity
of a disk partition.
Used space:
MB
Indicates the amount of
space used in a disk
partition.
Free space:
MB
Indicates the current free
space available for each
disk partition of a system.
Percent usage: Indicates
the percentage of space
usage on each disk
partition of a system.
Percent
13
A value close to 100% can indicate a
potential
problem
situation
where
applications executing on the system may not
be able to write data to the disk partition(s)
with very high usage.
MONITORING UNIX SERVERS
Drive availability:
Percent
Indicates whether/not this
drive is available currently.
If the drive is available, then this measure
will report the value 100. If not, then this
measure will report the value 0.
This measure gains significance when
monitoring NFS drives, as it enables you to
identify those drives that are no longer
mapped to the system.
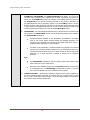
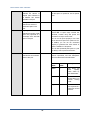
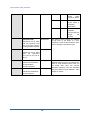
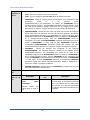
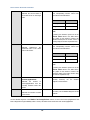
2.1.1.4
System Details Test
This operating system-specific test relies on native measurement capabilities of the operating system to collect
various metrics pertaining to the CPU and memory usage of a host system. The details of this test are as follows:
Purpose
To measure the CPU and memory usage of a host system
Target of the
test
Any host system
Agent
deploying the
test
An internal agent
Configurable
parameters for
the test
1.
TEST PERIOD - How often should the test be executed
2.
HOST - The host for which the test is to be configured.
3.
DURATION - This parameter is of significance only while monitoring Unix hosts, and
indicates how frequently within the specified TEST PERIOD, the agent should poll the
host for CPU usage statistics.
4.
SUMMARY – This attribute is applicable to multi-processor systems only. If the Yes option
is selected, then the eG agent will report not only the CPU and memory utilization of each
of the processors, but it will also report the summary (i.e., average) of the CPU and
memory utilizations of the different processors. If the No option is selected, then the eG
agent will report only the CPU usage of the individual processors.
5.
USEIOSTAT – This parameter is of significance to Solaris platforms only. By default, the
USEIOSTAT flag is set to No. This indicates that, by default, SystemTest reports the CPU
utilization of every processor on the system being monitored, and also provides the
average CPU utilization across the processors. However, if you want SystemTest to report
only the average CPU utilization across processors and across user sessions, then set the
USEIOSTAT flag to Yes. In such a case, the processor-wise breakup of CPU utilization will
not be available.
14
MONITORING UNIX SERVERS
6.
USEPS - This flag is applicable only for AIX LPARs. By default, this flag is set to No.
7.
INCLUDE WAIT - This flag is applicable to Unix hosts alone . On Unix hosts, CPU time is
also consumed when I/O waits occur on the host. By default, on Unix hosts, this test does
not consider the CPU utilized by I/O waits while calculating the value of the CPU utilization
measure. Accordingly, the INCLUDE WAIT flag is set to No by default. To make sure that
the CPU utilized by I/O waits is also included in CPU usage computations on Unix hosts, set
this flag to Yes.
8.
ENABLE MEMORY DIAGNOSIS - By default, the ENABLE MEMORY DIAGNOSIS flag is set to
NO, indicating that detailed diagnosis will not be available for the Free memory measure
reported by this test by default. If you want to view the detailed diagnosis of the Free
memory measure - i.e., to view the top 10 processes on the target host that are utilizing
memory excessively - you can change this flag to YES.
9.
USEGLANCE - This flag applies only to HP-UX systems. HP GlancePlus/UX is HewlettPackards’s online performance monitoring and diagnostic utility for HP-UX based
computers. There are two user interfaces of GlancePlus/UX -- Glance is character-based,
and gpm is motif-based. Each contains graphical and tabular displays that depict how
primary system resources are being utilized. In environments where Glance is run, the eG
agent can be configured to integrate with Glance to pull out detailed metrics pertaining to
the CPU usage of the HP-UX systems that are being monitored. By default, this integration
is disabled. This is why the USEGLANCE flag is set to No by default. You can enable the
integration by setting the flag to Yes. If this is done, then the test polls the Glance
interface of HP GlancePlus/UX utility to report the detailed diagnosis information.
10. USE TOP FOR DD - This parameter is applicable only to Linux platforms. By default, this
parameter is set to No. This indicates that, by default, this test will report the detailed
diagnosis of the System CPU utilization measure for each processor being monitored by
executing the usr/bin/ps command. In some environments however, this command may
not return accurate diagnostics. In such cases, set the USE TOP FOR DD parameter to
Yes. This will enable the eG agent to extract the detailed diagnosis of the System CPU
utilization measure by executing the /usr/bin/top command instead.
11. DETAILED DIAGNOSIS - To make diagnosis more efficient and accurate, the eG
Enterprise suite embeds an optional detailed diagnostic capability. With this capability, the
eG agents can be configured to run detailed, more elaborate tests as and when specific
problems are detected. To enable the detailed diagnosis capability of this test for a
particular server, choose the On option. To disable the capability, click on the Off option.
The option to selectively enable/disable the detailed diagnosis capability will be available
only if the following conditions are fulfilled:
The eG manager license should allow the detailed diagnosis capability
Both the normal and abnormal frequencies configured for the detailed diagnosis
measures should not be 0.
Outputs of the
test
Measurements
made by the
One set of results for each host monitored
Measurement
Measurement
Unit
15
Interpretation
MONITORING UNIX SERVERS
test
CPU utilization:
Percent
A high value could signify a CPU bottleneck.
The CPU utilization may be high because a
few processes are consuming a lot of CPU, or
because there are too many processes
contending for a limited resource. Check the
currently running processes to see the exact
cause of the problem.
Percent
An unusually high value indicates a problem
and may be due to too many system-level
tasks executing simultaneously.
Number
A value consistently greater than 2 indicates
that many processes could be simultaneously
contending for the processor.
Number
A high value could indicate an I/O problem
on the host (e.g., a slow disk).
MB
An unusually high value for the swap usage
can indicate a memory bottleneck. Check the
memory utilization of individual processes to
figure out the process(es) that has (have)
maximum memory consumption and look to
tune their memory usages and allocations
accordingly.
This
measurement
indicates the percentage of
utilization of the CPU time
of the host system.
System CPU utilization:
Indicates the percentage of
CPU time spent for systemlevel processing.
Run queue length:
Indicates the instantaneous
length of the queue in
which threads are waiting
for the processor cycle.
This length does not
include the threads that are
currently being executed.
Blocked processes:
Indicates the number of
processes blocked for I/O,
paging, etc.
Swap memory:
On Windows systems, this
measurement denotes the
committed
amount
of
virtual
memory.
This
corresponds to the space
reserved for virtual memory
on disk paging file(s). On
Solaris systems, this metric
corresponds to the swap
space currently available.
On HPUX and AIX systems,
this metric corresponds to
the amount of active virtual
memory (it is assumed that
one
virtual
page
corresponds to 4 KB of
memory
in
this
computation).
16
MONITORING UNIX SERVERS
Free memory:
MB
This measure typically indicates the amount
of memory available for use by applications
running on the target host.
Indicates the free memory
available.
On Unix operating systems (AIX and Linux),
the operating system tends to use parts of
the available memory for caching files,
objects, etc. When applications require
additional memory, this is released from the
operating
system
cache.
Hence,
to
understand the true free memory that is
available to applications, the eG agent
reports the sum of the free physical memory
and the operating system cache memory size
as the value of the Free memory measure
while monitoirng AIX and Linux operating
systems.
The detailed diagnosis of this measure, if
enabled, lists the top 10 processes
responsible
for
maximum
memory
consumption on the host.
Note:
For multi-processor systems, where the CPU statistics are reported for each processor on the system, the
statistics that are system-specific (e.g., run queue length, free memory, etc.) are only reported for the
"Summary" descriptor of this test.
17
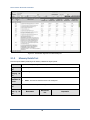
MONITORING UNIX SERVERS
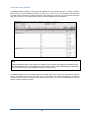
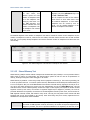
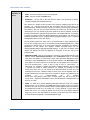
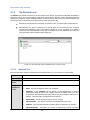
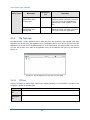
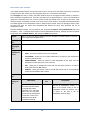
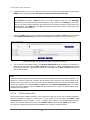
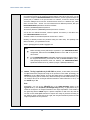
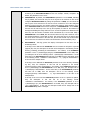
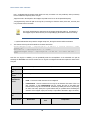
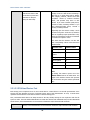
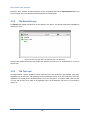
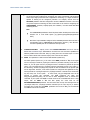
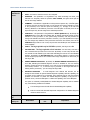
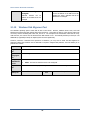
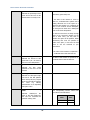
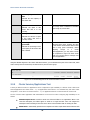
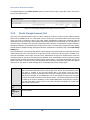
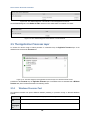
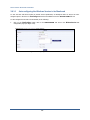
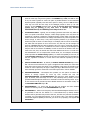
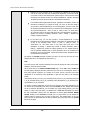
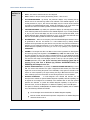
The detailed diagnosis capability of the System CPU utilization and CPU utilization measures, if enabled, provides a
listing of the top 10 CPU-consuming processes (see Figure 2.3). In the event of a Cpu bottleneck, this information
will enable users to identify the processes consuming a high percentage of CPU time. The users may then decide to
stop such processes, so as to release the CPU resource for more important processing purposes.
Figure 2.3: The top 10 CPU consuming processes
Note:
While instantaneous spikes in CPU utilization are captured by the eG agents and displayed in the Measures page,
the detailed diagnosis will not capture/display such instantaneous spikes. Instead, detailed diagnosis will display
only a consistent increase in CPU utilization observed over a period of time.
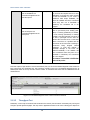
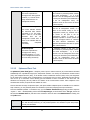
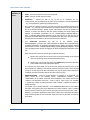
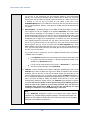
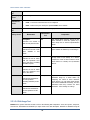
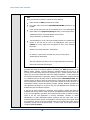
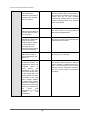
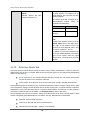
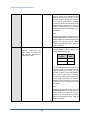
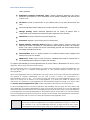
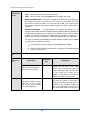
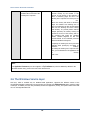
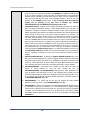
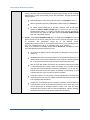
The detailed diagnosis of the Free memory measure, if enabled, lists the top 10 processes responsible for maximum
memory consumption on the host (see Figure 2.4). This information will enable administrators to identify the
processes that are causing the depletion in the amount of free memory on the host. The administrators can then
decide to kill such expensive processes.
18
MONITORING UNIX SERVERS
Figure 2.4: The detailed diagnosis of the Free_memory measure listing the top 10 memory consuming processes
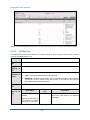
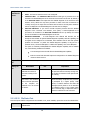
2.1.1.5
I/O Waits Test
The IOWaits test reports the CPU utilization of processes waiting for input or output. This test works on Solaris,
Linux, AIX, and HPUX platforms only.
Purpose
Reports the CPU utilization of processes waiting for input or output
Target of the
test
Solaris, Linux, AIX and HPUX systems
Agent
deploying the
test
An internal agent
Configurable
parameters for
the test
1.
TEST PERIOD - How often should the test be executed
2.
HOST - The host for which the test is to be configured
3.
DURATION - By default, this parameter is set to 5 seconds. This implies that, by default,
the test will run for 5 seconds, at the end of which, it will report the CPU usage of
processes averaged across the 5 seconds.
Outputs of the
test
Measurements
made by the
test
One set of results for the system being monitored
Measurement
CPU utilization waiting
for I/O:
Measurement
Unit
Percent
Indicates the percentage of
CPU utilized by processes
waiting for input or output.
19
Interpretation
If this percentage exceeds 10%, it indicates a
critical issue which needs to be addressed
immediately.
MONITORING UNIX SERVERS
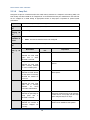
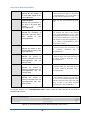
2.1.1.6
Swap Test
Swap space is space on a hard disk used as the virtual memory extension of a computer's real memory (RAM). The
least recently used files in RAM can be "swapped out" to the hard disk until they are needed later so that new files
can be "swapped in" to RAM. Having an appropriate amount of swap space is important for optimal system
performance.
Purpose
Provides statistics pertaining to the swap space on a hard disk
Target of the
test
A Solaris, Linux, AIX or HPUX system only
Agent
deploying the
test
An internal agent
Configurable
parameters for
the test
1.
TEST PERIOD - How often should the test be executed
2.
HOST - The host for which the test is to be configured
Outputs of the
test
One set of results for every server being monitored
Measurements
made by the
test
Measurement
Swap used:
Measurement
Unit
Interpretation
MB
Indicates the total swap
space
that
is
either
allocated or reserved.
Swap allocated:
MB
This measure is not available for HPUX
systems.
MB
This measure is not available for AIX and
HPUX systems.
Indicates the total swap
space currently allocated
for use as a backing store.
Swap reserved:
Indicates the total amount
of swap space not currently
allocated but claimed for
future use.
Swap available:
MB
Indicates the total swap
space that is currently
available
for
future
reservation and allocation.
Swap used percent:
Percent
A value close to 100% indicates that the
swap space configured may not be sufficient.
A value close to 0 may imply that the swap
space configured may be too large.
Number
Ideally, this value should be close to 0. This
measure is not available for AIX systems.
Indicates the percentage of
swap
space
that
is
allocated or reserved.
Swap queue:
Indicates the number of
processes swapped out
currently.
20
MONITORING UNIX SERVERS
2.1.1.7
Memory Details Test
This test reports statistics pertaining to the memory utilization of target systems. The measures made by this test are
as follows:
Purpose
Reports statistics pertaining to the memory utilization of target systems
Target of the
test
Any host system
Agent
deploying the
test
An internal agent
Configurable
parameters for
the test
1.
TEST PERIOD - How often should the test be executed
2.
HOST - The host for which the test is to be configured
Outputs of the
test
One set of results for every server being monitored
Measurements
made by the
test
Measurement
Memory page ins:
Measurement
Unit
Interpretation
Pages/Sec
Indicates the number of
times per second that a
process needed to access a
piece of memory that was
not in its working set,
meaning that the system
had to retrieve it from the
page file.
Memory page outs:
Pages/Sec
Indicates the number of
times per second the
system decided to trim a
process's working set by
writing some memory to
disk in order to free up
physical
memory
for
another process.
2.1.1.8
This value is a critical measure of the
memory utilization on a server. If this value
never increases, then there is sufficient
memory in the system. Instantaneous spikes
of this value are acceptable, but if the value
itself starts to rise over time or with load, it
implies that there is a memory shortage on
the server.
Memory Usage Test
This test reports statistics related to the usage of the physical memory of the system.
Purpose
Reports statistics related to the usage of the physical memory of the system
21
MONITORING UNIX SERVERS
Target of the
test
Any host system
Agent
deploying the
test
An internal agent
Configurable
parameters for
the test
1.
TEST PERIOD - How often should the test be executed
2.
HOST - The HOST for which the test is to be configured
3.
USEGLANCE - This flag applies only to HP-UX systems. HP GlancePlus/UX is HewlettPackards’s online performance monitoring and diagnostic utility for HP-UX based
computers. There are two user interfaces of GlancePlus/UX -- Glance is character-based,
and gpm is motif-based. Each contains graphical and tabular displays that depict how
primary system resources are being utilized. In environments where Glance is run, the eG
agent can be configured to integrate with Glance to pull out detailed metrics pertaining to
the memory usage of the HP-UX systems that are being monitored. By default, this
integration is disabled. This is why the USEGLANCE flag is set to No by default. You can
enable the integration by setting the flag to Yes. If this is done, then the test polls the
Glance interface of HP GlancePlus/UX utility to report the detailed diagnosis information
pertaining to memory usage.
4.
DETAILED DIAGNOSIS - To make diagnosis more efficient and accurate, the eG
Enterprise suite embeds an optional detailed diagnostic capability. With this capability, the
eG agents can be configured to run detailed, more elaborate tests as and when specific
problems are detected. To enable the detailed diagnosis capability of this test for a
particular server, choose the On option. To disable the capability, click on the Off option.
The option to selectively enable/disable the detailed diagnosis capability will be available
only if the following conditions are fulfilled:
The eG manager license should allow the detailed diagnosis capability
Both the normal and abnormal frequencies configured for the detailed diagnosis
measures should not be 0.
Outputs of the
test
Measurements
made by the
test
One set of results for every server being monitored
Measurement
Total physical memory:
Measurement
Unit
MB
Indicates the total physical
memory of the system.
Used physical memory:
MB
Indicates the used physical
memory of the system.
22
Interpretation
MONITORING UNIX SERVERS
Free physical memory:
MB
This measure typically indicates the amount
of memory available for use by applications
running on the target host.
Indicates the free physical
memory of the system.
On Unix operating systems (AIX and Linux),
the operating system tends to use parts of
the available memory for caching files,
objects, etc. When applications require
additional memory, this is released from the
operating
system
cache.
Hence,
to
understand the true free memory that is
available to applications, the eG agent
reports the sum of the free physical memory
and the operating system cache memory size
as the value of the Free physical memory
measure while monitoring AIX and Linux
operating systems.
Physical
utilized:
memory
Percent
Indicates the percent usage
of physical memory.
Ideally, the value of this measure should be
low. While sporadic spikes in memory usage
could be caused by one/more rogue
processes on the system, a consistent
increase in this value could be a cause for
some serious concern, as it indicates a
gradual, but steady erosion of valuable
memory resources. If this unhealthy trend is
not repaired soon, it could severely hamper
system performance, causing anything from a
slowdown to a complete system meltdown.
You can use the detailed diagnosis of this
measure to figure out which processes on the
host are consuming memory excessively.
Note:
While monitoring Linux/AIX operating systems, you may observe discrepancies between the value of the
Physical memory utilized measure and the memory usage percentages reported per process by the detailed
diagnosis of the same measure. This is because, while the Physical memory utilized measure takes into account
the memory in the OS cache of the Linux/AIX operating system, the memory usage percent that the detailed
diagnosis reports per process does not consider the OS cache memory.
2.1.1.9
Uptime Test
In most production environments, it is essential to monitor the uptime of critical servers in the infrastructure. By
tracking the uptime of each of the servers, administrators can determine what percentage of time a server has been
up. Comparing this value with service level targets, administrators can determine the most trouble-prone areas of the
infrastructure.
In some environments, administrators may schedule periodic reboots of their servers. By knowing that a specific
server has been up for an unusually long time, an administrator may come to know that the scheduled reboot task is
not working on a server.
23
MONITORING UNIX SERVERS
The Uptime test included in the eG agent monitors the uptime of critical Windows and Unix servers.
Purpose
To monitor the uptime of a Windows or Unix server
Target of the
test
A Windows or Unix server
Agent deploying
the test
An internal agent
Configurable
parameters for
the test
1.
TEST PERIOD - How often should the test be executed
2.
HOST - The host for which the test is to be configured.
3.
REPORTMANAGERTIME – By default, this flag is set to Yes, indicating that, by default,
the detailed diagnosis of this test, if enabled, will report the shutdown and reboot times of
the device in the manager’s time zone. If this flag is set to No, then the shutdown and
reboot times are shown in the time zone of the system where the agent is running (i.e.,
the system being managed for agent-based monitoring, and the system on which the
remote agent is running - for agentless monitoring).
4.
LOG LOCATION - This is applicable only to Windows platforms. Typically, the first time
this
test
executes
on
a
Windows
system/server,
it
creates
a
sysuptime_<Nameofmonitoredcomponent>.log
in
the
<EG_AGENT_INSTALL_DIR>\agent\logs directory. This log file keeps track of the system
reboots - each time a reboot occurs, this log file is updated with the corresponding
details. During subsequent executions of this test, the eG agent on the Windows
system/server reads this log file and reports the uptime and reboot-related metrics of the
target. In case of a physical Windows system/server, this log file ‘persists’ in the said
location, regardless of how often the system is rebooted. However, in case of a Windows
system/server that has been ‘provisioned’ by a Provisioning server, this log file is
recreated in the <EG_AGENT_INSTALL_DIR>\agent\logs directory every time a
reboot/refresh occurs. In the absence of a ‘persistent’ log file, the test will not be able to
track reboots and report uptime accurately. To avoid this, when monitoring a provisioned
Windows system/server, you have the option to instruct the test to create the
sysuptime_<Nameofmonitoredcomponent>.log file in an alternate location that is
‘persistent’ - i.e., in a directory that will remain regardless of a restart. Specify the full
path to this persistent location in the LOG LOCATION text box. For instance, your LOG
LOCATION can be, D:\eGLogs. In this case, when the test executes, the
sysuptime_<Nameofmonitoredcomponent>.log
file
will
be
created
in
the
D:\eGLogs\eGagent\logs folder. By default, the LOG LOCATION parameter is set to
none.
be Outputs of
the test
Measurements
made by the test
One set of results for every server being monitored
Measurement
Has the system been
rebooted?:
Measurement
Unit
Boolean
Indicates whether the server
has been rebooted during
the last measurement period
or not.
24
Interpretation
If this measure shows 1, it means that the
server was rebooted during the last
measurement period. By checking the time
periods when this metric changes from 0 to
1, an administrator can determine the times
when this server was rebooted.
MONITORING UNIX SERVERS
Uptime during the last
measure period:
Secs
If the server has not been rebooted during
the last measurement period and the agent
has been running continuously, this value will
be equal to the measurement period. If the
server was rebooted during the last
measurement period, this value will be less
than the measurement period of the test. For
example, if the measurement period is 300
secs, and if the server was rebooted 120 secs
back, this metric will report a value of 120
seconds. The accuracy of this metric is
dependent on the measurement period – the
smaller the measurement period, greater the
accuracy.
Mins
Administrators may wish to be alerted if a
server has been running without a reboot for
a very long period. Setting a threshold for
this metric allows administrators to determine
such conditions.
Indicates the time period
that the system has been up
since the last time this test
ran.
Total uptime of the
system:
Indicates the total time that
the server has been up since
its last reboot.
Note:
For a Unix host, if a value less than a minute is configured as the TEST PERIOD of the Uptime test, then, the
Uptime during the last measure period measure will report the value 0 until the minute boundary is crossed.
For instance, if you configure the Uptime test for a Unix host to run every 10 seconds, then, for the first 5 test
execution cyles (i.e., 10 x 5 = 50 seconds), the Uptime during the last measure period measure will report the
value 0 only; however, the sixth time the test executes (i.e, when test execution touches the 1 minute
boundary), this measure will report the value 60 seconds. This way, every sixth measurement period will
report 60 seconds as the uptime of the host. This is because, Unix hosts report uptime only in minutes and not
in seconds.
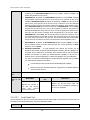
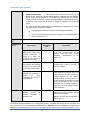
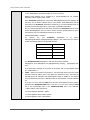
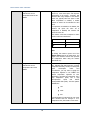
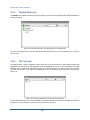
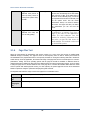
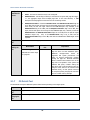
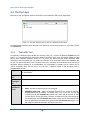
2.1.1.10 Message Queues Test
A message queue is a linked list of messages stored within the kernel and identified by a message queue identifier.
Two (or more) processes can exchange information via access to a common system message queue.
The Linux kernel (2.6) implements two message queues: System V IPC messages and POSIX Message Queue.
IPC messaging lets processes send and receive messages, and queues messages for processing in an arbitrary
order. A process can invoke msgsnd() to send a message. He needs to pass the IPC identifier of the receiving
message queue, the size of the message and a message structure, including the message type and text. On the
other side, a process invokes msgrcv() to receive a message, passing the IPC identifier of the message queue, where
the message should get stored, the size and a value t. t specifies the message returned from the queue - a positive
value means the first message with its type equal to t is returned; a negative value returns the last message equal to
type t, and zero returns the first message of the queue. There are limitations upon the size of a message (max), the
total number of messages (mni), and the total size of all messages in the queue (mnb). This implies that if the
number or size of the messages in a message queue touches these limits or grows close to these limits, it could
indicate a problem condition that should be investigated. To proactively capture such problem conditions,
administrators should continuously monitor the growth in the length and size of each IPC message queue on a
25
MONITORING UNIX SERVERS
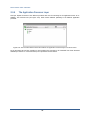
server. This is exactly what the Message Queues test does! This test auto-discovers the message queues on a
monitored server, and closely tracks the number and size of the messages in each queue, thus instantly pointing
administrators to those queues that have too many outstanding messages or very large messages. This way,
potential bottlenecks in inter-process communication can be isolated and treated!
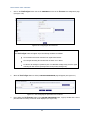
Purpose
Auto-discovers the message queues on a monitored server, and closely tracks the number and
size of the messages in each queue, thus instantly pointing administrators to those queues that
have too many outstanding messages or very large messages. This way, potential bottlenecks
in inter-process communication can be isolated and treated
Target of the
test
A Linux, AIX, HPUX, or Solaris server
Agent deploying
the test
An internal agent
Configurable
parameters for
the test
1.
TEST PERIOD - How often should the test be executed
2.
HOST - The host for which the test is to be configured.
3.
REPORT BY – By default, this flag is set to Owner. This implies that, by default, the test
metrics for every message queue owner on the target server. You can set this flag to
Total, if you want the test to report metrics for the Total descriptor alone; in this case, the
test will aggregate measures across all the message queues on the server. Alternatively,
you can pick the Owner and Total option. In this case, the test will report metrics per
owner and also for the Total descriptor.
4.
DD FREQUENCY - Refers to the frequency with which detailed diagnosis measures are
to be generated for this test. The default is 1:1. This indicates that, by default, detailed
measures will be generated every time this test runs, and also every time the test detects
a problem. You can modify this frequency, if you so desire. Also, if you intend to disable
the detailed diagnosis capability for this test, you can do so by specifying none against
DD FREQUENCY.
5.
DETAILED DIAGNOSIS - To make diagnosis more efficient and accurate, the eG
Enterprise suite embeds an optional detailed diagnostic capability. With this capability, the
eG agents can be configured to run detailed, more elaborate tests as and when specific
problems are detected. To enable the detailed diagnosis capability of this test for a
particular server, choose the On option. To disable the capability, click on the Off option.
The option to selectively enable/disable the detailed diagnosis capability will be available
only if the following conditions are fulfilled:
The eG manager license should allow the detailed diagnosis capability
Both the normal and abnormal frequencies configured for the detailed diagnosis
measures should not be 0.
be Outputs of
the test
Measurements
made by the test
One set of results for every queue owner (by default) of the server being monitored
Measurement
Measurement
Unit
26
Interpretation
MONITORING UNIX SERVERS
Number of queues:
Number
This measure will be reported for the Total
descriptor, only if the REPORT BY flag is set
to Total or Owner and Total.
Number
A high value or a consistent increase in the
value of this measure is an indication that
many messages are still undelivered to the
receiver. Typically, this occurs if either or
both the following are true:
Indicates the number of
queues for this owner. For
the Total descriptor, this
measure indicates the total
number of message queues
on the server.
Outstanding messages in
queue:
For
each
owner,
this
measure indicates the total
number
of
outstanding
messages in all queues
owned by that owner.
The number of bytes already on the
queue is equal to the maximum
number of bytes that the queue can
handle.
The total number of messages on all
queues system-wide is equal to the
system-imposed limit.
In such cases, you may either have to
remove messages from the queue, or reset
the maximum limits, so that inter-process
communication remains unaffected.
27
MONITORING UNIX SERVERS
Data in message queue:
KB
For
each
owner,
this
measure indicates the total
number
of
bytes
in
outstanding
messages
across all queues owned by
that owner.
Maximum size allowed:
KB
For each owner, this
indicates the total number of
bytes allowed in all message
queues owned by that
owner.
28
Compare the value of this measure across
owners to identify that owner whose queues
are of the maximum size. If the max value is
abnormally high, it could mean that one or
more queues owned by that owner contain
heavy messages or too many messages. You
may then want to identify which queues are
of the maximum size and why. For this, you
can use the detailed diagnosis of this
measure. The detailed diagnosis, if enabled,
reveals details of each queue owned by the
owner. The details include the name of the
creator of each message queue, the number
of bytes of data that each queue contains,
the number of messages in every queue,
the sender process and receiver process for
the last message to the queue, and more.
From this, you can easily pick the queues
with the maximum number of messages and
those that are of the maximum size. If any
queue contains very few messages but is of a
large size, it could mean that those messages
are heavy. On the other hand, if any queue
contains many messages and is also of a
large size, it could mean that the queue is
not processing messages and delivering them
as quickly as it should. This could signal a
potential
bottleneck
in
inter-process
communication, which would require further
investigation.
MONITORING UNIX SERVERS
Is message queue full?
If any message queue owned by an owner is
full, the value of this measure will be Yes. If
no message queue is full, then the value of
this measure will be No.
For each owner, this
indicates whether/not any
queue owned by that owner
has been used upto capacity
– i.e., whether/not the
number of bytes in the
outstanding messages on
that queue is equal to the
maximum number of bytes
allowed.
The numeric values that correspond to the
above-mentioned
measure
values
are
described in the table below:
Measure Value
Numeric Value
Yes
0
No
1
Note:
By default, this measure reports one of the
Measure Values listed in the table above. The
graph of this measure however will represent
the same using the numeric equivalents only.
Number of non-zero
message queues:
Number
Indicates the total number
of queues on the server that
are of a size greater than 0.
Total data in message
queue:
This measure is available only for the ‘Total’
descriptor.
To know which queues are of a non-zero
size, use the detailed diagnosis of this
measure.
KB
Indicates the total number
of bytes in outstanding
messages in all message
queues on the server.
This measure is available only for the ‘Total’
descriptor.
To know which queue contains the maximum
number of bytes in outstanding messages,
use the detailed diagnosis of this measure.
2.1.1.11 IPC Semaphores Test
Semaphores are data structures that are used for synchronization between two or more processes. They are often
used to monitor and control the availability of system resources such as shared memory segments. Basically, they
can be viewed as a single integer that represents the amout of resources available. When a process wants a
resource, it checks the value of the semaphore, and if it it non-zero, it decrements the appropriate number from the
semaphore in accordance to the amout of resources it wishes to use. The kernel will block the process if the
semaphore is zero or doesn't have a value high enough for the decrement.
Semaphores can be operated on as individual units or as elements in a set. A semaphore set consists of a control
structure and an array of individual semaphores. A set of semaphores can contain up to 25 elements. Like message
queues, the semaphore set creator can change its ownership or permissions. To know the count and composition of
semaphore sets and understand who owns which semaphore set, administrators can use the IPC Semaphores test.
Purposexx
To know the count and composition of semaphore sets and understand who owns which
semaphore set, administrators can use the IPC Semaphores test
Target of the
A Linux, AIX, HPUX, or Solaris server
29
MONITORING UNIX SERVERS
test
Agent deploying
the test
An internal agent
Configurable
parameters for
the test
1.
TEST PERIOD - How often should the test be executed
2.
HOST - The host for which the test is to be configured.
3.
REPORT BY – By default, this flag is set to Owner. This implies that, by default, the test
metrics for every semaphore set owner on the target server. You can set this flag to
Total, if you want the test to report metrics for the Total descriptor alone; in this case, the
test will aggregate measures across all the semaphore sets on the server. Alternatively,
you can pick the Owner and Total option. In this case, the test will report metrics per
owner and also for the Total descriptor.
4.
DD FREQUENCY - Refers to the frequency with which detailed diagnosis measures are
to be generated for this test. The default is 1:1. This indicates that, by default, detailed
measures will be generated every time this test runs, and also every time the test detects
a problem. You can modify this frequency, if you so desire. Also, if you intend to disable
the detailed diagnosis capability for this test, you can do so by specifying none against
DD FREQUENCY.
5.
DETAILED DIAGNOSIS - To make diagnosis more efficient and accurate, the eG
Enterprise suite embeds an optional detailed diagnostic capability. With this capability, the
eG agents can be configured to run detailed, more elaborate tests as and when specific
problems are detected. To enable the detailed diagnosis capability of this test for a
particular server, choose the On option. To disable the capability, click on the Off option.
The option to selectively enable/disable the detailed diagnosis capability will be available
only if the following conditions are fulfilled:
The eG manager license should allow the detailed diagnosis capability
Both the normal and abnormal frequencies configured for the detailed diagnosis
measures should not be 0.
be Outputs of
the test
Measurements
made by the test
One set of results for every semaphore set owner (by default) of the server being monitored
Measurement
Number of semaphore
sets:
Measurement
Unit
Number
Indicates the number of
semaphore sets owned by
this owner. For the Total
descriptor, this measure
indicates the total number of
semaphore sets on the
server.
Interpretation
This measure will be reported for the Total
descriptor, only if the REPORT BY flag is set
to Total or Owner and Total.
To know the complete details of each
semaphore set owned by an owner and the
number of semaphores each set contains,
use the detailed diagnosis of this measure.
30
MONITORING UNIX SERVERS
Number of semaphores:
Number
For
each
owner,
this
measure reports the total
number of semaphores that
are in the semaphore sets
owned by that owner. For
the Total descriptor, this
measure indicates the total
number of semaphores in all
the semaphore sets created
on the server.
This measure will be reported for the Total
descriptor, only if the REPORT BY flag is set
to Total or Owner and Total.
You can compare the value of this measure
across owners to know which owner owns
the maximum semaphores. To know which
semaphore sets are owned by such an
owner, use the detailed diagnosis of the
Number of semaphore sets measure.
The detailed diagnosis of the Number of semaphore sets measure reveals the creator of each semaphore set, the
number of semaphores in each set, when the set was created, and what was the last time each set was accessed.
From this, you can quickly identify semaphore sets with the maximum number of semaphores and those that were
used recently.
Figure 2.5: The detailed diagnosis of the Number of semaphore sets measure
2.1.1.12 Shared Memory Test
Shared memory (SHM) is another method of interprocess communication (IPC) whereby 2 or more processes share a
single chunk of memory to communicate. The shared memory system can also be used to set permissions on
memory, allowing for things like malloc debuggers to be written.
Shared memory is persistent. It does not go away when no program is referencing it. This can be a good thing, but
it can tie up system resources. To conserve system resources, administrators should cleanup the shared memory if it
is not in use anymore. But, how would administrators know whether a shared memory segment is currently in use or
not, and if used, which processes are using it? For this, administrators can use the Shared Memory test. This test
auto-discovers the owners of SHM segments, monitors the usage of each segment, and reports the number of SHM
segments owned by each owner, the number of segments mapped to/not mapped to processes, the count of
processes attached to the segments, the total size of the SHM segments owned by each owner, and the number of
SHM segments removed, cleared, and locked for every owner. This way, the test points to those owners with SHM
segments that are not even mapped to any process, leave alone being used; thus memory segments that are
candidates for removal/release can be identified.
Purpose
Auto-discovers the owners of SHM segments, monitors the usage of each segment, and reports
the number of SHM segments owned by each owner, the number of segments mapped to/not
mapped to processes, the count of processes attached to the segments, the total size of the
31
MONITORING UNIX SERVERS
SHM segments owned by each owner, and the number of SHM segments removed, cleared,
and locked for every owner
Target of the
test
A Linux, AIX, HPUX, or Solaris server
Agent deploying
the test
An internal agent
Configurable
parameters for
the test
1.
TEST PERIOD - How often should the test be executed
2.
HOST - The host for which the test is to be configured.
3.
REPORT BY – By default, this flag is set to Owner. This implies that, by default, the test
metrics for every SHM segment owner on the target server. You can set this flag to Total,
if you want the test to report metrics for the Total descriptor alone; in this case, the test
will aggregate measures across all the SHM segments on the server. Alternatively, you
can pick the Owner and Total option. In this case, the test will report metrics per owner
and also for the Total descriptor.
4.
DD FREQUENCY - Refers to the frequency with which detailed diagnosis measures are
to be generated for this test. The default is 1:1. This indicates that, by default, detailed
measures will be generated every time this test runs, and also every time the test detects
a problem. You can modify this frequency, if you so desire. Also, if you intend to disable
the detailed diagnosis capability for this test, you can do so by specifying none against
DD FREQUENCY.
5.
DETAILED DIAGNOSIS - To make diagnosis more efficient and accurate, the eG
Enterprise suite embeds an optional detailed diagnostic capability. With this capability, the
eG agents can be configured to run detailed, more elaborate tests as and when specific
problems are detected. To enable the detailed diagnosis capability of this test for a
particular server, choose the On option. To disable the capability, click on the Off option.
The option to selectively enable/disable the detailed diagnosis capability will be available
only if the following conditions are fulfilled:
The eG manager license should allow the detailed diagnosis capability
Both the normal and abnormal frequencies configured for the detailed diagnosis
measures should not be 0.
be Outputs of
the test
Measurements
made by the test
One set of results for every SHM segment owner (by default) of the server being monitored
Measurement
Measurement
Unit
32
Interpretation
MONITORING UNIX SERVERS
Number of shared
memory segments:
Number
For each owner, this
indicates the number of
shared memory segments
owned by that owner. For
the Total descriptor, this
indicates the total number of
shared memory segments
on the target server,
regardless of owner.
Number of shared
memory segments with
no process attached:
To know the complete details of each SHM
segment owned by an owner, use the
detailed diagnosis of this measure. From the
detailed diagnosis, you can figure out which
user and process created each SHM segment,
when it was created, the size of each
segment, the number of processes mapped
to each segment, and more! Using this
information, you can accurately isolate those
SHM segments that are of the maximum size,
and those that have been sized poorly. You
can also point to SHM segments that are not
attached to any processes; you can either
attach such segments to processes, remove
them, or clear the space in them to concerve
system resources.
Number
For each owner, this
indicates the number of
shared memory segments
owned by that owner to
which no processes are
attached currently. For the
Total descriptor, this
indicates the total number of
shared memory segments
on the target server without
any processes attached.
Number of processes
attaching to shared
memory segments:
This measure will be reported for the Total
descriptor, only if the REPORT BY flag is set
to Total or Owner and Total.
This measure will be reported for the Total
descriptor, only if the REPORT BY flag is set
to Total or Owner and Total.
You can use the detailed diagnosis of this
measure to know which segments have no
processes attached. Such segments are
candidates for removal / space release.
Number
For each owner, this
indicates the number of
processes that are currently
attached to the SHM
segments owned by that
owner. For the Total
descriptor, this indicates the
total number of processes
attached to all SHM
segments on the target
server.
This measure will be reported for the Total
descriptor, only if the REPORT BY flag is set
to Total or Owner and Total.
You can use the detailed diagnosis of this
measure to know which processes are
attached to which SHM segment.
33
MONITORING UNIX SERVERS
Total size of shared
memory segments:
KB
This measure will be reported for the Total
descriptor, only if the REPORT BY flag is set
to Total or Owner and Total.
Number
This measure will be reported for the Total
descriptor, only if the REPORT BY flag is set
to Total or Owner and Total.
For each owner, this
indicates the total size of all
SHM segments owned by
that owner. For the Total
descriptor, this indicates the
total size of all SHM
segments on the target
server.
Number of shared
memory segments
removed:
For each owner, this
indicates the number of SHM
segments owned by that
owner that have been
removed. For the Total
descriptor, this indicates the
total number of SHM
segments that have been
removed from the target
server.
Number of shared
memory segments
cleared:
You can use the detailed diagnosis of this
measure to know which shared memory
segments have been removed.
Number
For each owner, this
indicates the number of SHM
segments owned by that
owner that have been
cleared. For the Total
descriptor, this indicates the
total number of SHM
segments on the server that
have been cleared.
This measure will be reported for the Total
descriptor, only if the REPORT BY flag is set
to Total or Owner and Total.
You can use the detailed diagnosis of this
measure to know which shared memory
segments have been cleared.
34
MONITORING UNIX SERVERS
Number of shared
memory segments
locked:
Number
For each owner, this
indicates the number of SHM
segments owned by that
owner that are currently
locked. For the Total
descriptor, this indicates the
total number of SHM
segments on the server that
are currently locked.
Since multiple processes may attempt to
modify a shared memory segment at the
same time, it is possible that certain errors
could crop up when updates to the segment
occur simultaneously. This concurrent access
is almost always a problem when you have
multiple writers to a shared object. To get
around this, you can use semaphores to lock
the shared memory segment while a process
is writing to it.
This measure will be reported for the Total
descriptor, only if the REPORT BY flag is set
to Total or Owner and Total.
You can use the detailed diagnosis of this
measure to know which shared memory
segments are locked currently.
2.1.1.13 Tests Disabled by Default
Besides the tests discussed above, the Operating System layer of a Generic server is mapped to quiet a few other
tests that are disabled by default. You can enable these tests, by opening the AGENTS – TESTS CONFIGURATION page
(using the Agents -> Tests -> Configure menu sequence in the eG administrative interface), selecting the check box
against the test name in the DISABLED TESTS list, and clicking the Update button therein. The sections to come
discuss such tests elaborately.
2.1.1.13.1
Disk Test
This operating system-specific test periodically tracks the percentage disk space utilized per disk partition of the host.
Purpose
To measure the utilization of all the disk partitions on a host
Target of the
test
Any host system
Agent
deploying the
test
An internal agent
Configurable
parameters for
the test
1.
TEST PERIOD - How often should the test be executed
2.
HOST - The host for which the test is to be configured.
Outputs of the
test
One set of results for every disk partition monitored
Measurements
made by the
test
Measurement
Disk utilization:
Measurement
Unit
Percent
Indicates the percentage
utilization of the disk
partition.
35
Interpretation
When the utilization of a disk partition
approaches 100%, many applications using
the partition could begin to experience
failures.
MONITORING UNIX SERVERS
2.1.1.13.2
Disk I/O Performance Test
This test auto-discovers the physical disks on a server, and accurately points you to the disk that is currently
experiencing a high level of I/O activity.
Purpose
Auto-discovers the physical disks on a server, and accurately points you to the disk that is
currently experiencing a high level of I/O activity
Target of the
test
A Solaris/Linux/AIX host
Agent
deploying the
test
An internal agent
Configurable
parameters for
the test
1.
TEST PERIOD - How often should the test be executed
2.
HOST - The host for which the test is to be configured
3.
TARGETDISKIORATE – Specify a positive integer value that represents the highest level
of I/O activity (in KB/Sec) that can occur on a disk. If the actual I/O activity reported by
this test exceeds the value configured here, the disk is said to be busy.
Outputs of the
test
Measurements
made by the
test
One set of results for each disk supported by the host
Measurement
Disk IO:
Measurement
Unit
Interpretation
KB/Sec
Indicates the rate at which
I/O reads and writes occur
on this disk.
Disk busy :
Percent
Indicates the percentage of
time for which this disk was
busy
processing
I/O
requests.
This measure is reported only for those disks
for which the value of the Disk IO measure is
greater
than
or
equal
to
the
TARGETDISKIORATE configured.
If this measure appears in the eG monitoring
console for a disk, it clearly indicates that the
said disk is busy.
Comparing the percentage of time that the
different disks are busy, an administrator can
determine whether the application load is
properly balanced across the different disks.
36
MONITORING UNIX SERVERS
Disk I/O at target busy :
Boolean
Indicates whether this disk
is busy processing requests
or not.
If the value of the Disk IO measure is greater
than or equal to the TARGETDISKIORATE
configured for this test, then, this measure
will return the value 1; this indicates that the
disk is busy.
If the value of the Disk IO measure
below the TARGETDISKIORATE that
been configured, then the value of
measure will be 0; this indicates that the
is not busy.
2.1.1.13.3
falls
has
this
disk
Network Errors Test
The NetworkErrors test reports the network errors and collisions that occur during data transmission and reception
by a host via each of its network interfaces.
Purpose
Reports the network errors and collisions that occur during data transmission and reception by
a host via each of its network interfaces
Target of the
test
A host system
Agent deploying
the test
An internal agent
Configurable
parameters for
the test
1.
TEST PERIOD - How often should the test be executed
2.
HOST - The host for which the test is to be configured.
Outputs of the
test
One set of results for every network interface of the target host
Measurements
made by the test
Measurement
Incoming packet errors:
Measurement
Unit
Packets
High input errors could indicate that the
network is saturated, the local host is
overloaded, or there is a physical network
problem.
Packets
High output errors could indicate a saturated
local network or a bad physical connection
between the host and the network.
Number
A high value is normal for this measure, but if
the percentage of output packets that result
in a collision is too high, it indicates that the
network is saturated.
Indicates the number of
input errors that occurred
during the last measurement
period.
Outgoing packet errors:
Indicates the number of
output errors that occurred
during the last measurement
period.
Packet collisions:
Interpretation
Indicates the number of
collisions that occurred
during the last measurement
period.
37
MONITORING UNIX SERVERS
2.1.1.13.4
DNS Lookup Test
This test emulates an 'nslookup' command to a DNS server for resolving a configured IP/host name, and reports the
availability of the DNS server, the success/failure of the command, and the speed with which the server responded to
the command. In practice, NsLookup reaches out over the Internet to do a DNS lookup from an authorized name
server, and then formats the information returned for convenient display. Based on the statistics reported,
administrators can figure out whether the DNS server is available over the network and also identify slowdowns in
the responsiveness of the server.
Purpose
Emulates an 'nslookup' command to a DNS server for resolving a configured IP/host name, and
reports the availability of the DNS server, the success/failure of the command, and the speed
with which the server responded to the command
Target of the
test
A host system
Agent deploying
the test
An internal agent
Configurable
parameters for
the test
1.
TEST PERIOD - How often should the test be executed
2.
HOST - The host for which the test is to be configured.
3.
DETAILED DIAGNOSIS - To make diagnosis more efficient and accurate, the eG
Enterprise suite embeds an optional detailed diagnostic capability. With this capability, the
eG agents can be configured to run detailed, more elaborate tests as and when specific
problems are detected. To enable the detailed diagnosis capability of this test for a
particular server, choose the On option. To disable the capability, click on the Off option.
The option to selectively enable/disable the detailed diagnosis capability will be available
only if the following conditions are fulfilled:
The eG manager license should allow the detailed diagnosis capability
Both the normal and abnormal frequencies configured for the detailed diagnosis
measures should not be 0.
Outputs of the
test
Measurements
made by the test
One set of results for every network interface of the target host
Measurement
Measurement
Unit
38
Interpretation
MONITORING UNIX SERVERS
DNS server availability:
Number
Indicates the availability of
DNS Server.
The values for the availability of the DNS
Server is provided in the table below:
State
Value
Available
1
Not Available
0
The detailed diagnosis for this measure
provides the IP or the DNS Server Name, only
when the DNS server is in available state.
DNS lookup success:
Number
Indicates the status of the
NSLookup for the server.
The values for the status of the NSLookup is
provided in the table below:
State
Value
Lookup
Succesful
1
Lookup
Successful
Not
0
When the value is 0 (i.e. Lookup not
Successful), the detailed diagnosis for this
measure provides the reason for the
NSLookup failure.
DNS lookup time:
Secs
Indicates the response time
of the NSLookup.
2.1.1.13.5
Ideally, the value of this measure should be
low.
Inodes Test
An Inode is a data structure holding information about files in a Unix file system. There is an inode for each file and a
file is uniquely identified by the file system on which it resides and its inode number on that system. Each inode
contains the following information: the device where the inode resides, locking information, mode and type of file,
the number of links to the file, the owner's user and group ids, the number of bytes in the file, access and
modification times, the time the inode itself was last modified and the addresses of the file's blocks on disk. A Unix
directory is an association between file names and inode numbers. The operating system is configured to hold a
maximum number of inode objects for each disk partition. When there are no free Inodes, then new files cannot be
created in the system. The purpose of this test is to provide the statistics of the Inodes for each. This test works on
the Unix platforms only.
Purpose
Provides statistics of the Inodes for each drive in a machine
Target of the
A Unix system
39
MONITORING UNIX SERVERS
test
Agent
deploying the
test
An internal agent
Configurable
parameters for
the test
1.
TEST PERIOD - How often should the test be executed
2.
HOST - The host for which the test is to be configured
3.
FSTYPE - There is an inode for each file on a machine and a file is uniquely identified by
the file system on which it resides and its inode number on that system. Therefore, provide
a file system name in the FSTYPE text box - eg., nfs (for network file systems). Multiple
file system names can be provided as a comma-separated list - eg., nfs,ufs,bfs.
Outputs of the
test
Measurements
made by the
test
One set of results for every file system configured
Measurement
Unit
Measurement
Inodes used:
Interpretation
Number
The number of inodes that
are currently in use for a
disk partition.
Inodes free:
Number
The number of Inodes that
are free for a disk partition.
Inodes total:
Number
The total number of Inodes
that are available for a disk
partition
Percent inode usage:
Percent
The percentage of the
inodes that are currently in
use for a disk partition
2.1.1.13.6
High percentage of inode usage may lead to
a problem in creating new files / directories.
Var Adm Messages Test
The VarAdmMessages test reports the count of new CPU and memory errors that have occurred between two test
runs.
Purpose
Reports the count of new CPU and memory errors that have occurred between two test runs
Target of the
test
A Solaris
Agent
deploying the
test
An internal agent
40
MONITORING UNIX SERVERS
Configurable
parameters for
the test
1.
TEST PERIOD - How often should the test be executed
2.
HOST - The host for which the test is to be configured
3.
PORT – The port at which the HOST listens
4.
ALERTFILE - The full path to the alert file that needs to be monitored. By default,
/var/adm/messages will be displayed therein.
Also, instead of a specific log file, the path to the directory containing alert files can be
provided - eg., /user/logs. This ensures that eG monitors the most recent files in the
specified directory. If while monitoring a log file in a directory a newer log file gets added to
that directory, then eG will first finish monitoring the original log file and then start
monitoring the new one. Specific log file name patterns can also be specified, so that the
log file(s) monitored are restricted to files that match the specified patterns. For example,
to monitor the latest log files with names containing the strings 'dblogs' and 'applogs', the
parameter specification can be, /tmp/db/*dblogs*,/tmp/app/*applogs* . Here, '*' indicates
leading/trailing spaces (as the case may be).
The eG monitor interface will report one set of measurements for every configured path.
You can also configure the path in the following format: Name@logfilepath. Here, Name
represents the display name of the path being configured. Accordingly, the parameter
specification for the 'dblogs' and 'applogs' example discussed above can be:
dblogs@/tmp/db/*dblogs*,applogs@/tmp/app/*applogs* . In this case, the display names
'dblogs' and 'applogs' will alone be displayed as descriptors of the test, and not the
individual paths.
5.
SEARCHPATTERN - input the error patterns to search for in the specified alert file in the
following format: PatternName:ErrorPattern. Here, PatternName refers to the display
name of the error pattern. In other words, it is this name that will be displayed as an info
(descriptor) of the VarAdmMsgsTest in the eG monitor interface. The ErrorPattern refers
to the pattern of errors to search for in the alert file. An error pattern can be expressed in
any of the following forms - *expr* or expr or *expr or expr* or *expr1*expr2*... or
expr1*expr2, etc. A leading '*' signifies any number of leading characters, while a trailing
'*' signifies any number of trailing characters. For example, by providing the entry
Kernel_errors:*kern* here, you can instruct the eG Enterprise system to search for errors
containing the text 'kern'. Statistics related to these errors will be displayed in the eG
monitor interface when the info Kernel_errors is clicked on. Multiple error patterns can be
monitored
as
a
comma-separated
list.
For
example,
Kernel_errors:*kern*,Memory_errors:*AFT*. A single pattern may also be of the form
e1+e2, where + signifies an OR condition. That is, the PatternName is matched if either e1
is true or e2 is true.
6.
LINES - To enable eG to provide additional information about the errors in the detailed
diagnosis page, you can specify in the LINES text box the number of lines of text below
and above the 'error line' (in the alert file) that the detailed diagnosis page should display.
This specification should be in the format: No. of lines above:No. of lines below. By
default, this is set to '0:0', which will display only the error line in the detailed diagnosis
page. If you set it to 2:3, then besides the error line, 2 lines above and 3 lines below the
error line will also be displayed in the detailed diagnosis page.
41
MONITORING UNIX SERVERS
7.
EXCLUDEPATTERN - Provide a comma-separated list of patterns to be excluded from
monitoring in the EXCLUDEPATTERN text box. For example *critical*,*exception* . By
default, this parameter is set to 'none'.
8.
UNIQUEMATCH - By default, the UNIQUEMATCH parameter is set to FALSE, indicating
that, by default, the test checks every line in the log file for the existence of each of the
configured SEARCHPATTERNS. By setting this parameter to TRUE, you can instruct the
test to ignore a line and move to the next as soon as a match for one of the configured
patterns is found in that line. For example, assume that Pattern1:*fatal*,Pattern2:*error*
is the SEARCHPATTERN that has been configured. If UNIQUEMATCH is set to FALSE,
then the test will read every line in the log file completely to check for the existence of
messages embedding the strings 'fatal' and 'error'. If both the patterns are detected in the
same line, then the number of matches will be incremented by 2. On the other hand, if
UNIQUEMATCH is set to TRUE, then the test will read a line only until a match for one of
the configured patterns is found and not both. This means that even if the strings 'fatal'
and 'error' follow one another in the same line, the test will consider only the first match
and not the next. The match count in this case will therefore be incremented by only 1.
9.
ROTATINGFILE - By default, the ROTATINGFILE parameter is set to FALSE. To instruct
the eG Enterprise system to monitor newer log files also, set this parameter to TRUE.
Otherwise, set it to FALSE.
10. DETAILED DIAGNOSIS - To make diagnosis more efficient and accurate, the eG
Enterprise suite embeds an optional detailed diagnostic capability. With this capability, the
eG agents can be configured to run detailed, more elaborate tests as and when specific
problems are detected. To enable the detailed diagnosis capability of this test for a
particular server, choose the On option. To disable the capability, click on the Off option.
The option to selectively enable/disable the detailed diagnosis capability will be available
only if the following conditions are fulfilled:
The eG manager license should allow the detailed diagnosis capability
Both the normal and abnormal frequencies configured for the detailed diagnosis
measures should not be 0.
Outputs of the
test
Measurements
made by the
test
One set of results for the every error pattern configured
Measurement
Recent errors:
Measurement
Unit
Number
Indicates the number of
new CPU and memory
errors
that
occurred
between two test runs.
2.1.1.13.7
Interpretation
The detailed diagnosis of this measure, if
enabled, will list the recent errors and
additional lines of information pertaining to
the errors (if configured).
Inode Cache Test
This test monitors the size of the inode cache and the cache hit ratio. Based on these metrics, the inode cache can
be configured for optimal performance. This test is disabled by default.
Purpose
Monitors the size of the inode cache and the cache hit ratio
42
MONITORING UNIX SERVERS
Target of the
test
A Solaris host
Agent
deploying the
test
An internal agent
Configurable
parameters for
the test
1.
TEST PERIOD - How often should the test be executed
2.
HOST - The host for which the test is to be configured
Outputs of the
test
One set of results for every server being monitored
Measurements
made by the
test
Measurement
Current size:
Measurement
Unit
Interpretation
Number
Indicates the current size
of the Inode cache.
Max size:
Number
Indicates the maximum
size allowed for the Inode
cache.
Cache hits:
Number
Indicates the number of
hits during lookups to the
Inode cache in the last
measurement period.
Cache misses:
Number
Indicates the number of
misses during lookups to
the Inode cache in the last
measurement period.
Cache hit ratio:
Percent
Indicates the ratio of hits to
total lookups to the inode
cache
in
the
last
measurement period.
2.1.1.13.8
Buffer Cache Test
This test monitors the usage of the system's buffer cache. This test is disabled by default.
Purpose
Monitors the usage of the system's buffer cache
Target of the
test
A Solaris host
Agent
deploying the
test
An internal agent
43
MONITORING UNIX SERVERS
Configurable
parameters for
the test
1.
TEST PERIOD - How often should the test be executed
2.
HOST - The host for which the test is to be configured
Outputs of the
test
One set of results for every server being monitored
Measurements
made by the
test
Measurement
Unit
Measurement
Cache lookups
Interpretation
Number
Indicates the number of
lookups to the buffer cache
during
the
last
measurement period.
Cache hits:
Number
Indicates the number of
hits from the buffer cache
during
the
last
measurement period.
Buffer cache hit ratio:
Percent
A value close to 90% is good.
Indicates the ratio of cache
hits to total lookups during
the
last
measurement
period.
Buffers locked:
Number
Indicates the number of
buffers locked during the
last measurement period.
New buffer requests:
Number
Indicates the number of
new buffer requests issued
during
the
last
measurement period.
Waits
for
allocations:
buffer
Number
This value should be close to 0 for optimal
operation.
Indicates the number of
buffer allocation requests
during
the
last
measurement period that
had to wait
2.1.1.13.9
Application Connections Test
The Application Connections test tracks the TCP connections for specified ports on a target host. This test is
particularly useful while monitoring multi-tier infrastructures, where the challenge is to zero-in on the bottleneck tier
in the event of an infrastructure-wide slowdown. By monitoring the connections established to each tier it is possible
to determine which tier is causing a slow-down. For example, consider a multi-tier infrastructure with a web server,
application server, and a database server. If the number of established connections suddenly increases on all the
44
MONITORING UNIX SERVERS
tiers at about the same time, this indicates a bottleneck at the database (since a database slowdown impacts the
application server and web server tiers). On the other hand, if the web and application server tiers alone show a
connection increase, it indicates a bottleneck at the application server and not the database. This test is disabled by
default.
Purpose
Tracks the TCP connections for specified ports on a target host
Target of the
test
Any host
Agent
deploying the
test
An internal/remote agent
Configurable
parameters for
the test
1.
TEST PERIOD - How often should the test be executed
2.
HOST - The host for which the test is to be configured.
3.
PORT - The port number at which the specified HOST listens.
4.
SERVERIP - The SERVERIP text box displays '*' by default, indicating that, by default,
connections on all the IP addresses on the target system will be monitored by the test. You
can override this default setting by providing a single SERVERIP, so that connections
running on a particular IP on the specified HOST are alone tracked.
5.
PORTS - The PORTNOS parameter will display the target system's port number by
default. In this case, the test will report metrics pertaining to the default port only. You can
override this default setting by providing a single or a comma-separated list of port
numbers to be monitored. The test will then report the status of the TCP connections to
each of the port numbers so configured.
Outputs of the
test
Measurements
made by the
test
One set of results for every port configured
Measurement
Syn_sent connections:
Measurement
Unit
Interpretation
Number
Indicates the number of
connections that are in the
process
of
being
established by the host to
other server(s).
Syn_received
connections:
Number
Indicates the number of
connections that are in the
process
of
being
established
by
remote
hosts to this host.
Established
connections:
Number
Indicates the total number
of TCP connections on this
host for the port number(s)
specified
in
the
test
arguments.
45
The number of TCP connections established
is a key indicator of the server workload. A
significant increase in this metric may
indicate a slow down in request handling by
the application.
MONITORING UNIX SERVERS
Close_wait connections:
Indicates
the
current
number of TCP connections
to a port that are in the
TCP CLOSE_WAIT state.
Connections remain in the
close wait state when they
are waiting for a process to
close the TCP socket.
Number
Fin_wait_1
connections:
Indicates the number of
TCP connections to a TCP
port that are in the
FIN_WAIT_1 state. A TCP
connection moves to the
FIN_WAIT_1 state when a
local program closes a
socket but the remote
server does not respond.
Number
Fin_wait_2
connections:
Indicates the number of
TCP connections to a TCP
port that are in the
FIN_WAIT_2
state.
A
connection moves to the
FIN_WAIT_2 state when a
remote server shuts down
its side of a TCP connection
and the local server does
not respond to it.
Time_wait connections:
Indicates the number of
connections in the TCP
TIME_WAIT state. The
TIME_WAIT state is a
safety mechanism, to catch
stray packets for that
connection
after
the
connection is "officially"
closed. Since the maximum
time that such stray
packets can exist is 2 times
the maximum round-trip
time, the TIME_WAIT state
lasts twice the round-trip
period.
Roughly,
the
duration is 30-120 seconds.
Number
Number
46
A large number of FIN_WAIT_1 connections
can occur if clients are not properly closing
down TCP connections. A connection may
linger in this state for tens of minutes.
MONITORING UNIX SERVERS
TCP Send queue:
Send-Q is used to show the
socket buffer status. This
indicates the number of
bytes that have been sent
to the destination, and are
awaiting acknowledgement.
(Available
only
for
Solaris, Linux, HP-UX
and AIX)
TCP Receive queue:
Receive-Q is used to show
the socket buffer status.
The number indicates the
number of bytes received
from the source and
copied.
(Available
only
for
Solaris, Linux, HP-UX
and AIX)
Number
A high value of this measure indicates a poor
network response.
Number
A high value of this measure indicates a poor
network response.
2.1.1.13.10 Unix Tables Test
This test monitors critical process, inode, file, and lock tables. If any of these tables reach the OS-specified maximum
limit, application programs that use these tables will start to fail. Hence, monitoring the utilization of these tables on
a periodic basis is critical. This test is disabled by default.
Purpose
Monitors critical process, inode, file, and lock tables
Target of the
test
A Solaris, Linux, or HPUX system only
Agent
deploying the
test
An internal agent
Configurable
parameters for
the test
1.
TEST PERIOD - How often should the test be executed
2.
HOST - The host for which the test is to be configured
Outputs of the
test
One set of results for every server being monitored
Measurements
made by the
test
Measurement
Process table size:
Measurement
Unit
Number
Indicates the number of
process
entries
(proc
structures) currently in use.
47
Interpretation
This measure will not be available for Linux
systems.
MONITORING UNIX SERVERS
Process table maxsize:
Number
This measure will not be available for Linux
systems.
Percent
A value close to 100% indicates that the
system could be running out of process table
entries. This measure will not be available for
Linux systems.
Indicates the maximum
number of process entries
that
can
exist
(the
max_nprocs OS parameter
setting)
Process
utilization:
table
Indicates the percentage of
process entries in use
currently.
Inode table size:
Number
Indicates the number of
inodes
in
memory
currently.
Inode table maxsize:
Number
This measure will not be available for Linux
systems.
Percent
This measure will not be available for Linux
systems.
Indicates the number of
inodes currently allocated
in the kernel.
Inode table utilization:
Indicates the percentage of
inodes in memory out of
the total currently allocated
in the kernel.
File table size:
Number
Indicates the number of
entries in the open file
table.
File table maxsize:
Number
Indicates the size of the
open file table in the
kernel.
File table utilization:
Percent
Indicates the number of
entries in the open file
table as a percentage of
the file table size.
Lock table size:
Number
Indicates
the
shared
memory
record
table
entries currently used.
48
This measure will not be available for Linux
and HPUX systems.
MONITORING UNIX SERVERS
Lock table maxsize:
Number
This measure will not be available for Linux
and HPUX systems.
Percent
This measure will not be available for Linux
and HPUX systems.
Indicates
the
shared
memory
record
table
entries allocated in the
kernel.
Lock table utilization:
Indicates the number of
shared memory record
table entries currently used
as a % of the total number
of entries for this table
allocated in the kernel.
2.1.1.13.11 Paging Test
This test monitors memory paging in/out activity, and can provide early warning indicators of system memory
bottlenecks. This test is disabled by default.
Purpose
Monitors memory paging in/out activity
Target of the
test
A Solaris, Linux, or HPUX system only
Agent
deploying the
test
An internal agent
Configurable
parameters for
the test
1.
TEST PERIOD - How often should the test be executed
2.
HOST - The host for which the test is to be configured
Outputs of the
test
One set of results for every server being monitored
Measurements
made by the
test
Measurement
Pageout requests:
Indicates the
requests/sec.
Measurement
Unit
Reqs/Sec
This measure will not be available for Linux
systems.
Pages/Sec
This measure will not be available for HPUX
systems.
Pages/Sec
This measure will not be available for Linux
and HPUX systems.
page-out
Pages swapped out:
Indicates the pages paged
out per sec.
Pages freed:
Interpretation
Indicates the pages freed
out per sec by the page
scanner.
49
MONITORING UNIX SERVERS
Pages scanned:
Pages/Sec
If the page daemon scanning rate stays
above 200 pages per second for long periods
of time, then a memory shortage is likely.
This measure will not be available for Linux
and HPUX systems.
Percent
This measure will not be available for Linux
and HPUX systems.
Indicates
the
pages
scanned by the page
daemon as it looks for
pages used infrequently.
Ufs inodes removed:
Indicates the percentage of
UFS inodes removed from
the free list while still
pointing
at
reusable
memory pages. This is the
same as the percentage of
igets that force page
flushes.
2.1.1.13.12 Process State Test
This test reports the total number of processes running on a system and the number of processes in the different
process states - active, sleeping, runnable, zombie, stopped, etc. An unusually large number of processes in any of
these six states can be an indicator of a problem. This test is disabled by default.
Purpose
Reports the total number of processes running on a system and the number of processes in the
different process states
Target of the
test
A Solaris, Linux, or HPUX system only
Agent
deploying the
test
An internal agent
Configurable
parameters for
the test
1.
TEST PERIOD - How often should the test be executed
2.
HOST - The host for which the test is to be configured
3.
DETAILED DIAGNOSIS - To make diagnosis more efficient and accurate, the eG
Enterprise suite embeds an optional detailed diagnostic capability. With this capability, the
eG agents can be configured to run detailed, more elaborate tests as and when specific
problems are detected. To enable the detailed diagnosis capability of this test for a
particular server, choose the On option. To disable the capability, click on the Off option.
The option to selectively enable/disable the detailed diagnosis capability will be available
only if the following conditions are fulfilled:
The eG manager license should allow the detailed diagnosis capability
Both the normal and abnormal frequencies configured for the detailed diagnosis
measures should not be 0.
Outputs of the
test
Measurements
made by the
One set of results for every server being monitored
Measurement
Measurement
Unit
50
Interpretation
MONITORING UNIX SERVERS
test
Total processes:
Number
Indicates the total number
of
processes
on
the
system.
Running processes:
Number
Indicates the number of
processes that are currently
running on a processor.
Sleeping processes:
Number
Indicates the number of
processes that are waiting
for
an
event to complete.
Runnable processes:
Number
Indicates the number of
processes that are waiting
to
be
scheduled
for
execution.
Zombie processes:
Number
Indicates the number of
processes that are in the
zombie state - i.e., the
process terminated, but its
parent did not wait for it.
Stopped processes:
Number
Indicates the number of
processes in a stopped
state; A process can be in a
stopped state if it receives
a
job
control signal.
Alternatively, a process that
is being traced can also
enter this state.
The detailed diagnosis of the Running processes measure, if enabled, provides the Ids of the processes that are
currently running, the user who initiated the processes, and the command used for invoking the process (see Figure
2.6).
51
MONITORING UNIX SERVERS
Figure 2.6: Detailed diagnosis of the Running processes measure
The detailed diagnosis of the Runnable processes measure, if enabled, provides the Ids of the processes that are
waiting to be scheduled for execution, the user who initiated the processes, and the command used for invoking the
process (see Figure 2.7).
Figure 2.7: The detailed diagnosis of the Runnable processes measure
The detailed diagnosis of the Zombie processes measure, if enabled, provides the Ids of the processes that are in a
zombie state, the user who initiated the processes, and the command used for invoking the process (see Figure 2.8).
52
MONITORING UNIX SERVERS
Figure 2.8: The detailed diagnosis of the Zombie processes measure
The detailed diagnosis of the Stopped processes measure, if enabled, provides the Ids of the processes that are in a
stopped state, the user who initiated the processes, and the command used for invoking the process (see Figure
2.9).
Figure 2.9: The detailed diagnosis of the Stopped processes measure
2.1.1.13.13 Nfs Mounts Test
Network File System protocol (NFS) is often used to share file systems between servers and clients. Often, if an NFS
file system fails, the directories mapped to the NFS file system will be unavailable. Accesses to these directories/files
will take a long time and ultimately fail. This could potentially result in application failures and outages. Hence,
administrators need the capability to detect when an NFS file system is unavailable or is running out of space. The
Nfs Mounts test provides administrators with this capability.
This test executes on a system that is an NFS client – i.e., is mounting directories from remote servers - autodiscovers all NFS-mounted directories, and reports in real-time the availability and space usage of each of these
directories. This test is supported only on Unix platforms (and not on Windows).
Purpose
Reports in real-time the availability and space usage of NFS-mounted directory on an NFS client
Target of the
test
A Unix host
Agent
deploying the
An internal agent
53
MONITORING UNIX SERVERS
test
Configurable
parameters for
the test
1.
TEST PERIOD - How often should the test be executed
2.
HOST - The host for which the test is to be configured
3.
TIMEOUT - Specify the maximum duration (in seconds) for which the test will wait for a
response from the server. The default timeout period is 30 seconds.
4.
EXCLUDE FILE SYSTEMS – Provide a comma-separated list of file systems to be
excluded from monitoring. By default, this is set to none, indicating that all file systems will
be monitored by default.
5.
REPORT BY FILE SYSTEM – This test reports a set of measures for every NFS-mounted
directory auto-discovered on a target NFS client – this implies that the discovered
directory names will appear as descriptors of this test in the eG monitoring console. By
selecting an option from the REPORT BY FILE SYSTEM list, you can indicate how you
want to display these directory names in the eG monitoring console. By default, the
Remote Filesystem option is chosen; this indicates that, by default, the eG monitoring
console will refer to each directory using the complete path to that directory in the remote
file system – typically, this would include the name of the remote file system. For instance,
if the shares directory on a remote host with IP 192.168.10.1 is being monitored, then the
corresponding descriptor will be: //192.168.10.1/shares.
If you choose the Local Filesystem option instead, then, the eG monitoring console will
display only the name of the local file that is mapped to the remote directory – for
example, if the //192.168.10.1/shares directory is locally mapped to the file /mnt, then the
descriptor will be /mnt.
Alternatively, you can have both the remote file system path and the local file mapping
displayed in the eG monitoring console, by selecting the Both option from this list. In such
a case, the descriptor will be of the format: //192.168.10.1/shares (/mnt).
Outputs of the
test
Measurements
made by the
test
One set of results for every NFS-mounted directory auto-discovered
Measurement
Is the NFS
available?:
mount
Measurement
Unit
Percent
Indicates
whether
the
directory is accessible or
not.
Total capacity:
The value 100 indicates that the mounted
NFS is accessible.
The value 0 indicates that the mounted NFS
is not accessible.
MB
Indicates the current total
capacity of the mounted
system disk partition.
Used space:
Interpretation
MB
Indicates the amount of
space currently used in a
mounted
system
disk
partition.
54
MONITORING UNIX SERVERS
Free space:
MB
Indicates the free space
currently available on a
disk partition of a mounted
system.
Percent usage:
Percent
Indicates the percentage of
space used on a mounted
system disk partition.
Ideally, this value should be low. A high value
or a value close to 100% is indicative of
excessive space usage on this mounted
system disk partition. If a number of NFS
directories are exhibiting similar usage
patterns, it is a definite cause for concern, as
it indicates that the NFS file system as a
whole could be running out of space. If this
situation is not brought under control soon,
application failures and outages will become
inevitable!
2.1.1.13.14 OS Details Test
The OS Details test reports additional system-related metrics pertaining to the target system.
Purpose
Reports additional system-related metrics pertaining to the monitored host
Target of the
test
Any host
Agent
deploying the
test
An internal agent
55
MONITORING UNIX SERVERS
Configurable
parameters for
the test
1.
TEST PERIOD - How often should the test be executed
2.
HOST - The host for which the test is to be configured.
3.
PROCESS LIMIT - The PROCESS LIMIT determines what type of processes are to be
included in the detailed diagnosis of the Processes count measure of this test. By default, 5
is the PROCESS LIMIT. This implies that the detailed diagnosis of the Processes count
measure will by default list only those processes for which more than 5 instances are
currently running on the target host. Processes with less than 5 currently active instances
will not be displayed in the detailed diagnosis. This limit can be changed.
4.
EXCLUDE PROCESS - If you want to exclude one/more processes from the detailed
diagnosis of the Processes count measure, then specify a comma-separated list of
processes to be excluded in the EXCLUDE PROCESS text box. By default, the svchost
process is excluded from the detailed diagnosis of this test.
5.
DETAILED DIAGNOSIS - To make diagnosis more efficient and accurate, the eG
Enterprise suite embeds an optional detailed diagnostic capability. With this capability, the
eG agents can be configured to run detailed, more elaborate tests as and when specific
problems are detected. To enable the detailed diagnosis capability of this test for a
particular server, choose the On option. To disable the capability, click on the Off option.
The option to selectively enable/disable the detailed diagnosis capability will be available
only if the following conditions are fulfilled:
The eG manager license should allow the detailed diagnosis capability
Both the normal and abnormal frequencies configured for the detailed diagnosis
measures should not be 0
Outputs of the
test
Measurements
made by the
test
One set of results for every host monitored
Measurement
Processes count:
Measurement
Unit
Number
The detailed diagnosis of this measure will list
the processes that are currently running and
the number of instances of each process that
are running.
Switches/Sec
Context switches occur when a running
thread voluntarily relinquishes the processor,
is preempted by a higher priority ready
thread, or switches between user-mode and
privileged (kernel) mode to use an Executive
or subsystem service. If the context switch
rate is unusually high, it implies that there is
excessive contention for CPU resources.
Indicates the number of
processes running on the
system.
Context switches:
This value is the combined
rate at which all processors
on the computer are
switched from one thread
to another.
Interpretation
2.1.1.13.15 File Status Test
This test reports whether configured files are available or not, and if available, reports the size of the individual files.
Purpose
Reports whether configured files are available or not, and if available, reports the size of the
individual files
56
MONITORING UNIX SERVERS
Target of the
test
Any Unix or Windows host
Agent
deploying the
test
An internal agent
Configurable
parameters for
the test
1.
TEST PERIOD - How often should the test be executed
2.
HOST - The host for which the test is to be configured
3.
FILENAME - Provide a comma-separated list of the full path of the files that are to be
monitored. For instance, on a Unix host, your specification can be:
opt/usr/alert.log,opt/tmp/error.log . On a Windows host, your specification can be:
C:\eGurkha\agent\logs\agentout.log,C:\eGurkha\agent\logs\agenterr.log.
Note:
Wildcard characters are not supported while entering the full path of the files in the
FILENAME text box. So, provide the exact path of the files in the same.
Outputs of the
test
Measurements
made by the
test
One set of results for every configured file path
Measurement
File availability:
Measurement
Unit
Percent
This measure reports the value 100, if the file
is available in the configured path. If the files
is not availanle, a value of 0 is reported.
MB
This measure reports the size of a file only if
the File availability measure returns a value
of 100 for that file - i.e., only when the file is
available.
Indicates whether this file
is currently available or not.
File size:
Interpretation
Indicates the current size
of this file.
2.1.1.13.16 File Monitor Test
This test monitors a configured directory, and reports the total number of files in that directory that match configured
patterns. In addition, the test also reports the age of the oldest file of all the matching files.
Purpose
Monitors a configured directory, and reports the total number of files in that directory that
match configured patterns. In addition, the test also reports the age of the oldest file of all the
matching files
Target of the
test
Any Unix or Windows host
Agent
deploying the
test
An internal agent
57
MONITORING UNIX SERVERS
Configurable
parameters for
the test
1.
TEST PERIOD - How often should the test be executed
2.
HOST - The host for which the test is to be configured
3.
PORT - The port at which the HOST listens
4.
FILE PATH - Specify the full path to the directory to be monitored. For eg., c:\app\logdir.
Multiple
directory
paths
can
be
configured
in
the
following
format:
<DisplayName1>@<DirectoryPath1>,<DisplayName2>@<DirectoryPath2>,...
Every
DisplayName will appear as a descriptor of this test. For instance, on a Windows host your
specification can be:
LogPath:C:\eGurkha\agent\logs,OraPath:C:\Oracle\alerts\logs.
Likewise,
on
a
Unix
host,
your
specification
can
be:
LogPath:opt/eGurkha/agent/logs,ErrorPath:opt/usr/tmp/errors.
5.
FILENAME PATTERN - If only a single directory has been configured against FILE PATH,
then, in this text box, provide a comma-separated list of filename patterns to be
monitored. For example, error,warning. Your pattern specifications can also include
wildcard characters. For example, to monitor files with names that begin with the word
'log', and those that end with the word 'err', your pattern specification can be: log*,*err.
Similarly, to monitor those files with names that embed say, 'warn', your specification can
be: *warn*. A leading * signifies any number of leading characters, and a trailing *
signifies any number of trailing characters.
If multiple directories have been configured against FILE PATH, then, you can specify a
file pattern for each directory so configured. Your specification in this case should be of the
following
format:
<DisplayName_of_Filepath1>@<Filename_pattern1>,<DisplayName_of_Filepath2>@<File
name_pattern2>,...For instance, if the FILE PATH has been configured with two
directories with display names LogPath and OraPath, the FILENAME PATTERN can be:
LogPath:*error*,OraPath:*alert* . You can also configure multiple patterns for each
directory specified against FILEPATH. For example, if the FILE PATH has been configured
with two directories with display names LogPath and OraPath, and you want to monitor all
files with names that contain the strings ‘error’ and ‘info’ in each of the directories, your
specification
would
be:
LogPath@*error*,LogPath@*info*,OraPath@*error*,OraPath@*info*.
Note:
The file name patterns should not contain file extensions – for instance, your FILENAME
PATTERN specification cannot be as follows: LogPath:*error*.log,OraPath:*alert*.txt.
6.
DATE PATTERN - In some environments, file names may begin with the dates on which
the files were created/modified. If you want this test to monitor only those files that begin
with configured date patterns, then set the DATE PATTERN flag to true. In this case,
only those FILENAME PATTERNs that begin with a date pattern will be considered for
monitoring by this test. All other patterns will be ignored. If the DATE PATTERN is set to
false, then all configured FILENAME PATTERNs will be monitored.
Say, you want to monitor only those files with names that begin with dates of the format,
ddmmyy. To achieve this, first set the DATE PATTERN flag to true, and then, specify the
following
in
your
FILENAME
PATTERN
text
box:
<DisplayName_of_FilePath>@ddmmyy*.*.
58
MONITORING UNIX SERVERS
7.
INCLUDE SUB DIRECTORY – By default, this test will only search the directories
configured against FILE PATH for the specifiled FILENAME PATTERNS. If these
directories contain sub-directories, then such sub-directories will by default be excluded
from monitoring. This is why, the INCLUDE SUB DIRECTORY flag is set to false by
default. If you want this test to also scan the sub-directories within the configured FILE
PATHS for the specified FILENAME PATTERNS, then set the INCLUDE SUB
DIRECTORY flag to true.
8.
FILE EXTENSION – By default, this parameter is set to none, indicating that this test
monitors all files that match the configured FILENAME PATTERN regardless of the file
extensions. However, if you want the test to monitor only those matching files that have a
specific extension – say txt, log, ini, etc. - then mention that extension against the FILE
EXTENSION parameter. Note that only one extension can be provided here.
9.
DETAILED DIAGNOSIS - To make diagnosis more efficient and accurate, the eG
Enterprise suite embeds an optional detailed diagnostic capability. With this capability, the
eG agents can be configured to run detailed, more elaborate tests as and when specific
problems are detected. To enable the detailed diagnosis capability of this test for a
particular server, choose the On option. To disable the capability, click on the Off option.
The option to selectively enable/disable the detailed diagnosis capability will be available
only if the following conditions are fulfilled:
The eG manager license should allow the detailed diagnosis capability
Both the normal and abnormal frequencies configured for the detailed diagnosis
measures should not be 0.
Outputs of the
test
Measurements
made by the
test
One set of results for every configured FILE PATH
Measurement
Number of files:
Measurement
Unit
Number
Use the detailed diagnosis of this measure to
determine which files match the configured
pattern, the last modified date and time of
every file, and the age of each file (in
minutes).
Minutes
Use the detailed diagnosis of the Number of
files measure to identify the oldest file of this
pattern.
Indicates the number of
files
that
match
the
configured pattern in this
directory.
Age of oldest file:
Interpretation
Indicates the age (in
minutes) of the oldest file
that
matches
the
configured pattern in this
directory.
Besides the above, hardware monitoring expertise can also be optionally built into the Operating System layer. Please
refer to the Hardware Monitoring document for further details.
59
MONITORING UNIX SERVERS
2.1.2
The Network Layer
The Network layer handles connectivity of the host system to the network, and includes packet traffic transmitted to
and from the server. An eG agent tracks the status of the network layer to determine whether the network link to the
target host is available or not, the bandwidth available on the network link, and to the rate of packet transmissions to
and from the host. For monitoring, an eG agent uses two tests (see Figure 2.10):
Network test that monitors the connectivity to and from a host. An external agent executes this test.
NetworkTraffic test, which is executed by an internal agent. This test tracks the rate of packets
received and transmitted by each of the network interfaces of a host. A separate set of results is
reported for each network interface of the host. For example, Figure 2.10 depicts the test results for a
host with a single network interface that is named en0.
Figure 2.10: The tests that map to the Network layer of a Linux server
2.1.2.1
Network Test
This test monitors the network connectivity from an external location (e.g., the eG server) to a host system.
Purpose
To measure the state of the network link between any two hosts
Target
A host system
Agent deploying
this test
External agent
Configurable
parameters for
this test
1.
TEST PERIOD - How often should the test be executed
2.
HOST - The host for which the test is to be configured.
3.
TARGETS - In the TARGETS text box, specify a comma-separated list of name:IP
address pairs. While the name is just a display name, the IP address refers to the IP to
be monitored. This specification will ensure that the test pings multiple IP addresses. For
example - mysql:192.168.0.102,egwebsite:209.15.165.127
4.
PACKETSIZE - The size of packets used for the test (in bytes)
5.
PACKETCOUNT – The number of packets to be transmitted during the test
6.
TIMEOUT - How long after transmission should a packet be deemed lost (in seconds)
7.
PACKETINTERVAL - Represents the interval (in milliseconds) between successive
60
MONITORING UNIX SERVERS
packet transmissions during the execution of the network test for a specific target.
8.
DETAILED DIAGNOSIS - To make diagnosis more efficient and accurate, the eG
Enterprise suite embeds an optional detailed diagnostic capability. With this capability,
the eG agents can be configured to run detailed, more elaborate tests as and when
specific problems are detected. To enable the detailed diagnosis capability of this test for
a particular server, choose the On option. To disable the capability, click on the Off
option.
The option to selectively enable/disable the detailed diagnosis capability will be available
only if the following conditions are fulfilled:
The eG manager license should allow the detailed diagnosis capability
Both the normal and abnormal frequencies configured for the detailed diagnosis
measures should not be 0.
Outputs of the
test
Measurements of
the test
One set of outputs for every target host being monitored
Measurement
Unit
Measurement
Avg network delay:
Secs
An increase in network latency could
result from misconfiguration of the
router(s) along the path, network
congestion,
retransmissions
at
the
network, etc.
Secs
A significant increase in the minimum
round-trip time is often a sure sign of
network congestion.
Percent
Packet loss is often caused by network
buffer overflows at a network router or by
packet corruptions over the network. The
detailed diagnosis for this measure
provides a listing of routers that are on
the path from the external agent to target
server, and the delays on each hop. This
information can be used to diagnose the
hop(s) that could be causing excessive
packet loss/delays.
Percent
A value of 100 indicates that the system is
connected. The value 0 indicates that the
system is not connected.
Indicates the average delay
between transmission of
packet to a target and
receipt of the response to
the packet at the source.
Min network delay:
The minimum time between
transmission of a packet and
receipt of the response back.
Packet loss:
Indicates the percentage of
packets
lost
during
transmission from source to
target and back.
Network availability:
Indicates
whether
network
connection
available or not
Interpretation
the
is
Typically, the value 100 corresponds to a
Pkt_loss_pct of 0.
The detailed diagnosis capability of the Average delay measure, if enabled, lists the hop-by-hop connectivity and
delay (see Figure 2.11). The information provided includes the HopCount, the IP of the Router, and the delay at the
displayed hop (in milliseconds). In the event of a very high Average delay, a user can use this information to “zero61
MONITORING UNIX SERVERS
in” on the exact hop at which the delay has occurred, probe into the root-cause of the delay, and resolve the issue,
so as to optimize network performance.
Figure 2.11: Detailed diagnosis of the Average delay measure listing the hop-by-hop connectivity and delay
Note:
If the Network test is executed by a Linux agent, then this agent will not be able to collect the detailed measures
(i.e., detailed diagnosis) for the Network test. To resolve this issue, do the following:
1.
Login to the eG manager and edit the eg_tests.ini file (in the /opt/egurkha/manager/config directory) on it.
2.
By default, the MaxHopsForNetworkTestDD parameter in the [AGENT_SETTINGS] section of the file is set to
3. Change this to 16 instead and save the file.
2.1.2.2
Network Traffic Test
From an internal agent, this test measures the traffic received and transmitted by a host system via each of its
network interfaces.
Purpose
To measure the state of the network interfaces of a host
Target of the
test
A host system
Agent deploying
the test
An internal agent
Configurable
parameters for
the test
1. TEST PERIOD - How often should the test be executed
Outputs of the
test
One set of results for every network interface of the target host (On Windows systems, the
total traffic through all the network interfaces is reported by this test).
9.
HOST - The host for which the test is to be configured.
62
MONITORING UNIX SERVERS
Measurements
made by the test
2.1.3
Measurement
Measurement
Unit
Interpretation
Incoming traffic:
Represents the rate of
incoming traffic.
Pkts/Sec
An increase in traffic to the server can
indicate an increase in accesses to the server
(from users or from other applications) or
that the server is under an attack of some
form.
Outgoing traffic:
Represents the rate of
outgoing traffic
Pkts/Sec
An increase in traffic from the server can
indicate an increase in accesses to the server
(from users or from other applications).
The Tcp Layer
As indicated earlier, a generic application relies on either the TCP or UDP protocols for data transport. While many
applications such as web server, web application servers, and database servers rely on the TCP protocol, some other
applications such as DNS servers and WAP gateways rely on the UDP protocol. To track the health of the TCP layer
of a host, and its effect on the status of any application server, the eG Enterprise suite uses a Tcp test shown in
Figure 2.12.
Figure 2.12: The test mapped to the Tcp layer of a Linux server
2.1.3.1
TCP Test
This test, executed by an internal agent, tracks various statistics pertaining to TCP connections to and from a host.
The details of the test are provided below:
Purpose
To measure statistics pertaining to the TCP layer of a host
Target of the
test
A host system
Agent
deploying the
test
An internal agent
63
MONITORING UNIX SERVERS
Configurable
parameters for
the test
1.
TEST PERIOD - How often should the test be executed
2.
HOST - The host for which the test is to be configured.
3.
REPORTINGNAMES - The detailed diagnosis of this test lists the top-10 hosts that have
established the maximum number of TCP connections with the monitored host. Set this
flag to Yes if you want the detailed diagnosis to display the host name of these hosts and
not the IP address. To view the IP address of the hosts instead, set this flag to No.
4.
DETAILED DIAGNOSIS - To make diagnosis more efficient and accurate, the eG
Enterprise suite embeds an optional detailed diagnostic capability. With this capability, the
eG agents can be configured to run detailed, more elaborate tests as and when specific
problems are detected. To enable the detailed diagnosis capability of this test for a
particular server, choose the On option. To disable the capability, click on the Off option.
The option to selectively enable/disable the detailed diagnosis capability will be available
only if the following conditions are fulfilled:
The eG manager license should allow the detailed diagnosis capability
Both the normal and abnormal frequencies configured for the detailed diagnosis
measures should not be 0.
Outputs of the
test
Measurements
made by the
test
One set of results for each host system monitored
Measurement
In connection rate:
Measurement
Unit
Conns/Sec
A high value can indicate an increase in
input load.
Conns/Sec
A high value can indicate that one or more
of the applications executing on the host
have started using a number of TCP
connections to some other host(s).
Number
A sudden increase in the number of
connections established on a host can
indicate either an increase in load to one or
more of the applications executing on the
host, or that one or more of the applications
are experiencing a problem (e.g., a slow
down). On Microsoft Windows, the current
connections metrics is the total number of
TCP connections that are currently in the
ESTABLISHED or CLOSE_WAIT states.
Connections per second
received by the server
Out connection rate:
Connections per second
initiated by the server
Current connections:
Interpretation
Currently established
connections
The detailed diagnosis of this test lists the
top-10 hosts that have established the
maximum number of TCP connections with
the monitored host.
64
MONITORING UNIX SERVERS
Connection drops:
Conns/Sec
This value should be 0 for most of the time.
Any non-zero value implies that one or more
applications on the host are under overload
or that the bandwidth of your server is
insufficient. With ample bandwidth, the
server can establish and serve connections
before they time out. If bandwidth is
insufficient, the connections fail or are
dropped.
Conns/Sec
TCP counts a connection as having failed
when it goes directly from sending (SYNSENT) or receiving (SYN-RCVD) to CLOSED,
or from receiving (SYN-RCVD) to listening
(LISTEN). This value should be 0 for most of
the time. A prolonged non-zero value can
indicate either that the server is under SYN
attack or that there is a problem with the
network link to the server that is resulting in
connections
being
dropped
without
completion. It could also indicate a
bandwidth shortage. If the server has
sufficient bandwidth, it can establish and
serve connections before they time out. If
bandwidth is insufficient, the connections
fail or are dropped.
Rate of established TCP
connections dropped from the
TCP listen queue.
Connection failures:
Rate of half open TCP
connections dropped from the
listen queue
This measure is not available in the Windows
version of the product.
If the test reports a high number of Current Connections, then you can use the detailed diagnosis of this measure to
know which hosts are contributing the TCP connection overload on the host. The detailed diagnosis lists the IP
address/host names of the top-10 hosts and the number of connections that each host has established with the
monitored host.
Figure 2.13: The detailed diagnosis of the Current Connections measure
2.1.3.2
Throughput Test
Sometimes, a server may be functional and connected to the network, but the network connectivity may not be good
enough to provide good throughput. This may result in applications hosted on the server offering poor response to
65
MONITORING UNIX SERVERS
users. Speed mismatch between the network interface card on the server and the switch port that it is connected to
is often one of the main reasons why such throughput issues occur in production environments.
The Throughput test aims to monitor and detect situations when the throughput for data transfer to and from a
server drops below acceptable levels. This test is executed by the eG agent installed on a server, and it emulates an
upload and a download action from a server. Upload involves data transfer from the agent on the server, while
download involves downloading of content to the server from a remote location. The upload and download activities
are initiated against the eG management console to which the agent reports. Hence, the throughput metrics report
the values that users can expect when transmitting data between the server being monitored and the eG
management console.
This test is disabled by default. You can enable the test, by opening the AGENTS – TESTS CONFIGURATION page (using
the Agents -> Tests -> Configure menu sequence in the eG administrative interface), selecting the check box against
the test name in the DISABLED TESTS list, and clicking the Update button therein.
Purpose
Aims to monitor and detect situations when the throughput for data transfer to and from a
server drops below acceptable levels
Target of the
test
A host system
Agent
deploying the
test
An internal agent
Configurable
parameters for
the test
1.
TEST PERIOD - How often should the test be executed
2.
HOST - The host for which the test is to be configured.
3.
UPLOADSIZE - Define the size of data transferred by the agent to the management
console to perform this test.
4.
DOWNLOADSIZE - Define the amount of data downloaded by the agent from the
management console during the course of this test.
5.
URL - Specify the eG management console URL that the agent connects to in order to
perform this test in the URL text box.
6.
TIMEOUT - Specify the amount of time in seconds that this test can run for. Beyond this
period, the test terminates with a failure.
Outputs of the
test
Measurements
made by the
test
One set of results for each host system monitored
Measurement
Upload availability:
Measurement
Unit
Percent
This metric indicates whether
the upload data transfer
succeeded or not. This metric
takes a value of 0 if the data
upload to the eG management
console fails. A value of 100
indicates that the upload
completed successfully.
66
Interpretation
Upload failures indicate either a problem
with the eG management console, or a
failure of the network routing to the eG
management console (e.g., because one of
the routers on the path to the eG
management console is down).
MONITORING UNIX SERVERS
Upload speed:
Kbps
A significant reduction in this value over
time indicates a potential problem scenario
that needs investigation - i.e., is it the
network or the eG management server that
is causing the slowdown (if the bottleneck is
at the eG management server, the
slowdown would be seen across the board
by all the agents).
Percent
Download failures indicate either a problem
with the eG management console, or a
failure of the network routing to the eG
management console (e.g., because one of
the routers on the path to the eG
management console is down). It is
especially important to monitor upload and
download throughput values for networks
that have different downstream and
upstream characteristics like ADSL or Hybrid
Fiber Coaxial networks.
Kbps
A significant reduction in this value over
time indicates a potential problem scenario
that needs investigation - i.e., is it the
network or the eG management server that
is causing the slowdown (if the bottleneck is
at the eG management server, the
slowdown would be seen across the board
by all the agents).
This metric represents the
throughput seen during upload
transfers (i.e., from the server
being monitored to the eG
management console).
Download availability:
This metric indicates whether
the download data transfer
succeeded or not. This metric
takes a value of 0 if the data
download
from
the
eG
management console fails. A
value of 100 indicates that the
download
completed
successfully.
Download speed:
This metric represents the
throughput seen during
download transfers (i.e., from
the eG management console to
the server being monitored).
2.1.3.3
Ephemeral Ports Test
An ephemeral (short-lived) port is a transport protocol port for Internet Protocol (IP) communications allocated
automatically from a predefined range by the TCP/IP stack software. It is used by the Transmission Control Protocol
(TCP), User Datagram Protocol (UDP), or the Stream Control Transmission Protocol (SCTP) as the port assignment
for the client end of a client–server communication to a well known port on a server. Ephemeral ports may also be
used to free up a well-known service listening port and establish a service connection to the client host. The
allocations are temporary and only valid for the duration of the communication session. After completion of the
communication session, the ports become available for reuse.
This test monitors the usage of ephemeral ports, and reports whether adequate ports are available for use. With the
help of this test, you can proactively detect over-utilization of ports and promptly prevent port exhaustion.
This test is disabled by default. To enable the test, go to the ENABLE / DISABLE TESTS page using the menu sequence
: Agents -> Tests -> Enable/Disable, pick the desired Component type, set Performance as the Test type, choose the
test from the DISABLED TESTS list, and click on the << button to move the test to the ENABLED TESTS list. Finally, click
the Update button.
Purpose
Monitors the usage of ephemeral ports, and reports whether adequate ports are available for
use. With the help of this test, you can proactively detect over-utilization of ports and promptly
prevent port exhaustion.
Target of the
A host system
67
MONITORING UNIX SERVERS
test
Agent
deploying the
test
An internal agent
Configurable
parameters for
the test
1.
TEST PERIOD - How often should the test be executed
2.
HOST - The host for which the test is to be configured.
3.
PORT - The port at which the HOST listens. The default is NULL.
Outputs of the
test
Measurements
made by the
test
One set of results for each host system monitored
Measurement
Ephemeral ports in use:
Measurement
Unit
Interpretation
Number
Indicate the number of
ephemeral ports that are
currently in use.
Ephemeral ports available:
Number
Indicates the total number of
ports in the TCP/IP stack's
predefined range of ports - i.e.,
in the pool of ephemeral ports.
Free ephemeral ports:
Number
Indicates the number of ports
that are available for use.
The value of this measure is the difference
between the Total ports and the Ports in
Use measures. A port is considered free
when its yet to be assigned to a client, or
was assigned and later released for re-use
when the client connection terminated.
A value 0 for this measure is something to
be concerned about, particularly, on
Windows systems. On Windows systems, if
all the available available ephemeral ports
are allocated to client applications then the
client experiences a condition known as
TCP/IP port exhaustion. When TCP/IP port
exhaustion occurs, client port reservations
cannot be made and errors will occur in
client applications that attempt to connect to
a server via TCP/IP sockets. To avoid port
exahustion and support high connection
rates, reduce the TIME_WAIT value and
increase the port range.
Note:
Port exhaustion may not occur on Unix
systems due to the higher default
connection rate in those operating systems.
68
MONITORING UNIX SERVERS
Ephemeral port usage:
Percent
Indicates the percentage of
ephemeral ports that are in use.
A high value could indicate that many clients
are connecting to the system without
explicitly requesting for a specific port
number. It could also mean that many
ephemeral ports have not been released
even after the clients terminated their
connections.
A value close to 100% could be a cause for
concern, particularly on Windows systems.
This is because, on Windows, if all the
available available ephemeral ports are
allocated to client applications then the
client experiences a condition known as
TCP/IP port exhaustion. When TCP/IP port
exhaustion occurs, client port reservations
cannot be made and errors will occur in
client applications that attempt to connect to
a server via TCP/IP sockets. To avoid port
exahustion and support high connection
rates, reduce the TIME_WAIT value and
increase the port range.
Note:
Port exhaustion may not occur on Unix
systems due to the higher default
connection rate in those operating systems.
2.1.4
The Udp Layer
The Udp test (see Figure 2.14) tracks the health of the Udp layer.
Figure 2.14: Tests mapping to the Udp layer of a Linux server
2.1.4.1
Udp Test
The Udp test tracks various statistics of interest pertaining to the UDP stack of a host.
Purpose
To measure statistics pertaining to the UDP layer of a host
69
MONITORING UNIX SERVERS
Target of the
test
A host system
Agent deploying
the test
An internal agent
Configurable
parameters for
the test
1.
TEST PERIOD - How often should the test be executed
2.
HOST - The host for which the test is to be configured.
Outputs of the
test
One set of results for each host system monitored
Measurements
made by the test
Measurement
Traffic in:
Measurement
Unit
Pkts/Sec
A high value can indicate an increase in input
load.
Pkts/Sec
A high value can indicate an increase in load to
one or more applications, or a change in the
characteristics of one or more applications.
Pkts/Sec
Typically, this value should be zero. A sudden
increase in the buffer overflow rate can be
indicative of an overload condition on the host.
Check the UDP buffer settings on the system or
the buffer sizing used by the concerned
applications to consider ways of alleviating this
problem.
UDP packets (datagrams)
per second received by the
target host.
Traffic out:
UDP packets (datagrams)
per second transmitted by
applications on the target
host.
Packet overflow rate:
Rate of UDP buffer
overflows at the host.
2.1.5
Interpretation
The Application Processes Layer
This layer depicts the states of the different processes that must be executing for the application service to be
available. The Processes test (see Figure 2.15) tracks various statistics pertaining to the different application
processes. Details of this test are provided below.
Figure 2.15: The Processes test that tracks the health of the Application Processes layer of a Linux ser ver
70
MONITORING UNIX SERVERS
2.1.5.1
Processes Test
Application processes can be identified based on specific regular expression patterns. For example, web server
processes can be identified by the pattern *httpd*, while DNS server processes can be specified by the pattern
*named* where * denotes zero or more characters. For each such pattern, the process test reports a variety of CPU
and memory statistics.
Purpose
To measure statistics pertaining to one or more processes executing on a host
Target of the
test
Any application server
Agent
deploying the
test
An internal agent
71
MONITORING UNIX SERVERS
Configurable
parameters
for the test
1. TEST PERIOD - How often should the test be executed
3.
HOST - The host for which the test is to be configured
4.
PORT - The port to which the specified HOST listens
5.
PROCESS - In the PROCESS text box, enter a comma separated list of names:pattern
pairs which identify the process(es) associated with the server being considered.
processName is a string that will be used for display purposes only. processPattern is an
expression of the form - *expr* or expr or *expr or expr* or *expr1*expr2*... or
expr1*expr2, etc. A leading '*' signifies any number of leading characters, while a trailing '*'
signifies any number of trailing characters. The pattern(s) used vary from one application to
another and must be configured per application. For example, for an iPlanet application
server (Nas_server), there are three processes named kcs, kjs, and kxs associated with the
application server. For this server type, in the PROCESS text box, enter "kcsProcess:*kcs*,
kjsProcess:*kjs*, kxsProcess:*kxs*, where * denotes zero or more characters. Other special
characters such as slashes (\) can also be used while defining the process pattern. For
example, if a server’s root directory is /home/egurkha/apache and the server executable
named httpd exists in the bin directory, then, the process pattern is
“*/home/egurkha/apache/bin/httpd*”.
Note:
The PROCESS parameter supports process patterns containing the ~ character.
To determine the process pattern to use for your application, on Windows environments,
look for the process name(s) in the Task Manager -> Processes selection. To determine the
process pattern to use on Unix environments, use the ps command (e.g., the command "ps
-e -o pid,args" can be used to determine the processes running on the target system; from
this, choose the processes of interest to you.)
Also, while monitoring processes on Windows, if the WIDE parameter of this test is set to
true, then your process patterns can include the full path to the process and/or the
arguments supported by the process. For instance, your PROCESSPATTERN specification
can be as follows:
Terminal:C:\WINDOWS\System32\svchost
DcomLaunch,Remote:C:\WINDOWS\system32\svchost.exe -k netsvcs
-k
Also, note that the PROCESS parameter is case-sensitive in Unix environments.
To save the time and effort involved in such manual process specification, eG Enterprise
offers an easy-to-use auto-configure option in the form of a View/Configure button that is
available next to the PROCESS text box. Refer to Section 2.1.5.1.1 of this document o know
how to use the auto-configure option.
72
MONITORING UNIX SERVERS
6.
USER - By default, this parameter has a value "none"; this means that the test monitors all
processes that match the configured patterns, regardless of the user executing them. If you
want the test to monitor the processes for specific users alone, then, on Unix platforms,
specify a comma-separated list of users to be monitored in the USER text box. For
instance: john,elvis,sydney
While monitoring Windows hosts on the other hand, your USER configuration should be a
comma-separated list of "domain name-user name" pairs, where every pair is expressed in
the following format: Domainname\Username. For example, to monitor the processes of
user john and elvis who belong to domain mas, your USER specification should be:
mas\john,mas\elvis. Also, on a Windows host, you will find system processes running on the
following user accounts: SYSTEM, LOCAL SERVICE, and NETWORK SERVICE. While
configuring these USER accounts, make sure the Domainame is always NT AUTHORITY. In
this case therefore, your USER specification will be: NT AUTHORITY\SYSTEM,NT
AUTHORITY\LOCAL SERVICE,NT AUTHORITY\NETWORK SERVICE.
If multiple PROCESSes are configured for monitoring and multiple USERs are also
configured, then the test will check whether the first process is run by the first user, the
second process by the second user, and so on. For instance, if the PROCESSes configured
are java:java.exe,apache:*httpd* and the USERs configured are john,elvis, then the test
will check whether user john is running the process java, and user elvis is running the
process apache. Similarly, if multiple PROCESSes are configured, but a single USER alone
is configured, then the test will check whether the specified USER runs each of the
configured PROCESSes. However, if you want to check whether a single process, say
java.exe, is run by multiple users - say, james and jane - then, you have to do the
following:
Your USER specification should be: james,jane (if the target host is a Unix host),
or <Domainname>\james,<Domainname>\jane (if the target host is a Windows
host)
Your PROCESS configuration should be: Process1:java.exe,Process2:java.exe.
The number of processes in this case should match the number of users.
Such a configuration will ensure that the test checks for the java.exe process for
both the users, james and jane.
7.
CORRECT - Increased uptime and lower mean time to repair are critical to ensuring that IT
infrastructures deliver a high quality of service to users. Towards this end, the eG Enterprise
suite embeds an optional auto-correction capability that enables eG agents to automatically
correct problems in the environment, as soon as they occur. With this capability, as and
when an abnormal situation is detected, an eG agent can initiate corrective actions
automatically to resolve the problem. Automatic correction without the need for manual
intervention by IT operations staff reduces service downtime and improves operational
efficiency. By default, the auto-correction capability is available in the eG Enterprise suite for
the Processes running measure of Processes test, and the Service availability measure of
WindowsServices test. The eG Enterprise suite includes a default auto-correction script for
Processes test.
73
MONITORING UNIX SERVERS
When a process that has been configured for monitoring stops, this script automatically
executes and starts the process. To enable the auto-correction capability for the Processes
test, first, select the TRUE option against the CORRECT parameter in this page (by
default, FALSE will be selected here).
8.
ALARMTYPE - Upon selecting the true option, three new parameters, namely,
ALARMTYPE, USERPARAMS, and CORRECTIVESCRIPT will appear. You can set the
corrective script to execute when a specific type of alarm is generated, by selecting an
option from the ALARMTYPE list box. For example, if the Critical option is chosen from
the ALARMTYPE list box, then the corrective script will run only when a critical alarm for
the Processes test is generated. Similarly, if the Critical/Major option is chosen, then the
corrective script will execute only when the eG Enterprise system generates critical or major
alarms for the Processes test. In order to ensure that the corrective script executes
regardless of the alarm type, select the Critical/Major/Minor option.
9.
USERPARAMS - The user-defined parameters that are to be passed to the corrective script
are specified in the USERPARAMS text box. One of the following formats can be applied to
the USERPARAMS specification:
exec@processName:command: In this specification, processName is the display name of
the process pattern specified against the PROCESS parameter, and command is the
command to be executed by the default script when the process(es) represented by the
processName stops. For example, assume that the PROCESS parameter of Processes test
has
been
configured
in
the
following
manner:
Apache:*/opt/egurkha/manager/apache/bin/httpd*,Tomcat:*java*tomcat* , where Apache
and Tomcat are the processNames or display names of the configured patterns. If autocorrection is enabled for these processes, then the USERPARAMS specification can be as
follows:
exec@Apache:/opt/egurkha/manager/apache/bin/apachectl
/opt/tomcat/bin/catalina.sh start
start,Tomcat:
This indicates that if the processes configured under the processName "Apache" stop (i.e.
*/opt/egurkha/manager/apache/bin/httpd* ), then the script will automatically execute the
command "/opt/egurkha/manager/apache/bin/apachectl start" to start the processes.
Similarly, if the "Tomcat" processes (i.e. *java*tomcat*) stop, the script will execute the
command "/opt/tomcat/bin/catalina.sh start" to start the processes.
command: In this specification, command signifies the command to be executed when any
of the processes configured for monitoring, stop. Such a format best suits situations where
only a single process has been configured for monitoring, or, a single command is capable
of starting all the configured processes. For example, assume that the PROCESS parameter
has been configured to monitor IISWebSrv:*inetinfo*. Since only one process requires
monitoring, the first format need not be used for configuring the USERPARAMS.
Therefore, simplify specify the command, "net start World Wide Web Publishing Service".
Note:
The USERPARAMS specification should be placed within double quotes if this value
includes one or more blank spaces (eg.,"Apache:/opt/egurkha/bin/apachectl
start").
74
MONITORING UNIX SERVERS
Note that if a processName configured in the PROCESS parameter does not have a
corresponding entry in USERPARAMS (as discussed in format 1), then the autocorrection capability will not be enabled for these processes.
10. CORRECTIVESCRIPT - Specify none in the CORRECTIVESCRIPT text box to use the
default auto-correction script. Administrators can build new auto-correction capabilities to
address probable issues with other tests, by writing their own corrective scripts. To know
how to create custom auto-correction scripts, refer to the eG User Manual.
11. WIDE - This parameter is valid on Solaris, Windows, and Linux systems only.
On Solaris systems (before v11), if the value of the WIDE parameter is Yes, the eG
agent will use usr/ucb/ps instead of /usr/bin/ps to search for processes executing
on the host. In Solaris 11, the eG agent uses the /usr/bin/ps auxwww command to
perform the process search. The /usr/ucb/ps and the /usr/bin/ps auxwww commands
provide a long output (> 80 characters), whereas /usr/bin/ps only outputs the first
80 characters of the process path and its arguments. However, some Solaris
systems are configured with tightened security, which prevents the usr/ucb/ps
and/or the /usr/bin/ps auxwww command to be executed by any and every user to the
system - in other words, only pre-designated users will be allowed to execute this command.
The sudo (superuser do) utility (see http://www.gratisoft.us/sudo/) can be used to allow
designated users to execute this command. If your system uses sudo to restrict access to the
commands that return a long output, then set WIDE to Yes and then specify the value sudo
for the KEONIZEDSERVERCMD parameter. This will ensure that not only does the agent
use the /usr/ucb/ps and/or the /usr/bin/ps auxwww command (as the case may be) to
monitor processes (like it would do if the WIDE parameter were set to be Yes), but it would
also use sudo to execute this command.
75
MONITORING UNIX SERVERS
Note:
If the Processes test on Solaris 11 fails, then do the following:
Check whether the WIDE parameter is set to Yes.
If so, then make sure that the KEONIZEDSERVERCMD parameter is set
to sudo.
If the test still fails, then look for the following error in the error_log file
(that resides in the /opt/egurkha/agent/logs directory) on the eG agent
host:
ERROR ProcessTest: ProcessTest failed to execute [sudo:
pam_authenticate: Conversation failure]
The aforesaid error occurs if the sudo command prompts for a password
at runtime. If you find such an error in the error_log file, then, open the
SUDOERS file on the target host and append an entry of the following
format to it:
Defaults:<eG_Install_Username> !authenticate
For instance, if eguser is the eG install user, then your entry will be:
Defaults:eguser !authenticate
This entry will make sure that you are no longer prompted for a
password.
Save the file and restart the eG agent.
On Windows environments, by default, the eG agent uses perfmon to search for the
processes that match the configured patterns. Accordingly, the WIDE parameter is set to
false by default. Typically, a process definition in Windows includes the full path to the
process, the process name, and process arguments (if any). Perfmon however scans the
system only for process names that match the configured patterns – in other words, the
process path and arguments are ignored by perfmon. This implies that if multiple processes
on a Windows host have the same name as specified against PROCESSPATTERN, then
perfmon will only be able to report the overall resource usage across all these processes; it
will not provide any pointers to the exact process that is eroding the host’s resources. To
understand this better, consider the following example. Typically, Windows represents any
Java application executing on it as java.exe. Say, two Java applications are executing on a
Windows host, but from different locations.
If java.exe has been configured for monitoring, then by default, perfmon will report the
availability and average resource usage of both the Java applications executing on the host.
If say, one Java application goes down, then perfmon will not be able to indicate accurately
which of the two Java applications is currently inaccessible. Therefore, to enable
administrators to easily differentiate between processes with the same name, and to
accurately determine which process is unavailable or resource-hungry, the eG agent should
be configured to perform its process searches based on the process path and/or process
arguments, and not just on the process name – in other words, the eG agent should be
configured not to use perfmon.
76
MONITORING UNIX SERVERS
To achieve this, first, set the WIDE parameter to Yes. This will instruct the eG agent to not
use perfmon to search for the configured process patterns. Once this is done, then, you can
proceed to configure a PROCESSPATTERN that includes the process arguments and/or the
process path, in addition to the process name. For instance, if both the Remote Access
Connection Manager service and the Terminal Services service on a Windows host, which
share the same name – svchost - are to be monitored as two different processes, then your
PROCESSPATTERN specification should be as follows:
Terminal:C:\WINDOWS\System32\svchost -k
DcomLaunch,Remote:C:\WINDOWS\system32\svchost.exe -k netsvcs
You can also use wildcard characters, wherever required. For instance, in the above case,
your PROCESSPATTERN can also be:
Terminal:*svchost -k DcomLaunch,Remote:*svchost.exe -k netsvcs
Similarly, to distinctly monitor two processes having the same name, but operating from
different locations, your specification can be:
JavaC:c:\javaapp\java.exe,JavaD:d:\app\java.exe
Note:
Before including process paths and/or arguments in your PROCESSPATTERN
configuration, make sure that the WIDE parameter is set to Yes. If not, the test
will not work.
If your PROCESSPATTERN configuration includes a process path that refers to
the Program Files directory, then make sure that you do not a include a ~ (tilde)
while specifying this directory name. For instance, your PROCESSPATTERN
specification should not be say, Adobe:C:\Progra~1\Adobe\AcroRd32.exe.
12. KEONIZEDSERVERCMD - On Solaris hosts, this test takes an additional
KEONIZEDSERVERCMD parameter. Keon is a security mechanism that can be used with a
multitude of operating systems to provide a centralized base for user account and password
management, user access and inactivity control, system integrity checking, and auditing. If
the Keon security model is in use on the Solaris host being monitored, then this test may
require special user privileges for executing the operating system commands. In such a
case, specify the exact command that the test is permitted to execute, in the
KEONIZEDSERVERCMD text box. For example, if the keon command to be executed by
the test is sudo, specify sudo in the KEONIZEDSERVERCMD text box. Alternatively, you
can even specify the full path to the sudo command in the KEONIZEDSERVERCMD text box.
On the other hand, if a Keon security model is not in place, then set the
KEONIZEDSERVERCMD parameter to none.
77
MONITORING UNIX SERVERS
13. USEGLANCE - This flag applies only to HP-UX systems. HP GlancePlus/UX is HewlettPackards’s online performance monitoring and diagnostic utility for HP-UX based computers.
There are two user interfaces of GlancePlus/UX -- Glance is character-based, and gpm is
motif-based. Each contains graphical and tabular displays that depict how primary system
resources are being utilized. In environments where Glance is run, the eG agent can be
configured to integrate with Glance to pull out the process status and resource usage
metrics from the HP-UX systems that are being monitored. By default, this integration is
disabled. This is why the USEGLANCE flag is set to No by default. You can enable the
integration by setting the flag to Yes. If this is done, then the test polls the Glance interface
of HP GlancePlus/UX utility to pull out the desired metrics.
14. USEPS - This flag is applicable only for AIX LPARs. By default, on AIX LPARs, this test uses
the tprof command to compute CPU usage of the processes on the LPARs. Accordingly, the
USEPS flag is set to No by default. On some AIX LPARs however, the tprof command may
not function properly (this is an AIX issue). While monitoring such AIX LPARs therefore, you
can configure the test to use the ps command instead for metrics collection. To do so, set
the USEPS flag to Yes.
Note:
Alternatively, you can set the AIXusePS flag in the [AGENT_SETTINGS] section of the
eg_tests.ini file (in the <EG_INSTALL_DIR>\manager\config directory) to yes (default: no) to
enable the eG agent to use the ps command for CPU usage computations on AIX LPARs. If
this global flag and the USEPS flag for a specific component are both set to no, then the
test will use the default tprof command to compute CPU usage of processes executing on
AIX LPARs. If either of these flags is set to yes, then the ps command will perform the CPU
usage computations for such processes.
In some high-security environments, the tprof command may require some special privileges
to execute on an AIX LPAR (eg., sudo may need to be used to run tprof). In such cases, you
can prefix the tprof command with another command (like sudo) or the full path to a script
that grants the required privileges to tprof. To achieve this, edit the eg_tests.ini file (in the
<EG_INSTALL_DIR>\manager\config directory), and provide the prefix of your choice against
the AixTprofPrefix parameter in the [AGENT_SETTINGS] section. Finally, save the file. For
instance, if you set the AixTprofPrefix parameter to sudo, then the eG agent will call the
tprof command as sudo tprof.
15. USE TOP - This parameter is applicable only to Linux platforms. By default, this parameter
is set to No. This indicates that, by default, this test will report process health metrics by
executing the usr/bin/ps command on Linux. In some Linux environments however, this
command may not function properly. In such cases, set the USE TOP parameter to Yes.
This will enable this test to collect metrics using the /usr/bin/top command.
16. ISPASSIVE – If the value chosen is YES, then the server under consideration is a passive
server in a cluster. No alerts will be generated if the server is not running. Measures will be
reported as “Not applicable’ by the agent if the server is not up.
Outputs of the
test
Measurement
s made by the
test
One set of results per process pattern specified
Measurement
Processes running: Number
of instances of a process(es)
currently executing on a host.
Measurement
Unit
Number
78
Interpretation
This value indicates if too many or too few
processes corresponding to an application are
executing on the host.
MONITORING UNIX SERVERS
CPU utilization:
Percent
A very high value could indicate that
processes corresponding to the specified
pattern are consuming excessive CPU
resources.
Percent
A sudden increase in memory utilization for a
process(es) may be indicative of memory
leaks in the application.
Percentage of CPU used by
executing
process(es)
corresponding to the pattern
specified.
Memory utilization:
For one or more processes
corresponding to a specified set
of
patterns,
this
value
represents the ratio of the
resident set size of the
processes to the physical
memory of the host system,
expressed as a percentage.
Note:
The default configurations of the Processes test are applicable for JRun server 4.0. However, if you
are monitoring a JRun server 3.0, you would have to modify the default configurations.
In JRun server 3.0, 2 processes are associated with the admin and default servers. They are,
"jrun.exe" and "javaw.exe" respectively in Windows and "jrun" and "javaw" in Unix.
Similarly, the JRun Server 4.0 has two default processes, one running for the admin server and the
other for the default server. These processes are, namely, "jrun.exe" in Windows and "jrun" in Unix.
When you add a new server instance, these processes get created automatically with the same
names as mentioned above.
Special characters that are not allowed as part of your manual pattern specifications are as follows:
` (Grave Accent)
| (Vertical bar)
< (less than)
> (greater than)
~ (tilda)
@ (at)
# (hash)
% (Percent)
79
MONITORING UNIX SERVERS
Note:
Administrators can extend the built-in auto-correction capabilities to address probable issues with
the other measures of the Processes test, by writing their own corrective scripts for the same. The
custom-defined script can be associated with the Processes test in the same manner discussed
above.
The
name
of
the
custom-defined
script
should
be
of
the
following
format:
InternalTestName_InternalMeasureName. For example, a script that is written to correct problems
with the CPU utilization measure (of the Processes test) should be named as
"ProcessTest_Cpu_util”, where ProcessTest is the internal name of the Processes test, and Cpu_util
is the internal name for the CPU utilization measure. To know the internal names of tests and
measures, use any of the eg_lang*.ini file in the <EG_INSTALL_DIR>\manager\config directory. The
script extensions will differ according to the operating system on which it will execute. The
extensions supported by Windows environments are: .bat, .exe, .com, and .cmd. Scripts to be
executed on Unix environments do not require any extension. The most commonly used extension is
.sh.
At any given point of time, only one script can be specified in the CORRECTIVESCRIPT text box.
As already stated, the sample script for Processes test will be available for every operating system.
If the script is uploaded to the eG manager once for an operating system, it will automatically apply
to all the agents executing on the same operating system. For example, say that an environment
comprises of 3 agents, all executing on Windows 2000 environments. While configuring the
Processes test for one of the agents, if the administrator uploads the sample script, then he/she will
not have to repeat the process for the other 2 agents.
Once the eG agent downloads a corrective script from the eG manager, any changes made to the
script in the manager side will not be reflected in the agent side, immediately. This is because, the
eG agent checks the manager for the existence of an updated version of the corrective script, only
once a day. If an update is available, the agent downloads the same and overwrites the script that
pre-exists.
Note:
The Processes test of LDAP servers takes an additional parameter named ISPASSIVE. If the value chosen against
this parameter is Yes, then the LDAP server under consideration is a passive server in an LDAP cluster. No alerts
will be generated if the server is not running. Measures will be reported as “Not applicable” by the agent if the
server is not up.
2.1.5.1.1 Auto-configuring the Process Patterns to be Monitored
To save the time and effort involved in manual process specification, eG Enterprise offers an easy-to-use autoconfigure option in the form of a View/Configure button that is available next to the PROCESS text box.
To auto-configure the processes to be monitored, do the following:
80
MONITORING UNIX SERVERS
1.
Click on the View/Configure button next to the PROCESS text area in the Processes test configuration page
(see Figure 2.16).
Figure 2.16: Configuring the Processes test
Note:
The View/Configure button will appear only if the following conditions are fulfilled:
The Processes test must be executed in an agent-based manner.
The eG agent executing the test should be of version 5.2 or above.
In case the eG manager in question is part of a redundant manager setup, then the agent
executing the test must be reporting metrics to the primary manager only.
2.
When the View/Configure button is clicked, a PROCESS CONFIGURATION page will appear (see Figure 2.17).
Figure 2.17: Auto-configuring the processes to be monitored
3.
Upon clicking the Get Processes button in the PROCESS CONFIGURATION page, a pop up window with a list of
processes that are running on the host will be displayed (see Figure 2.18).
81
MONITORING UNIX SERVERS
Figure 2.18: List of auto-discovered processes
Note:
The processes that are already configured for monitoring will not be listed in Figure 2.18.
4.
By default, Figure 2.18 provides a 'concise' view of the process list - i.e., only the process names will be listed in
the pop-up window, and not the detailed description of the processes. You can click on the Click here link in the
pop up window to switch to the detailed view (see Figure 2.19).
Figure 2.19: The detailed view of processes
5.
As you can see, in the detailed view, the complete process path and process arguments accompany each autodiscovered process.
82
MONITORING UNIX SERVERS
6.
Regardless of the view you are in, select the process or list of processes that require monitoring and click the
SUBMIT button in the pop-up window. Note that you can select processes from both the views.
Note:
The Processes test includes a WIDE flag that is set to Yes by default. In this case, your PROCESS
specification can include the process path and arguments (if any). Therefore, if the WIDE flag is set to Yes,
then, the eG agent will report metrics for the process(es) that are selected in both the concise manner and
detailed manner. If the WIDE flag is set to No, the eG agent will collect metrics only for the process(es) that
are selected in a concise manner.
7.
Clicking the SUBMIT button in the pop-up will automatically populate the Name and Pattern text boxes available
in the PROCESS CONFIGURATION page, with the name and pattern of the chosen process (see Figure 2.20).
Figure 2.20: Multiple auto-discovered processes configured for monitoring
8.
You can add more name:pattern pairs in the PROCESS CONFIGURATION page by clicking on the encircled '+'
button present at the end of the first Name and Pattern specification. To remove a specification that pre-exists,
just click on the encircled '-' button that corresponds to it. The contents of the Name and Pattern text boxes can
also be edited manually.
Note:
Duplicate processes will appear in the list of processes pop-up, provided the process description is different - for
instance, if a 'cmd.exe' process and a 'cmd.bat' process execute on the same host, then both processes will be
listed as 'cmd' in the 'concise' view of the process list. If such duplicate processes are chosen for monitoring, then,
each process will appear as a separate Name and Pattern pair in the PROCESS CONFIGURATION page. To proceed,
the user must enter a different name in the Name text box for each process, so that every distinct pattern can be
identified in a unique manner.
2.1.5.2
TCP Port Status Test
This test tracks various statistics pertaining to TCP connections to and from a host, from an external perspective.
This test is disabled by default for a Generic server. You can enable the test, by opening the AGENTS – TESTS
CONFIGURATION page (using the Agents -> Tests -> Configure menu sequence in the eG administrative interface),
selecting the check box against the test name in the DISABLED TESTS list, and clicking the Update button therein.
For some other component-types, like the Oracle database server, this test is enabled by default.
83
MONITORING UNIX SERVERS
Purpose
Tracks various statistics pertaining to TCP connections to and from a host, from an external
perspective.
Target of the
test
Agent
deploying the
test
An external agent
Configurable
parameters for
the test
1.
TEST PERIOD - How often should the test be executed
2.
HOST - Host name of the server for which the test is to be configured
3.
PORT - Enter the port to which the specified HOST listens
4.
TARGETPORTS – Specify either a comma-separated list of port numbers that are to be
tested (eg., 80,7077,1521), or a comma-separated list of port name:port number pairs that
are to be tested (eg., smtp:25,mssql:1433). In the latter case, the port name will be
displayed in the monitor interface. Alternatively, this parameter can take a commaseparated list of port name:IP address:port number pairs that are to be tested, so as to
enable the test to try and connect to Tcp ports on multiple IP addresses. For example,
mysql:192.168.0.102:1433,egwebsite:209.15.165.127:80.
5.
TIMEOUT - Here, specify the maximum duration (in seconds) for which the test will wait
for a response from the server. The default TIMEOUT period is 60 seconds.
6.
ISPASSIVE – If the value chosen is YES, then the server under consideration is a passive
server in a cluster. No alerts will be generated if the server is not running. Measures will be
reported as “Not applicable’ by the agent if the server is not up.
Outputs of the
test
Measurements
made by the
test
One set of results for every configured port name
Measurement
Availability:
Measurement
Unit
Percent
An availability problem can be caused by
different factors – e.g., the server process
may not be up, a network problem may exist,
or there could be a configuration problem
with the DNS server.
Secs
An increase in response time can be caused
by several factors such as a server
bottleneck, a configuration problem with the
DNS server, a network problem, etc.
Whether the TCP connection
is available
Response time:
Time taken (in seconds) by
the server to respond to a
request.
2.1.5.3
Interpretation
Application Process Test
The Processes test monitors the server daemon processes and their resource usage. Often, the unavailability of a
server daemon is an error condition. In some cases, if specific processes are running or too many of such processes
are running, this may indicate an error condition. For example, in a Citrix environment, a process called cmstart.exe
is part of the Citrix login process. When logins are working well, there will be very few cmstart.exe processes running
on a server. However, when users experience slow logins or have difficulty in launching applications on a Citrix
84
MONITORING UNIX SERVERS
Presentation Server, many cmstart.exe processes are observed. The Application Process test is used to monitor
processes like cmstart that are not expected to be running on a server, but which show an unusual change in the
number of processes or their resource usage when problem situations occur.
The Application Process test is disabled by default.
To enable the test, go to the ENABLE / DISABLE TESTS page using the menu sequence : Agents -> Tests ->
Enable/Disable, pick the desired Component type, set Performance as the Test type, choose the test from the
DISABLED TESTS list, and click on the << button to move the test to the ENABLED TESTS list. Finally, click the Update
button.
Purpose
To monitor processes that are not expected to be running on a server (like cmstart.exe on Citrix),
but which show an unusual change in the number of processes or their resource usage when
problem situations occur
Target of the
test
Any of the aforesaid component-types
Agent
deploying the
test
An internal agent
Configurable
parameters
for the test
1.
TEST PERIOD - How often should the test be executed
2.
HOST - The host for which the test is to be configured
3.
PORT - The port to which the specified HOST listens
4.
PROCESS - In the PROCESS text box, enter a comma separated list of names:pattern
pairs which identify the process(es) associated with the server being considered.
processName is a string that will be used for display purposes only. processPattern is an
expression of the form - *expr* or expr or *expr or expr* or *expr1*expr2*... or
expr1*expr2, etc. A leading '*' signifies any number of leading characters, while a trailing '*'
signifies any number of trailing characters. For example, in a Citrix environment, a process
called cmstart.exe is part of the Citrix login process. When logins are working well, there will
be very few cmstart.exe processes running on a server. However, when users experience
slow logins or have difficulty in launching applications on a Citrix Presentation Server, many
cmstart.exe processes are observed. This process hence requires monitoring. Similarly,
users might also want to be alerted if any instance of the dreaded virus drwatson.exe is
executing on the system. Therefore, the PROCESS configuration in this case will be:
Citrixstartprocess:*cmstart*,Virus:*drwatson* . Other special characters such as slashes (\)
can also be used while defining the process pattern. Typically, slashes (\) are used when
the configured process pattern includes the full directory path to the process to be
monitored.
To determine the process pattern to use for your application, on Windows environments,
look for the process name(s) in the Task Manager -> Processes selection. To determine the
process pattern to use on Unix environments, use the ps command (e.g., the command "ps
-e -o pid,args" can be used to determine the processes running on the target system; from
this, choose the processes of interest to you).
Also, note that the PROCESS parameter is case-sensitive in Unix environments.
85
MONITORING UNIX SERVERS
5.
USER - By default, this parameter has a value "none"; this means that the test monitors all
processes that match the configured patterns, regardless of the user executing them. If you
want the test to monitor the processes for specific users alone, then, on Unix platforms,
specify a comma-separated list of users to be monitored in the USER text box. For
instance: john,elvis,sydney
While monitoring Windows hosts on the other hand, your USER configuration should be a
comma-separated list of "domain name-user name" pairs, where every pair is expressed in
the following format: Domainname\Username. For example, to monitor the processes of
user john and elvis who belong to domain mas, your USER specification should be:
mas\john,mas\elvis. Also, on a Windows host, you will find system processes running on the
following user accounts: SYSTEM, LOCAL SERVICE, and NETWORK SERVICE. While
configuring these USER accounts, make sure the Domainame is always NT AUTHORITY. In
this case therefore, your USER specification will be: NT AUTHORITY\SYSTEM,NT
AUTHORITY\LOCAL SERVICE,NT AUTHORITY\NETWORK SERVICE.
If multiple PROCESSes are configured for monitoring and multiple USERs are also
configured, then the test will check whether the first process is run by the first user, the
second process by the second user, and so on. For instance, if the PROCESSes configured
are java:java.exe,apache:*httpd* and the USERs configured are john,elvis, then the test
will check whether user john is running the process java, and user elvis is running the
process apache. Similarly, if multiple PROCESSes are configured, but a single USER alone
is configured, then the test will check whether the specified USER runs each of the
configured PROCESSes. However, if you want to check whether a single process, say
java.exe, is run by multiple users - say, james and jane - then, you have to do the
following:
Your USER specification should be: james,jane (if the target host is a Unix host),
or <Domainname>\james,<Domainname>\jane (if the target host is a Windows
host)
Your PROCESS configuration should be: Process1:java.exe,Process2:java.exe.
The number of processes in this case should match the number of users.
Such a configuration will ensure that the test checks for the java.exe process for
both the users, james and jane.
6.
CORRECT - Increased uptime and lower mean time to repair are critical to ensuring that IT
infrastructures deliver a high quality of service to users. Towards this end, the eG Enterprise
suite embeds an optional auto-correction capability that enables eG agents to automatically
correct problems in the environment, as soon as they occur. With this capability, as and
when an abnormal situation is detected, an eG agent can initiate corrective actions
automatically to resolve the problem. Automatic correction without the need for manual
intervention by IT operations staff reduces service downtime and improves operational
efficiency. By default, the auto-correction capability is available in the eG Enterprise suite for
the Number of processes running measure of Processes test, and the Service availability
measure of the WindowsServices test. You can enable this capability for the
ApplicationProcess test, to correct a problem condition pertaining to a particular measure
reported by that test. To enable the auto-correction capability for the ApplicationProcess
test, first, select the TRUE option against the CORRECT parameter in this page (by
default, FALSE will be selected here).
86
MONITORING UNIX SERVERS
7.
ALARMTYPE - Upon selecting the true option, three new parameters, namely,
ALARMTYPE, USERPARAMS, and CORRECTIVESCRIPT will appear. You can set the
corrective script to execute when a specific type of alarm is generated, by selecting an
option from the ALARMTYPE list box. For example, if the Critical option is chosen from
the ALARMTYPE list box, then the corrective script will run only when a critical alarm for
the ApplicationProcess test is generated. Similarly, if the Critical/Major option is chosen,
then the corrective script will execute only when the eG Enterprise system generates critical
or major alarms for the ApplicationProcess test. In order to ensure that the corrective script
executes regardless of the alarm type, select the Critical/Major/Minor option.
8.
USERPARAMS - The user-defined parameters that are to be passed to the corrective script
are specified in the USERPARAMS text box. One of the following formats can be applied to
the USERPARAMS specification:
exec@processName:command: In this specification, processName is the display
name of the process pattern specified against the PROCESS parameter, and
command is the command to be executed by the default script when there is a
problem condition pertaining to the processName.
command: In this specification, command signifies the command to be executed
when there is a problem condition pertaining to any of configured processes. Such
a format best suits situations where only a single process has been configured for
monitoring, or, a single command is capable of starting all the configured
processes.
Note:
The USERPARAMS specification should be placed within double quotes if this
value includes one or more blank spaces.
Note that if a processName configured in the PROCESS parameter does not have
a corresponding entry in USERPARAMS (as discussed in format 1), then the
auto-correction capability will not be enabled for these processes.
9.
CORRECTIVESCRIPT - Administrators will have to build the auto-correction capability for
this test to address probable issues with it, by writing their own corrective script. To know
how to create custom auto-correction scripts, refer to the eG User Manual. The full path to
the corrective script should be specified here.
87
MONITORING UNIX SERVERS
10. WIDE - This parameter is valid on Solaris and Windows systems only.
On Solaris environments, if the value of the WIDE parameter is true, the eG agent will use
usr/ucb/ps instead of /usr/bin/ps to search for processes executing on the host.
/usr/ucb/ps provides a long output (> 80 characters), whereas /usr/bin/ps only
outputs the first 80 characters of the process path and its arguments. However, some
Solaris systems are configured with tightened security, which prevents the usr/ucb/ps
command to be executed by any and every user to the system - in other words, only predesignated users will be allowed to execute this command. The sudo (superuser do) utility
(see http://www.gratisoft.us/sudo/) can be used to allow designated users to execute this
command. If your system uses sudo to restrict access to the /usr/ucb/ps command, then
specify the value of the "wide" parameter to be "sudo". This will ensure that not only does
the agent use the /usr/ucb/ps command to monitor processes (like it would do if the
"wide" parameter were set to be true), but it would also use sudo to execute this command.
On Windows environments, by default, the eG agent uses perfmon to search for the
processes that match the configured patterns. Accordingly, the WIDE parameter is set to
false by default. Typically, a process definition in Windows includes the full path to the
process, the process name, and process arguments (if any). Perfmon however scans the
system only for process names that match the configured patterns – in other words, the
process path and arguments are ignored by perfmon. This implies that if multiple processes
on a Windows host have the same name as specified against PROCESSPATTERN, then
perfmon will only be able to report the overall resource usage across all these processes; it
will not provide any pointers to the exact process that is eroding the host’s resources. To
understand this better, consider the following example. Typically, Windows represents any
Java application executing on it as java.exe. Say, two Java applications are executing on a
Windows host, but from different locations. If java.exe has been configured for monitoring,
then by default, perfmon will report the availability and average resource usage of both the
Java applications executing on the host. If say, one Java application goes down, then
perfmon will not be able to indicate accurately which of the two Java applications is
currently inaccessible. Therefore, to enable administrators to easily differentiate between
processes with the same name, and to accurately determine which process is unavailable or
resource-hungry, the eG agent should be configured to perform its process searches based
on the process path and/or process arguments, and not just on the process name – in other
words, the eG agent should be configured not to use perfmon.
88
MONITORING UNIX SERVERS
To achieve this, first, set the WIDE parameter to true. This will instruct the eG agent to not
use perfmon to search for the configured process patterns. Once this is done, then, you can
proceed to configure a PROCESSPATTERN that includes the process arguments and/or the
process path, in addition to the process name. For instance, if both the Remote Access
Connection Manager service and the Terminal Services service on a Windows host, which
share the same name – svchost - are to be monitored as two different processes, then your
PROCESSPATTERN specification should be as follows:
Terminal:C:\WINDOWS\System32\svchost -k
DcomLaunch,Remote:C:\WINDOWS\system32\svchost.exe -k netsvcs
You can also use wildcard characters, wherever required. For instance, in the above case,
your PROCESSPATTERN can also be:
Terminal:*svchost -k DcomLaunch,Remote:*svchost.exe -k netsvcs
Similarly, to distinctly monitor two processes having the same name, but operating from
different locations, your specification can be:
JavaC:c:\javaapp\java.exe,JavaD:d:\app\java.exe
Note:
Before including process paths and/or arguments in your PROCESSPATTERN
configuration, make sure that the WIDE parameter is set to true. If not, the test
will not work.
If your PROCESSPATTERN configuration includes a process path that refers to
the Program Files directory, then make sure that you do not a include a ~ (tilde)
while specifying this directory name. For instance, your PROCESSPATTERN
specification should not be say, Adobe:C:\Progra~1\Adobe\AcroRd32.exe.
11. USEPS - This flag is applicable only for AIX LPARs. By default, on AIX LPARs, this test uses
the tprof command to compute CPU usage of the processes on the LPARs. Accordingly, the
USEPS flag is set to No by default. On some AIX LPARs however, the tprof command may
not function properly (this is an AIX issue). While monitoring such AIX LPARs therefore, you
can configure the test to use the ps command instead for metrics collection. To do so, set
the USEPS flag to Yes.
Note:
Alternatively, you can set the AIXusePS flag in the [AGENT_SETTINGS] section of the
eg_tests.ini file (in the <EG_INSTALL_DIR>\manager\config directory) to yes (default: no) to
enable the eG agent to use the ps command for CPU usage computations on AIX LPARs. If
this global flag and the USEPS flag for a specific component are both set to no, then the
test will use the default tprof command to compute CPU usage of processes executing on
AIX LPARs. If either of these flags is set to yes, then the ps command will perform the CPU
usage computations for such processes.
89
MONITORING UNIX SERVERS
In some high-security environments, the tprof command may require some special privileges
to execute on an AIX LPAR (eg., sudo may need to be used to run tprof). In such cases, you
can prefix the tprof command with another command (like sudo) or the full path to a script
that grants the required privileges to tprof. To achieve this, edit the eg_tests.ini file (in the
<EG_INSTALL_DIR>\manager\config directory), and provide the prefix of your choice against
the AixTprofPrefix parameter in the [AGENT_SETTINGS] section. Finally, save the file. For
instance, if you set the AixTprofPrefix parameter to sudo, then the eG agent will call the tprof
command as sudo tprof.
Outputs of the
test
Measurement
s made by the
test
One set of results per process pattern specified
Measurement
Processes running:
Measurement
Unit
Number
If there is a significant change in the value of
this measure, it is an indicator of a problem
situation.
Percent
A very high value could indicate that
processes corresponding to the specified
pattern are consuming excessive CPU
resources.
Percent
A sudden increase in memory utilization for a
process(es) may be indicative of memory
leaks in the application.
Number of instances of a
process(es) currently executing
on a host.
CPU utilization:
Percentage of CPU used by
executing process(es)
corresponding to the pattern
specified.
Memory utilization:
For one or more processes
corresponding to a specified set
of patterns, this value
represents the ratio of the
resident set size of the
processes to the physical
memory of the host system,
expressed as a percentage.
2.1.5.4
Interpretation
Log Monitor Test
This test monitors multiple log files for different patterns. This test is disabled by default. To enable this test, click
on the check box corresponding to the test name in the DISABLED TESTS list of the AGENTS – TESTS CONFIGURATION
page that appears when the Agents -> Tests -> Configure menu sequence is followed, and click the Update button
therein.
Purpose
Monitors multiple log files for different patterns
Target of the
test
Any host system
Agent
deploying the
test
An internal agent
90
MONITORING UNIX SERVERS
Configurable
parameters for
the test
1.
TEST PERIOD - How often should the test be executed
2.
HOST - The host for which the test is to be configured.
3.
PORT – The port at which the server listens
4.
ALERTFILE
- Specify the path to the log file to be monitored. For eg.,
/user/john/new_john.log. Multiple log file paths can be provided as a comma-separated list
- eg., /user/john/critical_egurkha.log,/tmp/log/major.log.
5.
Also, instead of a specific log file path, the path to the directory containing log files can be
provided - eg., /user/logs. This ensures that eG Enterprise monitors the most recent log
files in the specified directory. Specific log file name patterns can also be specified. For
example, to monitor the latest log files with names containing the strings 'dblogs' and
'applogs', the parameter specification can be, /tmp/db/*dblogs*,/tmp/app/*applogs* .
Here, '*' indicates leading/trailing characters (as the case may be). In this case, the eG
agent first enumerates all the log files in the specified path that match the given pattern,
and then picks only the latest log file from the result set for monitoring.
6.
Your
ALERTFILE
specification
can
also
be
of
the
following
format:
Name@logfilepath_or_pattern. Here, Name represents the display name of the path being
configured. Accordingly, the parameter specification for the 'dblogs' and 'applogs' example
discussed above can be: dblogs@/tmp/db/*dblogs*,applogs@/tmp/app/*applogs*. In this
case, the display names 'dblogs' and 'applogs' will alone be displayed as descriptors of this
test.
Every time this test is executed, the eG agent verifies the following:
Whether any changes have occurred in the size and/or timestamp of the log files
that were monitoring during the last measurement period;
Whether any new log files (that match the ALERTFILE specification) have been
newly added since the last measurement period;
If a few lines have been added to a log file that was monitored previously, then the eG
agent monitors the additions to that log file, and then proceeds to monitor newer log files
(if any). If an older log file has been overwritten, then, the eG agent monitors this log file
completely, and then proceeds to monitor the newer log files (if any).
7.
SEARCHPATTERN - Enter the specific patterns of messages to be monitored. The
pattern should be in the following format: <PatternName>:<Pattern>, where
<PatternName> is the pattern name that will be displayed in the monitor interface and
<Pattern> is an expression of the form - *expr* or expr or *expr or expr*, etc. A leading
'*' signifies any number of leading characters, while a trailing '*' signifies any number of
trailing characters.
For example, say you specify ORA:ORA-* in the SEARCHPATTERN text box. This indicates
that "ORA" is the pattern name to be displayed in the monitor interface. "ORA-*" indicates
that the test will monitor only those lines in the log file which start with the term "ORA-".
Similarly, if your pattern specification reads: offline:*offline, then it means that the pattern
name is offline and that the test will monitor those lines in the log file which end with the
term offline.
91
MONITORING UNIX SERVERS
A single pattern may also be of the form e1+e2, where + signifies an OR condition. That
is, the <PatternName> is matched if either e1 is true or e2 is true.
Multiple search patterns can be specified as a comma-separated list. For example:
ORA:ORA-*,offline:*offline*,online:*online
If the ALERTFILE specification is of the format Name@logfilepath, then the descriptor for
this test in the eG monitor interface will be of the format: Name:PatternName. On the
other hand, if the ALERTFILE specification consists only of a comma-separated list of log
file paths, then the descriptors will be of the format: LogFilePath:PatternName.
Also, if a comma-separated list of alert files is provided in the ALERTFILE text box in the
format Name@logfilepath, and you want to monitor one/more specific patterns of logs in
each alert file, then your specification would be of the format:
Name@<PatternName>:<Pattern>
For
instance,
say,
your
ALERTFILE
specification
is
as
follows:
dblogs@/tmp/db/*dblogs*,applogs@/tmp/app/*applogs* . Now, assume that you want to
monitor the following entries in the specified alert files:
Alert file
Pattern
dblogs
*error*
dblogs
Ora*
applogs
*warning
applogs
*ora-info*
The SEARCHPATTERN specification in this case will hence be as follows:
dblogs@error:*error*,dblogs@ora:ora*,applogs@warning:*warning,
info*
applogs@info:*ora-
If you want all the messages in a log file to be monitored, then your specification would
be: <PatternName>:*.
8.
LINES - Specify two numbers in the format x:y. This means that when a line in the log file
matches a particular pattern, then x lines before the matched line and y lines after the
matched line will be reported in the detail diagnosis output (in addition to the matched
line). The default value here is 0:0. Multiple entries can be provided as a comma-separated
list.
If you give 1:1 as the value for LINES, then this value will be applied to all the patterns
specified in the SEARCHPATTERN field. If you give 0:0,1:1,2:1 as the value for LINES
and if the corresponding value in the SEARCHPATTERN field is like ORA:ORA*,offline:*offline*,online:*online then:
0:0 will be applied to ORA:ORA-* pattern
1:1 will be applied to offline:*offline* pattern
2:1 will be applied to online:*online pattern
92
MONITORING UNIX SERVERS
9.
EXCLUDEPATTERN - Provide a comma-separated list of patterns to be excluded from
monitoring in the EXCLUDEPATTERN text box. For example *critical*,*exception* . By
default, this parameter is set to 'none'.
10. UNIQUEMATCH - By default, the UNIQUEMATCH parameter is set to FALSE, indicating
that, by default, the test checks every line in the log file for the existence of each of the
configured SEARCHPATTERNS. By setting this parameter to TRUE, you can instruct the
test to ignore a line and move to the next as soon as a match for one of the configured
patterns is found in that line. For example, assume that Pattern1:*fatal*,Pattern2:*error*
is the SEARCHPATTERN that has been configured. If UNIQUEMATCH is set to FALSE,
then the test will read every line in the log file completely to check for the existence of
messages embedding the strings 'fatal' and 'error'. If both the patterns are detected in the
same line, then the number of matches will be incremented by 2. On the other hand, if
UNIQUEMATCH is set to TRUE, then the test will read a line only until a match for one of
the configured patterns is found and not both. This means that even if the strings 'fatal'
and 'error' follow one another in the same line, the test will consider only the first match
and not the next. The match count in this case will therefore be incremented by only 1.
11. ROTATINGFILE - This flag governs the display of descriptors for this test in the eG
monitoring console.
If this flag is set to true and the ALERTFILE text box contains the full path to a specific
(log/text) file, then, the descriptors of this test will be displayed in the following format:
Directory_containing_monitored_file:<SearchPattern>. For instance, if the ALERTFILE
parameter is set to c:\eGurkha\logs\syslog.txt, and ROTATINGFILE is set to true, then,
your descriptor will be of the following format: c:\eGurkha\logs:<SearchPattern>. On the
other hand, if the ROTATINGFILE flag had been set to false, then the descriptors will be
of the following format: <FileName>:<SearchPattern> - i.e., syslog.txt:<SearchPattern>
in the case of the example above.
If this flag is set to true and the ALERTFILE parameter is set to the directory containing
log files, then, the descriptors of this test will be displayed in the format:
Configured_directory_path:<SearchPattern>. For instance, if the ALERTFILE parameter is
set to c:\eGurkha\logs, and ROTATINGFILE is set to true, then, your descriptor will be:
c:\eGurkha\logs:<SearchPattern>. On the other hand, if the ROTATINGFILE parameter
had been set to false, then the descriptors will be of the following format:
Configured_directory:<SearchPattern> - i.e., logs:<SearchPattern> in the case of the
example above.
If this flag is set to true and the ALERTFILE parameter is set to a specific file pattern,
then, the descriptors of this test will be of the following format:
<FilePattern>:<SearchPattern>. For instance, if the ALERTFILE parameter is set to
c:\eGurkha\logs\*sys*, and ROTATINGFILE is set to true, then, your descriptor will be:
*sys*:<SearchPattern>. In this case, the descriptor format will not change even if the
ROTATINGFILE flag status is changed.
93
MONITORING UNIX SERVERS
12. OVERWRITTENFILE - By default, this flag is set to false. Set this flag to true if log files do
not 'roll over' in your environment, but get overwritten instead. In such environments
typically, new error/warning messages that are captured will be written into the log file
that pre-exists and will replace the original contents of that log file; unlike when 'roll over'
is enabled, no new log files are created for new entries in this case. If the
OVERWRITTENFILE flag is set to true, then the test will scan the new entries in the log
file for matching patterns. However, if the flag is set to false, then the test will ignore the
new entries.
13. ROLLOVERFILE - By default, this flag is set to false. Set this flag to true if you want the
test to support the 'roll over' capability of the specified ALERTFILE. A roll over typically
occurs when the timestamp of a file changes or when the log file size crosses a predetermined threshold. When a log file rolls over, the errors/warnings that pre-exist in that
file will be automatically copied to a new file, and all errors/warnings that are captured
subsequently will be logged in the original/old file. For instance, say, errors and warnings
were originally logged to a file named error_log. When a roll over occurs, the content of
the file error_log will be copied to a file named error_log.1, and all new errors/warnings
will be logged in error_log. In such a scenario, since the ROLLOVERFILE flag is set to
false by default, the test by default scans only error_log.1 for new log entries and ignores
error_log. On the other hand, if the flag is set to true, then the test will scan both error_log
and error_log.1 for new entries.
If you want this test to support the 'roll over' capability described above, the following
conditions need to be fulfilled:
The ALERTFILE parameter has to be configured only with the name and/or path
of one/more alert files. File patterns or directory specifications should not be
specified in the ALERTFILE text box.
The roll over file name should be of the format: “<ALERTFILE>.1”, and this file
must be in the same directory as the ALERTFILE.
14. USEUTF8 - If UTF-8 encoding is to be used for reading the specified log file, then, set the
USEUTF8 flag to true. By default, this flag is set to false. If multiple log files are being
monitored, then, for each file, you will have to indicate whether UTF-8 encoding is to be
used for reading that file or not. For instance, assume that the ALERTFILE parameter is
set to dblogs@/tmp/db/dblogs.log,applogs@/tmp/app/applogs.log . Now, to instruct the
test to use UTF-8 encoding for reading the 'dblogs' log file and not to use the UTF-8
encoding while reading the 'applogs' log file, your USEUTF8 setting should be as follows:
true,false. Note that the number of values provided against the USEUTF8 parameter
should be equal to the number of log files being monitored. Also, note that if the
ALERTFILE being monitored has BOM, then the test will automatically use UTF-8
encoding to read that file, even if the USEUTF8 flag is set to false.
Note:
If your ALERTFILE specification consists of file patterns that include wildcard
characters (eg., /tmp/db/*dblogs*,/tmp/app/*applogs*), then the files that match such
patterns will only support the ANSI format, and not the UTF format, even if the UTF-8
parameter is set to true for such patterns.
94
MONITORING UNIX SERVERS
15. USEUTF16 - - If UTF-16 encoding is to be used for reading the specified log file, then, set
the USEUTF16 flag to true. By default, this flag is set to false. If multiple log files are
being monitored, then, for each file, you will have to indicate whether UTF-16 encoding is
to be used for reading that file or not. For instance, assume that the ALERTFILE
parameter is set to dblogs@/tmp/db/dblogs.log,applogs@/tmp/app/applogs.log. Now, to
instruct the test to use UTF-16 encoding for reading the 'dblogs' log file and not to use the
UTF-16 encoding while reading the 'applogs' log file, your USEUTF8 setting should be as
follows: true,false. Note that the number of values provided against the USEUTF16
parameter should be equal to the number of log files being monitored.
Note:
If your ALERTFILE specification consists of file patterns that include wildcard
characters (eg., /tmp/db/*dblogs*,/tmp/app/*applogs*), then the files that match such
patterns will only support the ANSI format, and not the UTF format, even if the UTF-16
parameter is set to true for such patterns.
16. CASESENSITIVE - This flag is set to No by default. This indicates that the test functions
in a 'case-insensitive' manner by default. This implies that, by default, the test ignores the
case of your ALERTFILE and SEARCHPATTERN specifications. If this flag is set to Yes
on the other hand, then the test will function in a 'case-sensitive' manner. In this case
therefore, for the test to work, even the case of your ALERTFILE and SEARCHPATTERN
specifications should match with the actuals.
17. ENCODEFORMAT – By default, this is set to none, indicating that no encoding format
applies by default. However, if the test has to use a specific encoding format for reading
from the specified ALERTFILE , then you will have to provide a valid encoding format
here - eg., UTF-8, UTF-16, etc. Where multiple log files are being monitored, you will have
to provide a comma-separated list of encoding formats – one each for every log file
monitored. Make sure that your encoding format specification follows the same sequence
as your ALERTFILE specification. In other words, the first encoding format should apply
to the first alert file, and so on. For instance, say that your alertfile specification is as
follows: D:\logs\report.log,E:\logs\error.log, C:\logs\warn_log. Assume that while UTF-8
needs to be used for reading from report.log , UTF-16 is to be used for reading from
warn_log . No encoding format need be applied to error.log. In this case, your
ENCODEFORMAT specification will be: UTF-8,none,UTF-16.
18. DD FREQUENCY - Refers to the frequency with which detailed diagnosis measures are to
be generated for this test. The default is 1:1. This indicates that, by default, detailed
measures will be generated every time this test runs, and also every time the test detects
a problem. You can modify this frequency, if you so desire. Also, if you intend to disable
the detailed diagnosis capability for this test, you can do so by specifying none against DD
FREQUENCY.
95
MONITORING UNIX SERVERS
19. DETAILED DIAGNOSIS - To make diagnosis more efficient and accurate, the eG
Enterprise suite embeds an optional detailed diagnostic capability. With this capability, the
eG agents can be configured to run detailed, more elaborate tests as and when specific
problems are detected. To enable the detailed diagnosis capability of this test for a
particular server, choose the On option. To disable the capability, click on the Off option.
The option to selectively enable/disable the detailed diagnosis capability will be available
only if the following conditions are fulfilled:
The eG manager license should allow the detailed diagnosis capability
Both the normal and abnormal frequencies configured for the detailed diagnosis
measures should not be 0.
Outputs of the
test
Measurements
made by the
test
One set of results for every ALERTFILE and SEARCHPATTERN combination
Measurement
Number of messages:
Measurement
Unit
Number
Indicates the number of
messages that were added
to the log when the test
was last executed.
Interpretation
The value of this measure is a clear indicator
of the number of “new” messages that have
come into the log of the monitored server.
The detailed diagnosis of this measure, if
enabled, provides the detailed descriptions of
the errors of the configured patterns.
2.2 Monitoring Solaris Servers
Use the Solaris monitoring model to monitor the overall health of the Solaris operating system, the resource usage of
the processes executing on it, and the network availability of the Solaris host. The Solaris model will be represented
by the same set of layers as the Linux monitoring model of Figure 2. 1. This section discusses the tests mapped to
each of the layers.
2.2.1
The Operating System Layer
Like the Linux model, the Operating System layer of the Solaris model too is mapped to a SystemDetails test that
tracks the CPU and memory utilization, and a DiskSpace test that monitors the disk utilization. Also, similar to the
Linux model, the Operating System layer of the Solaris model too measures memory usage, IO waits, swap usage,
and uptime of the host. All these tests have been discussed elaborately in Section 2.1.1 of this document.
96
MONITORING UNIX SERVERS
Figure 2.21: Tests that map to the Operating System layer of a Solaris server
The difference however lies in the DiskActivity test of the Solaris model. The metrics reported by this test are slightly
different for the Linux and Solaris models. The sub-section that follows will discuss this test alone.
2.2.1.1
Disk Activity Test
When executed on Windows, Solaris, AIX, and HP-UX systems, this test reports statistics pertaining to the
input/output utilization of each physical disk on a system.
Purpose
Reports statistics pertaining to the input/output utilization of each physical disk on a system
Target of the
test
Any host system
Agent
deploying the
test
An internal/remote agent
97
MONITORING UNIX SERVERS
Configurable
parameters for
the test
1.
TEST PERIOD - How often should the test be executed
2.
HOST - The host for which the test is to be configured.
3.
USEEXE - Setting the USEEXE flag to true, ensures that the disk activity metrics are
collected by executing a binary instead of dynamically linking to the Performance
instrumentation library. By default, this is set to false.
4.
DISKS- To obtain disk activity metrics for both logical and physical disks, enter all in the
DISKS text box. To collect metrics for physical disks, set the DISKS parameter to
Physical and to collect metrics for logical disks, set the parameter to Logical.
5.
USE SUDO – This parameter is of significance to Linux and Solaris platforms only. By
default, the USE SUDO parameter is set to No. This indicates that, by default, this test will
report the detailed diagnosis for the Disk busy measure of each disk partition being
monitored by executing the /usr/bin/iotop command or /usr/sbin/iotop command.
However, in some highly secure environments, this command cannot be executed directly.
In such cases, set this parameter to Yes. This will enable the eG agent to execute the
sudo/usr/bin/iotop command or sudo/usr/sbin/iotop and retrieve the detailed diagnosis of
the Disk busy measure.
6.
DETAILED DIAGNOSIS - To make diagnosis more efficient and accurate, the eG
Enterprise suite embeds an optional detailed diagnostic capability. With this capability, the
eG agents can be configured to run detailed, more elaborate tests as and when specific
problems are detected. To enable the detailed diagnosis capability of this test for a
particular server, choose the On option. To disable the capability, click on the Off option.
The option to selectively enable/disable the detailed diagnosis capability will be available
only if the following conditions are fulfilled:
The eG manager license should allow the detailed diagnosis capability
Both the normal and abnormal frequencies configured for the detailed diagnosis
measures should not be 0.
Note that detailed diagnosis measures will not be available for target hosts executing on
Solaris platforms.
Outputs of the
test
Measurements
made by the
test
One set of results for each physical disk on the host monitored
Measurement
Disk busy:
Measurement
Unit
Percent
Indicates the percentage of
elapsed time during which
the disk is busy processing
requests (i.e., reads or
writes).
Disk read time: Indicates
the average time in
seconds of a read of data
from the disk.
Secs
98
Interpretation
Comparing the percentage of time that the
different disks are busy, an administrator can
determine whether the application load is
properly balanced across the different disks.
MONITORING UNIX SERVERS
Disk write time:
Indicates the average time
in seconds of a write of
data from the disk.
Secs
Avg queue length:
Indicates the average
number of both read and
write requests that were
queued for the selected
disk during the sample
interval.
Number
Disk read rate:
Reads/Sec
A dramatic increase in this value may be
indicative of an I/O bottleneck on the server.
KB/Sec
A very high value indicates an I/O bottleneck
on the server.
Writes/Sec
A dramatic increase in this value may be
indicative of an I/O bottleneck on the server.
KB/Sec
A very high value indicates an I/O bottleneck
on the server.
Secs
A sudden rise in the value of this measure
can be attributed to a large amount of
information being input or output. A
consistent increase however, could indicate
an I/O processing bottleneck.
Secs
Ideally, the value of this measure should be
low.
Secs
The value of this measure is the sum of the
values of the Disk service time and Disk
queue time measures.
Indicates the number of
reads happening on a
logical disk per second.
Data read rate from
disk:
Indicates the rate at which
bytes are transferred from
the disk during read
operations.
Disk write rate:
Indicates the number of
writes happening on a local
disk per second.
Data write rate to disk:
Indicates the rate at which
bytes are transferred from
the disk during write
operations.
Disk service time:
Indicates the average time
that this disk took to
service each transfer
request ( i.e., the average
I/O operation time)
Disk queue time:
Indicates the average time
that transfer requests
waited idly on queue for
this disk.
Disk I/O time:
Indicates the avarage time
taken for read and write
operations of this disk.
A consistent increase in the value of this
measure could indicate a latency in I/O
processing.
99
MONITORING UNIX SERVERS
Note:
For this test to report measures on Unix systems, the sysstat package must be installed on the server (check for
the existence of the iostat command on the target system).
If the sysstat version installed on the target server is less than 4.0.7, the following measures also
will not be available – Data read rate from disk and Data write rate to disk.
The eG agent monitoring Solaris hosts can only measure the time for access to the disk (not
differentiating between read and write times). This is why, this test reports the Disk read time and
Disk write time to be the disk access time reported by the operating system
2.2.1.2
Tests Disabled by Default
Besides the tests depicted by Figure 2.21, the Operating System layer of a Solaris server is mapped to many other
tests that are disabled by default. You can enable these tests, by opening the AGENTS – TESTS CONFIGURATION page
(using the Agents -> Tests -> Configure menu sequence in the eG administrative interface), selecting the check box
against the test name in the DISABLED TESTS list, and clicking the Update button therein.
These tests have already been discussed in Section 2.1.1.13 of this document. In addition to these tests, a Cronlog
test is available for Solaris hosts alone.
2.2.1.2.1 Cron Jobs Test
cron is a time-based scheduling service, and is hence considered to be a convenient mechanism for running critical
jobs. On Solaris, to track when and how the scheduled jobs ran, you can enable the logging of cron jobs.
Subsequently, a log file is created in the /var/cron/log directory, to which every cron activity is logged.
In other Unix (non-Solaris) hosts however, to enable cron logging, you have to do the following:
1.
Create a separate wrapper script to execute each cron job. This script should also track the status, start time,
and end time of the cron job. For example, given below is a sample wrapper script named wcron2.sh.
#!/bin/sh
echo "Started Wrapper script - $0 - at `date` - $$"
’’ Cron Command here.
echo "Exit Code for - $0 is - $? - $$"
echo "Completed Wrapper script - $0 - at `date` - $$"
2.
Schedule the wrapper script to run at the same frequency in which you want the corresponding cron job to run.
When doing so, make sure that the wrapper script outputs a log file, which will contain the start time,
completed time, the script name and the status of the cron job. To achieve the above, use the following
command:
*/10 * * * * /tmp/wcron2.sh >> /var/log/wcron2.log 2>&1
100
MONITORING UNIX SERVERS
Here, 10 indicates that the wrapper script should run every 10 minutes. You can provide any value (in minutes)
here to indicate the frequency of the cron job.
/tmp/wcron2.sh is the full path to the wrapper script that has to be run at the specified frequency
/var/log/wcron2.log is the full path to the log file ( wcron2.log) to which the status, start time, end time, and
cron job name have to be written.
The log file should have the same name as the wrapper script that creates it. For instance, if
the wrapper script is named wcron2, the corresponding log file should be named wcron2.log.
>> symbol indicates that every time the wrapper script runs, the log file contents will be overwritten.
3.
The contents of the log file will be similar to the same cited below:
Started Wrapper script - /tmp/cronjob.sh - at Thu Oct 3 17:24:01 IST 2013 - 21946
cronjob .sh
Exit Code for - /tmp/cronjob.sh is - 0 - 21946
Completed Wrapper script - /tmp/cronjob.sh - at Thu Oct 3 17:24:01 IST 2013 21946
Once the cron log file is available, you can periodically track the success/failure of the scheduled cron jobs by
executing the Cron Jobs test. This test checks the cron log file at configured intervals and reports the status of the
cron jobs.
Purpose
Checks the cron log file for the status of the cron jobs
he Target of the
test
Any Unix host
Agent deploying
the test
An internal agent
Configurable
parameters for
the test
1.
TEST PERIOD - How often should the test be executed
2.
HOST - The host for which the test is to be configured.
3.
LOGFILEPATH - This test monitors the cron log file to determine the status of the cron
jobs. Therefore, in the LOGFILEPATH text box, specify the path to the folder that
contains the cron log file to be monitored. On Solaris, by default, this will be /var/cron/log.
On other Unix hosts, specify the log file location that you provided when scheduling the
execution of the wrapper script (refer to step 2 of procedure discussed in page 100 above).
Outputs of the
test
Measurements
made by the test
One set of results for the host monitored
Measurement
Measurement
Unit
101
Interpretation
MONITORING UNIX SERVERS
Scheduled jobs:
Number
Indicates the number of jobs
that are scheduled to run in
the
next
measurement
period.
Outstanding jobs:
Number
Indicates the number of jobs
that were started but not
completed during the last
measurement period.
Completed jobs:
This includes jobs that were started and those
that were still executing during the last
measurement period. A very high value could
be a cause for concern, and might require
further investigation.
Number
Indicates the number of jobs
that were completed during
the last measurement
period.
Failed jobs:
Number
The error status could be due to permission
issues, path issues, problem while executing
the job itself, etc.
Mins
A very high value of this measure could
indicate a problem condition.
Mins
A very high value of this measure could
indicate a problem condition.
Mins
A very high value of this measure could
indicate a problem condition.
Mins
A very high value of this measure could
indicate a problem condition.
Indicates the number of jobs
that were completed during
the last measurement
period, but with errors.
Max pending job time:
Indicates the maximum time
for which the jobs have
remained pending.
Max completion time:
Indicates the maximum time
taken by the jobs for
completion.
Avg pending job time:
Indicates the average time
for which jobs have
remained pending.
Avg completion time:
Indicates the average time
taken by the jobs for
completion.
Pending jobs:
Number
Indicates the number of
cron jobs that are
scheduled, but are yet to
start running.
102
MONITORING UNIX SERVERS
2.2.1.2.2 ZFS Pools Test
ZFS is a combined file system and logical volume manager designed by Sun Microsystems. The features of ZFS
include data integrity verification against data corruption modes, support for high storage capacities, integration of
the concepts of filesystem and volume management, snapshots and copy-on-write clones, continuous integrity
checking and automatic repair, RAID-Z and native NFSv4 ACLs.
ZFS uses the concept of storage pools to manage physical storage. Historically, file systems were constructed on top
of a single physical device. To address multiple devices and provide for data redundancy, the concept of a volume
manager was introduced to provide the image of a single device so that file systems would not have to be modified
to take advantage of multiple devices. This design added another layer of complexity and ultimately prevented
certain file system advances, because the file system had no control over the physical placement of data on the
virtualized volumes.
ZFS eliminates the volume management altogether. Instead of forcing you to create virtualized volumes, ZFS
aggregates devices into a storage pool. The storage pool describes the physical characteristics of the storage (device
layout, data redundancy, and so on), and acts as an arbitrary data store from which file systems can be created. File
systems are no longer constrained to individual devices, allowing them to share space with all file systems in the
pool. You no longer need to predetermine the size of a file system, as file systems grow automatically within the
space allocated to the storage pool. When new storage is added, all file systems within the pool can immediately use
the additional space without additional work.
High usage of disk space in a pool can cause a severe contention for disk resources amidst the file systems sharing
the space in the pool; this in turn results in slowdowns when users attempt to access data from these file systems. A
high level of I/O activity on or bandwidth usage by a storage pool can also slowdown disk accesses. To ensure that
such adversities do not occur, administrators need to constantly monitor the space usage and I/O operations of the
storage pools. The ZFS Pools test facilitates this. Using this test, administrators can closely track the space usage
and read-write operations to each storage pool, be proactively alerted to a potential space crisis in a pool, and
accurately isolate those pools that are experiencing abnormal levels of bandwidth usage and I/O.
Purpose
Helps administrators closely track the space usage and read-write operations to each storage
pool, proactively alerts them to a potential space crisis in a pool, and helps them accurately
isolate those pools that are experiencing abnormal levels of bandwidth usage and I/O
Target of the
test
A Solaris host
Agent deploying
the test
An internal agent
Configurable
parameters for
the test
1. TEST PERIOD - How often should the test be executed
Outputs of the
test
Measurements
made by the test
4.
HOST - The host for which the test is to be configured.
5.
PORT - Refers to the port used by the specified HOST. Here it is NULL.
One set of results for each storage pool configured
Measurement
Pool size:
Measurement
Unit
GB
Indicates the total size of
this pool.
103
Interpretation
The value of this measure is equal to the sum
of the sizes of all top-level virtual devices.
MONITORING UNIX SERVERS
Allocated space:
GB
Indicates the amount of
physical space allocated to
all datasets and internal
metadata in this pool.
Free space:
Note that this amount differs from the amount
of disk space as reported at the file system
level.
GB
Indicates the amount of
unallocated space in this
pool.
Capacity in use:
Percent
Indicates the amount of disk
space used, expressed as a
percentage of the total disk
space in this pool.
Ideally, the value of this measure should not
exceed 80%. If space usage exceeds this
threshold, consider using ZFS quotas and
reservations to keep it under check.
You can use the quota property to set a limit
on the amount of space a file system can use.
In addition, you can use the reservation
property to guarantee that some amount of
space is available to a file system.
You can also dynamically add space to a pool
by adding a new top-level virtual device.
Health:
The values that this measure can report, their
numeric equivalents, and their descriptions
have been discussed in the table below:
Indicates the current health
status of this pool.
104
Measure
Value
Numeric
Value
Description
Offline
0
The device has
been
explicitly
taken offline by
the administrator.
Online
1
The device or
virtual device is in
normal
working
order.
Degraded
2
The virtual device
has experienced a
failure but can still
function.
MONITORING UNIX SERVERS
Operations read:
Kilobytes/Sec
Indicates the rate at which
read I/O operations were
sent to the pool or device,
including metadata requests.
Operations write:
Unavail
3
The device or
virtual
device
cannot be opened.
Faulted
4
The device or
virtual device is
completely
inaccessible.
Removed
5
The device was
physically
removed while the
system
was
running.
High values of these measures are indicative
of high levels of I/O activity on a pool.
Compare the values of these measures across
pools to identify the I/O-intensive pools.
Kilobytes/Sec
Indicates the rate at which
write
I/O
operations
were sent to the pool or
device.
Read bandwidth:
Kilobytes/Sec
Indicates the bandwidth of
all read operations
(including metadata).
Write bandwidth:
Kilobytes/Sec
Indicates the bandwidth of
all write operations.
105
High values for these measures indicate high
bandwidth usage by a pool. By comparing the
values of these measures across pools, you
can isolate those pools that consume
bandwidth excessively, and also understand
when they spend too much bandwidth - when
reading? or writing?
MONITORING UNIX SERVERS
Scrub status:
ZFS Scrubs allows you to schedule and
manage scrubs on a ZFS volume. Performing a
ZFS scrub on a regular basis helps to identify
data integrity problems, detects silent data
corruptions caused by transient hardware
issues, and provides early alerts to disk
failures. If you have consumer-quality drives,
consider a weekly scrubbing schedule. If you
have datacenter-quality drives, consider a
monthly scrubbing schedule.
Indicates the status of ZFS
scrubs that may have been
performed on this pool
during the last 8 days.
Depending upon the amount of data, a scrub
can take a long time. Scrubs are I/O intensive
and can negatively impact performance. They
should be scheduled for evenings or weekends
to minimize the impact to users.
The values that this measure can take and
their corresponding numeric values have been
detailed below:
Measure Value
Numeric Value
Scrub completed
1
Scrub in progress |
resilver
2
Scrub in progress
3
Scrub repaired
4
None requested
5
Expired
6
Note:
By default, this measure reports one of the
Measure Values listed in the table above. The
graph of this measure however will represent
the scrub status using the numeric equivalents
only.
2.2.1.2.3 ZFS Virtual Devices Test
Each storage pool is comprised of one or more virtual devices. A virtual device is an internal representation of the
storage pool that describes the layout of physical storage and its fault characteristics. As such, a virtual device
represents the disk devices or files that are used to create the storage pool.
Slow, overloaded virtual devices can delay accesses to the ZFS, thereby causing the user experience with the file
system to suffer. This test enables administrators to isolate slow devices and understand how I/O load is distributed
across devices, so that administrators are forewarned of slowdowns and/or abnormal load conditions.
Purpose
Enables administrators to isolate slow devices and understand how I/O load is distributed across
devices, so that administrators are forewarned of slowdowns and/or abnormal load conditions
106
MONITORING UNIX SERVERS
Target of the
test
A Solaris host
Agent deploying
the test
An internal agent
Configurable
parameters for
the test
1.
TEST PERIOD - How often should the test be executed
2.
HOST - The host for which the test is to be configured.
3.
PORT - Refers to the port used by the specified HOST. Here it is NULL.
Outputs of the
test
Measurements
made by the test
One set of results for each virtual device in a storage pool
Measurement
Free space:
Measurement
Unit
MB
This amount differs from the amount of disk
space available to actual file systems by a
small margin due to internal implementation
details.
MB
This amount differs from the amount of disk
space available to datasets by a small margin.
Reads/Sec
High values of these measures are indicative
of high levels of I/O activity on a device.
Compare the values of these measures across
virtual devices to identify the I/O-intensive
devices.
Indicates the amount of
data currently stored in this.
Allocated space:
Indicates the amount of disk
space available in this
device.
Operations read:
Indicates the rate at which
read I/O operations were
sent to this device, including
metadata requests.
Operations write:
Interpretation
Writes/Sec
Indicates the rate at which
write I/O operations were
sent to this device.
Read bandwidth:
Reads/Sec
Indicates the bandwidth of
all read operations
(including metadata) to this
device.
Write bandwidth:
Writes/Sec
High values for these measures indicate high
bandwidth usage by a virtual device. By
comparing the values of these measures
across devices, you can isolate those devices
that consume bandwidth excessively, and also
understand when they consume too much
bandwidth - when reading? or writing?
Indicates the bandwidth of
all write operations to this
device.
2.2.1.2.4 Disk Usage Test
Dataset is the generic name that is used to refer to the following ZFS components: clones, file systems, snapshots,
and volumes. Each dataset is identified by a unique name in the ZFS namespace. Datasets are identified using the
107
MONITORING UNIX SERVERS
following format:
pool/path[@snapshot]
pool
Identifies the name of the storage pool that contains the dataset
path
Is a slash-delimited path name for the dataset component
snapshot
Is an optional component that identifies a snapshot of a dataset
A snapshot is a read-only copy of a file system or volume. A clone on the other hand is a writable volume or file
system whose initial contents are the same as the snapshot from which it was created. Both snapshots and clones do
not consume any disk space initially, but as and when changes are made to the underlying dataset, snapshots and
clones start using disk space. This implies that the existence of too many snapshots/clones or the presence of large
sized snapshots and clones can add significantly to the disk space consumption of a dataset, causing a serious
contention for disk space resources on the host! To conserve disk space usage therefore, administrators often resort
to configuring a quota limit for each dataset or enabling compression on a ZFS folder. But how will an administrator
ascertain the effectiveness of these configurations? This is where the ZFS Disk Usage test helps!
For every dataset on ZFS, this test reports the total space usage of the dataset, thus pointing you to those datasets
that are rapidly eroding storage space. Alongside, the test enables administrators to keep track of the quota limit set
for a dataset and the compression ratio achieved by a dataset, so that the impact of these configurations on the total
disk space usage of the dataset can be effectively assessed; the results of this analysis can later be used to fine-tune
the configurations! In addition, the test monitors the count of snapshots and clones created from each dataset and
reports the space usage of these snapshots and clones, thus leading you to why a particular dataset is consuming
too much space – is it because too many snapshots were created from that dataset? Is it because of the large size of
the snapshots? Is it owing to incessant cloning of the snapshots? Or is it due to the large size of the snapshot clones?
Purpose
For every dataset on ZFS, this test reports the total space usage of the dataset, thus pointing
you to those datasets that are rapidly eroding storage space. Alongside, the test enables
administrators to keep track of the quota limit set for a dataset and the compression ratio
achieved by a dataset, so that the impact of these configurations on the total disk space usage
of the dataset can be effectively assessed; the results of this analysis can later be used to finetune the configurations! In addition, the test monitors the count of snapshots and clones
created from each dataset and reports the space usage of these snapshots and clones, thus
leading you to why a particular dataset is consuming too much space – is it because too many
snapshots were created from that dataset? Is it because of the large size of the snapshots? Is it
owing to incessant cloning of the snapshots? Or is it due to the large size of the snapshot
clones?
Target of the
test
A Solaris host
Agent deploying
the test
An internal agent
Configurable
parameters for
the test
1.
TEST PERIOD - How often should the test be executed
2.
HOST - The host for which the test is to be configured.
3.
PORT - Refers to the port used by the specified HOST. Here it is NULL.
108
MONITORING UNIX SERVERS
Outputs of the
test
Measurements
made by the test
One set of results for each dataset
Measurement
Available space:
Measurement
Unit
GB
A high value is desired for this measure. You
can compare the value of this measure across
datasets to know which databse has very little
space available.
GB
Ideally, the value of this measure should be
low.
Indicates the amount of disk
space currently available to
this dataset and all its
children, assuming no other
activity in the pool.
Used space:
Indicates the amount of
space currently consumed
by this dataset and all its
descendents.
Referred space:
You can even compare the value of this
measure across datasets to identify the
dataset that is over-utilizing the disk space.
GB
This is the sum of Available space and Used
space.
Percent
A low value is desired for this measure. A
consistent rise in the value of this measure is a
cause for concern, as it indicates gradual
erosion of disk space by a dataset.
Indicates
the
total
space currently allocated to
this dataset.
Percentage of space
used:
Interpretation
Indicates
the
percentage of space used by
this dataset.
Compare space usage across datasets to know
which dataset is consuming disk space
excessively. To know why this dataset is
hogging disk space, check out the value
reported by the Total space used by snapshots
and Total space used by clones measures for
that dataset. This will indicate what is causing
the space crunch – snapshots of the dataset?
Or clones of the snapshots of the dataset?
Based on this analysis, you may want to
consider identifying and destroying some
snapshots and/or clones – say, the ones that
are no longer used actively - so as to free disk
space.
You may also want to take a look at the value
of the Quota and the Compression ratio
measures for that dataset to understand
whether/not altering the quota and/or
compression algorithm will help in reducing
disk space usage of the dataset.
Snapshots count:
Number
Indicates the number of
snapshots currently available
for this dataset.
109
By correlating Snapshots count with Total
space used by snapshots you can understand
whether too many snapshots of small sizes
were created for the dataset or few snapshots
MONITORING UNIX SERVERS
Total space used by
snapshots:
GB
In the event of a space crunch, you can also
compare the value of the Total space used by
snapshots with that of the Total space used by
clones measure to know what is occupying too
much space – snapshots? Or clones? Based
on this analysis, you may want to consider
identifying and destroying some snapshots
and/or clones – say, the ones that are no
longer used actively - so as to free disk space.
Indicates the total amount
of disk space currently used
by the snapshots of this
dataset.
Clones count:
Number
Indicates the number of
clones currently associated
with this dataset.
Total space used by the
clones:
of very large sizes.
GB
Indicates the total amount
of disk space currently used
by the clones associated
with this dataset.
110
By correlating Clones count with Total space
used by clones you can understand whether
too many clones of small sizes were created
for the dataset or few clones of very large
sizes.
In the event of a space crunch, you can also
compare the value of the Total space used by
snapshots measure with that of the Total
space used by clones measure to know what is
occupying too much space – snapshots? Or
clones? Based on this analysis, you may want
to consider identifying and destroying some
snapshots and/or clones – say, the ones that
are no longer used actively - so as to free disk
space.
MONITORING UNIX SERVERS
Compression status:
‘Compression’ is a feature of ZFS, which when
turned on, saves disk space and improves
performance of the system. Internally, ZFS
allocates data using multiples of the device's
sector size, typically either 512 bytes or 4KB.
When compression is enabled, a smaller
number of sectors can be allocated for each
block.
Indicates the current
compression status of this
dataset.
If compression is enabled for the dataset, this
measure will report the value On. If
compression is disabled, this measure will
report the value Off.
The numeric values that correspond to these
measure values are listed below:
Measure Value
Numeric Value
On
1
Off
0
Note:
By default, this measure reports one of the
Measure Values listed in the table above. The
graph of this measure however will represent
the compression status using the numeric
equivalents only.
Compression ratio:
Ratio
Indicates the current
compression ratio of this
dataset.
A consistent drop in this value is disconcerting,
as it indicates that data blocks are not been
compressed efficiently, thereby increasing disk
space
consumption.
Under
such
circumstances, you may want to change the
compression algorithm in use. LJZB is the
default compression algorithm for ZFS.
Specifically, it provides fair compression, has a
high compression speed, has a high
decompression
speed
and
detects
incompressible data quickly. The other options
available are:
LZ4
GZIP
ZLE
A good alterative to LJZB would be LZ4. Tests
have revealed that LZ4 averages a 2.1:1
compression ratio, while GZIP is much slower.
111
MONITORING UNIX SERVERS
Quota:
GB
Indicates the current quota
limit set for this dataset.
Quota limits the amount of disk space a
dataset and its descendents can consume.
This property enforces a hard limit on the
amount of disk space used, including all space
consumed by descendents, such as file
systems and snapshots.
If the load on the dataset is consistently high,
you may want to increase the quota limit to
ensure that there is no loss of data. Likewise,
if the dataset is consuming space excessively
owing to too many unused snapshots/clones,
you may want to reduce the quota limit, so
that administrators are discouraged from
needlessly creating snapshots and clones.
Besides the above, hardware monitoring expertise can also be optionally built into the Operating System layer of a
Solaris host. Please refer to the Hardware Monitoring document for further details.
2.2.2
The Network Layer
The Network layer handles connectivity of the host system to the network, and includes packet traffic transmitted to
and from the server.
Figure 2.22: The tests that map to the Network layer of a Solaris server
Since the tests mapped to this layer have already been discussed in Section 2.1.2 of this document, let us move to
the next layer.
2.2.3
The Tcp Layer
As indicated earlier, a generic application relies on either the TCP or UDP protocols for data transport. While many
applications such as web server, web application servers, and database servers rely on the TCP protocol, some other
112
MONITORING UNIX SERVERS
applications such as DNS servers and WAP gateways rely on the UDP protocol. To track the health of the TCP layer
of a host, and its effect on the status of any application server, the eG Enterprise suite uses a Tcp test shown in
Figure 2.12.
Figure 2.23: The test mapped to the Tcp layer of a Solaris server
The test depicted by Figure 2.12 and the tests that are disabled by default for this layer have already been dealt with
in Section 2.1.3 of this document. Therefore, let us proceed to the next layer.
2.2.4
The Application Processes Layer
This layer depicts the states of the different processes that must be executing for the application service to be
available. The Processes test (see Figure 2.24) tracks various statistics pertaining to the different application
processes. Details of this test are provided below.
Figure 2.24: The Processes test that tracks the health of the Application Processes layer of a Solaris server
As the Processes test and the procedure to auto-configure the processes to be monitored have been discussed
elaborately in Section 2.1.5 of this document, let us proceed to the next section.
2.3 Monitoring AIX Servers
The AIX monitoring model offered by the eG Enterprise Suite provides in-depth insights into the performance of AIX
operating systems. This monitoring model is the same as depicted by Figure 2. 1.
The sub-sections that will follow discusses each of the layers in great detail.
113
MONITORING UNIX SERVERS
2.3.1
The Operating System Layer
Like the Linux model, the Operating System layer of the AIX model too is mapped to a SystemDetails test that tracks
the CPU and memory utilization, and a DiskSpace test that monitors the disk utilization. Also, similar to the Linux
model, the Operating System layer of the AIX model too measures CPU usage, memory usage, IO waits, swap usage,
and uptime of the host. All these tests have been discussed elaborately in Section 2.1.1 of this document.
Figure 2.25: Tests that map to the Operating System layer of an AIX server
The difference however lies in the SystemDetails test and the DiskActivity test of the AIX model. While you will find
subtle differences in the parameters of the SystemDetails test of Linux and AIX hosts, the metrics reported by this
test will slightly vary for the Linux and AIX models. The sub-section that follows will discuss these tests alone.
2.3.1.1
System Details Test
This operating system-specific test relies on native measurement capabilities of the operating system to collect
various metrics pertaining to the CPU and memory usage of a host system. The details of this test are as follows:
Purpose
To measure the CPU and memory usage of a host system
Target of the
test
Any host system
Agent
deploying the
test
An internal agent
114
MONITORING UNIX SERVERS
Configurable
parameters for
the test
1.
TEST PERIOD - How often should the test be executed
2.
HOST - The host for which the test is to be configured.
3.
DURATION - This parameter is of significance only while monitoring Unix hosts, and
indicates how frequently within the specified TEST PERIOD, the agent should poll the
host for CPU usage statistics.
4.
SUMMARY – This attribute is applicable to multi-processor systems only. If the Yes option
is selected, then the eG agent will report not only the CPU and memory utilization of each
of the processors, but it will also report the summary (i.e., average) of the CPU and
memory utilizations of the different processors. If the No option is selected, then the eG
agent will report only the CPU usage of the individual processors.
5.
USEIOSTAT – This parameter is of significance to Solaris platforms only. By default, the
USEIOSTAT flag is set to No. This indicates that, by default, SystemTest reports the CPU
utilization of every processor on the system being monitored, and also provides the
average CPU utilization across the processors. However, if you want SystemTest to report
only the average CPU utilization across processors and across user sessions, then set the
USEIOSTAT flag to Yes. In such a case, the processor-wise breakup of CPU utilization will
not be available.
6.
USEPS - This flag is applicable only for AIX LPARs. By default, on AIX LPARs, this test
uses the tprof command to compute CPU usage. Accordingly, the USEPS flag is set to No
by default. On some AIX LPARs however, the tprof command may not function properly
(this is an AIX issue). While monitoring such AIX LPARs therefore, you can configure the
test to use the ps command instead for metrics collection. To do so, set the USEPS flag to
Yes.
Note:
Alternatively, you can set the AIXusePS flag in the [AGENT_SETTINGS] section of the
eg_tests.ini file (in the <EG_INSTALL_DIR>\manager\config directory) to yes (default: no) to
enable the eG agent to use the ps command for CPU usage computations on AIX LPARs. If
this global flag and the USEPS flag for a specific component are both set to no, then the
test will use the default tprof command to compute CPU usage for AIX LPARs. If either of
these flags is set to yes, then the ps command will perform the CPU usage computations
for monitored AIX LPARs.
In some high-security environments, the tprof command may require some special
privileges to execute on an AIX LPAR (eg., sudo may need to be used to run tprof). In such
cases, you can prefix the tprof command with another command (like sudo) or the full path
to a script that grants the required privileges to tprof. To achieve this, edit the eg_tests.ini
file (in the <EG_INSTALL_DIR>\manager\config directory), and provide the prefix of your
choice against the AixTprofPrefix parameter in the [AGENT_SETTINGS] section. Finally, save
the file. For instance, if you set the AixTprofPrefix parameter to sudo, then the eG agent
will call the tprof command as sudo tprof.
115
MONITORING UNIX SERVERS
7.
INCLUDE WAIT - This flag is applicable to Unix hosts alone. On Unix hosts, CPU time is
also consumed when I/O waits occur on the host. By default, on Unix hosts, this test does
not consider the CPU utilized by I/O waits while calculating the value of the CPU utilization
measure. Accordingly, the INCLUDE WAIT flag is set to No by default. To make sure that
the CPU utilized by I/O waits is also included in CPU usage computations on Unix hosts, set
this flag to Yes.
8.
ENABLE MEMORY DIAGNOSIS - By default, the ENABLE MEMORY DIAGNOSIS flag is
set to NO, indicating that detailed diagnosis will not be available for the Free memory
measure reported by this test by default. If you want to view the detailed diagnosis of the
Free memory measure - i.e., to view the top 10 processes on the target host that are
utilizing memory excessively - you can change this flag to YES.
9.
DETAILED DIAGNOSIS - To make diagnosis more efficient and accurate, the eG
Enterprise suite embeds an optional detailed diagnostic capability. With this capability, the
eG agents can be configured to run detailed, more elaborate tests as and when specific
problems are detected. To enable the detailed diagnosis capability of this test for a
particular server, choose the On option. To disable the capability, click on the Off option.
The option to selectively enable/disable the detailed diagnosis capability will be available
only if the following conditions are fulfilled:
The eG manager license should allow the detailed diagnosis capability
Both the normal and abnormal frequencies configured for the detailed diagnosis
measures should not be 0.
Outputs of the
test
Measurements
made by the
test
One set of results for each host monitored
Measurement
CPU utilization:
Measurement
Unit
Percent
A high value could signify a CPU bottleneck.
The CPU utilization may be high because a
few processes are consuming a lot of CPU, or
because there are too many processes
contending for a limited resource. Check the
currently running processes to see the exact
cause of the problem.
Percent
An unusually high value indicates a problem
and may be due to too many system-level
tasks executing simultaneously.
Number
A value consistently greater than 2 indicates
that many processes could be simultaneously
contending for the processor.
This
measurement
indicates the percentage of
utilization of the CPU time
of the host system.
System CPU utilization:
Indicates the percentage of
CPU time spent for systemlevel processing.
Run queue length:
Indicates the instantaneous
length of the queue in
which threads are waiting
for the processor cycle.
This length does not
include the threads that are
currently being executed.
Interpretation
116
MONITORING UNIX SERVERS
Blocked processes:
Indicates the number of
processes blocked for I/O,
paging, etc.
Number
A high value could indicate an I/O problem
on the host (e.g., a slow disk).
Swap memory:
MB
An unusually high value for the swap usage
can indicate a memory bottleneck. Check the
memory utilization of individual processes to
figure out the process(es) that has (have)
maximum memory consumption and look to
tune their memory usages and allocations
accordingly.
MB
This measure typically indicates the amount
of memory available for use by applications
running on the target host.
On Windows systems, this
measurement denotes the
committed
amount
of
virtual
memory.
This
corresponds to the space
reserved for virtual memory
on disk paging file(s). On
Solaris systems, this metric
corresponds to the swap
space currently available.
On HPUX and AIX systems,
this metric corresponds to
the amount of active virtual
memory (it is assumed that
one
virtual
page
corresponds to 4 KB of
memory
in
this
computation).
Free memory: Indicates
the free memory available.
On Unix operating systems (AIX and Linux),
the operating system tends to use parts of
the available memory for caching files,
objects, etc. When applications require
additional memory, this is released from the
operating
system
cache.
Hence,
to
understand the true free memory that is
available to applications, the eG agent
reports the sum of the free physical memory
and the operating system cache memory size
as the value of the Free memory measure
while monitoirng AIX and Linux operating
systems.
The detailed diagnosis of this measure, if
enabled, lists the top 10 processes
responsible
for
maximum
memory
consumption on the host.
Note:
For multi-processor systems, where the CPU statistics are reported for each processor on the system, the
statistics that are system-specific (e.g., run queue length, free memory, etc.) are only reported for the
"Summary" descriptor of this test.
117
MONITORING UNIX SERVERS
2.3.1.2
Disk Activity Test
When executed on Windows, Solaris, AIX, and HP-UX systems, this test reports statistics pertaining to the
input/output utilization of each physical disk on a system.
Purpose
Reports statistics pertaining to the input/output utilization of each physical disk on a system
Target of the
test
Any host system
Agent
deploying the
test
An internal agent
Configurable
parameters for
the test
1.
TEST PERIOD - How often should the test be executed
2.
HOST - The host for which the test is to be configured.
3.
USEEXE - Setting the USEEXE flag to true, ensures that the disk activity metrics are
collected by executing a binary instead of dynamically linking to the Performance
instrumentation library. By default, this is set to false.
4.
DISKS- To obtain disk activity metrics for both logical and physical disks, enter all in the
DISKS text box. To collect metrics for physical disks, set the DISKS parameter to
Physical and to collect metrics for logical disks, set the parameter to Logical.
5.
DETAILED DIAGNOSIS – This parameter does not apply to AIX hosts.
Outputs of the
test
Measurements
made by the
test
One set of results for each host monitored
Measurement
Disk busy:
Measurement
Unit
Percent
Comparing the percentage of time that the
different disks are busy, an administrator can
determine whether the application load is
properly balanced across the different disks.
KB/Sec
A very high value indicates an I/O bottleneck
on the server.
KB/Sec
A very high value indicates an I/O bottleneck
on the server.
Indicates the percentage of
elapsed time during which
the disk is busy processing
requests (i.e., reads or
writes).
Data read rate from
disk:
Interpretation
Indicates the rate at which
bytes are transferred from
the disk during read
operations.
Data write rate to disk:
Indicates the rate at which
bytes are transferred from
the disk during write
operations.
118
MONITORING UNIX SERVERS
Disk service time:
Secs
A sudden rise in the value of this measure
can be attributed to a large amount of
information being input or output. A
consistent increase however, could indicate
an I/O processing bottleneck.
Secs
Ideally, the value of this measure should be
low.
Secs
The value of this measure is the sum of the
values of the Disk service time and Disk
queue time measures.
Indicates the average time
that this disk took to
service each transfer
request ( i.e., the average
I/O operation time)
Disk queue time:
Indicates the average time
that transfer requests
waited idly on queue for
this disk.
Disk I/O time:
Indicates the avarage time
taken for read and write
operations of this disk.
Disk read rate:
A consistent increase in the value of this
measure could indicate a latency in I/O
processing.
Reads/Sec
A dramatic increase in this value may be
indicative of an I/O bottleneck on the server.
Writes/Sec
A dramatic increase in this value may be
indicative of an I/O bottleneck on the server.
Indicates the number of
reads happening on a
logical disk per second.
Disk write rate:
Indicates the number of
writes happening on a local
disk per second.
Avg queue length:
Indicates the average
number of both read and
write requests that were
queued for the selected
disk during the sample
interval.
Number
Note:
For this test to report measures on Unix systems, the sysstat package must be installed on the
server (check for the existence of the iostat command on the target system).
If the sysstat version installed on the target server is less than 4.0.7, the following measures also
will not be available – Data read rate from disk and Data write rate to disk.
Detailed diagnosis will not be available for systems operating on AIX platforms.
119
MONITORING UNIX SERVERS
2.3.1.3
Tests Disabled by Default
Besides the tests depicted by Figure 2. 1, the Operating System layer of an AIX server is mapped to many other tests
that are disabled by default. You can enable these tests, by opening the AGENTS – TESTS CONFIGURATION page (using
the Agents -> Tests -> Configure menu sequence in the eG administrative interface), selecting the check box against
the test name in the DISABLED TESTS list, and clicking the Update button therein.
These tests have already been discussed in Section 2.1.1.13 of this document. In addition to these tests, a Tunnable
Parameters test is available for AIX hosts alone.
2.3.1.3.1 Tunable Parameters Test
This test will work on AIX hosts only. The test reports how well the AIX system is utilizing the virtual memory.
Purpose
Reports how well the AIX system is utilizing the virtual memory
Target of the
test
An AIX host
Agent
deploying the
test
An internal/remote agent
Configurable
parameters for
the test
1.
TESTPERIOD - How often should the test be executed
2.
HOST - The host for which the test is to be configured.
Outputs of the
test
One set of results for the AIX host being monitored
Measurements
made by the
test
Measurement
Unit
Measurement
Real memory pages:
Interpretation
Kbyes
4 Kb equals to 1 page.
Number
This number excludes the pages used for
VMM(Virtual memeory manager) internal
pages, and the pages used for the pinned
part of the kernel text.
Indicates the size of the real
memory in KBytes.
Lruable pages:
Indicates the number of 4 KB
pages
considered
for
replacement.
Free pages:
Number
Indicates the number of 4 KB
pages currently used by the file
cache.
Memory pools:
Indicates
the
memory pools.
Number
number
of
Pinned pages:
Number
Indicates the number of pinned
4KB pages.
120
MONITORING UNIX SERVERS
Pinned memory:
Percent
Indicates the tuning parameter
(managed
using
vmo)
specifying the percentage of
real memory which can be
pinned.
Minimum
memory:
persistent
Percent
This specifies the point below which file
pages are protected from the re-page
algorithm.
Percent
This specifies the point above which the
page stealing algorithm steals only file
pages.
This measure indicates the
tuning parameter (managed
using vmo) in percentage of
real memory.
Maximum
memory:
persistent
Indicates the Tuning parameter
(managed using vmo) in
percentage of real memory.
Persistent file cache:
Percent
Indicates the percentage of
memory currently used by the
file cache.
Currently used file cache
memory:
Number
Indicates the number of pages
that are currently used by the
file cache.
Memory
used
compressed pages:
by
Number
Indicates the percentage of
memory that are relatively
compressed.
Compressed memory pages:
Number
Indicates the number of unused
pages
that
are
relatively
compressed and stored in
memory.
Memory occupied by client
pages:
Number
Indicates the number of unused
pages
that
are
relatively
compressed and stored in
memory.
121
MONITORING UNIX SERVERS
Maximum memory for client
pages:
Number
Indicates a limit on the
maximum amount of memory
that should be used to cache
non-computational client pages;
It is the maximum percentage
of memory which can be used
for client pages.
Client pages:
Because all non-computational client pages
are a subset of the total number of noncomputational permanent storage pages,
the maxclient limit must always be less than
or equal to the maxperm limit.
Number
Indicates the number of client
pages.
Pageouts
scheduled
client file systems:
for
Number
Indicates
the
number
of
pageouts scheduled for client
file systems.
Pending disk I/O requests
blocked:
Number
Pbufs are pinned memory buffers used to
hold I/O requests at the logical volume
manager layer.
Number
Psbufs are pinned memory buffers used to
hold I/O requests at the virtual memory
manager layer.
Number
Fsbufs are pinned memory buffers used to
hold I/O requests in the filesystem layer.
Number
NFS (Network File System) and VxFS
(Veritas) are client filesystems. Fsbufs are
pinned memory buffers used to hold I/O
requests in the filesystem layer.
Number
JFS2 is an external pager client filesystem.
Fsbuf are pinned memory buffers used to
hold I/O requests in the filesystem layer.
Indicates
the
number
of
pending disk I/O requests that
have been blocked since the
pbuf are not available.
Paging space I/O requests
blocked:
Indicates the number of paging
space I/O requests that have
been blocked since the psbufs
are not available.
Filesystem
blocked:
I/O
requests
Indicates
the
number
of
filesystem I/O requests blocked
because no fsbuf was available.
Client
filesystem
requests blocked:
I/O
Indicates the number of client
filesystem I/O requests blocked
because no fsbuf was available.
External
filesystem
blocked:
pager
client
I/O requests
Indicates
the
number
of
external pager client filesystem
I/O requests blocked because
no fsbuf was available.
122
MONITORING UNIX SERVERS
Besides the above, hardware monitoring expertise can also be optionally built into the Operating System layer of an
AIX host. Please refer to the Hardware Monitoring document for further details.
2.3.2
The Network Layer
The Network layer handles connectivity of the host system to the network, and includes packet traffic transmitted to
and from the server.
Figure 2.26: The tests that map to the Network layer of an AIX server
Since the tests mapped to this layer have already been discussed in Section 2.1.2 of this document, let us move to
the next layer.
2.3.3
The Tcp Layer
As indicated earlier, a generic application relies on either the TCP or UDP protocols for data transport. While many
applications such as web server, web application servers, and database servers rely on the TCP protocol, some other
applications such as DNS servers and WAP gateways rely on the UDP protocol. To track the health of the TCP layer
of a host, and its effect on the status of any application server, the eG Enterprise suite uses a Tcp test shown in
Figure 2.27.
123
MONITORING UNIX SERVERS
Figure 2.27: The test mapped to the Tcp layer of an AIX server
The test depicted by Figure 2.27 and the tests that are disabled by default for this layer have already been dealt with
in Section 2.1.3 of this document. Therefore, let us proceed to the next layer.
2.3.4
The Application Processes Layer
This layer depicts the states of the different processes that must be executing for the application service to be
available. The Processes test (see Figure 2.28) tracks various statistics pertaining to the different application
processes.
Figure 2.28: The Processes test that tracks the health of the Application Processes layer of an AIX server
2.3.4.1
Processes Test
Application processes can be identified based on specific regular expression patterns. For example, web server
processes can be identified by the pattern *httpd*, while DNS server processes can be specified by the pattern
*named* where * denotes zero or more characters. For each such pattern, the process test reports a variety of CPU
and memory statistics.
Purpose
To measure statistics pertaining to one or more processes executing on a host
Target of the
test
Any application server
Agent
deploying the
test
An internal agent
124
MONITORING UNIX SERVERS
Configurable
parameters
for the test
1.
TEST PERIOD - How often should the test be executed
2.
HOST - The host for which the test is to be configured
3.
PORT - The port to which the specified HOST listens
4.
PROCESS - In the PROCESS text box, enter a comma separated list of names:pattern
pairs which identify the process(es) associated with the server being considered.
processName is a string that will be used for display purposes only. processPattern is an
expression of the form - *expr* or expr or *expr or expr* or *expr1*expr2*... or
expr1*expr2, etc. A leading '*' signifies any number of leading characters, while a trailing '*'
signifies any number of trailing characters. The pattern(s) used vary from one application to
another and must be configured per application. For example, for an iPlanet application
server (Nas_server), there are three processes named kcs, kjs, and kxs associated with the
application server. For this server type, in the PROCESS text box, enter "kcsProcess:*kcs*,
kjsProcess:*kjs*, kxsProcess:*kxs*, where * denotes zero or more characters. Other special
characters such as slashes (\) can also be used while defining the process pattern. For
example, if a server’s root directory is /home/egurkha/apache and the server executable
named httpd exists in the bin directory, then, the process pattern is
“*/home/egurkha/apache/bin/httpd*”.
Note:
The PROCESS parameter supports process patterns containing the ~ character.
To determine the process pattern to use for your application, on Windows environments,
look for the process name(s) in the Task Manager -> Processes selection. To determine the
process pattern to use on Unix environments, use the ps command (e.g., the command "ps
-e -o pid,args" can be used to determine the processes running on the target system; from
this, choose the processes of interest to you.)
Also, while monitoring processes on Windows, if the WIDE parameter of this test is set to
true, then your process patterns can include the full path to the process and/or the
arguments supported by the process. For instance, your PROCESSPATTERN specification
can be as follows:
Terminal:C:\WINDOWS\System32\svchost
DcomLaunch,Remote:C:\WINDOWS\system32\svchost.exe -k netsvcs
-k
Also, note that the PROCESS parameter is case-sensitive in Unix environments.
To save the time and effort involved in such manual process specification, eG Enterprise
offers an easy-to-use auto-configure option in the form of a View/Configure button that is
available next to the PROCESS text box. Refer to Section 2.1.5.1.1 of this document o
know how to use the auto-configure option.
5.
USER - The USER parameter will work only for Unix platforms and not Windows. By
default, this parameter has a value "none", which means the test does not look for a
process(es) for a specific user. If the value of the "user" parameter is not "none", then the
Processes test searches for all processes of a specific user.
125
MONITORING UNIX SERVERS
6.
CORRECT - Increased uptime and lower mean time to repair are critical to ensuring that IT
infrastructures deliver a high quality of service to users. Towards this end, the eG Enterprise
suite embeds an optional auto-correction capability that enables eG agents to automatically
correct problems in the environment, as soon as they occur. With this capability, as and
when an abnormal situation is detected, an eG agent can initiate corrective actions
automatically to resolve the problem. Automatic correction without the need for manual
intervention by IT operations staff reduces service downtime and improves operational
efficiency. By default, the auto-correction capability is available in the eG Enterprise suite for
the Processes running measure of Processes test, and the Service availability measure of
WindowsServices test. The eG Enterprise suite includes a default auto-correction script for
Processes test.
When a process that has been configured for monitoring stops, this script automatically
executes and starts the process. To enable the auto-correction capability for the Processes
test, first, select the TRUE option against the CORRECT parameter in this page (by
default, FALSE will be selected here).
7.
ALARMTYPE - Upon selecting the true option, three new parameters, namely,
ALARMTYPE, USERPARAMS, and CORRECTIVESCRIPT will appear. You can set the
corrective script to execute when a specific type of alarm is generated, by selecting an
option from the ALARMTYPE list box. For example, if the Critical option is chosen from
the ALARMTYPE list box, then the corrective script will run only when a critical alarm for
the Processes test is generated. Similarly, if the Critical/Major option is chosen, then the
corrective script will execute only when the eG Enterprise system generates critical or major
alarms for the Processes test. In order to ensure that the corrective script executes
regardless of the alarm type, select the Critical/Major/Minor option.
8.
USERPARAMS - The user-defined parameters that are to be passed to the corrective script
are specified in the USERPARAMS text box. One of the following formats can be applied to
the USERPARAMS specification:
exec@processName:command: In this specification, processName is the display
name of the process pattern specified against the PROCESS parameter, and
command is the command to be executed by the default script when the
process(es) represented by the processName stops. For example, assume that the
PROCESS parameter of Processes test has been configured in the following
manner:
Apache:*/opt/egurkha/manager/apache/bin/httpd*,Tomcat:*java*tomcat*, where
Apache and Tomcat are the processNames or display names of the configured
patterns. If auto-correction is enabled for these processes, then the
USERPARAMS specification can be as follows:
exec@Apache:/opt/egurkha/manager/apache/bin/apachectl start,Tomcat:
/opt/tomcat/bin/catalina.sh start
This indicates that if the processes configured under the processName "Apache"
stop (i.e. */opt/egurkha/manager/apache/bin/httpd* ), then the script will
automatically execute the command "/opt/egurkha/manager/apache/bin/apachectl
start" to start the processes. Similarly, if the "Tomcat" processes (i.e.
*java*tomcat*)
stop,
the
script
will
execute
the
command
"/opt/tomcat/bin/catalina.sh start" to start the processes.
126
MONITORING UNIX SERVERS
command: In this specification, command signifies the command to be executed when
any of the processes configured for monitoring, stop. Such a format best suits situations
where only a single process has been configured for monitoring, or, a single command is
capable of starting all the configured processes. For example, assume that the
PROCESS parameter has been configured to monitor IISWebSrv:*inetinfo*. Since only
one process requires monitoring, the first format need not be used for configuring the
USERPARAMS. Therefore, simplify specify the command, "net start World Wide Web
Publishing Service".
Note:
The USERPARAMS specification should be placed within double quotes if this value
includes one or more blank spaces (eg.,"Apache:/opt/egurkha/bin/apachectl
start").
Note that if a processName configured in the PROCESS parameter does not have a
corresponding entry in USERPARAMS (as discussed in format 1), then the autocorrection capability will not be enabled for these processes.
9.
CORRECTIVESCRIPT - Specify none in the CORRECTIVESCRIPT text box to use the
default auto-correction script. Administrators can build new auto-correction capabilities to
address probable issues with other tests, by writing their own corrective scripts. To know
how to create custom auto-correction scripts, refer to the eG User Manual.
10. WIDE - This parameter is valid on Solaris and Windows systems only.
On Solaris systems (before v11), if the value of the WIDE parameter is Yes, the eG agent
will use usr/ucb/ps instead of /usr/bin/ps to search for processes executing on the host. In
Solaris 11, the eG agent uses the /usr/bin/ps auxwww command to perform the process
search. The /usr/ucb/ps and the /usr/bin/ps auxwww commands provide a long output (>
80 characters), whereas /usr/bin/ps only outputs the first 80 characters of the process path
and its arguments. However, some Solaris systems are configured with tightened security,
which prevents the usr/ucb/ps and/or the /usr/bin/ps auxwww command to be executed by
any and every user to the system - in other words, only pre-designated users will be
allowed to execute this command. The sudo (superuser do) utility (see
http://www.gratisoft.us/sudo/) can be used to allow designated users to execute this
command. If your system uses sudo to restrict access to the commands that return a long
output, then set WIDE to Yes and then specify the value sudo for the
KEONIZEDSERVERCMD parameter. This will ensure that not only does the agent use the
/usr/ucb/ps and/or the /usr/bin/ps auxwww command (as the case may be) to monitor
processes (like it would do if the WIDE parameter were set to be Yes), but it would also
use sudo to execute this command.
127
MONITORING UNIX SERVERS
Note:
If the Processes test on Solaris 11 fails, then do the following:
Check whether the WIDE parameter is set to Yes.
If so, then make sure that the KEONIZEDSERVERCMD parameter is set
to sudo.
If the test still fails, then look for the following error in the error_log file
(that resides in the /opt/egurkha/agent/logs directory) on the eG agent host:
ERROR ProcessTest: ProcessTest failed to execute [sudo:
pam_authenticate: Conversation failure]
The aforesaid error occurs if the sudo command prompts for a password at
runtime. If you find such an error in the error_log file, then, open the
SUDOERS file on the target host and append an entry of the following
format to it:
Defaults:<eG_Install_Username> !authenticate
For instance, if eguser is the eG install user, then your entry will be:
Defaults:eguser !authenticate
This entry will make sure that you are no longer prompted for a password.
Save the file and restart the eG agent.
On Windows environments, by default, the eG agent uses perfmon to search for the
processes that match the configured patterns. Accordingly, the WIDE parameter is set to
false by default. Typically, a process definition in Windows includes the full path to the
process, the process name, and process arguments (if any). Perfmon however scans the
system only for process names that match the configured patterns – in other words, the
process path and arguments are ignored by perfmon. This implies that if multiple processes
on a Windows host have the same name as specified against PROCESSPATTERN, then
perfmon will only be able to report the overall resource usage across all these processes; it
will not provide any pointers to the exact process that is eroding the host’s resources. To
understand this better, consider the following example. Typically, Windows represents any
Java application executing on it as java.exe. Say, two Java applications are executing on a
Windows host, but from different locations.
If java.exe has been configured for monitoring, then by default, perfmon will report the
availability and average resource usage of both the Java applications executing on the host.
If say, one Java application goes down, then perfmon will not be able to indicate accurately
which of the two Java applications is currently inaccessible. Therefore, to enable
administrators to easily differentiate between processes with the same name, and to
accurately determine which process is unavailable or resource-hungry, the eG agent should
be configured to perform its process searches based on the process path and/or process
arguments, and not just on the process name – in other words, the eG agent should be
configured not to use perfmon.
128
MONITORING UNIX SERVERS
To achieve this, first, set the WIDE parameter to Yes This will instruct the eG agent to not
use perfmon to search for the configured process patterns. Once this is done, then, you can
proceed to configure a PROCESSPATTERN that includes the process arguments and/or
the process path, in addition to the process name. For instance, if both the Remote Access
Connection Manager service and the Terminal Services service on a Windows host, which
share the same name – svchost - are to be monitored as two different processes, then your
PROCESSPATTERN specification should be as follows:
Terminal:C:\WINDOWS\System32\svchost -k
DcomLaunch,Remote:C:\WINDOWS\system32\svchost.exe -k netsvcs
You can also use wildcard characters, wherever required. For instance, in the above case,
your PROCESSPATTERN can also be:
Terminal:*svchost -k DcomLaunch,Remote:*svchost.exe -k netsvcs
Similarly, to distinctly monitor two processes having the same name, but operating from
different locations, your specification can be:
JavaC:c:\javaapp\java.exe,JavaD:d:\app\java.exe
Note:
Before including process paths and/or arguments in your PROCESSPATTERN
configuration, make sure that the WIDE parameter is set to Yes. If not, the test
will not work.
If your PROCESSPATTERN configuration includes a process path that refers to
the Program Files directory, then make sure that you do not a include a ~ (tilde)
while specifying this directory name. For instance, your PROCESSPATTERN
specification should not be say, Adobe:C:\Progra~1\Adobe\AcroRd32.exe.
11. KEONIZEDSERVERCMD - On Solaris hosts, this test takes an additional
KEONIZEDSERVERCMD parameter. Keon is a security mechanism that can be used with a
multitude of operating systems to provide a centralized base for user account and password
management, user access and inactivity control, system integrity checking, and auditing. If
the Keon security model is in use on the Solaris host being monitored, then this test may
require special user privileges for executing the operating system commands. In such a
case, specify the exact command that the test is permitted to execute, in the
KEONIZEDSERVERCMD text box. For example, if the keon command to be executed by
the test is sudo, specify sudo in the KEONIZEDSERVERCMD text box. Alternatively, you
can even specify the full path to the sudo command in the KEONIZEDSERVERCMD text
box. On the other hand, if a Keon security model is not in place, then set the
KEONIZEDSERVERCMD parameter to none.
129
MONITORING UNIX SERVERS
12. USEPS - This flag is applicable only for AIX LPARs. By default, on AIX LPARs, this test uses
the tprof command to compute CPU usage of the processes on the LPARs. Accordingly, the
USEPS flag is set to No by default. On some AIX LPARs however, the tprof command may
not function properly (this is an AIX issue). While monitoring such AIX LPARs therefore, you
can configure the test to use the ps command instead for metrics collection. To do so, set
the USEPS flag to Yes.
Note:
Alternatively, you can set the AIXusePS flag in the [AGENT_SETTINGS] section of the
eg_tests.ini file (in the <EG_INSTALL_DIR>\manager\config directory) to yes (default: no) to
enable the eG agent to use the ps command for CPU usage computations on AIX LPARs. If
this global flag and the USEPS flag for a specific component are both set to no, then the
test will use the default tprof command to compute CPU usage of processes executing on
AIX LPARs. If either of these flags is set to yes, then the ps command will perform the CPU
usage computations for such processes.
In some high-security environments, the tprof command may require some special privileges
to execute on an AIX LPAR (eg., sudo may need to be used to run tprof). In such cases, you
can prefix the tprof command with another command (like sudo) or the full path to a script
that grants the required privileges to tprof. To achieve this, edit the eg_tests.ini file (in the
<EG_INSTALL_DIR>\manager\config directory), and provide the prefix of your choice against
the AixTprofPrefix parameter in the [AGENT_SETTINGS] section. Finally, save the file. For
instance, if you set the AixTprofPrefix parameter to sudo, then the eG agent will call the
tprof command as sudo tprof.
13. ISPASSIVE – If the value chosen is YES, then the server under consideration is a passive
server in a cluster. No alerts will be generated if the server is not running. Measures will be
reported as “Not applicable’ by the agent if the server is not up.
Outputs of the
test
Measurement
s made by the
test
One set of results per process pattern specified
Measurement
Processes running:
Measurement
Unit
Number
This value indicates if too many or too few
processes corresponding to an application are
executing on the host.
Percent
A very high value could indicate that
processes corresponding to the specified
pattern are consuming excessive CPU
resources.
Number of instances of a
process(es) currently executing
on a host.
CPU utilization:
Interpretation
Percentage of CPU used by
executing process(es)
corresponding to the pattern
specified.
130
MONITORING UNIX SERVERS
Memory utilization:
Percent
For one or more processes
corresponding to a specified set
of patterns, this value
represents the ratio of the
resident set size of the
processes to the physical
memory of the host system,
expressed as a percentage.
A sudden increase in memory utilization for a
process(es) may be indicative of memory
leaks in the application.
2.4 Monitoring HPUX Servers
Use the HPUX model provided by eG Enterprise to measure the overall health of the HPUX operating systems. Like all
other Unix-based models, the HPUX model too is represented using the same hierarchical layer structure as the Linux
model.
The sections that follow will discuss each of these layers in great detail.
2.4.1
The Operating System Layer
Like the Linux model, the Operating System layer of the HPUX model too is mapped to a SystemDetails test that
tracks the CPU and memory utilization, and a DiskSpace test that monitors the disk utilization. Also, similar to the
Linux model, the Operating System layer of the HPUX model too measures memory usage, IO waits, swap usage,
and uptime of the host. All these tests have been discussed elaborately in Section 2.1.1 of this document.
Figure 2.29: Tests that map to the Operating System layer of an HPUX server
131
MONITORING UNIX SERVERS
The difference however lies in the DiskActivity test of the HPUX model. The metrics reported by this test are slightly
different for the Linux and HPUX models. The sub-section that follows will discuss this test alone.
2.4.1.1
Disk Activity Test
When executed on Windows, Solaris, AIX, and HP-UX systems, this test reports statistics pertaining to the
input/output utilization of each physical disk on a system.
Purpose
To measure the input/output utilization of each physical disk on a system
Target of the
test
Any host system
Agent
deploying the
test
An internal agent
Configurable
parameters for
the test
1.
TEST PERIOD - How often should the test be executed
2.
HOST - The host for which the test is to be configured.
3.
USEEXE - Setting the USEEXE flag to true, ensures that the disk activity metrics are
collected by executing a binary instead of dynamically linking to the Performance
instrumentation library. By default, this is set to false.
4.
DETAILED DIAGNOSIS - To make diagnosis more efficient and accurate, the eG
Enterprise suite embeds an optional detailed diagnostic capability. With this capability, the
eG agents can be configured to run detailed, more elaborate tests as and when specific
problems are detected. To enable the detailed diagnosis capability of this test for a
particular server, choose the On option. To disable the capability, click on the Off option.
The option to selectively enable/disable the detailed diagnosis capability will be available
only if the following conditions are fulfilled:
The eG manager license should allow the detailed diagnosis capability
Both the normal and abnormal frequencies configured for the detailed diagnosis
measures should not be 0.
Outputs of the
test
Measurements
made by the
test
One set of results for each host monitored
Measurement
Measurement
Unit
Disk read time: Indicates
the average time in
seconds of a read of data
from the disk.
Secs
Disk write time:
Indicates the average time
in seconds of a write of
data from the disk.
Secs
Disk read rate:
Operations/Sec
Indicates the number of
reads happening on a
logical disk per second.
132
Interpretation
A dramatic increase in this value may be
indicative of an I/O bottleneck on the server.
MONITORING UNIX SERVERS
Data read rate from
disk:
KB/Sec
A very high value indicates an I/O bottleneck
on the server.
Operations/Sec
A dramatic increase in this value may be
indicative of an I/O bottleneck on the server.
KB/Sec
A very high value indicates an I/O bottleneck
on the server.
Secs
A sudden rise in the value of this measure
can be attributed to a large amount of
information being input or output. A
consistent increase however, could indicate
an I/O processing bottleneck.
Secs
Ideally, the value of this measure should be
low.
Secs
The value of this measure is the sum of the
values of the Disk service time and Disk
queue time measures.
Indicates the rate at which
bytes are transferred from
the disk during read
operations.
Disk write rate:
Indicates the number of
writes happening on a local
disk per second.
Data write rate to disk:
Indicates the rate at which
bytes are transferred from
the disk during write
operations.
Disk service time:
Indicates the average time
that this disk took to
service each transfer
request ( i.e., the average
I/O operation time)
Disk queue time:
Indicates the average time
that transfer requests
waited idly on queue for
this disk.
Disk I/O time:
Indicates the avarage time
taken for read and write
operations of this disk.
A consistent increase in the value of this
measure could indicate a latency in I/O
processing.
133
MONITORING UNIX SERVERS
Note:
For this test to report measures on Unix systems, the sysstat package must be installed on the
server (check for the existence of the iostat command on the target system).
If the sysstat version installed on the target server is less than 4.0.7, the following measures also
will not be available – Data read rate from disk and Data write rate to disk.
As the HPUX operating system only provides the overall transfer rate to and from the disk, the eG
agent reports this value for both the Disk read rate and the Disk write rate. Likewise, the Data
read rate from disk and Data write rate to disk are also reported as the same values (i.e., equal to
the data transfer rate from the disk). Likewise, the Disk read time and Disk write time are also
reported as the same values (i.e., equal to the seconds per average seek).
Detailed diagnosis will not be available for systems operating on HPUX platforms.
2.4.1.2
Tests Disabled by Default
Besides the tests depicted by Figure 2. 1, the Operating System layer of an HPUX server is mapped to many other
tests that are disabled by default. You can enable these tests, by opening the AGENTS – TESTS CONFIGURATION page
(using the Agents -> Tests -> Configure menu sequence in the eG administrative interface), selecting the check box
against the test name in the DISABLED TESTS list, and clicking the Update button therein.
These tests have already been discussed in Section 2.1.1.13 of this document.
Besides the above, hardware monitoring expertise can also be optionally built into the Operating System layer of an
HPUX host. Please refer to the Hardware Monitoring document for further details.
134
MONITORING UNIX SERVERS
2.4.2
The Network Layer
The Network layer handles connectivity of the host system to the network, and includes packet traffic transmitted to
and from the server.
Figure 2.30: The tests that map to the Network layer of an HPUX server
Since the tests mapped to this layer have already been discussed in Section 2.1.2 of this document, let us move to
the next layer.
2.4.3
The Tcp Layer
As indicated earlier, a generic application relies on either the TCP or UDP protocols for data transport. While many
applications such as web server, web application servers, and database servers rely on the TCP protocol, some other
applications such as DNS servers and WAP gateways rely on the UDP protocol. To track the health of the TCP layer
of a host, and its effect on the status of any application server, the eG Enterprise suite uses a Tcp test shown in
Figure 2.31.
Figure 2.31: The test mapped to the Tcp layer of an HPUX server
The test depicted by Figure 2.31 and the tests that are disabled by default for this layer have already been dealt with
in Section 2.1.3 of this document. Therefore, let us proceed to the next layer.
135
MONITORING UNIX SERVERS
2.4.4
The Application Processes Layer
This layer depicts the states of the different processes that must be executing for the application service to be
available. The Processes test (see Figure 2.32) tracks various statistics pertaining to the different application
processes.
Figure 2.32: The Processes test that tracks the health of the Application Processes layer of an HPUX server
As the Processes test and the procedure to auto-configure the processes to be monitored have been discussed
elaborately in Section 2.1.5 of this document, let us proceed to the next section.
136
MONITORING WINDOWS SERVERS
Monitoring Windows Servers
In order to monitor the overall health of Windows hosts in particular, eG Enterprise embeds the Microsoft Windows
server model (see Figure 3. 1)
Figure 3. 1: Layer model for a Windows server
An operator can use the Application Processes layer in Figure 3. 1 to monitor different processes executing on the
Windows server. The Tcp, Network, and Operating System layers monitor the TCP/IP statistics, network availability
and traffic rate, and CPU, memory, and disk statistics pertaining to the target server. The topmost layer is the
Windows Service layer which tracks the health of the different services of the corresponding Windows server.
Only a basic agent license is required for using the Windows model.
To monitor applications running on a Windows 8/2012 host, you need to make sure
that the .NET Framework 3.5 Features is enabled on that host.
The eG agent will be able to monitor applications on Windows 2003 using powershell
scripts only if Windows Powershell 2.0 pre-exists on that Windows 2003 host.
137
MONITORING WINDOWS SERVERS
The sections to come discuss each of these layers in great detail.
3.1 The Operating System Layer
One of the key functions of this layer is to monitor the CPU/memory/disk resources utilized by the Windows host, and
report whenever there is excessive resource usage at the host. Figure 3. 2 depicts the tests associated with this
layer.
Figure 3. 2: The tests associated with the Operating System layer of a Windows Generic server
Since most of the tests listed in Figure 3. 2 have already been dealt with in Chapter 1, this section deals with the
SystemDetails test (as the test parameters applicable are slightly different for Windows systems), the DiskActivity
test (as it reports a different set of metrics for a Windows server), the MemoryDetails test (as it reports additional
measures for Windows sytems), the WindowsSystem test and the PageFiles test only.
3.1.1
Memory Usage Test
This test reports statistics related to the usage of the physical memory of the system.
138
MONITORING WINDOWS SERVERS
Purpose
Reports statistics related to the usage of the physical memory of the system
Target of the
test
Any host system
Agent
deploying the
test
An internal agent
Configurable
parameters for
the test
1.
TEST PERIOD - How often should the test be executed
2.
HOST - The HOST for which the test is to be configured
3.
USEGLANCE - This flag applies only to HP-UX systems. HP GlancePlus/UX is HewlettPackards’s online performance monitoring and diagnostic utility for HP-UX based
computers. There are two user interfaces of GlancePlus/UX -- Glance is character-based,
and gpm is motif-based. Each contains graphical and tabular displays that depict how
primary system resources are being utilized. In environments where Glance is run, the eG
agent can be configured to integrate with Glance to pull out detailed metrics pertaining to
the memory usage of the HP-UX systems that are being monitored. By default, this
integration is disabled. This is why the USEGLANCE flag is set to No by default. You can
enable the integration by setting the flag to Yes. If this is done, then the test polls the
Glance interface of HP GlancePlus/UX utility to report the detailed diagnosis information
pertaining to memory usage.
4.
DETAILED DIAGNOSIS - To make diagnosis more efficient and accurate, the eG
Enterprise suite embeds an optional detailed diagnostic capability. With this capability, the
eG agents can be configured to run detailed, more elaborate tests as and when specific
problems are detected. To enable the detailed diagnosis capability of this test for a
particular server, choose the On option. To disable the capability, click on the Off option.
The option to selectively enable/disable the detailed diagnosis capability will be available
only if the following conditions are fulfilled:
The eG manager license should allow the detailed diagnosis capability
Both the normal and abnormal frequencies configured for the detailed diagnosis
measures should not be 0.
Outputs of the
test
Measurements
made by the
test
One set of results for every server being monitored
Measurement
Total physical memory:
Measurement
Unit
MB
Indicates the total physical
memory of the system.
Used physical memory:
MB
Indicates the used physical
memory of the system.
139
Interpretation
MONITORING WINDOWS SERVERS
Free physical memory:
MB
Indicates the free physical
memory of the system.
This measure typically indicates the amount
of memory available for use by applications
running on the target host.
On Unix operating systems (AIX and Linux),
the operating system tends to use parts of
the available memory for caching files,
objects, etc. When applications require
additional memory, this is released from the
operating
system
cache.
Hence,
to
understand the true free memory that is
available to applications, the eG agent
reports the sum of the free physical memory
and the operating system cache memory size
as the value of the Free physical memory
measure while monitoring AIX and Linux
operating systems.
Physical
utilized:
memory
Percent
Indicates the percent usage
of physical memory.
Ideally, the value of this measure should be
low. While sporadic spikes in memory usage
could be caused by one/more rogue
processes on the system, a consistent
increase in this value could be a cause for
some serious concern, as it indicates a
gradual, but steady erosion of valuable
memory resources. If this unhealthy trend is
not repaired soon, it could severely hamper
system performance, causing anything from a
slowdown to a complete system meltdown.
You can use the detailed diagnosis of this
measure to figure out which processes on the
host are consuming memory excessively.
140
MONITORING WINDOWS SERVERS
Available
physical
memory (MB):
MB
Indicates the amount of
physical
memory,
immediately available for
allocation to a process or
for system use.
Not all of the Available physical memory is
Free physical memory. Typically, Available
physical memory is made up of the Standby
List, Free List, and Zeroed List.
When Windows wants to trim a process'
working set, the trimmed pages are moved
(usually) to the Standby List. From here, they
can be brought back to life in the working set
with only a soft page fault (much faster than
a hard fault, which would have to talk to the
disk). If a page stays in the standby List for a
long time, it gets freed and moved to the
Free List.
In the background, there is a low priority
thread (actually, the only thread with priority
0) which takes pages from the Free List and
zeros them out. Because of this, there is
usually very little in the Free List.
All new allocations always come from the
Zeroed List, which is memory pages that
have been overwritten with zeros. This is a
standard part of the OS' cross-process
security, to prevent any process ever seeing
data from another. If the Zeroed List is
empty, Free List memory is zeroed and used
or, if that is empty too, Standby List memory
is freed, zeroed, and used. It is because all
three can be used with so little effort that
they are all counted as "available".
A high value is typically desired for this
measure.
This measure will be available for Windows
2008 hosts only.
141
MONITORING WINDOWS SERVERS
Modified memory:
MB
Indicates the amount of
memory that is allocated to
the modified page list.
This memory contains cached data and code
that is not actively in use by processes, the
system and the system cache. This memory
needs to be written out before it will be
available for allocation to a process or for
system use.
Cache pages on the modified list have been
altered in memory. No process has
specifically asked for this data to be in
memory, it is merely there as a consequence
of caching. Therefore it can be written to disk
at any time (not to the page file, but to its
original file location) and reused. However,
since this involves I/O, it is not considered to
be Available physical memory.
This measure will be available for Windows
2008 hosts only.
Standby memory:
MB
Indicates the amount of
memory assigned to the
standby list.
This memory contains cached data and code
that is not actively in use by processes, the
system and the system cache. It is
immediately available for allocation to a
process or for system use. If the system runs
out of available free and zero memory,
memory on lower priority standby cache page
lists will be repurposed before memory on
higher priority standby cache page lists.
Typically, Standby memory is the aggregate
of Standby Cache Core Bytes,Standby Cache
Normal Priority Bytes, and Standby Cache
Reserve Bytes. Standby Cache Core Bytes is
the amount of physical memory, that is
assigned to the core standby cache page
lists. Standby Cache Normal Priority Bytes is
the amount of physical memory, that is
assigned to the normal priority standby cache
page lists. Standby Cache Reserve Bytes is
the amount of physical memory, that is
assigned to the reserve standby cache page
lists.
This measure will be available for Windows
2008 hosts only.
Cached memory:
This
measure
aggregate
of
memory
and
memory.
MB
is
an
Standby
Modified
142
This measure will be available for Windows
2008 hosts only.
MONITORING WINDOWS SERVERS
3.1.2
System Details Test
This operating system-specific test relies on native measurement capabilities of the operating system to collect
various metrics pertaining to the CPU and memory usage of a host system. The details of this test are as follows:
Purpose
To measure the CPU and memory usage of a host system
Target of the
test
Any host system
Agent
deploying the
test
An internal agent
143
MONITORING WINDOWS SERVERS
Configurable
parameters for
the test
1.
TEST PERIOD - How often should the test be executed
2.
HOST - The host for which the test is to be configured.
3.
DURATION - This parameter is of significance only while monitoring Unix hosts, and
indicates how frequently within the specified TEST PERIOD, the agent should poll the
host for CPU usage statistics.
4.
SUMMARY – This attribute is applicable to multi-processor systems only. If the Yes option
is selected, then the eG agent will report not only the CPU and memory utilization of each
of the processors, but it will also report the summary (i.e., average) of the CPU and
memory utilizations of the different processors. If the No option is selected, then the eG
agent will report only the CPU usage of the individual processors.
5.
USEIOSTAT – This parameter is of significance to Solaris platforms only. By default, the
USEIOSTAT flag is set to No. This indicates that, by default, SystemTest reports the CPU
utilization of every processor on the system being monitored, and also provides the
average CPU utilization across the processors. However, if you want SystemTest to report
only the average CPU utilization across processors and across user sessions, then set the
USEIOSTAT flag to Yes. In such a case, the processor-wise breakup of CPU utilization will
not be available.
6.
USEPS - This flag is applicable only for AIX LPARs. By default, this flag is set to No.
7.
INCLUDE WAIT - This flag is applicable to Unix hosts alone . On Unix hosts, CPU time is
also consumed when I/O waits occur on the host. By default, on Unix hosts, this test does
not consider the CPU utilized by I/O waits while calculating the value of the CPU utilization
measure. Accordingly, the INCLUDE WAIT flag is set to No by default. To make sure that
the CPU utilized by I/O waits is also included in CPU usage computations on Unix hosts, set
this flag to Yes.
8.
ENABLE MEMORY DIAGNOSIS - By default, the ENABLE MEMORY DIAGNOSIS flag is
set to NO, indicating that detailed diagnosis will not be available for the Free memory
measure reported by this test by default. If you want to view the detailed diagnosis of the
Free memory measure - i.e., to view the top 10 processes on the target host that are
utilizing memory excessively - you can change this flag to YES.
9.
DETAILED DIAGNOSIS - To make diagnosis more efficient and accurate, the eG
Enterprise suite embeds an optional detailed diagnostic capability. With this capability, the
eG agents can be configured to run detailed, more elaborate tests as and when specific
problems are detected. To enable the detailed diagnosis capability of this test for a
particular server, choose the On option. To disable the capability, click on the Off option.
The option to selectively enable/disable the detailed diagnosis capability will be available
only if the following conditions are fulfilled:
The eG manager license should allow the detailed diagnosis capability
Both the normal and abnormal frequencies configured for the detailed diagnosis
measures should not be 0.
Outputs of the
test
Measurements
made by the
One set of results for each host monitored
Measurement
Measurement
Unit
144
Interpretation
MONITORING WINDOWS SERVERS
test
CPU utilization:
Percent
A high value could signify a CPU bottleneck.
The CPU utilization may be high because a
few processes are consuming a lot of CPU, or
because there are too many processes
contending for a limited resource. Check the
currently running processes to see the exact
cause of the problem.
Percent
An unusually high value indicates a problem
and may be due to too many system-level
tasks executing simultaneously.
Run queue length:
Indicates the instantaneous
length of the queue in
which threads are waiting
for the processor cycle.
This length does not
include the threads that are
currently being executed.
Number
A value consistently greater than 2 indicates
that many processes could be simultaneously
contending for the processor.
Blocked processes:
Indicates the number of
processes blocked for I/O,
paging, etc.
Number
A high value could indicate an I/O problem
on the host (e.g., a slow disk).
Swap memory:
MB
An unusually high value for the swap usage
can indicate a memory bottleneck. Check the
memory utilization of individual processes to
figure out the process(es) that has (have)
maximum memory consumption and look to
tune their memory usages and allocations
accordingly.
This measurement
indicates the percentage of
utilization of the CPU time
of the host system.
System CPU utilization:
Indicates the percentage of
CPU time spent for systemlevel processing.
On Windows systems, this
measurement denotes the
committed
amount
of
virtual
memory.
This
corresponds to the space
reserved for virtual memory
on disk paging file(s). On
Solaris systems, this metric
corresponds to the swap
space currently available.
On HPUX and AIX systems,
this metric corresponds to
the amount of active virtual
memory (it is assumed that
one
virtual
page
corresponds to 4 KB of
memory
in
this
computation).
145
MONITORING WINDOWS SERVERS
Free memory: Indicates
the free memory available.
MB
This measure typically indicates the amount
of memory available for use by applications
running on the target host.
On Unix operating systems (AIX and Linux),
the operating system tends to use parts of
the available memory for caching files,
objects, etc. When applications require
additional memory, this is released from the
operating
system
cache.
Hence,
to
understand the true free memory that is
available to applications, the eG agent
reports the sum of the free physical memory
and the operating system cache memory size
as the value of the Free memory measure
while monitoirng AIX and Linux operating
systems.
The detailed diagnosis of this measure, if
enabled, lists the top 10 processes
responsible
for
maximum
memory
consumption on the host.
Note:
For multi-processor systems, where the CPU statistics are reported for each processor on the system, the
statistics that are system-specific (e.g., run queue length, free memory, etc.) are only reported for the
"Summary" descriptor of this test.
3.1.3
Disk Space Test
This test monitors the space usage of every disk partition on a host. While this test typically reports the space usage
of every physical disk partition on a host, when monitoring hosts running Windows 2008/Vista/7 hosts however, this
test reports usage metrics of physical and logical partitions.
Purpose
To measure the space usage of every disk partition on a host
Target of the
test
Any host system
Agent
deploying the
test
An internal agent
146
MONITORING WINDOWS SERVERS
Configurable
parameters for
the test
Outputs of the
test
Measurements
made by the
test
1.
TEST PERIOD - How often should the test be executed
2.
HOST - The host for which the test is to be configured.
3.
DISCOVER NFS – Set this flag to Yes, if you want the test to automatically discover NFS
drives on your system and report their status as well. By default, this flag is set to No.
4.
DOMAIN, DOMAIN USER, AND DOMAIN PASSWORD – These parameters are applicable
to Windows systems only. When monitoring a Windows system, if the DISCOVER NFS flag
of this test is set to Yes, then the test should be configured with the privileges of a valid
domain user in order to auto-discover NFS drives and report their usage and status. In
such a case therefore, specify a valid Windows domain name against DOMAIN , provide
the name of a valid user in that domain against DOMAIN USER, and specify the password
of that user against PASSWORD. Once the domain user credentials are provided, the test
auto-discovers all those NFS drives on the target Windows system to which the configured
domain user has access.
5.
CONFIRM PASSWORD – Retype the PASSWORD of the configured domain user here.
6.
TIMEOUT – - Specify the maximum duration (in seconds) for which the test will wait for a
response from the server. The default timeout period is 30 seconds
One set of results for each physical/logical disk partition and/or NFS drive on the host monitored
Measurement
Total capacity:
Measurement
Unit
Interpretation
MB
Indicates the total capacity
of a disk partition.
Used space:
MB
Indicates the amount of
space used in a disk
partition.
Free space:
MB
Indicates the current free
space available for each
disk partition of a system.
Percent usage: Indicates
the percentage of space
usage on each disk
partition of a system.
Percent
A value close to 100% can indicate a
potential
problem
situation
where
applications executing on the system may not
be able to write data to the disk partition(s)
with very high usage.
Drive availability:
Percent
If the drive is available, then this measure
will report the value 100. If not, then this
measure will report the value 0.
Indicates whether/not this
drive is available currently.
This measure gains significance when
monitoring NFS drives, as it enables you to
identify those drives that are no longer
mapped to the system.
147
MONITORING WINDOWS SERVERS
Note:
In case of Hyper-V and Hyper-V VDI components, the Disk Space test reports metrics for an additional Total
descriptor. For this descriptor, the test reports the total disk capacity and space usage across all the disk
partitions of the monitored Hyper-V host.
3.1.4
Disk Activity Test
When executed on Windows, Solaris, AIX, and HP-UX systems, this test reports statistics pertaining to the
input/output utilization of each physical disk on a system.
Purpose
To measure the input/output utilization of each physical disk on a system
Target of the
test
Any host system
Agent
deploying the
test
An internal agent
Configurable
parameters for
the test
1.
TEST PERIOD - How often should the test be executed
2.
HOST - The host for which the test is to be configured.
3.
USEEXE - Setting the USEEXE flag to true, ensures that the disk activity metrics are
collected by executing a binary instead of dynamically linking to the Performance
instrumentation library. By default, this is set to false.
4.
DETAILED DIAGNOSIS - To make diagnosis more efficient and accurate, the eG
Enterprise suite embeds an optional detailed diagnostic capability. With this capability, the
eG agents can be configured to run detailed, more elaborate tests as and when specific
problems are detected. To enable the detailed diagnosis capability of this test for a
particular server, choose the On option. To disable the capability, click on the Off option.
The option to selectively enable/disable the detailed diagnosis capability will be available
only if the following conditions are fulfilled:
The eG manager license should allow the detailed diagnosis capability
Both the normal and abnormal frequencies configured for the detailed diagnosis
measures should not be 0.
Outputs of the
test
Measurements
made by the
One set of results for each physical disk on the host monitored
Measurement
Measurement
Unit
148
Interpretation
MONITORING WINDOWS SERVERS
test
Disk busy:
Percent
Indicates the percentage of
elapsed time during which
the disk is busy processing
requests (i.e., reads or
writes).
Disk busy due to reads:
Comparing the percentage of time that the
different disks are busy, an administrator can
determine whether the application load is
properly balanced across the different disks.
The detailed diagnosis of this measure will
reveal the top-10 I/O-intensive processes
executing on the host.
Percent
Indicates the percentage of
elapsed time that the
selected disk drive is busy
servicing read requests.
Disk busy due to writes:
Percent
Indicates the percentage of
elapsed time that the
selected disk drive is busy
servicing write requests.
Disk read time: Indicates
the average time in
seconds of a read of data
from the disk.
Secs
Disk write time:
Indicates the average time
in seconds of a write of
data from the disk.
Secs
Avg queue length:
Indicates the average
number of both read and
write requests that were
queued for the selected
disk during the sample
interval.
Number
Current disk queue
length:
Number
The number of requests
outstanding on the disk at
the time the performance
data is collected.
149
This measure includes requests in service at
the time of the snapshot. This is an
instantaneous length, not an average over
the time interval. Multi-spindle disk devices
can have multiple requests active at one
time, but other concurrent requests are
awaiting service. This counter might reflect a
transitory high or low queue length, but if
there is a sustained load on the disk drive, it
is likely that this will be consistently high.
Requests experience delays proportional to
the length of this queue minus the number of
spindles on the disks. This difference should
average less than two for good performance.
MONITORING WINDOWS SERVERS
Disk read rate:
Reads/Sec
A dramatic increase in this value may be
indicative of an I/O bottleneck on the server.
KB/Sec
A very high value indicates an I/O bottleneck
on the server.
Writes/Sec
A dramatic increase in this value may be
indicative of an I/O bottleneck on the server.
KB/Sec
A very high value indicates an I/O bottleneck
on the server.
Secs
A sudden rise in the value of this measure
can be attributed to a large amount of
information being input or output. A
consistent increase however, could indicate
an I/O processing bottleneck.
Secs
Ideally, the value of this measure should be
low.
Secs
The value of this measure is the sum of the
values of the Disk service time and Disk
queue time measures.
Indicates the number of
reads happening on a
logical disk per second.
Data read rate from
disk:
Indicates the rate at which
bytes are transferred from
the disk during read
operations.
Disk write rate:
Indicates the number of
writes happening on a local
disk per second.
Data write rate to disk:
Indicates the rate at which
bytes are transferred from
the disk during write
operations.
Disk service time:
Indicates the average time
that this disk took to
service each transfer
request ( i.e., the average
I/O operation time)
Disk queue time:
Indicates the average time
that transfer requests
waited idly on queue for
this disk.
Disk I/O time:
Indicates the avarage time
taken for read and write
operations of this disk.
A consistent increase in the value of this
measure could indicate a latency in I/O
processing.
The detailed diagnosis of the Disk busy measure and the Avg queue length measure reveal the top-10 I/O-intensive
processes executing on the target host.
150
MONITORING WINDOWS SERVERS
Figure 3.3: The detailed diagnosis of the Disk Activity test
3.1.5
Memory Details Test
This test reports statistics pertaining to the memory utilization of target systems.
Purpose
Reports statistics pertaining to the memory utilization of target systems
Target of the
test
Any host system
Agent
deploying the
test
An internal agent
Configurable
parameters for
the test
1.
TEST PERIOD - How often should the test be executed
2.
HOST - The host for which the test is to be configured
Outputs of the
test
One set of results for every server being monitored
Measurements
made by the
test
Measurement
Measurement
Unit
151
Interpretation
MONITORING WINDOWS SERVERS
Free entries in system
page table:
Number
Indicates the number of
page table entries not
currently in use by the
system.
Pages read from disk:
The maximum number of System PTEs that a
server can have is set when the server boots.
In heavily-used servers, you can run out of
system PTEs. You can use the registry to
increase the number of system PTEs, but that
encroaches into the paged pool area, and you
could run out of paged pool memory.
Running out of either one is bad, and the
goal should be to tune your server so that
you run out of both at the exact same time.
Typically, the value of this metric should be
above 5000.
Reads/Sec
Indicates
the
average
number of times per
second the disk was read
to resolve hard fault
paging.
Pages written to disk:
Writes/Sec
Indicates
the
average
number of times per
second the pages are
written to disk to free up
the physical memory.
Memory page ins:
Pages/Sec
Indicates the number of
times per second that a
process needed to access a
piece of memory that was
not in its working set,
meaning that the system
had to retrieve it from the
page file.
Memory page outs:
Pages/Sec
Indicates the number of
times per second the
system decided to trim a
process's working set by
writing some memory to
disk in order to free up
physical
memory
for
another process.
152
This value is a critical measure of the
memory utilization on a server. If this value
never increases, then there is sufficient
memory in the system. Instantaneous spikes
of this value are acceptable, but if the value
itself starts to rise over time or with load, it
implies that there is a memory shortage on
the server.
MONITORING WINDOWS SERVERS
Non-paged pool kernel
memory size:
MB
The kernel memory nonpage pool is an area
of system memory (that is, physical memory
used by the operating system) for kernel
objects that cannot be written to disk, but
must remain in physical memory as long as
the objects are allocated. Typically, there
should be no more than 100 MB of nonpaged pool memory being used.
MB
If the Paged Pool starts to run out of space
(when it's 80% full by default), the system
will automatically take some memory away
from the System File Cache and give it to the
PagedPool. This makes the System File Cache
smaller. However, the system file cache is
critical, and so it will never reach zero.
Hence, a significant increase in the paged
pool size is a problem.This metric is a useful
indicator of memory leaks in a system. A
memory leak occurs when the system
allocates more memory to a process than the
process gives back to thepool. Any time of
process can cause a memory leak. If the
amount of pagedpool data keeps increasing
even though the workload on the server
remains constant, it is an indicator of a
memory leak.
Percent
Whenever this measure exceeds 80-90%,
application requests to allocate memory in
the virtual memory (page file). This ratio can
be reduced by increasing the Physical
memory or the Page file.
Number
Generally, a non-zero value indicates a
shortage of physical memory.
Number
A non-zero value indicates a shortage of
physical memory.
Indicates the total size of
the
kernel
memory
nonpaged pool.
Memory
size:
paged
pool
Indicates the total size of
the Paged Pool.
Committed memory in
use:
Indicates the committed
bytes as a percentage of
the Commit Limit.
Pool
failures:
non-paged
Indicates the number of
times
allocations
have
failed from non paged pool.
Pool paged failures:
Indicates the number of
times
allocations
have
failed from paged pool.
153
MONITORING WINDOWS SERVERS
Copy read hits:
Percentage
This is an important counter for applications
like the Citrix Provisioning server that stream
large volumes of data. If the RAM cache of
the server is not sufficiently large, a lot of the
I/O requests will be served from the disk, and
not the system cache. This will reduce
performance. Hence, it is critical to monitor
this metric. The higher the value, the better
the performance you can see from the
server.
Reads/Sec
A copy read is a file read operation that
is satisfied by a memory copy from a
page in the cache to the application's
buffer. The LAN redirector uses this
method for retrieving information from
the cache, as does the LAN server for
small transfers. This method is also used
by the disk file systems.
Indicates what percent of
read I/O being served is
coming from system cache,
not disk.
Copy reads:
Indicates how many hits
you are really getting.
3.1.6
Page Files Test
When the load imposed by applications and services running on a server nears the amount of installed RAM,
additional storage is necessary. The page file serves as the temporary store on disk for memory that cannot be
accommodated in the physical RAM. Since it is frequently accessed for storing and retrieving data that is needed for
virtual memory access by application, the location and sizing of the page files can have a critical impact on a server's
performance. Ideally, the server operating system and the page file should be available on different drives for
optimal performance. Splitting the page file across different drives can improve performance further. A rule of thumb
in sizing the page file is to set the maximum size of the page file to 1.5 times the available RAM. While this works
well for systems with smaller physical memory, for other systems, the optimal page file size has to be determined
based on experience using the system and studying the typical workload.
The PageFiles test tracks the usage of each of the page files on a Windows server.
Purpose
Tracks the usage of each of the page files on a Windows server
Target of the
test
A Windows host only
Agent
deploying the
test
An internal agent
154
MONITORING WINDOWS SERVERS
Configurable
parameters for
the test
Outputs of the
test
Measurements
made by the
test
1.
TEST PERIOD - How often should the test be executed
2.
HOST - The host for which the test is to be configured.
3.
REPORTTOTAL - Set this flag to Yes if you want the test to report total page file usage i.e., the aggregate usage across multiple page files. In this case therefore, a Total
descriptor will newly appear for this test in the eG monitoring console.
4.
REPORTTOTALONLY - If both the REPORTTOTAL and REPORTTOTALONLY flags are
set to Yes, then the test will report only the aggregate usage across multiple page files - in
other words, the test will report values for the Total descriptor only. Likewise, if the
REPORTTOTAL flag is set to No, and the REPORTTOTALONLY flag is set to Yes, then
again, the test will report current usage for the Total descriptor only. However, if both the
REPORTTOTAL and REPORTTOTALONLY flags are set to No, then the test will report
individual usages only. Also, if the REPORTTOTAL flag is set to Yes and the
REPORTTOTALONLY flag is set to No, then both the individual and Total usages will be
reported.
One set of results for every page file on a Windows server
Measurement
Current usage:
Measurement
Unit
Percent
Indicates the current usage
of a page file.
3.1.7
Interpretation
This metric should be less than 90%. If the
page file does not have additional space,
additional
users/processes
cannot
be
supported and system performance will
suffer. To improve performance, consider
resizing the page file. Microsoft Windows
allows a minimum and maximum size of the
page file to be specified. If the system has
sufficient disk space, consider setting the
page file to start out at the maximum size (by
using the same value for the minimum and
maximum sizes), so that system resources
are not spent growing the page file size when
there is a virtual memory shortage.
OS Details Test
The OS Details test reports additional system-related metrics pertaining to the target system.
Purpose
Reports additional system-related metrics pertaining to the monitored host
Target of the
test
Any host
Agent
deploying the
test
An internal agent
155
MONITORING WINDOWS SERVERS
Configurable
parameters for
the test
1.
TEST PERIOD - How often should the test be executed
2.
HOST - The host for which the test is to be configured.
3.
PROCESS LIMIT - The PROCESS LIMIT determines what type of processes are to be
included in the detailed diagnosis of the Processes count measure of this test. By default, 5
is the PROCESS LIMIT. This implies that the detailed diagnosis of the Processes count
measure will by default list only those processes for which more than 5 instances are
currently running on the target host. Processes with less than 5 currently active instances
will not be displayed in the detailed diagnosis. This limit can be changed.
4.
EXCLUDE PROCESS - If you want to exclude one/more processes from the detailed
diagnosis of the Processes count measure, then specify a comma-separated list of
processes to be excluded in the EXCLUDE PROCESS text box. By default, the svchost
process is excluded from the detailed diagnosis of this test.
5.
DETAILED DIAGNOSIS - To make diagnosis more efficient and accurate, the eG
Enterprise suite embeds an optional detailed diagnostic capability. With this capability, the
eG agents can be configured to run detailed, more elaborate tests as and when specific
problems are detected. To enable the detailed diagnosis capability of this test for a
particular server, choose the On option. To disable the capability, click on the Off option.
The option to selectively enable/disable the detailed diagnosis capability will be available
only if the following conditions are fulfilled:
The eG manager license should allow the detailed diagnosis capability
Both the normal and abnormal frequencies configured for the detailed diagnosis
measures should not be 0
Outputs of the
test
Measurements
made by the
test
One set of results for every host monitored
Measurement
Processes count:
Measurement
Unit
Interpretation
Number
Indicates the number of
processes running on the
system.
Threads count: Indicates
the number of threads in
the system.
Number
This measure will be available only for
Windows hosts.
Registry quota in use:
Percent
If this measure begins to reach 100%, we
need to increase the total registry size set in
Control Panel/System's Virtual Memory tab.
Indicates the percentage of
registry quota currently in
use by the system.
This measure will be available only for
Windows hosts.
156
MONITORING WINDOWS SERVERS
Context switches:
This value is the combined
rate at which all processors
on the computer are
switched from one thread
to another.
Switches/Sec
Context switches occur when a running
thread voluntarily relinquishes the processor,
is preempted by a higher priority ready
thread, or switches between user-mode and
privileged (kernel) mode to use an Executive
or subsystem service. If the context switch
rate is unusually high, it implies that there is
excessive contention for CPU resources.
System calls rate:
This value is the combined
rate of calls to operating
system service routines by
all processes running on
the computer.
Calls/Sec
Operating system calls are used to perform
all
of
the
basic
scheduling
and
synchronization of activities on the computer,
and provide access to non-graphic devices,
memory management, and name space
management. Excessively high number of
system calls can impact the performance of a
system. Watch for processes that are issuing
a large number of system calls. Applications
corresponding to these processes could be
candidates for performance optimizations.
This measure will be available only for
Windows hosts.
Pin read hits:
Indicates The percentage
of pin read requests that
hit the file system cache,
i.e., did not require a disk
read in order to provide
access to the page in the
file system cache.
Percent
While pinned, a page's physical address in
the file system cache will not be altered. The
LAN Redirector uses this method for
retrieving data from the cache, as does the
LAN Server for small transfers. This is usually
the method used by the disk file systems as
well. The pin read hits should be close to
100% for high performance.
This measure will be available only for
Windows hosts.
Pin read rate:
Indicates the frequency of
reading data into the file
system cache preparatory
to writing the data back to
disk.
Reads/Sec
Interrupt time:
Percent
Pages read in this fashion are pinned in
memory at the completion of the read. While
pinned, a page's physical address in the file
system cache will not be altered.
This measure will be available only for
Windows hosts.
Indicates the percentage of
time
spent
by
the
processor for receiving and
servicing the hardware
interrupts during the last
polling interval.
This is an indirect indicator of the activity of
devices that generate interrupts such as
system Clocks, the mouse device drivers,
data communication lines, network interface
cards and other peripheral devices.
In general, a very high value of this measure
might indicate that a disk or network adapter
needs upgrading or replacing.
This measure will be available only for
Windows hosts.
157
MONITORING WINDOWS SERVERS
3.1.8
HandlesUsage Test
This test monitors and tracks the handles opened by processes running in a target Windows system.
Purpose
Monitors and tracks the handles opened by processes running in a target Windows system
Target of the
test
A Windows host
Agent
deploying the
test
An internal agent
Configurable
parameters for
the test
1.
TESTPERIOD - How often should the test be executed
2.
HOST - The host for which the test is to be configured.
3.
HANDLES GROWTH LIMIT – This defines the upper limit of the handles opened by any
process. By default, this parameter is set to 8000.
Outputs of the
test
Measurements
made by the
test
One set of results for the Windows host being monitored
Measurement
Unit
Measurement
Handles used by processes:
Number
Use the detailed diagnosis of this measure
to determine the top-10 processes in terms
of number of handles opened. This
information brings to light those processes
with too many open handles. By closely
tracking the handle usage of these
processes over time, you can identify
potential handle leaks.
Number
Using the detailed diagnosis of this
measure, you can accurately isolate the
process(es) that has opened more handles
than the permitted limit.
Indicates
the
number
of
handles opened by various
processes running in a target
Windows system in the last
measurement period.
Processes using
above limit:
handles
Interpretation
Indicates
the
number
of
processes that have opened the
handles on or above the value
defined in the input parameter HANDLES GROWTH LIMIT.
A high value of this measure indicates that
too many processes are opening handles
excessively. You might want to closely
observe the handle usage of these
processes over time to figure out whether
the spike in usage is sporadic or consistent.
A consistent increase in handle usage could
indicate a handle leak.
The detailed diagnosis of the Handles used by processes measure, if enabled, lists the names of top-10
processes in terms of handle usage, the number of handles each process uses, the process ID, and the ID of the
parent process.
158
MONITORING WINDOWS SERVERS
Figure 3. 4: The detailed diagnosis of the Handles used by processes measure
The detailed diagnosis of the Processes using handles above limit measure, if enabled, lists the details of processes
that are using more handles than the configured limit.
Figure 3. 5: The detailed diagnosis of the Processes using handles above limit measure
3.1.9
DNS Changes Test
This test alerts administrators to a change in the IP address of the DNS server.
Purpose
Alerts administrators to a change in the IP address of the DNS server
Target of the
test
A Windows host
Agent
deploying the
test
An internal agent
Configurable
parameters for
the test
1.
TESTPERIOD - How often should the test be executed
2.
HOST - The host for which the test is to be configured.
Outputs of the
test
One set of results for the Windows host being monitored
Measurements
made by the
Measurement
Measurement
Unit
159
Interpretation
MONITORING WINDOWS SERVERS
test
Has
DNS
changed?:
configuration
Boolean
Indicates whether the IP
address of the DNS server has
changed.
3.1.10
If the value of this measure is 1, it indicates
that the IP address of the DNS server has
changed; the value 0 indicates that the IP
address has not changed.
Windows Disk Alignment Test
The Windows operating system writes data to disk in 64k chucks. However, Windows Server 2000, 2003 and
Windows XP all incorrectly begin writing data at the 63rd sector. This means the first 1k of the chuck is written into
one sector, and the remaining 63k in the next, and so on. The consequence of this behavior means that for every
read and write, two sectors must be accessed from disk instead of one. This basically doubles your disk I/O. The
additional I/O (especially if small) can impact system resources significantly.
Therefore, whenever a Windows host experiences a slowdown, you may want to check the disk alignment to
determine whether the slowdown can be attributed to one/more unaligned disk partitions. This test enables you to
perform such a check.
Purpose
Reports the alignment status of the every disk partition on a Windows host
Target of the
test
A Windows host
Agent
deploying the
test
An internal agent
Configurable
parameters for
the test
3.
TESTPERIOD - How often should the test be executed
4.
HOST - The host for which the test is to be configured.
Outputs of the
test
One set of results for each physical disk partition on the Windows host being monitored
Measurements
made by the
Measurement
Measurement
Unit
160
Interpretation
MONITORING WINDOWS SERVERS
test
Disk partition
status:
alignment
Indicates whether this
partition is aligned or not.
If the partition is unaligned, this test reports
the value Partition is not aligned. For an
aligned partition, this test reports the value
Partition is aligned.
disk
The numeric values that correspond to the
above-mentioned measure values are
described in the table below:
Measure Value
Numeric Value
Partition is aligned
100
Partition
aligned
is
not
0
Note:
By default, this measure reports one of the
Measure Values listed in the table above.
The graph of this measure however will
represent the disk alignment status using
the numeric equivalents - 100 or 0.
If a partition is found to be misaligned, you
can use the detailed diagnosis of this test to
figure out the caption, device ID, logical
partition name, and block size of the faulty
partition.
3.1.11
Disk Users Quota Test
Disk quotas track and control disk space usage for NTFS volumes, allowing administrators to control the amount of
data that each user can store on a specific NTFS volume. By using disk quotas, you can configure Microsoft Windows
Server to do the following:
Log an event when a user exceeds a specified disk space warning level. The warning level specifies
the point at which a user is nearing the quota limit.
Prevent further use of disk space or log an event when a user exceeds a specified disk space limit.
If the specified disk quota is violated by a user, it indicates that that user’s files are occupying a huge chunk of space
on the disk partition, leaving very little disk space free for the files of other users. To prevent disk space contentions,
administrators need to track disk space usage on a continuous basis and figure out which user on which partition is
unnecessarily eroding the space on the partition. The Disk Users Quota test helps in this regard.
This test monitors how each user to a server is utilizing every disk partition on the server, promptly detects a quota
violation, and instantly alerts administrators to the violation. This way, administrators can understand:
Which disk is being utilized excessively?
Which user is using that disk over the prescribed quota?
Which limit has been exceeded – warning? or the hard limit?
161
MONITORING WINDOWS SERVERS
Based on these findings, administrators can then investigate the reasons for excessive space usage by a particular
user and employ measures to resolve the space crunch.
Note:
This test executes only on Windows 2008 servers and Microsoft File Servers (i.e., the MS File server component in
eG) operating on Windows 2008 platform.
Purpose
Tracks the usage of each disk on a Windows server for every user to the server, promptly
detects a quota violation, and instantly alerts administrators to the violation
Target of the
test
A Windows host
Agent
deploying the
test
An internal agent
Configurable
parameters for
the test
1.
TEST PERIOD - How often should the test be executed
2.
HOST - The host for which the test is to be configured.
Outputs of the
test
One set of results for each physical disk partition that is being used by each user to the target
server
Measurements
made by the
Measurement
Measurement
Unit
162
Interpretation
MONITORING WINDOWS SERVERS
test
Status:
The values that this measure can report and
their corresponding numeric values have
been detailed below:
Indicates whether/not the disk
quota set for this user on this
disk partition has been violated,
and if so, which limit has been
violated.
Measure
Description
Value
Numeric
Value
OK
The
disk
quota
has
not
been
exceeded
0
Warning
The warning
limit of the
disk
quota
has
been
exceeded
1
Exceeded
The hard
limit of the
disk quota
has been
exceeded
2
the measure reports Warning or
Exceeded, it is a cause for concern, as it
If
indicates excessive utilization of the space in
the disk partition by a specific user. You
may then have to figure out why that
particular user is using so much space. If
required, you may have to allocate more
space to the partition, delete unnecessary
files from the partition to create more space,
or fine-tune the disk quota to suit the
workload of your environment.
Note:
By default, this measure reports one of the
Measure Values listed in the table above.
The graph of this measure however will
represent the quota violation status using
the numeric equivalents – 0 to 2.
Disk used:
GB
Indicates the amount of disk
space that is currently used by
this user on this partition.
163
By comparing the value of this measure
across descriptors, you can figure out which
user is making the most use of which disk
partition.
MONITORING WINDOWS SERVERS
Quota used:
Percent
Indicates the percentage of the
quota set for this user on this
partition that is currently in use.
This is calculated using the formula:
(Disk Used / Quota limit)*100
If the value of this measure is 100% or
close to it, it indicates that a specific user is
making abnormal use of the space on a
particular disk partition. By comparing the
value of this measure across descriptors,
you can figure out which user is making the
most use of which disk partition.
To make sure that there is always enough
space on the ‘most-used’ partition for the
files of other users, you may have to
allocate more space to the partition, delete
unnecessary files from the partition to
create more space, or fine-tune the disk
quota to suit the workload of your
environment.
If the value of this measure is reported as 6, it indicates that no limit has been set.
Limit remaining:
GB
Indicates the amount of disk
quota that is yet o be used by
this user on this disk partition.
Quota Limit:
A high value is desired for this measure. If
the value of this measure is reported as -6,
it indicates that no limit has been set.
GB
Indicates
the
disk
quota
specified for this user on this
partition.
Warning level:
GB
Indicates the disk space usage
limit set for this disk partition
when used by this user, beyond
which an event will be logged in
the
event
log
warning
administrators of an impending
disk space crunch.
Is user over the warning
limit?
The values that this measure report and
their corresponding numeric values have
been listed in the table below:
Indicates
whether/not
the
usage of this disk partition by
this user has exceeded the
specified ‘warning’ limit.
164
Measure
Numeric
Value
Value
Yes
1
No
0
MONITORING WINDOWS SERVERS
If the measure reports the value Yes, it is a
cause for concern, as it indicates that the
disk quota is about to be used up. You may
then have to figure out why that particular
user is using so much space. If required,
you may have to allocate more space to the
partition, delete unnecessary files from the
partition to create more space, or fine-tune
the disk quota to suit the workload of your
environment.
Note:
By default, this measure reports one of the
Measure Values listed in the table above to
indicate whether the warning limit has been
violated or not. The graph of this measure
however will represent the same using the
numeric equivalents.
Is user over the hard limit?
The values that this measure report and
their corresponding numeric values have
been listed in the table below:
Indicates
whether/not
the
usage of this disk partition by
this user has exceeded the
specified ‘hard’ limit.
Measure
Value
Numeric
Value
Yes
1
No
0
If the measure reports the value Yes, it is a
cause for concern, as it indicates that the
disk quota is about to be used up. You may
then have to figure out why that particular
user is using so much space. If required,
you may have to allocate more space to the
partition, delete unnecessary files from the
partition to create more space, or fine-tune
the disk quota to suit the workload of your
environment.
Note:
By default, this measure reports one of the
Measure Values listed in the table above to
indicate whether the hard limit has been
violated or not. The graph of this measure
however will represent the same using the
numeric equivalents.
165
MONITORING WINDOWS SERVERS
3.1.12
Tests Disabled by Default
Besides the tests discussed above, the Operating System layer of a Windows Generic server is mapped to a few tests
that are disabled by default. Enabling these tests ensures that useful information is available to users. To enable the
tests, go to the ENABLE / DISABLE TESTS page using the menu sequence : Agents -> Tests -> Enable/Disable, pick
Windows Generic or Windows as the Component type, set Performance as the Test type, choose the tests from the
DISABLED TESTS list, and click on the << button to move the tests to the ENABLED TESTS list. Finally, click the Update
button.
3.1.12.1 Windows Service Status Test
The WindowsServiceStatus test is specific to Microsoft Windows systems. This test discovers all the services that are
configured for automatic startup on the system. Everytime the test executes, it checks if each of the automatic
services is up or not. If a service is down and the maximum number of restart attempts has not been reached, then
the test attempts to restart the service. Whether the service restarted successfully or not is reported as one of the
measures of the test. If a service is down and the maximum number of restart attempts has been reached, the test
takes no automatic action to restart the service. This test is disabled by default.
Purpose
Auto-discovers all the automatic services on a host, reports their status, and automatically
restarts the services that have stopped
Target of the
test
Windows-based applications only
Agent
deploying the
test
An internal agent
Configurable
parameters for
the test
1.
TEST PERIOD – How often should the test be executed
2.
HOST - The host for which the test is to be configured.
3.
RESTARTATTEMPTS - Specify the maximum number of times the eG Enterprise system
should try to restart an automatic service that has stopped. If attempts made to start the
automatic service continue to fail beyond this prescribed limit, then eG will not perform any
further restart attempts.
4.
REDISCOVER - Specify the number of times the test is to be executed before the eG
Enterprise system runs a new discovery for services.
5.
RESTART - If the automatic services stop, then eG can be configured to automatically
restart the services by setting RESTART to true. To disable auto-restart, specify false.
6.
RESTARTCHECKPERIOD - After a restart attempt, the eG agent will wait for a while and
then verify whether the service has successfully restarted or not. In the
RESTARTCHECKPERIOD text box, specify this waiting period.
7.
EXCLUDESVCS - Some automatic services - for example, services that cannot be
restarted automatically - can be excluded from monitoring by providing the service names
in the EXCLUDESVCS text box, as a comma-separated list. For this specification, you can
also use wild card patterns – for instance, *Published*.*World Wide* .
Outputs of the
test
Measurements
made by the
One set of results for every auto-discovered service
Measurement
Measurement
Unit
166
Interpretation
MONITORING WINDOWS SERVERS
test
Service availability:
Percent
A value of 100 is reported if the service is
running when this test executes. If the
service is down, the test attempts to restart
the service and once again checks the service
status. If the service has been restarted,
availability is reported as 100. On the other
hand, if the service has failed to restart,
availability is reported as 0.
Number
This measure is relevant only if the test
execution has determined that the service
has stopped. The value of 1 denotes that the
service was successfully restarted by the test.
Otherwise, this measure takes a value of 0.
Number
This measure has a value of 0 if the service
does not have to be restarted by the test, or
if a restart of the service by the test is
successful. If a restart of the service by the
test is not successful, this value is
incremented by 1. If the value of this
measure equals the RESTARTATTEMPTS
parameter of the test, the eG agent stops
attempting to restart the failed service.
Indicates whether the
service is currently running
or not.
Successful restart:
Indicates
whether
the
stopped service has been
successfully restarted or
not.
Failed restarts:
Indicates the number of
restarts that have failed.
3.1.12.2 Disk Fragmentation Test
In computing, file system fragmentation, sometimes called file system aging, is the inability of a file system to
lay out related data sequentially (contiguously) This increases disk head movement or seeks, which are known to
hinder throughput. File system fragmentation is projected to become more problematic with newer hardware due to
the increasing disparity between sequential access speed and rotational latency (and to a lesser extent seek time), of
consumer-grade hard disks, on which file systems are usually placed. Thus, fragmentation is an important problem in
recent file system research and design.
The correction to existing fragmentation is to reorganize files and free space back into contiguous areas, a process
called defragmentation. Defragmentation is the mechanism that physically reorganizes the contents of the disk in
order to store the pieces of each file close together and in order (contiguously). It also attempts to create larger
regions of free space using compaction to impede the return of fragmentation. Some defragmenters also try to keep
smaller files within a single directory together, as they are often accessed in sequence.
This test determines the extent of fragmentation that has occurred on every disk partition/volume on a Windows
host. This analysis is essential as it enables administrators to proactively decide whether it is time for disk
defragmentation to be carried out or not and on which disk volumes.
This test is disabled by default.
167
MONITORING WINDOWS SERVERS
Purpose
Determines the extent of fragmentation that has occurred on every disk partition/volume on a
Windows host
Target of the
test
A Windows host
Agent
deploying the
test
An internal agent
Configurable
parameters for
the test
1.
TEST PERIOD - How often should the test be executed
2.
HOST - The host for which the test is to be configured
Outputs of the
test
One set of results for every disk volume on the monitored host
Measurements
made by the
test
Measurement
Total fragmentation:
Measurement
Unit
Percent
Indicates the percentage of
this volume that has been
fragmented.
Interpretation
Ideally, this value should be low. A high value
is indicative of a highly fragmented volume.
This could multiply the data access time and
could cause inefficient usage of the storage
space.
Such
situations
necessitate
defragmentation, which is sure to make
reading and writing to the disk much faster.
Preemptive techniques attempt to keep
fragmentation at a minimum at the time data
is being written on the disk. The simplest is
appending data to an existing fragment in
place where possible, instead of allocating
new blocks to a new fragment.
Many of today's file systems attempt to
preallocate longer chunks, or chunks from
different free space fragments, called extents
to files that are actively appended to. This
largely avoids file fragmentation when several
files are concurrently being appended to,
thus avoiding their becoming excessively
intertwined.
Retroactive techniques attempt to reduce
fragmentation, or the negative effects of
fragmentation, after it has occurred. Many
file systems provide defragmentation tools,
which attempt to reorder fragments of files,
and sometimes also decrease their scattering
(i.e. improve their contiguity, or locality of
reference) by keeping either smaller files in
directories, or directory trees, or even file
sequences close to each other on the disk.
168
MONITORING WINDOWS SERVERS
Average free space size:
MB
Free space fragmentation means that the
Percent
empty space on a disk is broken into
scattered parts rather than being collected in
one big empty space.This type of
fragmentation occurs when there are several
unused areas of the file system where new
files or metadata can be written to.
Unwanted free space fragmentation is
generally caused by deletion or truncation of
files, but file systems may also intentionally
insert fragments ("bubbles") of free space in
order to facilitate extending nearby files
Indicates the average size
of the free space extents
on this volume that has
been fragmented.
Free
fragmentation:
space
Indicates the percentage of
free space on this volume
that has been fragmented.
Free space count:
Number
Indicates the number of
free space extents on this
volume that has been
fragmented.
Fragmented free space should ideally be low.
A high value for these measures therefore,
could cause data file creation and extension
worries. Even an odd spike or two would
hence necessitate defragmentation.
Note that the ‘Average free space size’ and the
‘Free space count’ measures will be available
on Windows 2008 (or above) only.
Largest free space size:
MB
This measure is available only on Windows
2008 (or above).
Percent
Sometimes when you install a program or
create a data file, the file ends up chopped
up into chunks and stored in multiple
locations on the disk - this is called file
fragmentation. A high value of this measure
indicates that there exists a severe dearth of
sequential data on the volume. This makes
data retrieval difficult and time-consuming.
Only defragmentation can resolve such a
situation.
Indicates the size of the
largest free space extent
on this volume that has
been fragmented.
File fragmentation:
Indicates the percentage of
files that are fragmented
on this volume.
This measure will not be reported on Windows
2008 (or above).
3.1.12.3 OS Cache Test
The OsCache test reveals whether or not the operating system's cache has been effectively utilized. This test is
disabled by default.
Purpose
Reveals whether or not the operating system's cache has been effectively utilized
Target of the
test
A Windows host
169
MONITORING WINDOWS SERVERS
Agent
deploying the
test
An internal agent
Configurable
parameters for
the test
1.
TEST PERIOD - How often should the test be executed
2.
HOST - The host for which the test is to be configured
Outputs of the
test
One set of results for every Windows host monitored
Measurements
made by the
test
Measurement
Copy read hits:
Measurement
Unit
Percent
A copy read is a file read operation that is
satisfied by a memory copy from a page in
the cache to the application's buffer. The LAN
Redirector uses this method for retrieving
information from the cache, as does the LAN
Server for small transfers. This is a method
used by the disk file systems as well. Ideally,
the value of this measure should be high. A
very low value could indicate an increase in
disk accesses and related processing
overheads.
Reads/Sec
The LAN Redirector uses this method for
retrieving information from the file system
cache, as does the LAN Server for small
transfers. This is a method used by the disk
file systems as well.
Indicates the percentage of
cache copy read requests
that hit the cache - i.e.,
they did not require a disk
read in order to provide
access to the page in the
cache.
Copy reads:
Indicates the frequency of
reads from pages of the file
system cache that involve a
memory copy of the data
from the cache to the
application's buffer.
Data flushes:
Interpretation
Flushes/Sec
Indicates the rate at which
the file system cache has
flushed its contents to disk
as the result of a request to
flush or to satisfy a writethrough file write request.
More than one page can be
transferred on each flush
operation.
Data map hits:
Percent
Indicates the percentage of
data maps in the file
system cache that could be
resolved without having to
retrieve a page from the
disk, because the page was
already
in
physical
memory.
170
A high value of this measure is desirable.
MONITORING WINDOWS SERVERS
Data maps:
Maps/Sec
Indicates the frequency
with which a file system
such as NTFS, maps a page
of a file into the file system
cache to read the page.
Fast reads:
Reads/Sec
Normally, file I/O requests invoke the
appropriate file system to retrieve data from
a file, but this path permits direct retrieval of
data from the cache without file system
involvement if the data is in the cache. Even
if the data is not in the cache, one invocation
of the file system is avoided and processing
overheads are reduced.
Flushes/Sec
Lazy Writing is the process of updating the
disk after the page has been changed in
memory, so that the application that changed
the file does not have to wait for the disk
write to be complete before proceeding. More
than one page can be transferred by each
write operation.
Indicates the frequency of
reads from the file system
cache that bypass the
installed file system and
retrieve the data directly
from the cache.
Lazy write flushes:
Indicates the rate at which
the Lazy Writer thread has
written to disk.
Lazy write pages:
Pages/Sec
Indicates the rate at which
the Lazy Writer thread has
written to disk.
MDL read hits:
Percent
Ideally, this percentage should be high.
Reads/Sec
The MDL contains the physical address of
each page involved in the transfer, and thus
can employ a hardware Direct Memory
Access (DMA) device to effect the copy. The
LAN Server uses this method for large
transfers out of the server.
Percent
While pinned, a page's physical address in
the file system cache will not be altered. The
LAN Redirector uses this method for
retrieving data from the cache, as does the
LAN Server for small transfers. This is usually
the method used by the disk file systems as
well.
Indicates the percentage of
Memory Descriptor List
(MDL) Read requests to the
file system cache that hit
the cache, i.e., did not
require disk accesses in
order to provide memory
access to the page(s) in the
cache.
MDL reads:
Indicates the frequency of
reads from the file system
cache that use a Memory
Descriptor List (MDL) to
access the data.
Pin read hits:
Indicates the percentage of
pin read requests that hit
the file system cache, i.e.,
did not require a disk read
in order to provide access
to the page in the file
system cache.
171
MONITORING WINDOWS SERVERS
Read aheads:
Reads/Sec
Indicates the frequency of
reads from the file system
cache in which the Cache
detects sequential access
to a file.
The read aheads permit the data to be
transferred in larger blocks than those being
requested by the application, reducing the
overhead per access.
3.1.12.4 Windows Shares Test
This test periodically connects to remote Windows hosts in the target environment, verifies whether shared folders
configured for monitoring exist on those hosts, and also reports whether/not configured users have at least 'readonly' access to those folders.
Purpose
Periodically connects to remote Windows hosts in the target environment, verifies whether
shared folders configured for monitoring exist on those hosts, and also reports whether/not
configured users have at least 'read-only' access to those folders
Target of the
test
A Windows host
Agent
deploying the
test
An internal agent
172
MONITORING WINDOWS SERVERS
Configurable
parameters for
the test
Outputs of the
test
Measurements
made by the
test
1.
TEST PERIOD - How often should the test be executed
2.
HOST - The host for which the test is to be configured
3.
PORT - The port at which the specified HOST listens. By default, this is NULL.
4.
SHARENAME - Provide the complete path to the shared folder to be monitored. The path
specification
should
be
of
the
following
format:
DisplayName@<Path_to_the_sharedfolder>. For instance, the SHARENAME can be:
win72@\\192.168.10.72\Logs. This DisplayName will appear as the the descriptor of the
test. Many shared folders on multiple remote hosts can be configured as a commaseparated list. For instance: win72@\\192.168.10.72\Logs,sys35@\\192.168.8.35\D$.
5.
SHAREUSERNAME - Provide the name of the user whose right to access the configured
shared folder needs to be monitored. The user name should be specified in the following
format: DisplayName@<Username>. The DisplayName here should be the same as the
DisplayName configured for the SHARENAME parameter. For instance, if SHARENAME is
set to win72@\\192.168.10.72\Logs, then, the SHAREUSERNAME should be:
win72@john. The number of SHAREUSERNAMEs configured should be the same as the
number of SHARENAMEs - in other words, for every SHARENAME configured, a
corresponding SHAREUSERNAME specification should exist. Multiple user name
specifications should be separated by a comma. For example: win72@john,sys35@elvis
6.
PASSWORD - Specify the password that corresponds to the configured
SHAREUSERNAME. The password should be specified in the following format:
DisplayName@<Password>. The DisplayName here should be the same as the
DisplayName configured for the SHARENAME parameter. For instance, if SHARENAME is
set to win72@\\192.168.10.72\Logs, then the PASSWORD will be: win72@john. The
number of PASSWORDs configured should be the same as the number of SHARENAMEs
- in other words, for every SHARENAME configured, a corresponding PASSWORD
specification should exist. Multiple password specifications should be separated by a
comma. For example: win72@john,sys35@elvis
7.
CONFIRM PASSWORD - Confirm each of the PASSWORDs by retyping them using the
same format specification discussed above.
One set of results for every SHARENAME configured
Measurement
Is authentication of
share
folder
successful?:
Measurement
Unit
Number
Indicates
whether
this
shared folder is exists or
not.
173
Interpretation
The value 100 for this measure indicates that
the share exists. If the measure reports the
value 0, it indicates that the shared folder
does not exist. If so, then the test attempts
to create the share using the configured user
credentials.
MONITORING WINDOWS SERVERS
Is
share
accessible?:
folder
Number
Indicates whether/not the
configured user has at least
‘read-only’ access to this
shared folder.
If the shared folder exists (i.e., if the Share
Authentication measure reports the value
100), then the value 100 for this measure
indicates that the configured user can open
the shared folder and read its contents.
If the shared folder does not exist (i.e., if the
Share Authentication measure reports the
value 0), then the value 100 for this measure
indicates that the configured user could
create the shared folder.
Likewise, if the shared folder exists (i.e., if
the Share Authentication measure reports the
value 100), then the value 0 for this measure
indicates that the configured user does not
have the right to access the folder.
On the other hand, if the shared folder does
not exist (i.e., if the Share Authentication
measure reports the value 0), then the value
0 for this measure indicates that the
configured user could not create the shared
folder.
3.1.12.5 Windows Scheduled Tasks Test
The Task Scheduler on Windows systems enables you to automatically perform routine tasks - eg., starting an
application, sending an email, or showing a message box - on a chosen computer. Tasks can be scheduled to
execute:
When a specific system event occurs.
At a specific time.
At a specific time on a daily schedule.
At a specific time on a weekly schedule.
At a specific time on a monthly schedule.
At a specific time on a monthly day-of-week schedule.
When the computer enters an idle state.
When the task is registered.
When the system is booted.
When a user logs on.
When a Terminal Server session changes state.
174
MONITORING WINDOWS SERVERS
Administrators need to continuously track the status of tasks so scheduled, so that they can always tell which tasks
are running as per schedule and which scheduled tasks have failed. The Windows Scheduled Tasks test helps in this
regard. This test monitors pre-configured tasks at periodic intervals and reports the count of tasks in various stages
of progress. To determine which tasks are in what state currently, use the detailed diagnosis of the test.
Purpose
Reveals whether or not the operating system's cache has been effectively utilized
Target of the
test
A Windows host
Agent
deploying the
test
An internal/remote agent
Configurable
parameters for
the test
1.
TEST PERIOD - How often should the test be executed
2.
HOST - The host for which the test is to be configured
3.
PORT - The port at which the specified HOST listens
4.
TASKLIST - By default, all is displayed here indicating that the test monitors all scheduled
tasks by default. You can override this default setting by providing a comma-separated list
of tasks to be monitored. Note that the task name specified here should be exactly the same
as that which is displayed in the 'Scheduled Tasks' window that appears when the
'Scheduled Tasks' option in the Control Panel is clicked.
5.
Outputs of the
test
Measurements
made by the
test
EXCLUDE FOLDER – If this test is being configured for a Windows 2008 system, then
you can exclude all scheduled tasks that reside in specific folders from the monitoring
purview of this test. For this , provide a comma-separated list of folders to be excluded in
this text box. For instance, \Microsoft,\*\Windows\*,\*\WPD,\*\Windows Defender. By
default, this parameter is none.
One set of results for the Windows system being monitored
Measurement
Running tasks:
Measurement
Unit
Interpretation
Number
Indicates the number of
tasks that are currently
running.
Succeeded tasks:
Number
Use the detailed diagnosis of this measure to
know which tasks have succeeded.
Number
A task is said to have failed when the most
recent attempt to start the task did not work.
Indicates the number of
tasks that are not running
currently,
but
ran
successfully during its last
scheduled execution.
Failed tasks:
Indicates the number of
tasks that failed currently.
Use the detailed diagnosis of this measure to
view the failed tasks.
175
MONITORING WINDOWS SERVERS
Disabled tasks:
Number
If one or more attempts to run a task was
missed, then such a task is counted as a
disabled task. Tasks that have been explicitly
disabled by a user will also be included in the
disabled tasks count.
Number
Use the detailed diagnosis of this measure to
determine the unknown tasks.
Indicates the number of
tasks that are currently
disabled.
Unknown tasks:
Indicates the number of
tasks that could not be
identified.
Queued tasks:
Number
Indicates the number of
tasks in queue currently.
3.1.12.6 Domain Time Sync Test
Time synchronization is one of the most important dependencies of Windows.
In Microsoft Windows XP, the Windows Time service automatically synchronizes your computer's internal clock with
other clocks in the network. The time source for this synchronization varies, depending on whether the computer is
joined to an Active Directory domain or to a workgroup.
When the computers are part of a workgroup, you must manually configure the time synchronization settings. You
might identify a computer as a locally reliable time source by configuring the Windows Time service on that computer
to use a known accurate time source, either by using special hardware or by using a time source that is available on
the Internet. You can configure all other workgroup computers manually to synchronize their time with this local time
source.
If the computers belong to an Active Directory domain, the Windows Time service configures itself automatically by
using the Windows Time service that is available on domain controllers. The Windows Time service configures a
domain controller in its domain as a reliable time source and synchronizes itself periodically with this source. You can
modify or overwrite these settings, depending on your specific needs.
A time protocol is responsible for determining the best available time information and converging the clocks to
ensure that a consistent time is maintained across systems. By default, windows supports a tolerance of plus or
minus five minutes for clocks. If the time variance exceeds this setting, clients will be unable to authenticate and in
the case of domain controllers, replication will not occur. It implements a time synchronization system based on
Network Time Protocol (NTP).
NTP is a fault-tolerant, highly scalable time protocol and it is used for synchronizing computer clocks by using a
designated reference clock. A reference clock is some device or machinery that spits out the current time. The special
thing about these things is accuracy. Reference clocks must be accurately following some time standard. NTP will
compute some additional statistical values based on the current time reported by the reference clock, which will
describe the quality of time it sees. Among these values are: offset (or phase), jitter (or dispersion), frequency error,
and stability. Thus each NTP server will maintain an estimate of the quality of its reference clocks and of itself.
This test reports the time difference between the reference clock and that of the target environment, and thus helps
assess the quality of time seen by the windows server. With the help of this test, you can also easily determine
whether the reference time changed recently.
Purpose
Reports the time difference between the reference clock and that of the target environment, and
thus helps assess the quality of time seen by the windows server
Target of the
A Windows host
176
MONITORING WINDOWS SERVERS
test
Agent
deploying the
test
An internal agent
Configurable
parameters for
the test
1.
TEST PERIOD - How often should the test be executed
2.
HOST - The host for which the test is to be configured.
Outputs of the
test
One set of results for the Windows host being monitored
Measurements
made by the
test
Measurement
NTP offset:
Measurement
Unit
Secs
Indicates the time difference
between the local clock and the
designated reference clock.
Interpretation
For a tiny offset, NTP will adjust the local
clock; for small and larger offsets, NTP will
reject the reference time for a while. In the
latter case, the operating system's clock will
continue with the last corrections effective
while the new reference time is being
rejected. After some time, small offsets
(significantly less than a second) will be
slewed (adjusted slowly), while larger
offsets will cause the clock to be stepped
(set anew). Huge offsets are rejected, and
NTP will terminate
itself,
believing
something very strange must have
happened.
3.2 The Network Layer
The Network layer handles connectivity of the host system to the network, and includes packet traffic transmitted to
and from the server. Like the Generic server, the Network layer of the Windows Generic server also executes a
Network and a NetworkTraffic test. In addition to these two tests, an exclusive WindowsNetworkTraffic test (see
Figure 3. 6) is mapped to the Windows Generic server.
Figure 3. 6: Tests associated with the Network layer of a Windows Generic server
177
MONITORING WINDOWS SERVERS
3.2.1
Windows Network Traffic Test
This is an internal test that monitors the incoming and outgoing traffic through a Microsoft Windows server.
Purpose
To measure the incoming and outgoing traffic through a Microsoft Windows server
Target of the
test
A Windows host
Agent deploying
the test
An internal agent
Configurable
parameters for
the test
1.
TEST PERIOD - How often should the test be executed
2.
HOST - The host for which the test is to be configured
3.
EXCLUDE – Provide the network interfaces to be excluded from monitoring, as a
comma-separated list.
Outputs of the
test
Measurements
made by the test
One set of results for every network interface of the target host
Measurement
Incoming traffic:
Measurement
Unit
Mbps
Indicates the rate at which
data
(including
framing
characters) is received on a
network interface.
Interpretation
An abnormally high rate of incoming traffic
may require additional analysis.
For a managed Hyper-V or Hyper-V VDI
component, the Windows Network Traffic test
reports metrics for an additional Total
descriptor. For this descriptor, this measure
will reveal the rate of incoming data traffic on
all network interfaces supported by the
Hyper-V or Hyper-V VDI host.
Outgoing
traffic:
Represents the rate at which
data
(including
framing
characters) is sent on a
network interface.
Mbps
Max bandwidth:
Mbps
An abnormally high rate of outgoing traffic
may require additional analysis.
For a managed Hyper-V or Hyper-V VDI
component, the Windows Network Traffic test
reports metrics for an additional Total
descriptor. For this descriptor, this measure
will reveal the rate of outgoing data traffic on
all network interfaces supported by the
Hyper-V or Hyper-V VDI host.
An estimate of the capacity
of a network interface.
178
This measure will not be reported for the
‘Total’ descriptor of this test.
MONITORING WINDOWS SERVERS
Bandwidth usage:
Percent
Indicates the percentage of
bandwidth used by this
network interface.
By comparing the bandwidth usage with the
maximum bandwidth of an interface, an
administrator can determine times when the
network interface is overloaded or is being a
performance bottleneck.
For a managed Hyper-V or Hyper-V VDI
component, the Windows Network Traffic test
reports metrics for an additional Total
descriptor. For this descriptor, this measure
will reveal the total bandwidth used by the
target Hyper-V or Hyper-V VDI host across all
its network interfaces.
Output queue length:
Number
Indicates the length of the
output packet queue (in
packets)
Outbound packet errors:
For a managed Hyper-V or Hyper-V VDI
component, the Windows Network Traffic test
reports metrics for an additional Total
descriptor. For this descriptor, this measure
will reveal the total number of packets in the
output queues of all network interfaces
supported by the Hyper-V or Hyper-V VDI
host.
Number
The number of outbound
packets that could not be
transmitted
because
of
errors
Inbound packet errors:
If this is longer than 2, delays are being
experienced and the bottleneck should be
found and eliminated if possible.
Ideally, number of outbound errors should be
0.
For a managed Hyper-V or Hyper-V VDI
component, the Windows Network Traffic test
reports metrics for an additional Total
descriptor. For this descriptor, this measure
will reveal the total number of outbound
packets with errors on all network interfaces
supported by the Hyper-V or Hyper-V VDI
host.
Number
The number of inbound
packets
that
contained
errors preventing them from
being deliverable to a
higher-layer protocol.
Ideally, number of inbound errors should be
0.
For a managed Hyper-V or Hyper-V VDI
component, the Windows Network Traffic test
reports metrics for an additional Total
descriptor. For this descriptor, this measure
will reveal the total number of inbound
packets with errors on all network interfaces
supported by the Hyper-V or Hyper-V VDI
host.
If Windows Network TrafficTest is not reporting measures for a server, make sure that you have enabled the SNMP
service for that server.
179
MONITORING WINDOWS SERVERS
3.3 The Tcp Layer
Using the Tcp test, the Tcp layer monitors the health of TCP connections to and from the target server.
Figure 3. 7: The tests mapped to the Tcp layer of a Windows Generic server
Since the Tcp test has already been discussed in the Monitoring Generic Servers chapter, let us proceed to look at
the TcpTraffic test.
3.3.1
TcpTraffic Test
The Tcp layer of Windows servers like MS SQL, Exchange, Citrix, etc., will have an additional TcpTraffic test (see
Figure 3. 7). This test monitors the TCP protocol traffic to and from a server. Since most popular applications (Web
servers, Citrix, Databases, Application servers, etc.) rely on the TCP protocol for their proper functioning, traffic
monitoring at the TCP protocol layer can provide good indicators of the performance seen by the applications that
use TCP. The most critical metric at the TCP protocol layer is the percentage of retransmissions. Since TCP uses an
exponential back-off algorithm for its retransmissions, any retransmission of packets over the network (due to
network congestion, noise, data link errors, etc.) can have a significant impact on the throughput seen by
applications that use TCP.
Purpose
Monitors the TCP protocol traffic to and from a server, and particularly measures the percentage
of retransmission
Target of the
test
A host system (Windows servers only)
Agent
deploying the
test
An internal agent
Configurable
parameters for
the test
1.
TEST PERIOD – How often should the test be executed
2.
HOST - The host for which the test is to be configured.
3.
SEGMENTS_SENT_MIN - Specify the minimum threshold for the number of segments
sent/transmitted over the network. The default value is 10; in this case, the test will
compute/report the TCP retransmit ratio measure only if more than 10 segments are sent
over the network. On the other hand, if less than 10 segments are sent, then the test will
not compute/report the TCP retransmit ratio measure. This is done to ensure that no false
alerts are generated by the eG Enterprise system for the TCP retransmit ratio measure. You
can change this minimum threshold to any value of your choice.
180
MONITORING WINDOWS SERVERS
Outputs of the
test
Measurements
made by the
test
One set of results for each host system monitored
Measurement
Measurement
Unit
Segments received:
Segments/Sec
Interpretation
Indicates the rate at which
segments are received by the
server.
Segments sent:
Segments/Sec
Indicates the rate at which
segments are sent to clients
or other servers
Segment retransmissions:
Segments/Sec
Indicates the rate at which
segments
are
being
retransmitted by the server to
clients/other servers
TCP retransmit ratio:
Percent
Indicates the ratio of the rate of
data retransmissions to the rate
of data being sent by the server
to clients/other servers
Ideally, the retransmission ratio should be
low (< 5%). Most often retransmissions at
the TCP layer have significant impact on
application performance. Very often a large
number of retransmissions are caused by a
congested network link, bottlenecks at a
router causing buffer/queue overflows, or by
lousy network links due to poor physical
layer characteristics (e.g., low signal to
noise ratio). By tracking the percentage of
retransmissions at a server, an administrator
can quickly be alerted to problem situations
in the network link(s) to the server that may
be impacting the service performance.
3.4 The OS Cluster Layer
This layer will appear only if the ‘Fail over cluster service’ is enabled on the Windows system/server being monitored.
With the help of the tests mapped to this layer, you can determine the following:
Know the clusters that are currently managed by the Windows Failover Cluster Manager;
Know which nodes are part of a cluster;
Determine the current state of each node;
Rapidly detect the failure of the cluster service on the monitored node;
Identify the services/applications that have been clustered, promptly detect service/application failures, and
pinpoint the probable reasons for the same;
Identify cluster networks that are currently down;
Pinpoint cluster resources that are offline;
181
MONITORING WINDOWS SERVERS
Track the current capacity and usage of cluster disks and cluster shared volumes and proactively detect
potential space crunches.
Figure 3.8: The tests mapped to the OS Cluster layer
Note:
The tests mapped to the OS Cluster layer run only in the agent-based mode. This is why, you need to
install an eG agent on at least one node in the cluster to enable these tests to report cluster-level metrics. For
best results however, it is recommended that you install an eG agent on each node in the cluster; this way,
even if one node goes down due to any reason, cluster health can continue to be monitored using the agents
on the other nodes.
3.4.1
Cluster Nodes Test
The independent Windows systems that are grouped in a cluster and that work together as a unified computing
resource are known as nodes. In a fail-over cluster typically, the cluster nodes are connected by physical cables and
by software. If one of the nodes fails, another node begins to provide service through a process known as failover.
As long as users have continuous access to the cluster resources, they will not care which cluster node is currently
active and is serving their requests. Administrators on the other hand, may want to know which node in the cluster is
active, and why certain nodes have gone down. To determine the same, administrators can run the Cluster Nodes
test. This test reports the current status of each node in every cluster that has been configured on the server, and
thus points administrators to those cluster nodes that are currently down or whose operations have been paused.
Purpose
Reports the current status of each node in every cluster that has been created, and thus points
administrators to those cluster nodes that are currently down or whose operations have been
paused
Target of the
test
A node in a Windows cluster
Agent
deploying the
test
An internal agent
182
MONITORING WINDOWS SERVERS
Configurable
parameters for
the test
1.
TEST PERIOD – How often should the test be executed
2.
HOST - The host for which the test is to be configured.
3.
PORT – The port at which the specified HOST listens. By default, this is Null.
4.
WORK IN PASSIVE MODE – If this flag is set to No, then this test will report metrics only
if the target cluster node is the active node in the cluster. If it is the passive node, then
this test will not report any metrics. You can set this flag to Yes, if you want the test to
report metrics regardless of whether the monitored node is the active or passive node of
the cluster.
5.
DD FREQUENCY - Refers to the frequency with which detailed diagnosis measures are to
be generated for this test. The default is 1:1. This indicates that, by default, detailed
measures will be generated every time this test runs, and also every time the test detects
a problem. You can modify this frequency, if you so desire. Also, if you intend to disable
the detailed diagnosis capability for this test, you can do so by specifying none against DD
FREQUENCY.
6.
DETAILED DIAGNOSIS - To make diagnosis more efficient and accurate, the eG
Enterprise suite embeds an optional detailed diagnostic capability. With this capability, the
eG agents can be configured to run detailed, more elaborate tests as and when specific
problems are detected. To enable the detailed diagnosis capability of this test for a
particular server, choose the On option. To disable the capability, click on the Off option.
The option to selectively enable/disable the detailed diagnosis capability will be available
only if the following conditions are fulfilled:
The eG manager license should allow the detailed diagnosis capability
Both the normal and abnormal frequencies configured for the detailed diagnosis
measures should not be 0.
Outputs of the
test
Measurements
made by the
One set of results for each node in every cluster created
Measurement
Measurement
Unit
183
Interpretation
MONITORING WINDOWS SERVERS
test
Cluster node status:
The values that this measure can report and
their corresponding numeric values have
been listed in the table below:
Indicates the current state of
this node.
Measure Value
Numeric Value
Up
0
Down
1
Pause
2
Note:
By default, this measure reports one of the
Measure Values listed in the table above.
The graph of this measure however will
represent the same using the numeric
equivalents only.
To know the network interface, network
adapter, and other attributes a cluster node
has been configured with, use the detailed
diagnosis of this measure.
3.4.2
Cluster Networks Test
A network (sometimes called an interconnect) performs one of the following roles in a cluster:
A private network carries internal cluster communication. The Cluster service authenticates all internal
communication, but administrators who are particularly concerned about security can restrict internal
communication to physically secure networks.
A public network provides client systems with access to cluster application services. IP Address
resources are created on networks that provide clients with access to cluster services.
A mixed (public-and-private) network carries internal cluster communication and connects client
systems to cluster application services.
A network that is not enabled for use by the cluster (that is, neither public nor private) carries traffic unrelated to
cluster operation.
Regardless of the role that a network performs, its availability is critical to the smooth functioning of the cluster, as
without the network, communication between cluster nodes and between clients and cluster nodes become
impossible. This is why, if a client complains of service/resource inaccessibility, administrators must check the status
of the cluster networks to figure out if a down network is what is denying end-users access. This is where the Cluster
Networks test helps.
Using the Cluster Networks test, administrators can determine which cluster network is up and which is down, so
that they can ascertain what type of cluster communication is impacted – internal communication between the
cluster nodes? Communication between the client and the cluster services/applications? Or both?
Purpose
Helps administrators determine which cluster network is up and which is down, so that they can
184
MONITORING WINDOWS SERVERS
ascertain what type of cluster communication is impacted – internal communication between the
cluster nodes? Communication between the client and the cluster services/applications? Or
both?
Target of the
test
A node in a Windows cluster
Agent
deploying the
test
An internal agent
Configurable
parameters for
the test
1.
TEST PERIOD – How often should the test be executed
2.
HOST - The host for which the test is to be configured.
3.
PORT – The port at which the specified HOST listens. By default, this is Null.
4.
WORK IN PASSIVE MODE – If this flag is set to No, then this test will report metrics only
if the target cluster node is the active node in the cluster. If it is the passive node, then
this test will not report any metrics. You can set this flag to Yes, if you want the test to
report metrics regardless of whether the monitored node is the active or passive node of
the cluster.
Outputs of the
test
Measurements
made by the
test
One set of results for each cluster network configured for every cluster created
Measurement
Measurement
Unit
Cluster network status:
Interpretation
The values that this measure can report and
their corresponding numeric values have
been listed in the table below:
Indicates the current state of
this cluster network.
Measure Value
Numeric Value
Up
0
Down
1
Note:
By default, this measure reports one of the
Measure Values listed in the table above.
The graph of this measure however will
represent the same using the numeric
equivalents only.
3.4.3
Cluster Disks Test
A cluster resource is any physical or logical component that has the following characteristics:
Can be brought online and taken offline.
Can be managed in a server cluster.
185
MONITORING WINDOWS SERVERS
Can be hosted (owned) by only one node at a time.
One of the standard cluster resource type is the Physical Disk Resource Type. You use the Physical Disk resource
type to manage disks that are on a cluster storage device. Each cluster disk will at any point in time be owned only
by a single node in the cluster. Moreover, when configuring a service or application for a cluster, you can select the
cluster disk the service/application should use.
If a cluster disk fails or is in an offline state for a long time, it might affect the functioning of the services/applicatio ns
that rely on that disk for their functioning. Likewise, if a cluster disk runs short of space suddenly, once again the
associated services/applications will be affected. To protect these critical services/applications from failure and to
define robust fail-over policies for cluster disk resources, administrators will have to continuously monitor the state
and usage of each of the cluster disk resources. This can be achieved using the Cluster Disks test. This test
auto-discovers the cluster disks and tracks the state and usage of each disk, so that administrators are proactively
alerted to abnormalities in the state and excesses in the usage of any disk.
Purpose
Auto-discovers the cluster disks and tracks the state and usage of each disk, so that
administrators are proactively alerted to abnormalities in the state and excesses in the usage of
any disk
Target of the
test
A node in a Windows cluster
Agent
deploying the
test
An internal agent
Configurable
parameters for
the test
1.
TEST PERIOD – How often should the test be executed
2.
HOST - The host for which the test is to be configured.
3.
PORT – The port at which the specified HOST listens. By default, this is Null.
4.
WORK IN PASSIVE MODE – If this flag is set to No, then this test will report metrics only
if the target cluster node is the active node in the cluster. If it is the passive node, then
this test will not report any metrics. You can set this flag to Yes, if you want the test to
report metrics regardless of whether the monitored node is the active or passive node of
the cluster.
5.
DETAILED DIAGNOSIS - To make diagnosis more efficient and accurate, the eG
Enterprise suite embeds an optional detailed diagnostic capability. With this capability, the
eG agents can be configured to run detailed, more elaborate tests as and when specific
problems are detected. To enable the detailed diagnosis capability of this test for a
particular server, choose the On option. To disable the capability, click on the Off option.
The option to selectively enable/disable the detailed diagnosis capability will be available
only if the following conditions are fulfilled:
The eG manager license should allow the detailed diagnosis capability
Both the normal and abnormal frequencies configured for the detailed diagnosis
measures should not be 0.
Outputs of the
test
Measurements
made by the
One set of results for each cluster disk associated with every cluster created
Measurement
Measurement
Unit
186
Interpretation
MONITORING WINDOWS SERVERS
test
Cluster disk status:
The values that this measure can report and
their corresponding numeric values have
been listed in the table below:
Indicates the current state of
this cluster disk.
Measure Value
Numeric Value
Online
0
Offline
1
Failed
2
Note:
By default, this measure reports one of the
Measure Values listed in the table above.
The graph of this measure however will
represent the same using the numeric
equivalents only.
If the cluster service detects that a cluster
disk is not operational, it attempts to restart
that cluster disk. You can specify the
number of times the cluster service can
attempt to restart a resource in a given time
interval. If the cluster service exceeds the
maximum number of restart attempts within
the specified time period, and the disk is still
not operational, the cluster service considers
the disk to have failed. Typically, a failed
disk will adversely impact the availability and
performance of the services/applications to
which that disk has been assigned.
To
ensure
high
availability
of
services/applications, you can add the
cluster disk and the services/applications
that depend on that disk to a single cluster
group and configure a fail-over policy for
that group. Then, you can configure the
failure of the cluster disk to trigger a group
fail-over, so that the entire group is failed
over to another node in the cluster.
The detailed diagnosis of this measure, if
enabled, will indicate the path of the cluster
disk, which node currently owns the cluster
disk, the shared volume, and the owner
group.
187
MONITORING WINDOWS SERVERS
Total
disk:
capacity
of
cluster
MB
Indicates the total capacity of
this cluster disk.
Space used in cluster disk:
MB
Ideally, the value of this measure should be
low. A high value is indicative of excessive
space usage by a cluster disk.
MB
A high value is desired for this measure.
Percent
A value close to 100% is indicative of
abnormal space usage. Compare the value
of this measure across cluster disks to know
disk is using space excessively. Before
assigning
storage
to
a
cluster
service/application, you may want to check
this comparison to figure out which cluster
disks have enough space to manage more
services/applications.
Indicates the space in this
cluster disk that is in use
currently.
Free space in cluster disk:
Indicates the amount of space
in this cluster disk that is
currently unused.
Percentage of cluster disk
space used:
Indicates the percentage of the
total capacity of this cluster disk
that is utilized.
Using the detailed diagnosis of the Cluster disk status measure, you can determine the path of the cluster disk, which
node currently owns the cluster disk, the shared volume, and the owner group.
Figure 3.9: The detailed diagnosis of the Cluster disk status measure
3.4.4
Cluster Services/Applications Test
A variety of different services or applications can be configured for high availability in a failover cluster. While some
services/applications are cluster-aware – i.e., are applications that function in a co-ordinated way with other cluster
components – some others are cluster-unaware – i.e., are applications that do not interact with the cluster at all.
The list of cluster-aware applications that administrators can choose from when configuring high-availability are as
follows:
DFS Namespace Server: Provides a virtual view of shared folders in an organization. When a user
views the namespace, the folders appear to reside on a single hard disk. Users can navigate the
namespace without needing to know the server names or shared folders that are hosting the data.
DHCP Server: Automatically provides client computers and other TCP/IP-based network devices with
188
MONITORING WINDOWS SERVERS
valid IP addresses.
Distributed Transaction Coordinator (DTC): Supports distributed applications that perform
transactions. A transaction is a set of related tasks, such as updates to databases, that either succeed
or fail as a unit.
File Server: Provides a central location on your network where you can store and share files with
users.
Internet Storage Name Service (iSNS) Server: Provides a directory of iSCSI targets.
Message Queuing: Enables distributed applications that are running at different times to
communicate across heterogeneous networks and with computers that may be offline.
Other Server: Provides a client access point and storage only.
Print Server: Manages a queue of print jobs for a shared printer.
Remote Desktop Connection Broker (formerly TS Session Broker): Supports session load
balancing and session reconnection in a load-balanced remote desktop server farm. RD Connection
Broker is also used to provide users access to RemoteApp programs and virtual desktops through
RemoteApp and Desktop Connection.
Virtual Machine: Runs on a physical computer as a virtualized computer system. Multiple virtual
machines can run on one computer.
WINS Server: Enables users to access resources by a NetBIOS name instead of requiring them to
use IP addresses that are difficult to recognize and remember.
To configure high-availability for services/applications that are cluster-unaware, administrators can use the Generic
Application, Generic Script, and Generic Service options.
When configuring fail-over for a service/application, you need to assign an IP address to that service/application. You
can also add storage to a clustered service/application, or even associate additional resources with the
service/application.
When a service/application fails over, administrators may need to know which cluster node that service/application
has switched to. Likewise, administrators will also need to know if fail-over was unsuccessful for a
service/application, and if so, why - is it because the cluster disk used by the service/application has run out of
space? Is it because the IP address of the service/application is in conflict with another IP address in the
environment? Is it because the service/application has been deliberately stopped or brought to the offline mode?
The Cluster Service/Applications Test provides administrators with answers to all these questions!
For each service/application that has been configured for high-availability, this test reports the current state of that
service/application, thus enabling administrators to figure out if fail-over was successful or not. The test additionally
reports the IP state and server state of each service/application and tracks the space usage in the storage mapped to
a service/application, thus pointing administrators to the probable cause for service failures. The resources added to
every service/application and the current state of the resources is also revealed, so that administrators can determine
whether/not the offline state of a resource is causing the dependent service/application to fail.
Purpose
For each service/application that has been configured for high-availability, this test reports the
current state of that service/application, thus enabling administrators to figure out if fail-over
was successful or not. The test additionally reports the IP state and server state of each
service/application and tracks the space usage in the storage mapped to a service/application,
189
MONITORING WINDOWS SERVERS
thus pointing administrators to the probable cause for service failures. The resources added to
every service/application and the current state of the resources is also revealed, so that
administrators can determine whether/not the offline state of a resource is causing the
dependent service/application to fail.
Target of the
test
A node in a Windows cluster
Agent
deploying the
test
An internal agent
Configurable
parameters for
the test
1.
TEST PERIOD – How often should the test be executed
2.
HOST - The host for which the test is to be configured.
3.
PORT – The port at which the specified HOST listens. By default, this is Null.
4.
WORK IN PASSIVE MODE – If this flag is set to No, then this test will report metrics
only if the target cluster node is the active node in the cluster. If it is the passive node,
then this test will not report any metrics. You can set this flag to Yes, if you want the test
to report metrics regardless of whether the monitored node is the active or passive node
of the cluster.
5.
DD FREQUENCY - Refers to the frequency with which detailed diagnosis measures are to
be generated for this test. The default is 1:1. This indicates that, by default, detailed
measures will be generated every time this test runs, and also every time the test detects
a problem. You can modify this frequency, if you so desire. Also, if you intend to disable
the detailed diagnosis capability for this test, you can do so by specifying none against DD
FREQUENCY.
6.
DETAILED DIAGNOSIS - To make diagnosis more efficient and accurate, the eG
Enterprise suite embeds an optional detailed diagnostic capability. With this capability, the
eG agents can be configured to run detailed, more elaborate tests as and when specific
problems are detected. To enable the detailed diagnosis capability of this test for a
particular server, choose the On option. To disable the capability, click on the Off option.
The option to selectively enable/disable the detailed diagnosis capability will be available
only if the following conditions are fulfilled:
The eG manager license should allow the detailed diagnosis capability
Both the normal and abnormal frequencies configured for the detailed diagnosis
measures should not be 0.
Outputs of the
test
Measurements
made by the
One set of results for each service/application managed by every cluster created
Measurement
Measurement
Unit
190
Interpretation
MONITORING WINDOWS SERVERS
test
Service/application status:
The values that this measure can report and
their corresponding numeric values have
been listed in the table below:
Indicates the current state of
this service/application.
Measure Value
Numeric Value
Online
0
PartialOnline
1
Offline
2
Failed
3
If this measure reports the value Failed for
a service/application, it is a clear indicator
that that service/application could not be
failed over. In such a situation, you can
check the value of the Server state, IP
state, Failed resources, and Percentage of
space free in used cluster disks measures of
that service to know what could have
possibly caused the service/application to
fail.
For further diagnosis, you can also use the
detailed diagnostics reported by this test,
which reveals the resources associated with
the service/application and the current state
of each resource.
Note:
By default, this measure reports one of the
Measure Values listed in the table above.
The graph of this measure however will
represent the same using the numeric
equivalents only.
191
MONITORING WINDOWS SERVERS
Server status:
When using the Failover Cluster Manager
to configure high availability for a
service/application, you are required to
provide a fully qualified DNS name for the
service/application being configured and
assign an IP address to it. This measure
reports the current state of that DNS name.
To know which name was assigned to the
service, use the detailed diagnosis of this
measure.
Indicates the current state of
the server created in the cluster
for this service/application.
The values that this measure can report and
their corresponding numeric values have
been listed in the table below:
Measure Value
Numeric Value
Online
0
PartialOnline
1
Offline
2
Failed
3
Note:
By default, this measure reports one of the
Measure Values listed in the table above.
The graph of this measure however will
represent server states using the numeric
equivalents only.
192
MONITORING WINDOWS SERVERS
IP status:
The values that this measure can report and
their corresponding numeric values have
been listed in the table below:
Indicates the current status of
the IP address assigned to this
service/application.
Measure Value
Numeric Value
Online
0
PartialOnline
1
Offline
2
Failed
3
Note:
By default, this measure reports one of the
Measure Values listed in the table above.
The graph of this measure however will
represent IP states using the numeric
equivalents only.
Use the detailed diagnosis of this measure
to know the IP address assigned to the
service/application.
Has the owner changed?:
The values that this measure can report and
their corresponding numeric values have
been listed in the table below:
Indicates
whether/not
the
owner of this service/application
has changed since the last
measurement period.
Measure Value
Numeric Value
No
0
Yes
1
If this measure reports the value No for a
service/application, and Service state is
Failed, then it clearly indicates that fail-over
has not occurred for that service/application.
Note:
By default, this measure reports one of the
Measure Values listed in the table above.
The graph of this measure however will
represent whether/not the owner has
changed using the numeric equivalents only.
To know which node currently owns the
service/application,
use
the
detailed
diagnosis of this measure.
193
MONITORING WINDOWS SERVERS
Total disk space:
MB
Use the detailed diagnosis of this measure
to know which cluster disks are attached to
a service/application, the current status of
the disks, and the usage of each disk.
MB
Ideally, the value of this measure should be
high.
MB
Ideally, the value of this measure should be
high. Compare the value of this measure
across services/applications to know which
service/application has the least free space.
You may want to make space in the cluster
disks mapped to this service/application, so
as to prevent service/application failure
owing to lack of space.
Number
Use the detailed diagnosis of this measure
to know the name, type, and owner of all
the
resources
associated
with
a
service/application.
Number
Use the detailed diagnosis of this measure
to know the name, type, state and owner of
the online resources associated with a
service/application.
Number
Use the detailed diagnosis of this measure
to know the name, type, state, and owner of
the offline resources associated with a
service/application.
Number
Ideally, the value of this measure should be
0. If this measure reports a non-zero value,
you can use the detailed diagnosis of this
measure to know the name, type, state, and
owner of each of the failed resources
associated with a service/application.
Indicates the total capacity of
all cluster disks mapped to this
service/application.
Total free space:
Indicates the total amount of
free space in all cluster disks
mapped
to
this
service/application.
Percentage of space free:
Indicates the percentage of
space that is free in the cluster
disks
mapped
to
this
service/application.
Total resources:
Indicates the number of other
resources that are online in this
service/application.
Online resources:
Indicates
the
number
of
resources associated with this
service/application that are
currently online.
Offline resources:
Indicates
the
number
of
resources associated with this
service/application that are
currently offline.
Failed resources:
Indicates
the
number
of
resources associated with this
service/application that have
failed currently.
The detailed diagnosis of the Service/application status measure reveals the name and state of the resources
associated with a service.
Figure 3.10: The detailed diagnosis of the Service/application status measure
194
MONITORING WINDOWS SERVERS
The detailed diagnosis of the Server status measure reveals the DNS name that was assigned to the
service/application when it was configured for high availability.
Figure 3.11: The detailed diagnosis of the Server status measure
Using the detailed diagnosis of the IP status measure you can determine the IP address assigned to the
service/application.
Figure 3.12: The detailed diagnosis of the IP status measure
To know which node currently owns the service/application, use the detailed diagnosis of the Has the owner
changed? measure.
Figure 3.13: The detailed diagnosis of the Has the owner changed? measure
Use the detailed diagnosis of the Total disk space measure to know which cluster disks are attached to a
service/application, the current status of the disks, and the usage of each disk. With the help of this information,
administrators can quickly identify those disks that may be running out of space and draw out plans to increase the
capacity of such disks, so that service/application failures can be averted.
Figure 3.14: The detailed diagnosis of the Total disk space measure
The detailed diagnosis of the Failed resources measure reveals the name, type, current state, owner, and resource
group of each failed resource.
Figure 3.15: The detailed diagnosis of the Failed resources measure
195
MONITORING WINDOWS SERVERS
The detailed diagnosis of the Offline resources measure reveals the name, type, current state, owner, and resource
group of each failed resource.
Figure 3.16: The detailed diagnosis of the Offline resources measure
3.4.5
Cluster Storage Summary Test
One of the most important aspects to plan for before configuring a fail-over cluster is storage. Sufficient storage
space must be available for the use of the cluster resources at all times, so that these critical resources do not fail
owing to the lack of enough free space in the cluster storage. Administrators should hence periodically track the
space usage in the cluster storage, check whether cluster disks in storage are used effectively or not, determine how
much free space is available in the used and unused cluster disks, and figure out whether/not the space available is
sufficient to handle the current and the future workload of the cluster. To monitor space usage in the cluster storage
and take informed, intelligent storage management decisions, administrators can take the help of the Cluster Storage
Summary test.
This test monitors the cluster storage and presents a quick summary of the space usage across the used and unused
cluster disks that are part of the storage. In the process, the test reveals how much free space is available in the
used and unused disks in the storage; using this metric, administrators can figure out whether/not the cluster has
enough free space to meet the current and the future demands. If not, administrators can use the pointers provided
by this test again to decide what needs to be done to avert resource failures - should more physical disk resources be
added to the cluster to handle the current and anticipated load? should space be cleared in the used cluster disks to
make room for more data? can better management of unused disks help conserve storage space?
Purpose
Monitors the cluster storage and presents a quick summary of the space usage across the used
and unused cluster disks that are part of the storage. In the process, the test reveals how much
free space is available in the used and unused disks in the storage; using this metric,
administrators can figure out whether/not the cluster has enough free space to meet the current
and the future demands. If not, administrators can use the pointers provided by this test again
to decide what needs to be done to avert resource failures - should more physical disk resources
be added to the cluster to handle the current and anticipated load? should space be cleared in
the used cluster disks to make room for more data? can better management of unused disks
help conserve storage space?
Target of the
test
A node in a Windows cluster
Agent
deploying the
test
An internal agent
196
MONITORING WINDOWS SERVERS
Configurable
parameters for
the test
1.
TEST PERIOD – How often should the test be executed
2.
HOST - The host for which the test is to be configured.
3.
PORT – The port at which the specified HOST listens. By default, this is Null.
4.
WORK IN PASSIVE MODE – If this flag is set to No, then this test will report metrics only
if the target cluster node is the active node in the cluster. If it is the passive node, then
this test will not report any metrics. You can set this flag to Yes, if you want the test to
report metrics regardless of whether the monitored node is the active or passive node of
the cluster.
5.
DETAILED DIAGNOSIS - To make diagnosis more efficient and accurate, the eG
Enterprise suite embeds an optional detailed diagnostic capability. With this capability, the
eG agents can be configured to run detailed, more elaborate tests as and when specific
problems are detected. To enable the detailed diagnosis capability of this test for a
particular server, choose the On option. To disable the capability, click on the Off option.
The option to selectively enable/disable the detailed diagnosis capability will be available
only if the following conditions are fulfilled:
The eG manager license should allow the detailed diagnosis capability
Both the normal and abnormal frequencies configured for the detailed diagnosis
measures should not be 0.
Outputs of the
test
Measurements
made by the
test
One set of results for every cluster that has been created
Measurement
Total disk count:
Measurement
Unit
Number
The detailed diagnosis of this measure, if
enabled, lists the disks in the cluster
storage, and the current state, path, and
usage of each cluster disk. This way, disks
that are running out of space can be
isolated, so that efforts to increase the
capacity of such disks can be initiated.
Number
If the number of Unused cluster disks is
more than the number of Used disks in
cluster, it could indicate over-utilization of a
few disks. In such a situation, compare the
value of the Percentage of space free in
used cluster disks measure with that of the
Indicates the total number of
disks in the cluster storage.
Unused cluster disks:
Interpretation
Indicates the number of cluster
disks that are not currently
used by any cluster resource
(i.e., service/application).
197
MONITORING WINDOWS SERVERS
Used disks in cluster:
Number
Indicates the number of cluster
disks that are currently used by
a cluster resource.
Percentage of space free in unused cluster
disks measure. If this comparison reveals
that the used disks have very little free
space as opposed to unused disks, it is a
clear indicator that the storage resources
have not been properly managed. You may
want to consider reducing the load on some
of the used disks by assigning the unused
disks to services/applications that generate
more data and hence consume more space.
To know which disks in the cluster storage
are currently not used, use the detailed
diagnosis of the Unused cluster disks
measure.
To know which disks in the cluster storage
are in use currently, take the help of the
detailed diagnosis of the Used disks in
cluster measure.
Total capacity
cluster disks:
of
used
MB
Indicates the total capacity of
all the used disks in the cluster.
Capacity of unused cluster
disks:
MB
Indicates the total capacity of
all unused disks in cluster.
Total free space in used
cluster disks:
MB
Indicates the total amount of
space in the used cluster disks
that is currently available for
use.
Free space in unused cluster
disks:
MB
Indicates the total amount of
space in the unused cluster
disks that is currently available
for use.
Percentage of space free in
used
cluster
disks:
Indicates the percentage of
space that is free in used
cluster disks.
Percent
198
For optimal cluster performance, the value
of both these measures should be high. If
both are low, then it indicates that the
cluster is critically low on space; if the
situation persists, or worse, aggravates, the
MONITORING WINDOWS SERVERS
Percentage of space free in
unused cluster disks:
Percent
Indicates the percentage of
space that is free in unused
cluster disks.
resources clustered will fail! To prevent this,
you can clear space on both the used and
unused disks. If many disks are unused, you
can
even
map
data-intensive
services/applications with these disks, so
that the load on used disks is reduced. You
may also want to consider adding more
physical disk resources to the cluster to
increase its total storage capacity.
he detailed diagnosis of the Total disks count measure, if enabled, lists the disks in the cluster storage, and the
current state, path, and usage of each cluster disk. This way, disks that are running out of space can be isolated, so
that efforts to increase the capacity of such disks can be initiated.
Figure 3.17: The detailed diagnosis of the Total disk count measure
To know which disks in the cluster storage are in use currently, take the help of the detailed diagnosis of the Used
disks in cluster measure.
Figure 3.18: The detailed diagnosis of the Used disks in cluster measure
3.4.6
Cluster Shared Volumes Test
A Cluster Shared Volume is a shared disk containing an NTFS or ReFS (Windows Server 2012 R2 only) volume that is
made accessible for read and write operations by all nodes within a Windows Server Failover Cluster.
199
MONITORING WINDOWS SERVERS
Virtual machines or applications that run on CSV are no longer bound to storage, and they can share a common disk
to reduce the number of LUNs, as shown in the following figure.
Figure 3.19: How the Cluster Shared Volume works?
Live migration of virtual machines becomes faster because volume ownership does not need to change.
This is why, if a CSV fails, the availability and operations of the VMs using that CSV will be adversely impacted.
Likewise, if a CSV has limited or no free space, the dependent VMs will begin to malfunction. This is why,
administrators should use the Cluster Shared Volumes test. This test auto-discovers the CSVs that have been
configured in each cluster, and continuously tracks the state and space usage of each CSV. This way, failed CSVs and
the ones that have run out of space can be accurately isolated.
Purpose
Auto-discovers the CSVs have been configured in each cluster, and continuously tracks the state
and space usage of each CSV. This way, failed CSVs and the ones that have run out of space
can be accurately isolated
Target of the
test
A node in a Windows cluster
Agent
deploying the
test
An internal agent
200
MONITORING WINDOWS SERVERS
Configurable
parameters for
the test
1.
TEST PERIOD – How often should the test be executed
2.
HOST - The host for which the test is to be configured.
3.
PORT – The port at which the specified HOST listens. By default, this is Null.
4.
WORK IN PASSIVE MODE – If this flag is set to No, then this test will report metrics only
if the target cluster node is the active node in the cluster. If it is the passive node, then
this test will not report any metrics. You can set this flag to Yes, if you want the test to
report metrics regardless of whether the monitored node is the active or passive node of
the cluster.
5.
DETAILED DIAGNOSIS - To make diagnosis more efficient and accurate, the eG
Enterprise suite embeds an optional detailed diagnostic capability. With this capability, the
eG agents can be configured to run detailed, more elaborate tests as and when specific
problems are detected. To enable the detailed diagnosis capability of this test for a
particular server, choose the On option. To disable the capability, click on the Off option.
The option to selectively enable/disable the detailed diagnosis capability will be available
only if the following conditions are fulfilled:
The eG manager license should allow the detailed diagnosis capability
Both the normal and abnormal frequencies configured for the detailed diagnosis
measures should not be 0.
Outputs of the
test
One set of results for each CSV on every cluster that is managed by the Windows Failover
Cluster Manager
Measurements
made by the
test
Measurement
Measurement
Unit
Status:
Interpretation
The values that this measure can report and
their corresponding numeric values have
been listed in the table below:
Indicates the current status of
this CSV.
Measure Value
Numeric Value
Online
0
Offline
1
Failed
2
Note:
By default, this measure reports one of the
Measure Values listed in the table above.
The graph of this measure however will
represent CSV states using the numeric
equivalents only.
Use the detailed diagnosis of this measure
to know which node currently owns the CSV
and the path to the CSV.
201
MONITORING WINDOWS SERVERS
Total capacity
volume:
of
shared
MB
Indicates the total capacity of
this CSV.
Space
used
volume:
in
shared
MB
Ideally, the value of this measure should be
low.
MB
Ideally, the value of this measure should be
high.
Percent
Compare the value of this measure across
CSVs to know which CSV is being utilized
excessively. A value close to 100% is a
cause for concern as it indicates that that
CSV is about to run out of space soon. You
should then allocate more space to that CSV
or clear space in the CSV by removing
unnecessary or obsolete data from it.
Indicates the amount of space
used in this CSV .
Free
space
volume:
in
shared
Indicates the amount of space
that is free in this CSV.
Percentage of space used in
shared volume:
Indicates the percentage of
total space in this CSV that is
currently in use.
Percentage of space free in
unused cluster disks:
Percent
Indicates the percentage of
space that is free in unused
cluster disks.
3.4.7
Cluster Status Test
Whenever a user complains of the inaccessibility of a resource (i.e., a server/service/application), the administrator
should first check whether that resource is part of a cluster, and if so, check whether the Windows cluster service has
been enabled and is running on each node of the cluster. This is where the Cluster Status test helps. This test
reports whether a monitored node is part of a cluster or not and if so, indicates whether/not the cluster service is
enabled and running on that node. This way, administrators can be promptly alerted to the sudden termination or
the absence of the cluster service on a cluster node. In addition, the test also reports the composition of the cluster –
i.e., the number of nodes and services/applications that have been clustered as part of the monitored cluster setup.
Purpose
Reports whether a monitored node is part of a cluster or not and if so, indicates whether/not the
cluster service is enabled and running on that node. This way, administrators can be promptly
alerted to the sudden termination or the absence of the cluster service on a cluster node. In
addition, the test also reports the composition of the cluster – i.e., the number of nodes and
services/applications that have been clustered as part of the monitored cluster setup
Target of the
test
A node in a Windows cluster
Agent
deploying the
An internal agent
202
MONITORING WINDOWS SERVERS
test
Configurable
parameters for
the test
1.
TEST PERIOD – How often should the test be executed
2.
HOST - The host for which the test is to be configured.
3.
PORT – The port at which the specified HOST listens. By default, this is Null.
4.
WORK IN PASSIVE MODE – If this flag is set to No, then this test will report metrics only
if the target cluster node is the active node in the cluster. If it is the passive node, then
this test will not report any metrics. You can set this flag to Yes, if you want the test to
report metrics regardless of whether the monitored node is the active or passive node of
the cluster.
5.
DETAILED DIAGNOSIS - To make diagnosis more efficient and accurate, the eG
Enterprise suite embeds an optional detailed diagnostic capability. With this capability, the
eG agents can be configured to run detailed, more elaborate tests as and when specific
problems are detected. To enable the detailed diagnosis capability of this test for a
particular server, choose the On option. To disable the capability, click on the Off option.
The option to selectively enable/disable the detailed diagnosis capability will be available
only if the following conditions are fulfilled:
The eG manager license should allow the detailed diagnosis capability
Both the normal and abnormal frequencies configured for the detailed diagnosis
measures should not be 0.
Outputs of the
test
Measurements
made by the
test
One set of results for every cluster being monitored
Measurement
Measurement
Unit
Does the cluster exist?:
Interpretation
The values that this measure can report and
their corresponding numeric values have
been listed in the table below:
Indicates whether/not the
cluster service is installed on
the monitored node.
Measure Value
Numeric Value
Yes
100
No
0
Note:
By default, this measure reports one of the
Measure Values listed in the table above.
The graph of this measure however will
indicate whether/not the monitored server is
cluster-enabled or not.
203
MONITORING WINDOWS SERVERS
Cluster status:
The values that this measure can report and
their corresponding numeric values have
been listed in the table below:
Indicates the current status of
the cluster service on the target
node.
Measure Value
Numeric Value
Running
100
Stopped
0
Note:
By default, this measure reports one of the
Measure Values listed in the table above.
The graph of this measure however will
indicate whether/not the cluster service is
running using the numeric equivalents only.
Is this the active node?:
The values that this measure can report and
their corresponding numeric values have
been listed in the table below:
Indicates
whether/not
the
monitored node is the active
node in this cluster.
Measure Value
Numeric Value
True
100
False
0
Note:
By default, this measure reports one of the
Measure Values listed in the table above.
The graph of this measure however will
report the status of the cluster service using
the numeric equivalents only.
Number
services/applications:
of
Number
To know which services/applications are
currently clustered, use the detailed
diagnosis of this measure.
Number
To know which nodes are the members of
the cluster, use the detailed diagnosis of this
measure.
Indicates
the
number
of
services/applications that are
currently clustered under this
cluster.
Number of nodes:
Indicates the number of nodes
in this cluster.
Use the detailed diagnosis of the Number of services/applications measure to know which services/applications have
been configured for high availability under a cluster, and which cluster node owns each service/application.
204
MONITORING WINDOWS SERVERS
Figure 3.20: The detailed diagnosis of the Number of services/applications measure
Use the detailed diagnosis of the Number of nodes measure to know which nodes are members of a cluster.
Figure 3.21: The detailed diagnosis of the Number of nodes measure
3.5 The Application Processes Layer
To monitor the resource usage of critical processes on a Windows host, the Application Processes layer of the
Windows server executes the Processes test.
Figure 3. 22: The tests mapped to the Application Processes layer of a Windows Generic server
In addition to the Processes test, the Application Processes layer of a Windows server is associated with a Windows
Processes test, which has been discussed in the following section.
3.5.1
Windows Processes Test
The Windows Processes test reports additional statistics pertaining to processes running on Microsoft Windows
systems.
Purpose
Reports additional statistics pertaining to processes running on Microsoft Windows systems.
Target of the
test
A Windows host
Agent
deploying the
test
An internal agent
205
MONITORING WINDOWS SERVERS
Configurable
parameters
for the test
1.
TEST PERIOD - How often should the test be executed
2.
HOST - The host for which the test is to be configured
3.
PORT - The port to which the specified HOST listens
4.
PROCESS - In the PROCESS text box, enter a comma separated list of names:pattern
pairs which identify the process(es) associated with the server being considered.
processName is a string that will be used for display purposes only. processPattern is an
expression of the form - *expr* or expr or *expr or expr* or *expr1*expr2*... or
expr1*expr2, etc. A leading '*' signifies any number of leading characters, while a trailing '*'
signifies any number of trailing characters. For example, to monitor the Word and
Powerpoint applications on a system, in the PROCESS text box, enter
officeProcess:*winword*,*power* , where * denotes zero or more characters.
To save the time and effort involved in such manual process specification, eG Enterprise
offers an easy-to-use auto-configure option in the form of a View/Configure button that is
available next to the PROCESS text box. Refer to Section 2.1.5.1.1 of this document o
know how to use the auto-configure option.
5.
WIDE - On Windows environments, by default, the eG agent uses perfmon to search for the
processes that match the configured patterns. Accordingly, the WIDE parameter is set to
false by default. Typically, a process definition in Windows includes the full path to the
process, the process name, and process arguments (if any). Perfmon however scans the
system only for process names that match the configured patterns – in other words, the
process path and arguments are ignored by perfmon. This implies that if multiple processes
on a Windows host have the same name as specified against PROCESS, then perfmon will
only be able to report the overall resource usage across all these processes; it will not
provide any pointers to the exact process that is eroding the host’s resources. To
understand this better, consider the following example. Typically, Windows represents any
Java application executing on it as java.exe. Say, two Java applications are executing on a
Windows host, but from different locations.
If java.exe has been configured for monitoring, then by default, perfmon will report the
availability and average resource usage of both the Java applications executing on the host.
If say, one Java application goes down, then perfmon will not be able to indicate accurately
which of the two Java applications is currently inaccessible.
Therefore, to enable administrators to easily differentiate between processes with the same
name, and to accurately determine which process is unavailable or resource-hungry, the eG
agent should be configured to perform its process searches based on the process path
and/or process arguments, and not just on the process name – in other words, the eG
agent should be configured not to use perfmon.
206
MONITORING WINDOWS SERVERS
To achieve this, first, set the WIDE parameter to Yes. This will instruct the eG agent to not
use perfmon to search for the configured process patterns. Once this is done, then, you can
proceed to configure a PROCESSPATTERN that includes the process arguments and/or
the process path, in addition to the process name. For instance, if both the Remote Access
Connection Manager service and the Terminal Services service on a Windows host, which
share the same name – svchost - are to be monitored as two different processes, then your
PROCESSPATTERN specification should be as follows:
Terminal:C:\WINDOWS\System32\svchost -k
DcomLaunch,Remote:C:\WINDOWS\system32\svchost.exe -k netsvcs
You can also use wildcard characters, wherever required. For instance, in the above case,
your PROCESSPATTERN can also be:
Terminal:*svchost -k DcomLaunch,Remote:*svchost.exe -k netsvcs
Similarly, to distinctly monitor two processes having the same name, but operating from
different locations, your specification can be:
JavaC:c:\javaapp\java.exe,JavaD:d:\app\java.exe
Note:
Before including process paths and/or arguments in your PROCESSPATTERN
configuration, make sure that the WIDE parameter is set to true. If not, the test will
not work.
If your PROCESSPATTERN configuration includes a process path that refers to the
Program Files directory, then make sure that you do not include a ~ (tilde) while
specifying this directory name. For instance, your PROCESSPATTERN specification
should not be say, Adobe:C:\Progra~1\Adobe\AcroRd32.exe.
Outputs of the
test
Measurement
s made by the
test
One set of results per process pattern specified
Measurement
Number of processes
running:
Measurement
Unit
Interpretation
Number
Indicates the number of
processes that are currently
running.
Handle count:
Number
Indicates the number of
handles opened by the process.
207
An increasing trend in this measure is
indicative of a memory leak in the process.
MONITORING WINDOWS SERVERS
Number of threads:
Number
Indicates the number of threads
that are used by the process.
Virtual memory used:
MB
Indicates the amount of virtual
memory that is being used by
the process.
I/O data rate:
Kbytes/Sec
Indicates the rate at which
processes are reading and
writing bytes in I/O operations.
I/O data operations:
Indicates the rate at which the
process is issuing read and
write data to file, network and
device I/O operations.
I/O read data rate:
This value counts all I/O activity generated
by each process and includes file, network
and device I/Os.
Operations/Se
c
Kbytes/Sec
Indicates the rate at which the
process is reading data from
file, network and device I/O
operations.
I/O write data rate:
Kbytes/Sec
Indicates the rate at which the
process is writing data to file,
network
and
device
I/O
operations.
Page fault rate:
Faults/Sec
Indicates the total rate at which
page faults are occurring for the
threads
of
all
matching
processes.
208
A page fault occurs when a thread refers to a
virtual memory page that is not in its working
set in main memory. This may not cause the
page to be fetched from disk if it is on the
standby list and hence already in main
memory, or if it is in use by another process
with
whom the page is shared.
MONITORING WINDOWS SERVERS
Memory working set:
MB
Indicates the current size of the
working set of a process.
The Working Set is the set of memory pages
touched recently by the threads in the
process. If free memory in the computer is
above a threshold, pages are left in the
Working Set of a process even if they are not
in
use.
When free memory falls below a threshold,
pages are trimmed from Working Sets. If
they are needed they will then be soft-faulted
back into the Working Set before leaving
main memory. If a process pattern matches
multiple processes, the memory working set
reported is the sum of the working sets for
the processes that match the specified
pattern. Detailed diagnosis for this test
provides details of the individual processes
and their individual working sets.
Comparing the working set across processes
indicates which process(es) are taking up
excessive
memory.
By tracking the working set of a process over
time, you can determine if the application has
a
memory
leak or not.
Note:
The Application Processes layer is also mapped to a Tcp Port Status test, which is disabled by default for the
Windows Generic sever, just as in the case of the Generic server.
3.6 The Windows Service Layer
This layer, which is available only for Windows-based applications, represents the different services of the
corresponding Windows components in the environment. An eG agent uses WindowsServices test to track the health
of this layer. In addition, the layer also periodically monitors the application, security, and system-related events that
occur on the target Windows host.
209
MONITORING WINDOWS SERVERS
Figure 3. 23: The tests mapped to the Windows Service layer of a Windows Generic server
3.6.1
Windows Services Test
Many server applications in Windows environments run as background services. The WindowsServices test checks
the availability of the service that corresponds to an application.
Purpose
To check the availability of a service running on the Windows platform.
Target of the
test
An IIS web server
Agent
deploying the
test
An internal agent
210
MONITORING WINDOWS SERVERS
Configurable
parameters for
the test
1.
TEST PERIOD - How often should the test be executed
2.
HOST - The host for which the test is to be configured
3.
PORT - the port to which the specified HOST listens
4.
SERVICENAME - Name of the service that is to be checked. More than one service name
can also be provided with comma as the separator.
Note:
When configuring the SERVICENAME, make sure that you specify the Display
Name of the service, and not the service Name you see in the Services window
on your Windows host.
When monitoring an MS SQL server, the SERVICE parameter will be set to
MSSQLServer by default. However, if the MS SQL server being monitored was
installed using a named instance, the SQL service name will change. In such a
case therefore, ensure that the SERVICE parameter is reconfigured to reflect the
correct service name.
To save the time and effort involved in manual service specification, eG Enterprise
offers an easy-to-use auto-configure option in the form of a View/Configure button that
is available next to the SERVICENAME text box. Refer to Section 3.6.1.1 for details on
how to use this option.
5.
CORRECT - Increased uptime and lower mean time to repair are critical to ensuring that
IT infrastructures deliver a high quality of service to users. Towards this end, the eG
Enterprise suite embeds an optional auto-correction capability that enables eG agents to
automatically correct problems in the environment, as soon as they occur. With this
capability, as and when an abnormal situation is detected, an eG agent can initiate
corrective actions automatically to resolve the problem. Automatic correction without the
need for manual intervention by IT operations staff reduces service downtime and
improves operational efficiency. By default, the auto-correction capability is available in the
eG Enterprise suite for the Num_procs_running measure of ProcessTest, and the
Availability measure of WinServiceTest. The eG Enterprise suite includes a default autocorrection script for WinServiceTest, which executes when the service that the eG agent
has been configured to monitor, stops. To enable the auto-correction capability of the
WinServiceTest, first, select the TRUE option against the CORRECT parameter in this
page (by default, FALSE will be selected here).
6.
ALARMTYPE - Upon selecting the TRUE option, two new parameters, namely,
ALARMTYPE, USERPARAMS, and CORRECTIVESCRIPT will appear. The
ALARMTYPE parameter indicates when the auto-corrective script should execute. You
can set the corrective script to execute when a specific type of alarm is generated, by
selecting an option from the ALARMTYPE list box. For example, if the Critical option is
chosen from the ALARMTYPE list box, then the corrective script will run only when a
critical alarm for the WinServiceTest is generated. Similarly, if the Critical/Major option is
chosen, then the corrective script will execute only when the eG Enterprise system
generates critical or major alarms for the WinServiceTest. In order to ensure that the
corrective script executes regardless of the alarm type, select the Critical/Major/Minor
option.
7.
USERPARAMS - The default script for WinServiceTest takes no parameters. Therefore,
specify none against USERPARAMS.
211
MONITORING WINDOWS SERVERS
Outputs of the
test
Measurements
made by the
test
8.
CORRECTIVESCRIPT - The CORRECTIVESCRIPT text box can also contain none, so
that the default script is automatically associated with the test. Administrators can build
new auto-correction capabilities to address probable issues with other tests, by writing
their own corrective scripts. To know how to create custom auto-correction scripts, refer to
the eG User Manual.
9.
ISPASSIVE – If the value chosen is YES, then the server under consideration is a passive
server in a cluster. No alerts will be generated if the server is not running. Measures will be
reported as “Not applicable’ by the agent if the server is not up.
One set of results for every Service name that has been configured.
Measurement
Service availability:
Measurement
Unit
Percent
Indicates the availability of the
service.
Service state :
Interpretation
A value of 100 indicates that the specified
service has been configured and is
currently executing. A value of 0 for this
measure indicates that the specified
service has been configured on the server
but is not running at this time. A value of
–1 indicates that the service has not been
configured on the target system.
The values that this measure can report
and their corresponding numeric values
are discussed in the table below:
Indicates the current state of
this service.
Measure Value
Numeric Value
Running
1
StartPending
2
Stopped
3
StopPending
4
Paused
5
PausePending
6
Note:
By default, this measure reports the
Measure Values listed in the table above
to indicate service state. However, in the
graph of this measure, service state is
represented using the corresponding
numeric equivalents only.
212
MONITORING WINDOWS SERVERS
3.6.1.1
Auto-configuring the Windows Services to be Monitored
To save the time and effort involved in manual service specification, eG Enterprise offers an easy-to-use autoconfigure option in the form of a View/Configure button that is available next to the SERVICE NAME text box.
To auto-configure the services to be monitored, do the following:
1.
Click on the View/Configure button next to the SERVICENAME text area in the WindowsServices test
configuration page (see Figure 3.24).
Figure 3.24: Configuring the WindowsServices test
213
MONITORING WINDOWS SERVERS
Note:
The View/Configure button will appear only if the following conditions are fulfilled:
The WindowsServices test must be executed in an agent-based manner.
The eG agent executing the test should be of version 5.2 or above.
In case the eG manager in question is part of a redundant manager setup, then the agent
executing the test must be reporting metrics to the primary manager only.
2.
When the View/Configure button is clicked, a INDOWS SERVICES CONFIGURATION page will appear (see Figure
3.25).
.
Figure 3.25: Auto-configuring the services to be monitored
3.
Upon clicking the Get Services button in the WINDOWS SERVICES CONFIGURATION page, a pop up window with a
list of services that are running on the host will be displayed (see Figure 3.26).
Figure 3.26: List of auto-discovered services
214
MONITORING WINDOWS SERVERS
Note:
The services that that have already been configured for monitoring will not be listed in Figure 3.26.
4.
From the pop-up, select the services that require monitoring and click the SUBMIT button.
5.
Clicking the SUBMIT button in the pop-up will automatically populate the Windows service name text box
available in the WINDOWS SERVICES CONFIGURATION page, with the name of the chosen service (see Figure
3.27).
Figure 3.27: Multiple auto-discovered services configured for monitoring
6.
You can add more services in the WINDOWS SERVICES CONFIGURATION page by clicking on the encircled '+'
button present at the end of the first Windows service name specification. To remove a specification that preexists, just click on the encircled '-' button that corresponds to it. The contents of the Windows service name
text box can also be edited manually.
3.6.2
Application Event Log Test
This test reports the statistical information about the application events generated by the target system.
215
MONITORING WINDOWS SERVERS
Configurable
parameters for
the test
1.
TEST PERIOD - How often should the test be executed
2.
HOST - The host for which the test is to be configured
3.
PORT – Refers to the port used by the EventLog Service. Here it is null.
4.
LOGTYPE – Refers to the type of event logs to be monitored. The default value is
application.
5.
POLICY BASED FILTER - Using this page, administrators can configure the event
sources, event IDs, and event descriptions to be monitored by this test. In order to enable
administrators to easily and accurately provide this specification, this page provides the
following options:
Manually specify the event sources, IDs, and descriptions in the FILTER text
area, or,
Select a specification from the predefined filter policies listed in the FILTER box
For explicit, manual specification of the filter conditions, select the NO option against the
POLICY BASED FILTER field. This is the default selection. To choose from the list of preconfigured filter policies, or to create a new filter policy and then associate the same with
the test, select the YES option against the POLICY BASED FILTER field.
6.
FILTER - If the POLICY BASED FILTER flag is set to NO, then a FILTER text area will
appear, wherein you will have to specify the event sources, event IDs, and event
descriptions to be monitored. This specification should be of the following format:
{Displayname}:{event_sources_to_be_included}:{event_sources_to_be_excluded}:{event
_IDs_to_be_included}:{event_IDs_to_be_excluded}:{event_descriptions_to_be_included}:
{event_descriptions_to_be_excluded}. For example, assume that the FILTER text area
takes the value, OS_events:all:Browse,Print:all:none:all:none. Here:
OS_events is the display name that will appear as a descriptor of the test in the
monitor UI;
all indicates that all the event sources need to be considered while monitoring. To
monitor specific event sources, provide the source names as a comma-separated
list. To ensure that none of the event sources are monitored, specify none.
Next, to ensure that specific event sources are excluded from monitoring, provide
a comma-separated list of source names. Accordingly, in our example, Browse
and Print have been excluded from monitoring. Alternatively, you can use all to
indicate that all the event sources have to be excluded from monitoring, or none
to denote that none of the event sources need be excluded.
In the same manner, you can provide a comma-separated list of event IDs that
require monitoring. The all in our example represents that all the event IDs need
to be considered while monitoring.
216
MONITORING WINDOWS SERVERS
Similarly, the none (following all in our example) is indicative of the fact that
none of the event IDs need to be excluded from monitoring. On the other hand,
if you want to instruct the eG Enterprise system to ignore a few event IDs during
monitoring, then provide the IDs as a comma-separated list. Likewise, specifying
all makes sure that all the event IDs are excluded from monitoring.
The all which follows implies that all events, regardless of description, need to be
included for monitoring. To exclude all events, use none. On the other hand, if
you provide a comma-separated list of event descriptions, then the events with
the specified descriptions will alone be monitored. Event descriptions can be of
any of the following forms - desc*, or desc, or *desc*,or desc*, or desc1*desc2,
etc. desc here refers to any string that forms part of the description. A leading '*'
signifies any number of leading characters, while a trailing '*' signifies any
number of trailing characters.
In the same way, you can also provide a comma-separated list of event
descriptions to be excluded from monitoring. Here again, the specification can be
of any of the following forms: desc*, or desc, or *desc*,or desc*, or
desc1*desc2, etc. desc here refers to any string that forms part of the
description. A leading '*' signifies any number of leading characters, while a
trailing '*' signifies any number of trailing characters. In our example however,
none is specified, indicating that no event descriptions are to be excluded from
monitoring. If you use all instead, it would mean that all event descriptions are to
be excluded from monitoring.
By default, the FILTER parameter contains the value: all:all:none:all:none:all:none. Multiple
filters are to be separated by semi-colons (;).
Note:
The event sources and event IDs specified here should be exactly the same as that which
appears in the Event Viewer window.
On the other hand, if the POLICY BASED FILTER flag is set to YES, then a FILTER list
box will appear, displaying the filter policies that pre-exist in the eG Enterprise system. A
filter policy typically comprises of a specific set of event sources, event IDs, and event
descriptions to be monitored. This specification is built into the policy in the following
format:
{Policyname}:{event_sources_to_be_included}:{event_sources_to_be_excluded}:{event_ID
s_to_be_included}:{event_IDs_to_be_excluded}:{event_descriptions_to_be_included}:{eve
nt_descriptions_to_be_excluded}
To monitor a specific combination of event sources, event IDs, and event descriptions, you
can choose the corresponding filter policy from the FILTER list box. Multiple filter policies
can be so selected. Alternatively, you can modify any of the existing policies to suit your
needs, or create a new filter policy. To facilitate this, a Click here link appears just above
the test configuration section, once the YES option is chosen against POLICY BASED
FILTER. Clicking on the Click here link leads you to a page where you can modify the
existing policies or create a new one (refer to page 220). The changed policy or the new
policy can then be associated with the test by selecting the policy name from the FILTER
list box in this page.
217
MONITORING WINDOWS SERVERS
7.
USEWMI - The eG agent can either use WMI to extract event log statistics or directly
parse the event logs using event log APIs. If the USEWMI flag is YES, then WMI is used.
If not, the event log APIs are used. This option is provided because on some Windows
NT/2000 systems (especially ones with service pack 3 or lower), the use of WMI access to
event logs can cause the CPU usage of the WinMgmt process to shoot up. On such
systems, set the USEWMI parameter value to NO. On the other hand, when monitoring
systems that are operating on any other flavor of Windows (say, Windows
2003/XP/2008/7/Vista/12), the USEWMI flag should always be set to ‘Yes’.
8.
STATELESS ALERTS - Typically, the eG manager generates email alerts only when the
state of a specific measurement changes. A state change typically occurs only when the
threshold of a measure is violated a configured number of times within a specified time
window. While this ensured that the eG manager raised alarms only when the problem was
severe enough, in some cases, it may cause one/more problems to go unnoticed, just
because they did not result in a state change. For example, take the case of the EventLog
test. When this test captures an error event for the very first time, the eG manager will
send out a CRITICAL email alert with the details of the error event to configured recipients.
Now, the next time the test runs, if a different error event is captured, the eG manager will
keep the state of the measure as CRITICAL, but will not send out the details of this error
event to the user; thus, the second issue will remain hidden from the user. To make sure
that administrators do not miss/overlook critical issues, the eG Enterprise monitoring
solution provides the stateless alerting capability. To enable this capability for this test, set
the STATELESS ALERTS flag to Yes. This will ensure that email alerts are generated for
this test, regardless of whether or not the state of the measures reported by this test
changes.
9.
EVENTS DURING RESTART - By default, the EVENTS DURING RESTART flag is set to
Yes. This ensures that whenever the agent is stopped and later started, the events that
might have occurred during the period of non-availability of the agent are included in the
number of events reported by the agent. Setting the flag to No ensures that the agent,
when restarted, ignores the events that occurred during the time it was not available.
10. DDFORINFORMATION – eG Enterprise also provides you with options to restrict the
amount of storage required for event log tests. Towards this end, the
DDFORINFORMATION and DDFORWARNING flags have been made available in this
page. By default, both these flags are set to Yes, indicating that by default, the test
generates detailed diagnostic measures for information events and warning events. If you
do not want the test to generate and store detailed measures for information events, set
the DDFORINFORMATION flag to No.
11. DDFORWARNING – To ensure that the test does not generate and store detailed
measures for warning events, set the DDFORWARNING flag to No.
12. DD FREQUENCY - Refers to the frequency with which detailed diagnosis measures are to
be generated for this test. The default is 1:1. This indicates that, by default, detailed
measures will be generated every time this test runs, and also every time the test detects
a problem. You can modify this frequency, if you so desire. Also, if you intend to disable
the detailed diagnosis capability for this test, you can do so by specifying none against DD
FREQUENCY.
218
MONITORING WINDOWS SERVERS
13. DETAILED DIAGNOSIS - To make diagnosis more efficient and accurate, the eG
Enterprise suite embeds an optional detailed diagnostic capability. With this capability, the
eG agents can be configured to run detailed, more elaborate tests as and when specific
problems are detected. To enable the detailed diagnosis capability of this test for a
particular server, choose the On option. To disable the capability, click on the Off option.
The option to selectively enabled/disable the detailed diagnosis capability will be available
only if the following conditions are fulfilled:
The eG manager license should allow the detailed diagnosis capability
Both the normal and abnormal frequencies configured for the detailed diagnosis
measures should not be 0.
Outputs of the
test
Measurements
made by the
test
One set of results for the FILTER configured
Measurement
Application errors:
Measurement
Unit
Number
This refers to the number
of application error events
that were generated.
Interpretation
A very low value (zero) indicates that the
system is in a healthy state and all
applications are running smoothly without
any potential problems.
An increasing trend or high value indicates
the existence of problems like loss of
functionality or data in one or more
applications.
Please check the Application Logs in the
Event Log Viewer for more details.
Application information
count:
Number
This refers to the number
of application information
events generated when the
test was last executed.
Application warnings:
A change in the value of this measure may
indicate infrequent but successful operations
performed by one or more applications.
Please check the Application Logs in the
Event Log Viewer for more details.
Number
This refers to the number
of warnings that were
generated when the test
was last executed.
A high value of this measure indicates
application problems that may not have an
immediate impact, but may cause future
problems in one or more applications.
Please check the Application Logs in the
Event Log Viewer for more details.
219
MONITORING WINDOWS SERVERS
Application
errors:
critical
Number
Indicates the number of
critical events that were
generated when the test
was last executed.
A critical event is one that an application or a
component cannot automatically recover
from.
This measure is applicable only for Windows
2008/Windows Vista/Windows 7 systems.
A very low value (zero) indicates that the
system is in a healthy state and all
applications are running smoothly without
any potential problems.
An increasing trend or high value indicates
the existence of fatal/irrepairable problems in
one or more applications.
The detailed diagnosis of this measure
describes all the critical application events
that were generated during the last
measurement period.
Please check the Application Logs in the
Event Log Viewer for more details.
Application verbose:
Number
Indicates the number of
verbose events that were
generated when the test
was last executed.
Verbose logging provides more details in the
log entry, which will enable you to
troubleshoot issues better.
This measure is applicable only for Windows
2008/Windows Vista/Windows 7 systems.
The detailed diagnosis of this measure
describes all the verbose events that were
generated during the last measurement
period.
Please check the Application Logs in the
Event Log Viewer for more details.
The filter policy for the ApplicationEventLog test, ApplicationEvents test, SystemEvents test, and SystemEventLog
test typically comprises of a specific set of event sources, event IDs, and event descriptions to be monitored. This
specification is expressed by the eG Enterprise system in the following format:
{Policyname}:{event_sources_to_be_included}:{event_sources_to_be_excluded}:{event_IDs_to_be_included}:{even
t_IDs_to_be_excluded}:{event_descriptions_to_be_included}:{event_descriptions_to_be_excluded}
On the other hand, the filter policy for the SecurityLog test comprises of a specific set of event sources, event ids,
and users to be monitored. This specification is expressed by the eG Enterprise system in the following format:
{Policyname}:{event_sources_to_be_included}:{event_sources_to_be_excluded}:{event_IDs_to_be_included}:{even
t_IDs_to_be_excluded}:{users_to_be_included}:{users_to_be_excluded}
To add a new policy, do the following:
1.
Click on the Click here hyperlink available just above the test configuration of the ApplicationEventLog test,
ApplicationEvents test, SystemEvents test, SystemEventLog test, or SecurityLog test (see Figure 3. 28).
220
MONITORING WINDOWS SERVERS
Figure 3. 28: Configuring an ApplicationEvents test
2.
Figure 3. 29 will then appear listing the policies that pre-exist.
Figure 3. 29: List of policies
3.
To view the contents of a policy, click on the View button against the policy name. While a policy can be
modified by clicking on the Modify button, it can be deleted using the Delete button. The default policy is all,
which can only be viewed and not modified or deleted. The specification contained within this policy is:
all:none:all:none:all:none.
4.
To create a new policy, click on the Add New Policy button in Figure 3. 29. Doing so invokes Figure 3. 30, using
which a new policy can be created.
221
MONITORING WINDOWS SERVERS
Figure 3. 30: Adding a new filter policy
5.
In Figure 3. 30, first, provide a unique name against POLICY NAME.
6.
To include one/more event sources for monitoring, select Included from the EVENT SOURCES drop-down list,
and then specify a comma-separated list of event sources in the adjacent text box. If you require more space to
specify the event sources, click on the View button next to the text box. This will invoke an EVENT SOURCES
INCLUDED text area (see Figure 3. 31), wherein the specification can be provided more clearly and comfortably.
Figure 3. 31: Viewing the text area
7.
To exclude specific event sources from monitoring, select Excluded from the EVENT SOURCES drop-down list,
and then specify a comma-separated list of event sources to be excluded in the adjacent text box. If you
require more space to specify the event sources, click on the View button next to the text box. This will invoke
an EVENT SOURCES EXCLUDED text area, wherein the specification can be provided more clearly and
comfortably.
222
MONITORING WINDOWS SERVERS
Note:
At any given point in time, you can choose to either Include or Exclude event sources, but you cannot do
both. If you have chosen to include event sources, then the eG Enterprise system automatically assumes
that no event sources need be excluded. Accordingly, the {event_sources_to_be_excluded} section of the
filter format mentioned above, will assume the value none. Similarly, if you have chosen to exclude specific
event sources from monitoring, then the {event_sources_to_be_included} section of the format above will
automatically take the value all, indicating that all event sources except the ones explicitly excluded, will be
included for monitoring.
8.
In the same way, select Included from the EVENT IDS list and then, provide a comma-separated list of event IDs
to be monitored. For more space, click on the View button next to the text box, so that an EVENT IDS INCLUDED
text area appears.
9.
If you, on the other hand, want to exclude specific event IDs from monitoring, then first select Excluded from
the EVENT IDS list box, and then provide a comma-separated list of event IDs to be excluded. For more space,
click on the View button next to the text box, so that an EVENT IDS EXCLUDED text area appears.
Note:
At any given point in time, you can choose to either Include or Exclude event IDs, but you cannot do
both. If you have chosen to include event IDs, then the eG Enterprise system automatically assumes that
no event IDs need be excluded. Accordingly, the {event_IDs_to_be_excluded} section of the filter format
mentioned above, will assume the value none. Similarly, if you have chosen to exclude specific event IDs
from monitoring, then the {event_IDs_to_be_included} section of the format above will automatically
take the value all, indicating that all event IDs except the ones explicitly excluded, will be included for
monitoring.
10. Likewise, select Included from the EVENT DESCRIPTIONS list and then, provide a comma-separated list of event
descriptions to be monitored. For more space, click on the View button next to the text box, so that an EVENT
DESCRIPTIONS INCLUDED text area appears.
11. For excluding specific event descriptions from monitoring, first select Excluded from the EVENT DESCRIPTIONS
list box, and then provide a comma-separated list of event descriptions to be excluded. For more space, click on
the View button next to the text box, so that an EVENT DESCRIPTIONS EXCLUDED text area appears.
Note:
Instead of the complete event descriptions, wild card-embedded event description patterns can be
provided as a comma-separated list in the Included or Excluded text boxes. For instance, to include all
events that start with st and vi, your Included specification should be: st*,vi*. Similarly, to exclude all
events with descriptions ending with ed and le, your Excluded specification should be: *ed,*le.
223
MONITORING WINDOWS SERVERS
12. In case of the SecurityLog test however, you will not be required to include/exclude EVENT DESCRIPTIONS.
Instead, an EVENT USERS field will appear, using which you need to configure users who need to be
included/excluded from monitoring.
Note:
At any given point in time, you can choose to either Include or Exclude event descriptions/users, but you
cannot do both. If you have chosen to include event descriptions/users, then the eG Enterprise system
automatically assumes that no event descriptions/users need be excluded. Accordingly, the
{event_descriptions_to_be_excluded} section or the {users_to_be_excluded} section (as the case may be) of
the filter formats mentioned above, will assume the value none. Similarly, if you have chosen to exclude
specific event descriptions/users from monitoring, then the {event_descriptions_to_be_included} section or
the {users_to_be_included} section (as the case may be) of the formats above will automatically take the
value all. This indicates that all event descriptions/users except the ones explicitly excluded, will be included
for monitoring.
13. Finally, click the Update button.
14. The results of the configuration will then be displayed as depicted by Figure 3. 32.
Figure 3. 32: Results of the configuration
Note:
If you have configured a policy to Include a few/all events (sources/IDs/descriptions/users), and Exclude none,
then, while reconfiguring that policy, you will find that the Include option is chosen by default from the
corresponding drop-down list in Figure 3. 29. On the other hand, if you have configured a policy to to Exclude
a few specific events and Include all events, then, while modifying that policy, you will find the Exclude option
being the default selection in the corresponding drop-down list in Figure 3. 29.
224
MONITORING WINDOWS SERVERS
3.6.3
System Event Log Test
This test reports the statistical information about the system events generated by the target system.
Configurable
parameters for
the test
1.
TEST PERIOD - How often should the test be executed
2.
HOST - The host for which the test is to be configured
3.
PORT – Refers to the port used by the EventLog Service. Here it is null.
4.
LOGTYPE – Refers to the type of event logs to be monitored. The default value is
application.
5.
POLICY BASED FILTER - Using this page, administrators can configure the event
sources, event IDs, and event descriptions to be monitored by this test. In order to enable
administrators to easily and accurately provide this specification, this page provides the
following options:
Manually specify the event sources, IDs, and descriptions in the FILTER text
area, or,
Select a specification from the predefined filter policies listed in the FILTER box
For explicit, manual specification of the filter conditions, select the NO option against the
POLICY BASED FILTER field. This is the default selection. To choose from the list of preconfigured filter policies, or to create a new filter policy and then associate the same with
the test, select the YES option against the POLICY BASED FILTER field.
6.
FILTER - If the POLICY BASED FILTER flag is set to NO, then a FILTER text area will
appear, wherein you will have to specify the event sources, event IDs, and event
descriptions to be monitored. This specification should be of the following format:
{Displayname}:{event_sources_to_be_included}:{event_sources_to_be_excluded}:{event
_IDs_to_be_included}:{event_IDs_to_be_excluded}:{event_descriptions_to_be_included}:
{event_descriptions_to_be_excluded}. For example, assume that the FILTER text area
takes the value, OS_events:all:Browse,Print:all:none:all:none. Here:
OS_events is the display name that will appear as a descriptor of the test in the
monitor UI;
all indicates that all the event sources need to be considered while monitoring. To
monitor specific event sources, provide the source names as a comma-separated
list. To ensure that none of the event sources are monitored, specify none.
Next, to ensure that specific event sources are excluded from monitoring, provide
a comma-separated list of source names. Accordingly, in our example, Browse
and Print have been excluded from monitoring. Alternatively, you can use all to
indicate that all the event sources have to be excluded from monitoring, or none
to denote that none of the event sources need be excluded.
In the same manner, you can provide a comma-separated list of event IDs that
require monitoring. The all in our example represents that all the event IDs need
to be considered while monitoring.
225
MONITORING WINDOWS SERVERS
Similarly, the none (following all in our example) is indicative of the fact that
none of the event IDs need to be excluded from monitoring. On the other hand,
if you want to instruct the eG Enterprise system to ignore a few event IDs during
monitoring, then provide the IDs as a comma-separated list. Likewise, specifying
all makes sure that all the event IDs are excluded from monitoring.
The all which follows implies that all events, regardless of description, need to be
included for monitoring. To exclude all events, use none. On the other hand, if
you provide a comma-separated list of event descriptions, then the events with
the specified descriptions will alone be monitored. Event descriptions can be of
any of the following forms - desc*, or desc, or *desc*,or desc*, or desc1*desc2,
etc. desc here refers to any string that forms part of the description. A leading '*'
signifies any number of leading characters, while a trailing '*' signifies any
number of trailing characters.
In the same way, you can also provide a comma-separated list of event
descriptions to be excluded from monitoring. Here again, the specification can be
of any of the following forms: desc*, or desc, or *desc*,or desc*, or
desc1*desc2, etc. desc here refers to any string that forms part of the
description. A leading '*' signifies any number of leading characters, while a
trailing '*' signifies any number of trailing characters. In our example however,
none is specified, indicating that no event descriptions are to be excluded from
monitoring. If you use all instead, it would mean that all event descriptions are to
be excluded from monitoring.
By default, the FILTER parameter contains the value: all:all:none:all:none:all:none.
Multiple filters are to be separated by semi-colons (;).
Note:
The event sources and event IDs specified here should be exactly the same as that which
appears in the Event Viewer window.
On the other hand, if the POLICY BASED FILTER flag is set to YES, then a FILTER list
box will appear, displaying the filter policies that pre-exist in the eG Enterprise system. A
filter policy typically comprises of a specific set of event sources, event IDs, and event
descriptions to be monitored. This specification is built into the policy in the following
format:
{Policyname}:{event_sources_to_be_included}:{event_sources_to_be_excluded}:{event_ID
s_to_be_included}:{event_IDs_to_be_excluded}:{event_descriptions_to_be_included}:{eve
nt_descriptions_to_be_excluded}
To monitor a specific combination of event sources, event IDs, and event descriptions, you
can choose the corresponding filter policy from the FILTER list box. Multiple filter policies
can be so selected. Alternatively, you can modify any of the existing policies to suit your
needs, or create a new filter policy. To facilitate this, a Click here link appears just above
the test configuration section, once the YES option is chosen against POLICY BASED
FILTER. Clicking on the Click here link leads you to a page where you can modify the
existing policies or create a new one (refer to page 220). The changed policy or the new
policy can then be associated with the test by selecting the policy name from the FILTER
list box in this page.
226
MONITORING WINDOWS SERVERS
7.
USEWMI - The eG agent can either use WMI to extract event log statistics or directly
parse the event logs using event log APIs. If the USEWMI flag is YES, then WMI is used.
If not, the event log APIs are used. This option is provided because on some Windows
NT/2000 systems (especially ones with service pack 3 or lower), the use of WMI access to
event logs can cause the CPU usage of the WinMgmt process to shoot up. On such
systems, set the USEWMI parameter value to NO. On the other hand, when monitoring
systems that are operating on any other flavor of Windows (say, Windows
2003/XP/2008/7/Vista/12), the USEWMI flag should always be set to ‘Yes’.
8.
STATELESS ALERTS - Typically, the eG manager generates email alerts only when the
state of a specific measurement changes. A state change typically occurs only when the
threshold of a measure is violated a configured number of times within a specified time
window. While this ensured that the eG manager raised alarms only when the problem was
severe enough, in some cases, it may cause one/more problems to go unnoticed, just
because they did not result in a state change. For example, take the case of the EventLog
test. When this test captures an error event for the very first time, the eG manager will
send out a CRITICAL email alert with the details of the error event to configured recipients.
Now, the next time the test runs, if a different error event is captured, the eG manager will
keep the state of the measure as CRITICAL, but will not send out the details of this error
event to the user; thus, the second issue will remain hidden from the user. To make sure
that administrators do not miss/overlook critical issues, the eG Enterprise monitoring
solution provides the stateless alerting capability. To enable this capability for this test, set
the STATELESS ALERTS flag to Yes. This will ensure that email alerts are generated for
this test, regardless of whether or not the state of the measures reported by this test
changes.
9.
EVENTS DURING RESTART - By default, the EVENTS DURING RESTART flag is set to
Yes. This ensures that whenever the agent is stopped and later started, the events that
might have occurred during the period of non-availability of the agent are included in the
number of events reported by the agent. Setting the flag to No ensures that the agent,
when restarted, ignores the events that occurred during the time it was not available.
10. DDFORINFORMATION – eG Enterprise also provides you with options to restrict the
amount of storage required for event log tests. Towards this end, the
DDFORINFORMATION and DDFORWARNING flags have been made available in this
page. By default, both these flags are set to Yes, indicating that by default, the test
generates detailed diagnostic measures for information events and warning events. If you
do not want the test to generate and store detailed measures for information events, set
the DDFORINFORMATION flag to No.
11. DDFORWARNING – To ensure that the test does not generate and store detailed
measures for warning events, set the DDFORWARNING flag to No.
12. DD FREQUENCY - Refers to the frequency with which detailed diagnosis measures are to
be generated for this test. The default is 1:1. This indicates that, by default, detailed
measures will be generated every time this test runs, and also every time the test detects
a problem. You can modify this frequency, if you so desire. Also, if you intend to disable
the detailed diagnosis capability for this test, you can do so by specifying none against DD
FREQUENCY.
227
MONITORING WINDOWS SERVERS
13. DETAILED DIAGNOSIS - To make diagnosis more efficient and accurate, the eG
Enterprise suite embeds an optional detailed diagnostic capability. With this capability, the
eG agents can be configured to run detailed, more elaborate tests as and when specific
problems are detected. To enable the detailed diagnosis capability of this test for a
particular server, choose the On option. To disable the capability, click on the Off option.
The option to selectively enable/disable the detailed diagnosis capability will be available
only if the following conditions are fulfilled:
The eG manager license should allow the detailed diagnosis capability
Both the normal and abnormal frequencies configured for the detailed diagnosis
measures should not be 0.
Outputs of the
test
Measurements
made by the
test
One set of results for the FILTER configured
Measurement
System errors:
Measurement
Unit
Number
This refers to the number
of system error events
generated during the last
execution of the test.
Interpretation
A very low value (zero) indicates that the
system is in healthy state and all Windows
services and low level drivers are running
without any potential problems.
An increasing trend or a high value indicates
the existence of problems such as loss of
functionality or data in one or more Windows
services and low level drivers.
Please check the System Logs in the Event
Log Viewer for more details.
System
messages:
information
Number
This refers to the number
of
service-related
and
driver-related information
events that were generated
during the test's last
execution.
System warnings:
A change in value of this measure may
indicate infrequent but successful operations
performed by one or more applications.
Please check the System Logs in the Event
Log Viewer for more details.
Number
This refers to the number
of
service-related
and
driver-related
warnings
generated in the during the
test's last execution.
A high value of this measure indicates
problems that may not have an immediate
impact, but may cause future problems in
one or more Windows servers and low level
drivers.
Please check the System Logs in the Event
Log Viewer for more details.
228
MONITORING WINDOWS SERVERS
System critical errors:
Number
Indicates the number of
critical events that were
generated when the test
was last executed.
A critical event is one that a system cannot
automatically recover from.
This measure is applicable only for Windows
2008/Windows Vista/Windows 7 systems.
A very low value (zero) indicates that the
system is in a healthy state and is running
smoothly without any potential problems.
An increasing trend or high value indicates
the existence of fatal/irrepairable problems in
the system.
The detailed diagnosis of this measure
describes all the critical system events that
were generated during the last measurement
period.
Please check the System Logs in the Event
Log Viewer for more details.
System verbose:
Number
Indicates the number of
verbose events that were
generated when the test
was last executed.
Verbose logging provides more details in the
log entry, which will enable you to
troubleshoot issues better.
This measure is applicable only for Windows
2008/Windows Vista/Windows 7 systems.
The detailed diagnosis of this measure
describes all the verbose events that were
generated during the last measurement
period.
Please check the System Logs in the Event
Log Viewer for more details.
3.6.4
Security Log Test
The SecurityLog test reports statistics relating to the Windows security log audits.
Purpose
Reports statistics relating the Windows security log audits
Target of the
test
Any Windows host system
Agent
deploying the
test
An internal agent
229
MONITORING WINDOWS SERVERS
Configurable
parameters for
the test
1.
TEST PERIOD - How often should the test be executed
2.
HOST - The host for which the test is to be configured
3.
PORT – Refers to the port used by the EventLog Service. Here it is null.
4.
SUCCESSEVENTSINDD - By default, this parameter displays none, indicating that by
default none of the successful log audits will be reflected in the detailed diagnosis. If you
set this parameter to, say 10, then the test will display only the 10 most recent successful
log audits in the detailed diagnosis page. Setting this parameter to all, on the other hand
will make sure that all successful log audits are listed in the detailed diagnosis.
5.
FAILUREEVENTSINDD - By default, this parameter displays all, indicating that by default
all the failed log audits will be reflected in the detailed diagnosis. If you set this parameter
to, say 10, then the test will display only the 10 most recent log audits that failed, in the
detailed diagnosis page. Setting this parameter to none, on the other hand will make sure
that none of the failed log audits are listed in the detailed diagnosis.
6.
DD FREQUENCY - Refers to the frequency with which detailed diagnosis measures are to
be generated for this test. The default is 1:1. This indicates that, by default, detailed
measures will be generated every time this test runs, and also every time the test detects a
problem. You can modify this frequency, if you so desire. Also, if you intend to disable the
detailed diagnosis capability for this test, you can do so by specifying none against DD
FREQUENCY.
7.
USEWMI - The eG agent can either use WMI to extract event log statistics or directly parse
the event logs using event log APIs. If the USEWMI flag is YES, then WMI is used. If not,
the event log APIs are used. This option is provided because on some Windows NT/2000
systems (especially ones with service pack 3 or lower), the use of WMI access to event logs
can cause the CPU usage of the WinMgmt process to shoot up. On such systems, set the
USEWMI parameter value to NO. On the other hand, when monitoring systems that are
operating on any other flavor of Windows (say, Windows 2003/XP/2008/7/Vista/12), the
USEWMI flag should always be set to ‘Yes’.
8.
EVENTS DURING RESTART - By default, the EVENTS DURING RESTART flag is set to
Yes. This ensures that whenever the agent is stopped and later started, the events that
might have occurred during the period of non-availability of the agent are included in the
number of events reported by the agent. Setting the flag to No ensures that the agent,
when restarted, ignores the events that occurred during the time it was not available.
9.
DETAILED DIAGNOSIS - To make diagnosis more efficient and accurate, the eG
Enterprise suite embeds an optional detailed diagnostic capability. With this capability, the
eG agents can be configured to run detailed, more elaborate tests as and when specific
problems are detected. To enable the detailed diagnosis capability of this test for a
particular server, choose the On option. To disable the capability, click on the Off option.
The option to selectively enabled/disable the detailed diagnosis capability will be available
only if the following conditions are fulfilled:
The eG manager license should allow the detailed diagnosis capability
Both the normal and abnormal frequencies configured for the detailed diagnosis
measures should not be 0.
230
MONITORING WINDOWS SERVERS
10. POLICY BASED FILTER - Using this page, administrators can configure the event
sources, event IDs, and event descriptions to be monitored by this test. In order to enable
administrators to easily and accurately provide this specification, this page provides the
following options:
Manually specify the event sources, IDs, and users in the FILTER text area, or,
Select a specification from the predefined filter policies listed in the FILTER box
For explicit, manual specification of the filter conditions, select the NO option
against the POLICY BASED FILTER field. To choose from the list of preconfigured filter policies, or to create a new filter policy and then associate the
same with the test, select the YES option against the POLICY BASED FILTER
field. This is the default selection.
11. FILTER - If the POLICY BASED FILTER flag is set to NO, then a FILTER text area will
appear, wherein you will have to specify the event sources, event IDs, and event users to
be
monitored.
This
specification
should
be
of
the
following
format:
{Displayname}:{event_sources_to_be_included}:{event_sources_to_be_excluded}:{event_
IDs_to_be_included}:{event_IDs_to_be_excluded}:{users_to_be_included}:{
users_to_be_excluded}. For example, assume that the FILTER text area takes the value,
OS_events:all:Browse,Print:all:none:all:none. Here:
OS_events is the display name that will appear as a descriptor of the test in the
monitor UI;
all indicates that all the event sources need to be considered while monitoring. To
monitor specific event sources, provide the source names as a comma-separated
list. To ensure that none of the event sources are monitored, specify none.
Next, to ensure that specific event sources are excluded from monitoring, provide
a comma-separated list of source names. Accordingly, in our example, Browse
and Print have been excluded from monitoring. Alternatively, you can use all to
indicate that all the event sources have to be excluded from monitoring, or none
to denote that none of the event sources need be excluded.
In the same manner, you can provide a comma-separated list of event IDs that
require monitoring. The all in our example represents that all the event IDs need
to be considered while monitoring.
Similarly, the none (following all in our example) is indicative of the fact that none
of the event IDs need to be excluded from monitoring. On the other hand, if you
want to instruct the eG Enterprise system to ignore a few event IDs during
monitoring, then provide the IDs as a comma-separated list. Likewise, specifying
all makes sure that all the event IDs are excluded from monitoring.
231
MONITORING WINDOWS SERVERS
In the same way, you can also ensure that events generated by specific users on
the target host are alone tracked by providing a comma-separated list of users to
be monitored – for example, john,elvis. In our example however, all is specified,
indicating that all users need be monitored.
You can similarly indicate if specific users need to be excluded from monitoring.
In our example however, none is provided to ensure that no users are excluded
from monitoring.
default,
the
FILTER
parameter
contains
the
value:
all:all:none:all:none:all:none. Multiple filters are to be separated by semi-colons
By
(;).
Note:
The event sources and event IDs specified here should be exactly the same as that which
appears in the Event Viewer window.
On the other hand, if the POLICY BASED FILTER flag is set to YES, then a FILTER list
box will appear, displaying the filter policies that pre-exist in the eG Enterprise system. A
filter policy typically comprises of a specific set of event sources, event IDs, and users to
be monitored. This specification is built into the policy in the following format:
{Policyname}:{event_sources_to_be_included}:{event_sources_to_be_excluded}:{event_I
Ds_to_be_included}:{event_IDs_to_be_excluded}:{users_to_be_included}:{users_to_be_e
xcluded}
To monitor a specific combination of event sources, event IDs, and users, you can choose
the corresponding filter policy from the FILTER list box. Multiple filter policies can be so
selected. Alternatively, you can modify any of the existing policies to suit your needs, or
create a new filter policy. To facilitate this, a Click here link appears just above the test
configuration section, once the YES option is chosen against POLICY BASED FILTER.
Clicking on the Click here link leads you to a page where you can modify the existing
policies or create a new one (refer to page 220). The changed policy or the new policy can
then be associated with the test by selecting the policy name from the FILTER list box in
this page.
12. STATELESS ALERTS - Typically, the eG manager generates email alerts only when the
state of a specific measurement changes. A state change typically occurs only when the
threshold of a measure is violated a configured number of times within a specified time
window. While this ensured that the eG manager raised alarms only when the problem was
severe enough, in some cases, it may cause one/more problems to go unnoticed, just
because they did not result in a state change. For example, take the case of the EventLog
test. When this test captures an error event for the very first time, the eG manager will
send out a CRITICAL email alert with the details of the error event to configured recipients.
Now, the next time the test runs, if a different error event is captured, the eG manager will
keep the state of the measure as CRITICAL, but will not send out the details of this error
event to the user; thus, the second issue will remain hidden from the user. To make sure
that administrators do not miss/overlook critical issues, the eG Enterprise monitoring
solution provides the stateless alerting capability. To enable this capability for this test, set
the STATELESS ALERTS flag to Yes. This will ensure that email alerts are generated for
this test, regardless of whether or not the state of the measures reported by this test
changes.
232
MONITORING WINDOWS SERVERS
Outputs of the
test
Measurements
made by the
test
One set of results for the server being monitored
Measurement
Unit
Measurement
Successful audits:
Number
The detailed diagnosis of this measure, if
enabled, provides the details of the
successful log audits.
Number
The detailed diagnosis of this measure, if
enabled, provides the details of the failed log
audits.
Indicates the number of
successful
audits
of
windows security logs.
Failure audits:
Interpretation
Indicates the number of
windows security log audits
that failed.
Note:
The STATELESS ALERTING capability is currently available for the following tests alone, by default:
EventLog test
ApplicationEventLog test
SystemEventLog test
ApplicationEvents test
SystemEvents test
SecurityLog test
Account Management Events test
If need be, you can enable the stateless alerting capability for other tests. To achieve this, follow the steps given
below:
3.
Login to the eG manager host.
4.
Edit the eg_specs.ini file in the <EG_INSTALL_DIR>\manager\config directory.
5.
Locate the test for which the Stateless Alarms flag has to be enabled.
6.
Insert the entry, -statelessAlerts yes, into the test specification as depicted below:
EventLogTest::$hostName:$portNo=$hostName, -auto, -host $hostName -port $portNo
-eventhost $hostIp -eventsrc all -excludedSrc none -useWmi yes -statelessAlerts
yes -ddFreq 1:1 -rptName $hostName, 300
a.
7.
Finally, save the file.
8.
If need be, you can change the status of the statelessAlerts flag by reconfiguring the test in the eG
administrative interface.
233
MONITORING WINDOWS SERVERS
b.
Once the stateless alerting capability is enabled for a test (as discussed above), you will find that everytime the
testc.reports a problem, the eG manager does the following:
d.
Closes the alarm that pre-exists for that problem;
e.
f.
g.
Sends out a normal alert indicating the closure of the old problem;
Opens a new alarm and assigns a new alarm ID to it;
h.
Sends out a fresh email alert to the configured users, intimating them of the new issue.
i.
In a redundant manager setup, the secondary manager automatically downloads the updated eg_specs.ini file
j. the primary manager, and determines whether the stateless alerting capability has been enabled for any of
from
the tests reporting metrics to it. If so, everytime a threshold violation is detected by such a test, the secondary
k.
manager will perform the tasks discussed above for the problem reported by that test. Similarly, the primary
l.
manager
will check whether the stateless alert flag has been switched on for any of the tests reporting to it, and
if so, will automatically perform the above-mentioned tasks whenever those tests report a deviation from the
m.
norm.
n.
Note:
o.
p.
q.
r.
s.
t.
u.
v.
w.
x.
Since alerts will be closed after every measurement period, alarm escalation will no longer be
relevant for tests that have statelessAlerts set to yes.
For tests with statelessAlerts set to yes, statelessAlerts will apply for all measurements of that
test (i.e., it will not be possible to only have one of the measurements with stateless alerts and
others without).
If statelessAlerts is set to yes for a test, an alarm will be opened during one measurement period
(if a threshold violation happens) and will be closed prior to the next measurement period. This
way, if a threshold violation happens in successive measurement periods, there will be one alarm
per measurement period. This will reflect in all the corresponding places in the eG Enterprise
system. For example, multiple alerts in successive measurement periods will result in multiple
trouble tickets being opened (one for each measurement period). Likewise, the alarm history will
also show alarms being opened during a measurement period and closed during the next
measurement period.
234
CONCLUSION
Conclusion
This document has described in detail the monitoring paradigm used and the measurement capabilities of the eG
Enterprise suite of products with respect to Unix and Windows Servers. For details of how to administer and use the
eG Enterprise suite of products, refer to the user manuals.
We will be adding new measurement capabilities into the future versions of the eG Enterprise suite. If you can
identify new capabilities that you would like us to incorporate in the eG Enterprise suite of products, please contact
[email protected]. We look forward to your support and cooperation. Any feedback regarding this manual
or any other aspects of the eG Enterprise suite can be forwarded to [email protected].
235