1
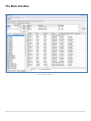
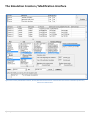
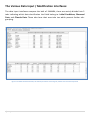
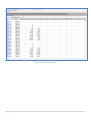
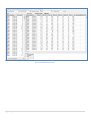
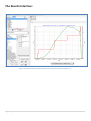
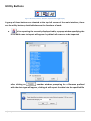
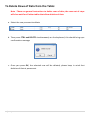
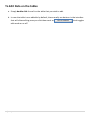
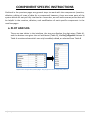
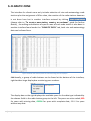
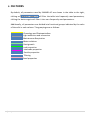
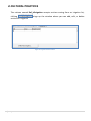
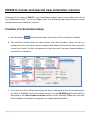
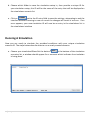
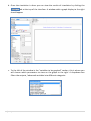
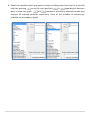
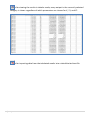
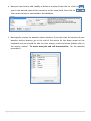
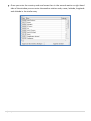
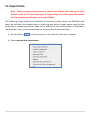
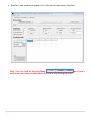
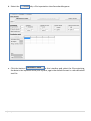
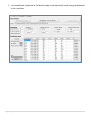
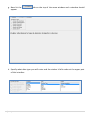
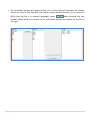
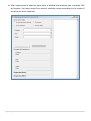
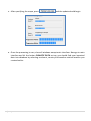
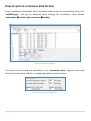
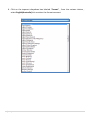
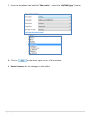
2013 SAMARA V2 USER MANUAL 3|P ag e TABLE OF CONTENTS INTERFACES 6 Main interface 7 Simulation creation Interface 8 Data input interface 9 Results interface 12 UTILITIES Utility buttons HOW TOs 13 14 16 How to create components for a simulation scenario 17 Accessing component tables 18 Creating a new entry on each component's table 19 Deletion of entries on a component table 20 Editing data on component tables 21 COMPONENT SPECIFIC INSTRUCTIONS 22 Plot and soil 22 Climatic zone 23 Cultures 24 Cultural practices 25 4|P ag e CREATION AND EXECUTION OF A SIMULATION SETUP 26 How to create a new simulation setup 26 How to run a simulation 27 Choosing variables 29 Graphing the results 30 DATA IMPORTATION 32 Creating a tab delimited file from MSExcel 33 Creation of a new station, country, or continent 35 Importing data into existing stations 38 DATE FORMAT CORRECTION 47 Determining an erroneous data format 48 Correcting the date format 50 5|P ag e INTERFACE 6|P ag e The Main Interface Figure 1 The Main Interface 7|P ag e The Simulation Creation / Modification Interface Figure 2 The Creation / Modification interface, the only difference between the two is that the first does not have a defined ID yet but every field is set to default values 8|P ag e The Various Data Input / Modification Interfaces: The data Input interfaces compose the bulk of SAMARA, these are mainly divided into 3 tabs indicating which data classification the fields belong to: Initial Conditions, Observed Data, and Climatic Data. These tabs have their own tabs too which present further subgrouping. Figure 3 The Initial Conditions interface, this includes parameters concerning soil, climatic zones and cultural practices 9|P ag e Figure 4 the Observed Data Interface 10 | P a g e Figure 5 the Climatic Data Interface 11 | P a g e The Results Interface: Figure 6 The Results Interface showing a sample of the results done from the simulation run 12 | P a g e UTILITIES 13 | P a g e Utility Buttons Figure 7 the utility buttons (L-R) Export, Duplicate Row, Toggle Display A group of three buttons are situated at the top left corner of the main interface, these are the utility buttons; detailed below are the functions of each: a. is for exporting the currently displayed table, a popup window specifying the ID of which rows to import will appear. by default all rows are to be imported after clicking on , another window prompting for a filename prefixed with the data type will appear, clicking ok will export the data into the specified file 14 | P a g e b. is for duplicating a highlighted row in the currently displayed table, this includes all fields in the source row. Take precaution in ensuring that a duplicated row will always have a unique ID assigned to it, otherwise an error may appear. c. is used for choosing which columns will be shown on the currently displayed table, clicking on it will bring up a popup window showing which columns are shown (highlighted) and which ones are hidden (no highlights) To add highlighted rows, simply press and hold down CTRL then press the LEFT MOUSE BUTTON, if you wish to show all columns, simply check the 15 | P a g e checkbox HOW TOs 16 | P a g e How to create and execute a simulation scenario Creation and execution of a new simulation scenario has two phases: Phase I: Create New Scenario A simulation scenario has 6 components: COMPONENT NAME Plot Site Variety Technical Management Model Observed data Created / Modified In Initial conditions Plot and Soil Initial conditions Climatic Zone Initial conditions Cultures Initial conditions Cultural Practices Source Built-in - Cannot Be Modified Observed Data Tab Figure 8 Simulation creation interface While creating a simulation scenario you have different options to choose from among the existing entries which were previously saved under each component. You can create a new entry with characteristics of your interest under each component. This is important while creating a new simulation scenario for absolutely fresh conditions. 17 | P a g e The following general steps explain how to create a new entry under each component. Note : The same steps will work for entry into other components, but for demo purposes we will use the Plot component. 1. Hit the button labeled ‘Initial Conditions’ near the top left of the interface: 2. And then below, click on ‘Plot and Soil’ 3. You should see the following window appear below in the interface, here you can see the previous entries from where you can choose from in the simulation creation interface 18 | P a g e To create new plot and soil characteristics: Note : These are general instructions to add rows of data, the same set of steps will also work for all other tables that accept additional entries. a. Go to end of the table, click the bottom row like so b. And then press the down arrow on the keyboard, a new blank row should appear; this is where you will fill in the data according to the column names; c. Make sure to provide a unique ID to each row you will add to avoid the key violation error – this simply means that a duplicate ID has been found 19 | P a g e To Delete Rows of Data from the Table: Note : These are general instructions to delete rows of data, the same set of steps will also work for all other tables that allow deletion of data. a. Select the row you want to delete b. Then press CTRL and DELETE simultaneously on the keyboard, this should bring up a confirmation message c. Once you press OK, the selected row will be deleted, please keep in mind that deletion of data is permanent 20 | P a g e To Edit Data on the tables a. Simply double click the cell on the table that you wish to edit b. In case the table is non editable by default, there usually are buttons in the interface that will allow editing once you click them such as edit mode on or off 21 | P a g e which toggles COMPONENT SPECIFIC INSTRUCTIONS Outlined in the previous pages are general steps to work with the components (creation, deletion, editing of rows of data for a component) however, there are some parts of the system which are not yet fully intuitive for a new user, we will outline some points that will be helpful in the creation, deletion, and modification of each specific components in the next few pages. a. PLOT AND SOIL There are two tables in the interface, the top one displays the plot setup (Table A), and the bottom one gives the soil attributes (Table B), the Ref_idTypeSol column in Table A contains values which can only be added, edited, or selected from Table B Figure 9 Left: soil type table (Table B) Right : Ref_idTypeSol from Plot setup table (Table A) 22 | P a g e b. CLIMATIC ZONE The interface for climatic zone only includes selection of rain and meteorology code stations plus the assignment of KPar value, the creation of the code stations however is not done here but in another interface entered by clicking (please refer to “To create a new station, country, or continent” guide for further details) , the editing and deletion of specific rows of each code station is also done in another interface found under the “CLIMATIC DATA” tab, both rain and meteorology data can be found here. Figure 10 climatic data interface, both rain and meteorology data are displayed Additionally, a group of radio buttons can be found at the bottom of the interface, right beside a large display box containing year numbers. The display box on the right displays the available years for the data type indicated by the chosen fields in the radio button group to the left. The years are color coded, RED for years with missing data, GREEN for years with complete data, GRAY for years without any data. 23 | P a g e c. CULTURES By default, all parameters used by SAMARA V2 are shown in the table to the right, clicking on will filter the table into frequently used parameters, clicking the button again will filter it into non-frequently used parameters. Additionally, all parameters are divided into functional groups indicated by the color of the cells in each column. The groupings are as follows: Phenology and Photoperiodism Light extinction and conversion Maintenance Respiration Water relations Root growth Leaf properties Internode properties Panicle properties Tillering Seed properties 24 | P a g e d. CULTURAL PRACTICES The column named Ref_IdIrrigation accepts entries coming from an irrigation list, clicking entries for irrigation brings up the window where you can add, edit, or delete Figure 11 irrigation entries window 25 | P a g e PHASE II: Create and execute new simulation scenario Following all the steps in PHASE I, you should have created new entries under each of the five components (the 6th one is the model itself). The following steps explain how to create and execute a new simulation scenario. Creation of a Simulation Setup a. Hit the button located at the lower left corner of the simulation interface b. The interface should show six check boxes with bold headers, these are the six components of a simulation scenario shown beforehand. Select which entry you wish to use for at least 5 of the 6 components in case you don’t have any observed data to use with the simulation c. Fill in the rest of the fields concerning the dates, making sure that the formatting for the date in SAMARA and the windows system is in the dd/MM/yyyy format (further discussed in the date format correction section of this manual). Make sure the start and end dates of simulation comprise your experimental duration. 26 | P a g e d. Choose which folder to save the simulation setup in, then provide a unique ID for your simulation setup; this ID will be the name of the entry that will be displayed on the simulations scenario list e. Click on next to the ID entry field to save the settings, attempting to exit the interface without choosing to save or cancel the changes will result in an error. If no error appears, your new simulation ID will now be an entry in the simulations list in the simulations interface Running A Simulation Now you are ready to simulate the provided conditions with your unique simulation scenario ID. The steps below describe how to run a newly created scenario. a. Choose your simulation ID and hit the button at the bottom of the simulation scenarios list, a window should appear for a moment which indicates the simulation is being done. 27 | P a g e b. Once the simulation is done you can view the results of simulation by clicking the tab at the top of the interface. A window with a graph display to the right should appear c. To the left of the window is the “variables to be graphed” section, this is where you will choose which parameters to view on the graph to the right. A dropdown box filters the outputs / observed variables into different categories 28 | P a g e d. Select the variables which you want to view by clicking them from the list to the left and then pressing to set the x axis and then or depending on how you want to view the graph. and removes a previously selected variable and removes all selected variables respectively. Once all the variables of interest are selected, we are ready to graph. 29 | P a g e To Graph the Results A group of four buttons can be found to the lower left of the results interface is for refreshing the graph and deleting what is currently graphed is for graphing the selected X and Y1, Y2 variables in the previous step Figure 12 graph of a simulation result with chosen variable Jour and DegreesDuJour 30 | P a g e is for viewing the results in tabular mode, every output in the currently selected category is shown regardless of which parameters are chosen for X, Y1, and Y2 is for importing data from the tabulated results into a tab delimited text file 31 | P a g e DATA IMPORTATION 32 | P a g e To create a tab delimited file from MSExcel The excel file may be delimited by several symbols but it is recommended to use tabulations for the purpose of uniformity. Below is how to save an excel file into a tab delimited text file Note : Samara can use non tab delimited files (files delimited by space, colon, etc.) but for uniformity, we will use the tab delimited formatting a. From the excel interface, click on the button located at the very corner on the upper left, this will bring up a dropdown list; select `Save As` then click on `Other Formats` here 33 | P a g e b. A file selection window will pop up, from here select the type of file you want to save it as, in our case, a tab delimited text file c. After clicking on 34 | P a g e , the file should be saved as a tab delimited text file. To create a new station, country, or continent a. At the Samara main interface, open the Initial Conditions tab b. Click on Climatic Zone c. Along the top of the window, click on Direct management of stations/country. d. Wait for the data administration window to appear 35 | P a g e e. Now you can choose, add, modify or delete a continent from the list. click on , type in the desired name of the continent on the name field, then click on Your new continent is now saved to the database . f. Now specify country for weather station location. If you don’t see the country of your weather station location, go to the end of the matrix hit the down arrow on the keyboard and you should be able to enter country code and name (please refer to the section named ` To create new plot and soil characteristics ` for the detailed procedure). 36 | P a g e g. Once you enter the country code and name then in the second matrix on right hand side of the window you can enter the weather station code, name, latitude, longitude and altitude in the similar way. 37 | P a g e To Import Data Note : These are general instructions to import sets of data, the same set of steps will also work for all other data types as long as they are in the proper file format, for this example we will import plot and soil data. The following steps explain the processes of importing climatic data into SAMARA data base. We will detail the manual steps in importing data below, header names used for files to be used in manual importation need not be exactly like the header names in SAMARA as there will be a step in the procedure which will take care of the association. a. Hit the button on the very corner at the top left of the main interface b. Select manual data importation 38 | P a g e c. Wait for a new window to appear, this is the manual importation interface Note : You can click on any tab among but it won’t work unless you have previously done a previous step among the three 39 | P a g e d. Select the tab, a file importation interface should appear e. Click the button in this interface and select the file containing the data to be imported from your system, again the default format is a tab delimited text file. 40 | P a g e f. You should see a preview of the data (ready to be imported) inside the grid displayed in the interface. 41 | P a g e g. Now hit the appear tab on the top of the same window and a window should h. Specify what data type you will enter and the station it falls under at the upper part of this interface 42 | P a g e i. An association section will appear below, this is where we will associate the header names we used in the files with the header names used by Samara just in case they differ (say the file is in another language); press after selecting the two header names which you choose to be associated. Results will appear on the list to the right. 43 | P a g e j. Once done, select the k. Leaving the tab and a window like the one below should appear checked (as shown) and clicking the button will run a test execution whether the data can be imported or not (if there is conflict with values or date format in the file) no actual data will be saved l. Once you confirm that the data can be imported, simply uncheck the checkbox mentioned above and click saved to the database 44 | P a g e again, this time the data will be imported and m. After importation of data has been done, a window that prompts you to update FAO will appear; You may choose from several available scopes according to the scope of the data you have imported 45 | P a g e n. After specifying the scope, press and the update should begin o. Once the processing is over, close all windows except main interface. Now go to main interface and hit the button CLIMATIC DATA on top, you should find your imported data into database by selecting continent, country and weather station location you created earlier. 46 | P a g e DATE FORMAT CORRECTION 47 | P a g e How to spot an erroneous date format Some installations of Windows have the default date format set to something other than “dd/MM/yyyy”, this can be observed when viewing the simulations setup window (simulations creation and realization modify) Figure 13 Simulation Setup Window The error can be pointed out specifically in the “simulation dates” segment where the format which should be dd/mm is instead displayed as another format. Figure 14 Erroneous Simulation Dates format 48 | P a g e When we try to validate / run SAMARA with such erroneous date formatting, we will get an error like the one below and the interface will be unresponsive. when correctly formatted, the display of figure 14 should be like so : 49 | P a g e To correct the date formatting Note : these steps are done using Windows 7 but shouldn’t vary much across windows operating systems. 1. Click on the start button, in this case is a circle in the lower left corner with the windows logo Figure 15 The windows start button / windows button as it appears in Windows 7 2. This will bring up the following popup, select Control Panel from the popup selection that appears Figure 16 Popup list with Control Panel Selected 50 | P a g e 3. Another window will appear containing various options, click the “Clock, Language, and Region” option here Figure 17 Control panel window containing various options 4. From the next menu that appears, a menu like the one pictured below will appear, click the “Region and Language” option from this menu 51 | P a g e 5. Another window will appear, this will contain the various format options for the date and time 52 | P a g e 6. Click on the topmost dropdown box labeled “Format” , from the various choices , select English(Australia) this contains the format we want 53 | P a g e 7. from the dropdown box labelled “Short date” , select the “dd/MM/yyyy” format 8. Click on at the lower right corner of the window 9. Restart Samara for the changes to take effect 54 | P a g e