1
OptoLyzer® Studio User’s Guide
ISBN: 978-1-63277-756-0
Copyright © 2015 K2L GmbH & Co. KG ("K2L"). All rights reserved.
Please make sure that all information within a document marked as 'Confidential' or 'Restricted Access' is handled solely in accordance with the agreement pursuant to which
it is provided, and is not reproduced or disclosed to others without the prior written consent of K2L. The confidential ranking of a document can be found in the footer of every
page. This document supersedes and replaces all information previously supplied. The technical information in this document loses its validity with the next edition. Although
the information is believed to be accurate, no responsibility is assumed for inaccuracies. Specifications and other documents mentioned in this document are subject to change
without notice. K2L reserves the right to make changes to this document and to the products at any time without notice. Neither the provision of this information nor the sale
of the described products conveys any licenses under any patent rights or other intellectual property rights of K2L or others. The products may contain design defects or errors
known as anomalies, including but not necessarily limited to any which may be identified in this document, which may cause the product to deviate from published descriptions.
Anomalies are described in errata sheets available upon request. K2L products are not designed, intended, authorized or warranted for use in any life support or other
application where product failure could cause or contribute to personal injury or severe property damage. Any and all such uses without prior written approval of an officer of
K2L will be fully at your own risk. The K2L logo is a trademark of K2L. Other names mentioned may be trademarks of their respective holders.
K2L disclaims and excludes any and all warranties, including without limitation any and all implied warranties of merchantability, fitness for a particular purpose, title, and
against infringement and the like, and any and all warranties arising from any course of dealing or usage of trade. In no event shall K2L be liable for any direct, incidental,
indirect, special, punitive, or consequential damages; or for lost data, profits, savings or revenues of any kind; regardless of the form of action, whether based on contract;
tort; negligence of K2L or others; strict liability; breach of warranty; or otherwise; whether or not any remedy of buyer is held to have failed of its essential purpose, and whether
or not K2L has been advised of the possibility of such damages.
2015 K2L GmbH & Co. KG
60001370A
USER’S GUIDE
OptoLyzer Studio
Table of Contents
Chapter 1 Preface. . . . . . . . . . . . . . . . . . . . . . . . . . . . . . . . . . . . . . . . . . . . . . . . . . . . . . . . . . . . 8
1.1
1.2
1.3
1.4
Intended Use . . . . . . . . . . . . . . . . . . . . . . . . . . . . . . . . . . . . . . . . . . . . . . . . . . . . . . . . . . . . . . . . . 8
Delivery. . . . . . . . . . . . . . . . . . . . . . . . . . . . . . . . . . . . . . . . . . . . . . . . . . . . . . . . . . . . . . . . . . . . . . 8
1.2.1 OptoLyzer Studio. . . . . . . . . . . . . . . . . . . . . . . . . . . . . . . . . . . . . . . . . . . . . . . . . . . . . . . . . . 8
1.2.2 OptoLyzer Studio and Hardware . . . . . . . . . . . . . . . . . . . . . . . . . . . . . . . . . . . . . . . . . . . . . . 8
1.2.3 OptoLyzer Studio Editions and Their Feature Sets . . . . . . . . . . . . . . . . . . . . . . . . . . . . . . . . 9
1.2.3.1 OptoLyzer Studio Lite Edition ..................................................................................... 9
1.2.3.2 OptoLyzer Studio Entry Edition .................................................................................. 9
1.2.3.3 OptoLyzer Studio Foundation CL Edition ...................................................................9
Definitions of Terms . . . . . . . . . . . . . . . . . . . . . . . . . . . . . . . . . . . . . . . . . . . . . . . . . . . . . . . . . . . 10
References . . . . . . . . . . . . . . . . . . . . . . . . . . . . . . . . . . . . . . . . . . . . . . . . . . . . . . . . . . . . . . . . . . 10
Chapter 2 Introduction . . . . . . . . . . . . . . . . . . . . . . . . . . . . . . . . . . . . . . . . . . . . . . . . . . . . . . 11
2.1
2.2
Features . . . . . . . . . . . . . . . . . . . . . . . . . . . . . . . . . . . . . . . . . . . . . . . . . . . . . . . . . . . . . . . . . . . . 12
PC System Requirements . . . . . . . . . . . . . . . . . . . . . . . . . . . . . . . . . . . . . . . . . . . . . . . . . . . . . . 12
Chapter 3 Installation . . . . . . . . . . . . . . . . . . . . . . . . . . . . . . . . . . . . . . . . . . . . . . . . . . . . . . . 13
3.1
3.2
3.3
3.4
3.5
Check the System Type of the Operating System . . . . . . . . . . . . . . . . . . . . . . . . . . . . . . . . . . . . 13
Installation of the OptoLyzer Studio . . . . . . . . . . . . . . . . . . . . . . . . . . . . . . . . . . . . . . . . . . . . . . . 13
Licensing . . . . . . . . . . . . . . . . . . . . . . . . . . . . . . . . . . . . . . . . . . . . . . . . . . . . . . . . . . . . . . . . . . . 14
3.3.1 Activate a License Online . . . . . . . . . . . . . . . . . . . . . . . . . . . . . . . . . . . . . . . . . . . . . . . . . . 14
Hardware Preparation . . . . . . . . . . . . . . . . . . . . . . . . . . . . . . . . . . . . . . . . . . . . . . . . . . . . . . . . . 18
3.4.1 OptoLyzer MOCCA Device . . . . . . . . . . . . . . . . . . . . . . . . . . . . . . . . . . . . . . . . . . . . . . . . . 18
3.4.1.1 Flasher Software ...................................................................................................... 18
3.4.1.2 OptoLyzer MOCCA Device Software Update........................................................... 18
3.4.2 CAN Bus Analyzer . . . . . . . . . . . . . . . . . . . . . . . . . . . . . . . . . . . . . . . . . . . . . . . . . . . . . . . . 18
Connection Diagram for Online Viewing. . . . . . . . . . . . . . . . . . . . . . . . . . . . . . . . . . . . . . . . . . . . 19
3.5.1 OptoLyzer Studio Used in Combination with OptoLyzer MOCCA Device . . . . . . . . . . . . . . 19
3.5.2 OptoLyzer Studio Used in Combination with CAN Bus Analyzer . . . . . . . . . . . . . . . . . . . . 20
Chapter 4 Used Environment and General Hints. . . . . . . . . . . . . . . . . . . . . . . . . . . . . . . . . 21
4.1
4.2
Used Environment for Guided Tours . . . . . . . . . . . . . . . . . . . . . . . . . . . . . . . . . . . . . . . . . . . . . . 21
Good to Know Before Starting . . . . . . . . . . . . . . . . . . . . . . . . . . . . . . . . . . . . . . . . . . . . . . . . . . . 22
Chapter 5 Guided Tour through Trace View - Monitor Messages . . . . . . . . . . . . . . . . . . . 23
5.1
Start the OptoLyzer Studio for the First Time . . . . . . . . . . . . . . . . . . . . . . . . . . . . . . . . . . . . . . . . 23
Chapter 6
6.1
Guided Tour through Activity - Send a Message. . . . . . . . . . . . . . . . . . . . . . . . 38
Start Activity Tool . . . . . . . . . . . . . . . . . . . . . . . . . . . . . . . . . . . . . . . . . . . . . . . . . . . . . . . . . . . . . 38
6.1.1 Using Predefined Activity Templates . . . . . . . . . . . . . . . . . . . . . . . . . . . . . . . . . . . . . . . . . . 56
Chapter 7 Guided Tour through Graph - Monitor Signals . . . . . . . . . . . . . . . . . . . . . . . . . 57
7.1
Start Graph . . . . . . . . . . . . . . . . . . . . . . . . . . . . . . . . . . . . . . . . . . . . . . . . . . . . . . . . . . . . . . . . . . 57
7.1.1 Search and Measure Using the Graph . . . . . . . . . . . . . . . . . . . . . . . . . . . . . . . . . . . . . . . . 64
7.1.2 Online Help in Signal Graph . . . . . . . . . . . . . . . . . . . . . . . . . . . . . . . . . . . . . . . . . . . . . . . . 69
Chapter 8 Creating Filters . . . . . . . . . . . . . . . . . . . . . . . . . . . . . . . . . . . . . . . . . . . . . . . . . . . 70
60001370A
2
USER’S GUIDE
2015 K2L GmbH & Co. KG
OptoLyzer Studio
8.1
8.2
8.3
8.4
Good To Know When Working with Filters . . . . . . . . . . . . . . . . . . . . . . . . . . . . . . . . . . . . . . . . . .
Show Filters . . . . . . . . . . . . . . . . . . . . . . . . . . . . . . . . . . . . . . . . . . . . . . . . . . . . . . . . . . . . . . . . .
Protocol Filters Versus Channel Filters . . . . . . . . . . . . . . . . . . . . . . . . . . . . . . . . . . . . . . . . . . . .
How To Create User Defined Filters. . . . . . . . . . . . . . . . . . . . . . . . . . . . . . . . . . . . . . . . . . . . . . .
8.4.1 Fast Alternative How To Add a Filter Condition. . . . . . . . . . . . . . . . . . . . . . . . . . . . . . . . . .
70
71
74
77
89
Chapter 9 Digging in Bits and Bytes . . . . . . . . . . . . . . . . . . . . . . . . . . . . . . . . . . . . . . . . . . . 90
9.1
9.2
9.3
Disassembly . . . . . . . . . . . . . . . . . . . . . . . . . . . . . . . . . . . . . . . . . . . . . . . . . . . . . . . . . . . . . . . . .
9.1.1 How To Use the Disassembly . . . . . . . . . . . . . . . . . . . . . . . . . . . . . . . . . . . . . . . . . . . . . . .
Bit View. . . . . . . . . . . . . . . . . . . . . . . . . . . . . . . . . . . . . . . . . . . . . . . . . . . . . . . . . . . . . . . . . . . . .
9.2.1 How To Use the Bit View. . . . . . . . . . . . . . . . . . . . . . . . . . . . . . . . . . . . . . . . . . . . . . . . . . .
9.2.2 Recommendation when To Use the Bit View . . . . . . . . . . . . . . . . . . . . . . . . . . . . . . . . . . .
Hex View . . . . . . . . . . . . . . . . . . . . . . . . . . . . . . . . . . . . . . . . . . . . . . . . . . . . . . . . . . . . . . . . . . .
9.3.1 How To Use the Hex View. . . . . . . . . . . . . . . . . . . . . . . . . . . . . . . . . . . . . . . . . . . . . . . . . .
9.3.2 Recommendation when To Use the Hex View . . . . . . . . . . . . . . . . . . . . . . . . . . . . . . . . . .
90
91
93
93
96
97
97
99
Chapter 10 Tools . . . . . . . . . . . . . . . . . . . . . . . . . . . . . . . . . . . . . . . . . . . . . . . . . . . . . . . . . . . 100
10.1
10.2
10.3
10.4
10.5
10.6
Quick Access Toolbar. . . . . . . . . . . . . . . . . . . . . . . . . . . . . . . . . . . . . . . . . . . . . . . . . . . . . . . . . 100
File Application Menu and Ribbon Tab Groups . . . . . . . . . . . . . . . . . . . . . . . . . . . . . . . . . . . . . 101
Workspace . . . . . . . . . . . . . . . . . . . . . . . . . . . . . . . . . . . . . . . . . . . . . . . . . . . . . . . . . . . . . . . . . 104
10.3.1 Catalogs . . . . . . . . . . . . . . . . . . . . . . . . . . . . . . . . . . . . . . . . . . . . . . . . . . . . . . . . . . . . . 104
10.3.2 Log Files . . . . . . . . . . . . . . . . . . . . . . . . . . . . . . . . . . . . . . . . . . . . . . . . . . . . . . . . . . . . . 104
10.3.3 Graph. . . . . . . . . . . . . . . . . . . . . . . . . . . . . . . . . . . . . . . . . . . . . . . . . . . . . . . . . . . . . . . . 105
10.3.4 Filters. . . . . . . . . . . . . . . . . . . . . . . . . . . . . . . . . . . . . . . . . . . . . . . . . . . . . . . . . . . . . . . . 105
10.3.4.1 Channel Filters .....................................................................................................105
10.3.4.2 Protocol Filters......................................................................................................105
10.3.4.3 User-defined Filters ..............................................................................................105
10.3.5 Activities . . . . . . . . . . . . . . . . . . . . . . . . . . . . . . . . . . . . . . . . . . . . . . . . . . . . . . . . . . . . . 107
Errors & Warnings . . . . . . . . . . . . . . . . . . . . . . . . . . . . . . . . . . . . . . . . . . . . . . . . . . . . . . . . . . . 110
10.4.1 How To Start the Errors & Warnings Tool . . . . . . . . . . . . . . . . . . . . . . . . . . . . . . . . . . . . 110
Description . . . . . . . . . . . . . . . . . . . . . . . . . . . . . . . . . . . . . . . . . . . . . . . . . . . . . . . . . . . . . . . . . 111
10.5.1 How To Use the Description . . . . . . . . . . . . . . . . . . . . . . . . . . . . . . . . . . . . . . . . . . . . . . 111
System Info. . . . . . . . . . . . . . . . . . . . . . . . . . . . . . . . . . . . . . . . . . . . . . . . . . . . . . . . . . . . . . . . . 112
10.6.1 How To Use the System Info . . . . . . . . . . . . . . . . . . . . . . . . . . . . . . . . . . . . . . . . . . . . . . 113
Chapter 11 Revision History . . . . . . . . . . . . . . . . . . . . . . . . . . . . . . . . . . . . . . . . . . . . . . . . . 114
2015 K2L GmbH & Co. KG
3
USER’S GUIDE
60001370A
OptoLyzer Studio
List of Figures
Figure 3.1
Figure 3.2
Figure 3.3
Figure 3.4
Figure 3.5
Figure 3.6
Figure 3.7
Figure 3.8
Figure 3.9
Figure 3.10
Figure 4.1
Figure 5.1
Figure 5.2
Figure 5.3
Figure 5.4
Figure 5.5
Figure 5.6
Figure 5.7
Figure 5.8
Figure 5.9
Figure 5.10
Figure 5.11
Figure 5.12
Figure 5.13
Figure 5.14
Figure 5.15
Figure 5.16
Figure 5.17
Figure 5.18
Figure 6.1
Figure 6.2
Figure 6.3
Figure 6.4
Figure 6.5
Figure 6.6
Figure 6.7
Figure 6.8
Figure 6.9
Figure 6.10
Figure 6.11
Figure 6.12
Figure 6.13
Figure 6.14
Figure 6.15
Figure 6.16
Figure 6.17
Figure 6.18
Figure 6.19
Figure 6.20
Figure 6.21
60001370A
Add Ticket . . . . . . . . . . . . . . . . . . . . . . . . . . . . . . . . . . . . . . . . . . . . . . . . . . . . . . . . . . . . . . .
Activate Licenses - Example . . . . . . . . . . . . . . . . . . . . . . . . . . . . . . . . . . . . . . . . . . . . . . . . .
Select Kind of License . . . . . . . . . . . . . . . . . . . . . . . . . . . . . . . . . . . . . . . . . . . . . . . . . . . . . .
Select CmContainer - Example . . . . . . . . . . . . . . . . . . . . . . . . . . . . . . . . . . . . . . . . . . . . . . .
Online License Transfer . . . . . . . . . . . . . . . . . . . . . . . . . . . . . . . . . . . . . . . . . . . . . . . . . . . . .
Online License Transfer Succeeded . . . . . . . . . . . . . . . . . . . . . . . . . . . . . . . . . . . . . . . . . . .
Activate Another License If Available - Example . . . . . . . . . . . . . . . . . . . . . . . . . . . . . . . . . .
Activate License in License Tab - Example . . . . . . . . . . . . . . . . . . . . . . . . . . . . . . . . . . . . . .
Connection Diagram when Used with OptoLyzer MOCCA Device . . . . . . . . . . . . . . . . . . . .
Connection Diagram when Used with CAN Bus Analyzer . . . . . . . . . . . . . . . . . . . . . . . . . . .
Example Environment . . . . . . . . . . . . . . . . . . . . . . . . . . . . . . . . . . . . . . . . . . . . . . . . . . . . . .
OptoLyzer Studio - First Start. . . . . . . . . . . . . . . . . . . . . . . . . . . . . . . . . . . . . . . . . . . . . . . . .
Check for Connected Devices . . . . . . . . . . . . . . . . . . . . . . . . . . . . . . . . . . . . . . . . . . . . . . . .
View Connected Devices in Device Manager . . . . . . . . . . . . . . . . . . . . . . . . . . . . . . . . . . . .
Start Online Monitoring . . . . . . . . . . . . . . . . . . . . . . . . . . . . . . . . . . . . . . . . . . . . . . . . . . . . .
Online Monitoring . . . . . . . . . . . . . . . . . . . . . . . . . . . . . . . . . . . . . . . . . . . . . . . . . . . . . . . . . .
Load CAN Catalog . . . . . . . . . . . . . . . . . . . . . . . . . . . . . . . . . . . . . . . . . . . . . . . . . . . . . . . . .
Online Monitoring after Loading a Catalog. . . . . . . . . . . . . . . . . . . . . . . . . . . . . . . . . . . . . . .
Focusing on Trace View. . . . . . . . . . . . . . . . . . . . . . . . . . . . . . . . . . . . . . . . . . . . . . . . . . . . .
Focusing on Trace View Content . . . . . . . . . . . . . . . . . . . . . . . . . . . . . . . . . . . . . . . . . . . . . .
Detail View Body and Signal . . . . . . . . . . . . . . . . . . . . . . . . . . . . . . . . . . . . . . . . . . . . . . . . .
Adding Columns. . . . . . . . . . . . . . . . . . . . . . . . . . . . . . . . . . . . . . . . . . . . . . . . . . . . . . . . . . .
Example of a Fixed Position Trace View . . . . . . . . . . . . . . . . . . . . . . . . . . . . . . . . . . . . . . . .
Using Time Stamp Functions 1 . . . . . . . . . . . . . . . . . . . . . . . . . . . . . . . . . . . . . . . . . . . . . . .
Using Time Stamp Functions 2 . . . . . . . . . . . . . . . . . . . . . . . . . . . . . . . . . . . . . . . . . . . . . . .
Example of a Stored and not Stored Online Trace . . . . . . . . . . . . . . . . . . . . . . . . . . . . . . . .
Assign Log File to Workspace . . . . . . . . . . . . . . . . . . . . . . . . . . . . . . . . . . . . . . . . . . . . . . . .
Drag and Drop Log File within Workspace. . . . . . . . . . . . . . . . . . . . . . . . . . . . . . . . . . . . . . .
Stored Workspace . . . . . . . . . . . . . . . . . . . . . . . . . . . . . . . . . . . . . . . . . . . . . . . . . . . . . . . . .
Load Workspace from Recent List . . . . . . . . . . . . . . . . . . . . . . . . . . . . . . . . . . . . . . . . . . . . .
Create an Activity . . . . . . . . . . . . . . . . . . . . . . . . . . . . . . . . . . . . . . . . . . . . . . . . . . . . . . . . . .
Activity Ribbon - Add Empty Activity . . . . . . . . . . . . . . . . . . . . . . . . . . . . . . . . . . . . . . . . . . .
Activity - Select Send Message . . . . . . . . . . . . . . . . . . . . . . . . . . . . . . . . . . . . . . . . . . . . . . .
Activity - View Tool Tip. . . . . . . . . . . . . . . . . . . . . . . . . . . . . . . . . . . . . . . . . . . . . . . . . . . . . .
Activity - Select Device and Channel . . . . . . . . . . . . . . . . . . . . . . . . . . . . . . . . . . . . . . . . . . .
Activity - Specify Message Type . . . . . . . . . . . . . . . . . . . . . . . . . . . . . . . . . . . . . . . . . . . . . .
Activity - Specify CAN ID . . . . . . . . . . . . . . . . . . . . . . . . . . . . . . . . . . . . . . . . . . . . . . . . . . . .
Activity - Switch to Signal Tab . . . . . . . . . . . . . . . . . . . . . . . . . . . . . . . . . . . . . . . . . . . . . . . .
Activity - Signal Tab . . . . . . . . . . . . . . . . . . . . . . . . . . . . . . . . . . . . . . . . . . . . . . . . . . . . . . . .
Activity - Specify Speed . . . . . . . . . . . . . . . . . . . . . . . . . . . . . . . . . . . . . . . . . . . . . . . . . . . . .
Activity - Specify the Name of an Activity. . . . . . . . . . . . . . . . . . . . . . . . . . . . . . . . . . . . . . . .
Activity - Insert a Delay Step 1 . . . . . . . . . . . . . . . . . . . . . . . . . . . . . . . . . . . . . . . . . . . . . . . .
Activity - Insert a Delay Step 2 . . . . . . . . . . . . . . . . . . . . . . . . . . . . . . . . . . . . . . . . . . . . . . . .
Activity - Insert a Delay Step 3 . . . . . . . . . . . . . . . . . . . . . . . . . . . . . . . . . . . . . . . . . . . . . . . .
Activity - Insert Send Message from Activity Ribbon . . . . . . . . . . . . . . . . . . . . . . . . . . . . . . .
Activity - Customize Second Action . . . . . . . . . . . . . . . . . . . . . . . . . . . . . . . . . . . . . . . . . . . .
Activity - Drag & Drop an Action. . . . . . . . . . . . . . . . . . . . . . . . . . . . . . . . . . . . . . . . . . . . . . .
Activity - Collapse All . . . . . . . . . . . . . . . . . . . . . . . . . . . . . . . . . . . . . . . . . . . . . . . . . . . . . . .
Activity - Add Loop . . . . . . . . . . . . . . . . . . . . . . . . . . . . . . . . . . . . . . . . . . . . . . . . . . . . . . . . .
Activity - Drag & Drop an Action into Loop. . . . . . . . . . . . . . . . . . . . . . . . . . . . . . . . . . . . . . .
4
USER’S GUIDE
14
15
15
16
16
17
17
17
19
20
21
23
24
25
25
26
27
28
29
30
31
32
32
34
35
36
36
36
37
38
39
39
40
41
42
43
44
45
46
46
47
47
48
48
49
50
51
51
52
53
2015 K2L GmbH & Co. KG
OptoLyzer Studio
Figure 6.22
Figure 6.23
Figure 6.24
Figure 6.25
Figure 6.26
Figure 7.1
Figure 7.2
Figure 7.3
Figure 7.4
Figure 7.5
Figure 7.6
Figure 7.7
Figure 7.8
Figure 7.9
Figure 7.10
Figure 7.11
Figure 7.12
Figure 7.13
Figure 7.14
Figure 7.15
Figure 7.16
Figure 7.17
Figure 7.18
Figure 7.19
Figure 7.20
Figure 8.1
Figure 8.2
Figure 8.3
Figure 8.4
Figure 8.5
Figure 8.6
Figure 8.7
Figure 8.8
Figure 8.9
Figure 8.10
Figure 8.11
Figure 8.12
Figure 8.13
Figure 8.14
Figure 8.15
Figure 8.16
Figure 8.17
Figure 8.18
Figure 8.19
Figure 8.20
Figure 8.21
Figure 8.22
Figure 9.1
Figure 9.2
Figure 9.3
Figure 9.4
Figure 9.5
Activity - Copy Delay Action . . . . . . . . . . . . . . . . . . . . . . . . . . . . . . . . . . . . . . . . . . . . . . . . . .
Activity - Delete Empty Action . . . . . . . . . . . . . . . . . . . . . . . . . . . . . . . . . . . . . . . . . . . . . . . .
Activity - Start . . . . . . . . . . . . . . . . . . . . . . . . . . . . . . . . . . . . . . . . . . . . . . . . . . . . . . . . . . . . .
Activity - Green LED Activity Indicator . . . . . . . . . . . . . . . . . . . . . . . . . . . . . . . . . . . . . . . . . .
Using Predefined Activity Templates . . . . . . . . . . . . . . . . . . . . . . . . . . . . . . . . . . . . . . . . . . .
Split Trace View and Show Graph . . . . . . . . . . . . . . . . . . . . . . . . . . . . . . . . . . . . . . . . . . . . .
Split Windows - Empty Graph . . . . . . . . . . . . . . . . . . . . . . . . . . . . . . . . . . . . . . . . . . . . . . . .
Drag & Drop a Property to the Graph. . . . . . . . . . . . . . . . . . . . . . . . . . . . . . . . . . . . . . . . . . .
Graph Ribbon and Graph Overview. . . . . . . . . . . . . . . . . . . . . . . . . . . . . . . . . . . . . . . . . . . .
Extract Graph Overview - Drag ViewPort Handle . . . . . . . . . . . . . . . . . . . . . . . . . . . . . . . . .
Graph Ribbon With Tool Tips. . . . . . . . . . . . . . . . . . . . . . . . . . . . . . . . . . . . . . . . . . . . . . . . .
Graph - Customize View . . . . . . . . . . . . . . . . . . . . . . . . . . . . . . . . . . . . . . . . . . . . . . . . . . . .
Hide and Show Graph per Dragging . . . . . . . . . . . . . . . . . . . . . . . . . . . . . . . . . . . . . . . . . . .
Show Graph by Dragging - Step 1 . . . . . . . . . . . . . . . . . . . . . . . . . . . . . . . . . . . . . . . . . . . . .
Show Graph by Dragging - Step 2 . . . . . . . . . . . . . . . . . . . . . . . . . . . . . . . . . . . . . . . . . . . . .
Start Activity To Create Spike Signals - Step 1 . . . . . . . . . . . . . . . . . . . . . . . . . . . . . . . . . . .
Start Activity To Create Spike Signals - Step 2 . . . . . . . . . . . . . . . . . . . . . . . . . . . . . . . . . . .
Searching for Values of Interest by Dragging the ViewPort to the Left Side . . . . . . . . . . . . .
Identify Value of Interest . . . . . . . . . . . . . . . . . . . . . . . . . . . . . . . . . . . . . . . . . . . . . . . . . . . .
Enlarge ViewPort . . . . . . . . . . . . . . . . . . . . . . . . . . . . . . . . . . . . . . . . . . . . . . . . . . . . . . . . . .
Start to Measure Signal Interval - Step 1 . . . . . . . . . . . . . . . . . . . . . . . . . . . . . . . . . . . . . . . .
Start to Measure Signal Interval - Step 2 . . . . . . . . . . . . . . . . . . . . . . . . . . . . . . . . . . . . . . . .
Measured Signal Interval . . . . . . . . . . . . . . . . . . . . . . . . . . . . . . . . . . . . . . . . . . . . . . . . . . . .
Add Online File to Workspace . . . . . . . . . . . . . . . . . . . . . . . . . . . . . . . . . . . . . . . . . . . . . . . .
Signal Graph Online Help . . . . . . . . . . . . . . . . . . . . . . . . . . . . . . . . . . . . . . . . . . . . . . . . . . .
Show Filters - Step 1 . . . . . . . . . . . . . . . . . . . . . . . . . . . . . . . . . . . . . . . . . . . . . . . . . . . . . . .
Show Filters - Step 2 . . . . . . . . . . . . . . . . . . . . . . . . . . . . . . . . . . . . . . . . . . . . . . . . . . . . . . .
Enable CAN Channel Filters . . . . . . . . . . . . . . . . . . . . . . . . . . . . . . . . . . . . . . . . . . . . . . . . .
Set CAN Protocol Filter . . . . . . . . . . . . . . . . . . . . . . . . . . . . . . . . . . . . . . . . . . . . . . . . . . . . .
Disable All Filters . . . . . . . . . . . . . . . . . . . . . . . . . . . . . . . . . . . . . . . . . . . . . . . . . . . . . . . . . .
Disabled Filters . . . . . . . . . . . . . . . . . . . . . . . . . . . . . . . . . . . . . . . . . . . . . . . . . . . . . . . . . . .
Create Filter File. . . . . . . . . . . . . . . . . . . . . . . . . . . . . . . . . . . . . . . . . . . . . . . . . . . . . . . . . . .
Created Filter File. . . . . . . . . . . . . . . . . . . . . . . . . . . . . . . . . . . . . . . . . . . . . . . . . . . . . . . . . .
Add CAN Filter . . . . . . . . . . . . . . . . . . . . . . . . . . . . . . . . . . . . . . . . . . . . . . . . . . . . . . . . . . . .
Define CAN Filter Condition . . . . . . . . . . . . . . . . . . . . . . . . . . . . . . . . . . . . . . . . . . . . . . . . . .
Specify Condition - Step 1 . . . . . . . . . . . . . . . . . . . . . . . . . . . . . . . . . . . . . . . . . . . . . . . . . . .
Specify Condition - Step 2 . . . . . . . . . . . . . . . . . . . . . . . . . . . . . . . . . . . . . . . . . . . . . . . . . . .
Specify Condition - Step 3 . . . . . . . . . . . . . . . . . . . . . . . . . . . . . . . . . . . . . . . . . . . . . . . . . . .
Specify Condition - Step 4 . . . . . . . . . . . . . . . . . . . . . . . . . . . . . . . . . . . . . . . . . . . . . . . . . . .
Specify Condition - Step 5 . . . . . . . . . . . . . . . . . . . . . . . . . . . . . . . . . . . . . . . . . . . . . . . . . . .
Specify Condition - Step 6 . . . . . . . . . . . . . . . . . . . . . . . . . . . . . . . . . . . . . . . . . . . . . . . . . . .
Specify Condition - Step 7 . . . . . . . . . . . . . . . . . . . . . . . . . . . . . . . . . . . . . . . . . . . . . . . . . . .
Specify Condition - Step 8 . . . . . . . . . . . . . . . . . . . . . . . . . . . . . . . . . . . . . . . . . . . . . . . . . . .
Specify Condition - Step 9 . . . . . . . . . . . . . . . . . . . . . . . . . . . . . . . . . . . . . . . . . . . . . . . . . . .
Specify Condition - Step 10 . . . . . . . . . . . . . . . . . . . . . . . . . . . . . . . . . . . . . . . . . . . . . . . . . .
Check Values . . . . . . . . . . . . . . . . . . . . . . . . . . . . . . . . . . . . . . . . . . . . . . . . . . . . . . . . . . . . .
Specify Condition by Drag & Drop . . . . . . . . . . . . . . . . . . . . . . . . . . . . . . . . . . . . . . . . . . . . .
Start Disassembly- Step 1 . . . . . . . . . . . . . . . . . . . . . . . . . . . . . . . . . . . . . . . . . . . . . . . . . . .
Start Disassembly- Step 2 . . . . . . . . . . . . . . . . . . . . . . . . . . . . . . . . . . . . . . . . . . . . . . . . . . .
View Data in Disassembly . . . . . . . . . . . . . . . . . . . . . . . . . . . . . . . . . . . . . . . . . . . . . . . . . . .
Start Bit View . . . . . . . . . . . . . . . . . . . . . . . . . . . . . . . . . . . . . . . . . . . . . . . . . . . . . . . . . . . . .
How Information Is Spread within the Tools 1 . . . . . . . . . . . . . . . . . . . . . . . . . . . . . . . . . . . .
2015 K2L GmbH & Co. KG
5
USER’S GUIDE
53
54
54
55
56
57
58
59
60
60
61
61
62
62
63
64
65
65
66
66
67
67
68
68
69
71
72
74
75
76
76
77
78
79
80
80
81
81
82
83
84
85
86
87
88
88
89
91
91
92
93
93
60001370A
OptoLyzer Studio
Figure 9.6 Bit View - Details . . . . . . . . . . . . . . . . . . . . . . . . . . . . . . . . . . . . . . . . . . . . . . . . . . . . . . . . . . 94
Figure 9.7 Bit View - Tool Tip . . . . . . . . . . . . . . . . . . . . . . . . . . . . . . . . . . . . . . . . . . . . . . . . . . . . . . . . . 95
Figure 9.8 Bit View - Select Bit . . . . . . . . . . . . . . . . . . . . . . . . . . . . . . . . . . . . . . . . . . . . . . . . . . . . . . . . 95
Figure 9.9 Bit View - Copy Data . . . . . . . . . . . . . . . . . . . . . . . . . . . . . . . . . . . . . . . . . . . . . . . . . . . . . . . 96
Figure 9.10 Byte - Split Information. . . . . . . . . . . . . . . . . . . . . . . . . . . . . . . . . . . . . . . . . . . . . . . . . . . . . . 96
Figure 9.11 Start Hex View . . . . . . . . . . . . . . . . . . . . . . . . . . . . . . . . . . . . . . . . . . . . . . . . . . . . . . . . . . . . 97
Figure 9.12 How Information Is Spread within the Tools 2 . . . . . . . . . . . . . . . . . . . . . . . . . . . . . . . . . . . . 97
Figure 9.13 Hex View - Select Byte. . . . . . . . . . . . . . . . . . . . . . . . . . . . . . . . . . . . . . . . . . . . . . . . . . . . . . 98
Figure 9.14 Copy Hex View Data . . . . . . . . . . . . . . . . . . . . . . . . . . . . . . . . . . . . . . . . . . . . . . . . . . . . . . . 98
Figure 10.1 OptoLyzer Studio - Overview . . . . . . . . . . . . . . . . . . . . . . . . . . . . . . . . . . . . . . . . . . . . . . . . 100
Figure 10.2 Ribbon Tabs. . . . . . . . . . . . . . . . . . . . . . . . . . . . . . . . . . . . . . . . . . . . . . . . . . . . . . . . . . . . . 102
Figure 10.3 Activity Ribbon . . . . . . . . . . . . . . . . . . . . . . . . . . . . . . . . . . . . . . . . . . . . . . . . . . . . . . . . . . . 108
Figure 10.4 Activity - Graphical Overview - Example . . . . . . . . . . . . . . . . . . . . . . . . . . . . . . . . . . . . . . . 108
Figure 10.5 Start Errors & Warnings . . . . . . . . . . . . . . . . . . . . . . . . . . . . . . . . . . . . . . . . . . . . . . . . . . . . 110
Figure 10.6 Example of an Error Message . . . . . . . . . . . . . . . . . . . . . . . . . . . . . . . . . . . . . . . . . . . . . . . 110
Figure 10.7 Start Description. . . . . . . . . . . . . . . . . . . . . . . . . . . . . . . . . . . . . . . . . . . . . . . . . . . . . . . . . . 111
Figure 10.8 Example of a Description . . . . . . . . . . . . . . . . . . . . . . . . . . . . . . . . . . . . . . . . . . . . . . . . . . . 111
Figure 10.9 Start System Info . . . . . . . . . . . . . . . . . . . . . . . . . . . . . . . . . . . . . . . . . . . . . . . . . . . . . . . . . 113
Figure 10.10Example of a System Info . . . . . . . . . . . . . . . . . . . . . . . . . . . . . . . . . . . . . . . . . . . . . . . . . . 113
60001370A
6
USER’S GUIDE
2015 K2L GmbH & Co. KG
OptoLyzer Studio
List of Tables
Table 1.1 OptoLyzer Studio Editions . . . . . . . . . . . . . . . . . . . . . . . . . . . . . . . . . . . . . . . . . . . . . . . . . . . . . 9
Table 1.2 Definitions of Terms. . . . . . . . . . . . . . . . . . . . . . . . . . . . . . . . . . . . . . . . . . . . . . . . . . . . . . . . . 10
Table 5.1 Value Variants . . . . . . . . . . . . . . . . . . . . . . . . . . . . . . . . . . . . . . . . . . . . . . . . . . . . . . . . . . . . . 30
Table 5.2 Available Modes . . . . . . . . . . . . . . . . . . . . . . . . . . . . . . . . . . . . . . . . . . . . . . . . . . . . . . . . . . . 33
Table 8.1 Default Filters. . . . . . . . . . . . . . . . . . . . . . . . . . . . . . . . . . . . . . . . . . . . . . . . . . . . . . . . . . . . . . 73
Table 10.5 Supported Device and Channel Actions . . . . . . . . . . . . . . . . . . . . . . . . . . . . . . . . . . . . . . . . 112
Table 10.6 Indicators of Supported Devices . . . . . . . . . . . . . . . . . . . . . . . . . . . . . . . . . . . . . . . . . . . . . . 112
Table 11.1 Customer Revision History . . . . . . . . . . . . . . . . . . . . . . . . . . . . . . . . . . . . . . . . . . . . . . . . . . 114
2015 K2L GmbH & Co. KG
7
USER’S GUIDE
60001370A
OptoLyzer Studio
Chapter 1
1.1
Preface
Intended Use
This K2L product is intended to be used for developing, testing, or analyzing CAN® - and LIN® based
products and systems by persons with experience in developing such bus systems.
1.2
Delivery
The OptoLyzer® Studio is provided either stand-alone, i.e., without hardware (Section 1.2.1) or with
hardware (Section 1.2.2).
1.2.1
OptoLyzer Studio
If the software is delivered without hardware, the software has to be downloaded from our web site:
http://www.K2L.de. A ticket number will be provided via e-mail that allows to activate a license key.
Notes: A license can only be activated if the OptoLyzer Studio has been installed.
1.2.2
OptoLyzer Studio and Hardware
Depending on the purchase order the shipment covers:
one of the following hardware devices:
— OptoLyzer MOCCA compact 50e (supporting CAN and/or LIN)
— OptoLyzer MOCCA compact 150o (supporting CAN and/or LIN)
— OptoLyzer MOCCA compact 150c (supporting CAN and/or LIN)
— OptoLyzer MOCCA CLF (supporting CAN and/or LIN)
Microchip’s CAN Bus Analyzer (supported in the OptoLyzer Studio Entry Edition) is not part of the
shipment. It has to be ordered separately via the MCHP website.
Installation CD including:
— Installer of the OptoLyzer Studio
— Installer of the K2L Flasher including appropriate firmware files
— Documentation
— Ticket that allows to enable a license key
— CmDongle (if ordered)
Check your shipment for completeness. If you have any objections direct them to [email protected].
Providing the delivery note number eases the handling.
60001370A
8
USER’S GUIDE
2015 K2L GmbH & Co. KG
OptoLyzer Studio
1.2.3
OptoLyzer Studio Editions and Their Feature Sets
The feature sets of the OptoLyzer Studio editions are shown in Table 1.1 and described in the sections
below.
Table 1.1 OptoLyzer Studio Editions
EDITION
OptoLyzer MOCCA compact
50e
150o
150c
OptoLyzer
CAN Bus
COMPONENTS/
MOCCA CLF
Analyzer
USE CASES
Lite
Entry
X
Foundation
CL
X
X
X
X
X
1.2.3.1
Simple offline analysis
No HW support
Lite Edition functionality inclusive
Online/offline analysis
Basic message sending
- Single message sending
- Cyclic message sending
Storing of online traces
Support of Microchip’s CAN Bus
Analyzer
Entry Edition functionality
inclusive
Enhanced online/offline analysis
Complex activities
Filtering
Support of CAN/LIN catalogs
Support of OptoLyzer MOCCA
devices according to
Section 1.2.2
OptoLyzer Studio Lite Edition
There is a free of charge variant of the OptoLyzer Studio available that allows viewing of existing files
without any hardware support. To use this version just download the OptoLyzer Studio software without
activating a license key.
1.2.3.2
OptoLyzer Studio Entry Edition
This version enables the user to interact with CAN Bus Analyzer using simply activities and start/save
log sessions. Additionally, all functions of the OptoLyzer Studio Lite Edition are available.
1.2.3.3
OptoLyzer Studio Foundation CL Edition
This version enables the user to interact with OptoLyzer MOCCA devices using the OptoLyzer Studio
and define complex activities. Also a graph, plenty of trace view functionalities and both simple and
complex filters are available. Additionally, all functions of the OptoLyzer Studio Entry Edition are
available. CAN and LIN bus systems are supported.
2015 K2L GmbH & Co. KG
9
USER’S GUIDE
60001370A
OptoLyzer Studio
1.3
Definitions of Terms
For better understanding of the following chapters, this section provides explanation to special terms,
used within this getting started.
Table 1.2 Definitions of Terms
TERM / ABBREVIATION
DESCRIPTION
CAN®
Controller Area Network
CBA
CAN Bus Analyzer, a hardware device developed by Microchip
CodeMeter®
State-of the-art software protection provided by Wibu Systems. This technology allows flexible
software licensing.
CmActLicence
The license is transferred to a computer (PC). The license is associated with some properties
of the computer.
CmDongle
The license is fully transferred to a dongle (CmDongle). This allows to use the license on
different computers.
CmStick
Stick that belongs to the CodeMeter technology, formerly known as hardware dongle. It is a
standard-sized USB CmStick, computer-independent, housed in plastic or metal, embeds a
smart card chip, supports complete license model spectrum.
DUT
Device Under Test
Graph
A graph shows the values of one or several dedicated messages, events in a chronological
sequence in a graphical manner.
HW
Hardware
LIN®
Local Interconnect Network
MDI
Multi document interface
*.olsactivity
OptoLyzer Studio stores activity files using this file extension.
*.olsfilter
OptoLyzer Studio stores filter files using this file extension.
*.olslog
OptoLyzer Studio stores log files using this file extension.
*.olsworkspace
OptoLyzer Studio stores workspaces using this file extension.
OS
Operating system
Payload
Properties of interest are mostly arranged in the body of a message (called Payload in the
OptoLyzer Studio) and can be structured with the help of catalogs.
USB
Universal Serial Bus
1.4
60001370A
References
[1]
OptoLyzer® MOCCA compact V3.1 User Manual
http://www.K2L.de
[2]
CAN Bus Analyzer User’s Guide
http://www.microchip.com
10
USER’S GUIDE
2015 K2L GmbH & Co. KG
OptoLyzer Studio
Chapter 2
Introduction
The OptoLyzer Studio is a modern analysis software, that allows monitoring, testing and analyzing data
traffic either in a CAN bus or in a LIN bus system or in both bus systems in parallel. In addition,
message generation and sending is supported as well. It is an easy to handle user software based on
an intuitive usage concept. The OptoLyzer Studio can operate with different hardware interfaces. The
software offers both on- and offline analysis of the supported bus systems.
There is also a free of charge variant of the OptoLyzer Studio available that allows viewing of existing
files without any hardware support.
Files recorded in OptoLyzer Studio (*.olslog) and real network traffic of CAN and LIN bus systems can
serve as data sources.
The user interface of the software is designed according to modern usability guidelines including MDI,
docking and ribbons and various customization possibilities inclusive simplified drag & drop
functionality across different windows within the OptoLyzer Studio whenever it make sense.
The OptoLyzer Studio offers the appropriate function for each use case, basic but powerful functions
for beginners and detailed and individual functions for advanced users.
2015 K2L GmbH & Co. KG
11
USER’S GUIDE
60001370A
OptoLyzer Studio
2.1
2.2
Features
Monitoring support of CAN and LIN bus systems
Unlimited size of log files depending on PC hardware
Support of online and offline analysis and verification
Visualization of each message property
Multiple hardware support
Configuration of connected hardware interfaces
Powerful and flexible filtering
Graphical representation of message properties and signal values
Diverse zoom features in a Graph to focus on interesting message series
Recording of CAN and LIN messages
Message generation for CAN and LIN bus systems
Smart GUI customization according to user's preferences
Sustainable expandability
— 3rd party -, new Microchip -, new K2L hardware
— Additional bus systems and protocols
— Envelope/body concept
— Log file formats
— Catalogs/description formats
PC System Requirements
The following environment (minimum) is recommended for installation:
1. Dual core processor with at least 2.66 GHz
2. 4 GByte RAM
3. 1 GByte free disk space (additional storage for recording required)
4. Network access for e.g., downloading the software, activation the license
5. USB2.0 High Speed for connecting a CBA and/or OptoLyzer MOCCA devices
6. Windows 7 (64 bits), Windows 8 and Windows 8.1 operating system
60001370A
12
USER’S GUIDE
2015 K2L GmbH & Co. KG
OptoLyzer Studio
Chapter 3
Installation
This chapter describes the steps how to install the OptoLyzer Studio. Three use cases can be
distinguished.
1. You have purchased the OptoLyzer Studio together with a hardware. In this case the software is
provided on a CD. The installation is described below starting in Section 3.1.
2. You have purchased the OptoLyzer Studio only, i.e., without a hardware. In this case the software
has to be downloaded from our web site: http://www.K2L.de. To follow the installation steps below
(starting with Section 3.1) you have to execute the following preparation steps:
a.
Enter http://www.K2L.de in a browser.
b.
Navigate to Products and then to Solutions.
c.
Select OptoLyzer Studio and switch to the Downloads section.
d.
Download the OptoLyzer Studio software and unzip the file on your hard drive.
3. You have downloaded the OptoLyzer Studio from our web site: http://www.K2L.de for viewing and
test purposes. In this case the installation will follow the same procedure as for 2. including the
preparation steps a. to d. but without activating a license. As a consequence the OptoLyzer Studio
is running as a free of charge version and allows only viewing of files (OptoLyzer Studio Lite
Edition).
3.1
Check the System Type of the Operating System
There are two installers:
OptoLyzerStudioSetup_x86.msi: This installer is designated to be installed on a 32-bit operating
system (OS).
OptoLyzerStudioSetup_x64.msi: This installer is designated to be installed on a 64-bit operating
system.
To install the proper version of the OptoLyzer Studio the system type of the operating system (OS) has
to be known. To check the type of the OS follow these steps (described for Windows 7):
3.2
Click on the Start button.
Right-click on Computer and select Properties.
View System Type and check whether you are using a 32-bit OS or a 64-bit OS.
Installation of the OptoLyzer Studio
1. Login in as a user with administrator rights on the PC or Laptop.
2. Navigate to the source of the OptoLyzer Studio. There are two possibilities:
If you got a CD within your shipment: Insert the OptoLyzer Studio CD in a CD drive of the PC
and navigate to the installation folder.
If you have downloaded the software: Navigate to the folder the downloaded software is stored.
3. Depending on which system type of the OS you are using (see Section 3.1), double-click either
OptoLyzerStudioSetup_x86.msi or OptoLyzerStudioSetup_x64.msi.
4. Install it on the PC. Follow the instructions.
5. Remove the CD if necessary.
2015 K2L GmbH & Co. KG
13
USER’S GUIDE
60001370A
OptoLyzer Studio
3.3
Licensing
In order to access all functions of the OptoLyzer Studio a license key has to be activated. There are
two methods to activate the license:
3.3.1
Dongle license named CmDongle in the following sections. The license is kept on a CmDongle
and can be used on several PCs by plugging the CmDongle in the respective PC.
PC license named CmActLicense in the following sections. The license is associated with some
properties of a PC to which the license was transferred.
Activate a License Online
Follow the steps below for activating a license:
1. Plug the CmDongle in an USB port of the PC. This hardware dongle is part of the shipment. The
operating system installs the corresponding device drivers.
You can skip this step if you ordered a PC license (CmActLicense).
2. Start OptoLyzer Studio, i.e., click ‘Start | Programs | K2L | OptoLyzer Studio | OptoLyzer Studio’.
3. Click File in the menu bar and select Options. The Options window opens.
4. In the left panel of the Options window select License. The right part of the window shows
information about the licensing and a License Central link.
5. Click License Central (alternatively enter http://www.k2l.de/license-central in a browser). The
CodeMeter License Central WebDepot webpage opens. This webpage allows entering and
maintaining the licenses of the OptoLyzer Studio editions.
Figure 3.1 Add Ticket
6. Enter your ticket in this form (1) and click Next (2). The ticket has been provided after purchasing
OptoLyzer Studio together with a CmDongle (known previously as hardware dongle).
Notes: If you don’t have a ticket, contact [email protected].
60001370A
14
USER’S GUIDE
2015 K2L GmbH & Co. KG
OptoLyzer Studio
Figure 3.2 Activate Licenses - Example
7. Another window opens that provides an overview about activated CmContainers (a container
holds a license) (a) and available CmContainers (b). In addition, the window informs about which
OptoLyzer Studio Edition refers to a ticket. In the example in Figure 3.2 one CmContainer has
been activated, another one is still available. Click Activate Licenses (3).
Figure 3.3 Select Kind of License
In the next window it has to be specified either to bind the license to a dongle or to a computer. It
depends on what has been purchased.
Binding to a dongle (CmDongle) means that the license is fully transferred into a dongle. The
license can be used on different PCs.
Binding to a PC (CmActLicense) means that the license is transferred to a PC.
8. Click either the CmDongle (4a) icon or the CmActLicense (4b) icon.
2015 K2L GmbH & Co. KG
15
USER’S GUIDE
60001370A
OptoLyzer Studio
Figure 3.4 Select CmContainer - Example
The figure above depicts the window for the CmDongle on the left side and the window for the
CmActLicense on the right side. In addition, you can show other licenses in the ticket (d) or switch
back to the binding selection (e) or to My Licenses (f).
9. - For the CmDongle click the arrow in the drop-down box and select a CmContainer (5a). If no
CmContainers are visible, the button next to the drop-down box allows to refresh the view (c).
After selecting the CmContainer of interest click Activate Selected Licenses Now (6).
- For the PC license no Container has to be selected, as the Container is automatically transferred
(5b) when pressing the button below. To proceed click Activate Selected Licenses Now (6).
Figure 3.5 Online License Transfer
10. An online license transfer starts that may not be stopped. Follow the instructions in the window,
i.e., wait till transfer ends. A second window opens afterwards.
60001370A
16
USER’S GUIDE
2015 K2L GmbH & Co. KG
OptoLyzer Studio
Figure 3.6 Online License Transfer Succeeded
11. Click OK to complete activating the license. If another license is available, it can be activated in
the same way as described above.
Figure 3.7 Activate Another License If Available - Example
12. Click File in the menu bar of the OptoLyzer Studio and select Options. The Options window opens.
13. Select License in the Options window.
Figure 3.8 Activate License in License Tab - Example
The activated license is visible in the license window. The license itself can be controlled in the
CodeMeter Control Center when clicking Edit in the window.
2015 K2L GmbH & Co. KG
17
USER’S GUIDE
60001370A
OptoLyzer Studio
3.4
Hardware Preparation
3.4.1
OptoLyzer MOCCA Device
3.4.1.1
Flasher Software
Flasher software must be installed when the firmware (like CPU, FPGA,...) must be updated in the
OptoLyzer MOCCA compact. Follow these steps:
1. Remove all existing K2L Flasher installations on the PC.
2. Click Install K2L Flasher V6.0.X to run the installer. It can be found on the CD or on the K2L
website (web site: http://www.K2L.de).
3. Select Next and follow the instructions. The software will be installed in Program Files/K2L.
3.4.1.2
OptoLyzer MOCCA Device Software Update
After the Flasher software is installed the firmware can be flashed.
1. Go to the Start menu and select All Programs | K2L | K2L.Flasher | K2L Flasher. The Flasher
software starts.
2. OptoLyzer MOCCA device needs to be in Flash mode. That could be done in two ways:
a.
By clicking link on the flasher Try to set the device into Flash mode by software.
b.
By pressing the Program Reset button for about two seconds, until the 'OP' LED shows red.
When releasing the button, the 'Active' LED must blink very quickly.
3. Click Select File to select the proper firmware flasher file: Browse the CD and select the following
file (where XX represents the current version on the CD):
C:\Program Files (x86)\K2L\OptoLyzer Studio\Firmware\OptoLyzer MOCCA\ABIV04.08.XX.mca
4. Click Flash Hardware to run the process. Do not interrupt flashing!
Flashing is done when the relay of the OptoLyzer MOCCA device stops toggling. In addition, the
software shows the progress and the flashing result: Passed (all software packages do present a
green check mark).
Notes: If the process does not start correctly, close the K2L Flasher software, cycle power on the
OptoLyzer MOCCA device and unplug/connect the USB cable. Restart the K2L Flasher
software. Afterwards click Flash.
5. After flashing close the Flasher software, cycle power on the OptoLyzer MOCCA device and
unplug/plug the USB cable.
3.4.2
CAN Bus Analyzer
Microchip’s CAN Bus Analyzer is ready for run and does not need an update.
60001370A
18
USER’S GUIDE
2015 K2L GmbH & Co. KG
OptoLyzer Studio
3.5
Connection Diagram for Online Viewing
Online viewing requires that at least one of the supported hardware devices (Section 1.2.2, "OptoLyzer
Studio and Hardware," on page 8) is available and connected to the PC on which the OptoLyzer Studio
is running.
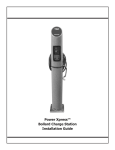
3.5.1
OptoLyzer Studio Used in Combination with OptoLyzer MOCCA Device
A principle connection diagram is shown below. The devices’ power supply (PC, monitor, OptoLyzer
MOCCA device and DUT) have been omitted in the diagram.
PC
USB
Opto
Lyze ®
r M
C US
TOM
ER
OCC
A De
vice
Term
inati
CAN on
DUT
LIN
Figure 3.9 Connection Diagram when Used with OptoLyzer MOCCA Device
Follow these steps to connect the OptoLyzer Studio properly when using in combination with an
OptoLyzer MOCCA device (Section 1.2.2, "OptoLyzer Studio and Hardware," on page 8).
1. Connect the OptoLyzer MOCCA device via the delivered USB cable to the PC on which the
OptoLyzer Studio is running. The respective USB driver has been installed together with the
OptoLyzer Studio.
2. Connect the OptoLyzer MOCCA device to the CAN bus respectively to the LIN bus. For details
about how to connect the bus systems refer to [1].
Notes: Keep in mind to use a termination impedance when connecting the CAN bus to the OptoLyzer
MOCCA device. The termination impedance is not part of the shipment and has to be
provided at customer side.
3. Connect the DUT to the CAN bus respectively to the LIN bus.
Notes: In opposite to the Figure 3.9 it is also possible to have two DUT devices on customer side,
one of them is connected to the CAN bus and the other one is connected to the LIN bus.
4. Power all devices.
The system is ready to be viewed and analyzed.
2015 K2L GmbH & Co. KG
19
USER’S GUIDE
60001370A
OptoLyzer Studio
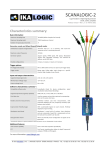
3.5.2
OptoLyzer Studio Used in Combination with CAN Bus Analyzer
A principle connection diagram is shown below. The devices’ power supply (PC, monitor and DUT)
have been omitted in the diagram. The CAN Bus Analyzer is powered via the USB connection.
PC
C US
TOM
ER
CAN
BUS
Anal
yzer
2
R
E
G
C
A
N
7
$
1
P
G
N
D
9
U
S
%
B
T
R
IG
U
S
B
U S
S TA
B T
B U
U S
S
Y
O
W
E
R
B
U
S
A
n
a
ly
ze
r
C
A
N
T
X
C
A
N
C ER
A R
N
R
X
USB
DUT
CAN
Figure 3.10 Connection Diagram when Used with CAN Bus Analyzer
Follow these steps to connect the OptoLyzer Studio properly when using in combination with a CAN
Bus Analyzer.
1. Connect the CAN Bus Analyzer via the delivered USB cable to the PC on which the OptoLyzer
Studio is running. The respective USB driver has been installed together with the OptoLyzer Studio.
The last version is part of the installation package but can also be downloaded from
http://www.microchip.com/. Then follow these steps:
a.
In the Applications area search for CAN and select it.
b.
Select Development Tools.
c.
Search for CAN Bus Analyzer Tool and select it.
d.
Download the last software version of the CAN BUS Analyzer Installer.
2. Connect the CAN Bus Analyzer to the CAN bus. For details about how to connect the bus systems
refer to [2].
3. Connect the DUT to the CAN bus.
4. Power all devices.
The system is ready to be viewed and analyzed.
60001370A
20
USER’S GUIDE
2015 K2L GmbH & Co. KG
OptoLyzer Studio
Chapter 4
4.1
Used Environment and General Hints
Used Environment for Guided Tours
The following chapter describes some basic steps how to work with the OptoLyzer Studio. To show
somehow realistic data an example environment is set up that shows an OptoLyzer MOCCA CLF, a
micro controller and an engine. The OptoLyzer MOCCA CLF and the micro controller are connected
via a CAN bus system or a LIN bus system. The micro controller controls the speed of the engine,
i.e., in the example the engine is running at a constant speed. The OptoLyzer MOCCA CLF itself is
connected to a PC via USB cable. OptoLyzer Studio is running on the PC. This example requires the
OptoLyzer Studio Foundation CL Edition.
Figure 4.1 Example Environment
2015 K2L GmbH & Co. KG
21
USER’S GUIDE
60001370A
OptoLyzer Studio
4.2
Good to Know Before Starting
1. It is recommended to plug the CmDongle into a USB port of the PC before starting the OptoLyzer
Studio.
2. The OptoLyzer Studio offers a combination of a traditional menu bar (menu item File) with a ribbon
(items Home, View etc) in addition to a lot of tool windows. Depending on the context the ribbon
changes and the items in the File menu change their functionality in a context-sensitive manner.
For example Save (Click File | Save) can save a workspace, a log file or a filter configuration
depending on which window has the focus (in the example either focus on workspace window, on
trace window or on filter window).
3. The OptoLyzer Studio provides two types of windows: tool windows and document windows.
a.
Tool windows are child windows which provide a view to an object or an aspect of an object.
An object here could be some settings, a workspace item, a configuration, a device state and
so on. If tool windows are closed, they are hidden.
Tool windows are listed in ribbon View. Click on the View button to show or activate a tool
window: Workspace, Device Manager, Description, Disassembly, Hex View, Bit View, System
Info, Error & Warnings.
b.
Document windows are child windows which provide a view to data (a document), which can
be loaded from a file and stored to a file (catalog file, log file, etc.). If document windows are
closed without saving, changes are lost. If document windows are deleted (no shortcut
available), e.g., in the workspace, they are deleted from the hard disk. If you want to remove
a file from the workspace but don't want to lose the data of the file, select Exclude from
Workspace in the context menu. This item removes the files from the workspace but keeps
the files stored on the hard disk.
Document windows are Catalog, Trace, user defined Filter files or user defined Activity files.
4. The OptoLyzer Studio provides a lot of tool tips. Keep in mind that hovering over an icon or function
shows tool tips. They describe the functions in a short manner and help when working with the
application.
60001370A
22
USER’S GUIDE
2015 K2L GmbH & Co. KG
OptoLyzer Studio
Chapter 5
Guided Tour through Trace View - Monitor Messages
The chapter below describes:
5.1
the first steps how to start the OptoLyzer Studio
how devices are prepared for online monitoring (only first steps)
the benefit of using a Catalog
some remarks about the Workspace
general use of a Trace View
Start the OptoLyzer Studio for the First Time
Follow the steps below:
1. Click “Start | Programs | K2L | OptoLyzer Studio | OptoLyzer Studio”.
Figure 5.1 OptoLyzer Studio - First Start
The graphical user interface of the OptoLyzer Studio shows the following areas:
Quick Access Toolbar: For details refer to Section 10.1, "Quick Access Toolbar," on page 100.
File Application Menu and Ribbon Tab Groups. For details refer to Section 10.2, "File Application
Menu and Ribbon Tab Groups," on page 101.
Ribbon Tabs: The items change according to the selected window (Section 10.2, "File Application
Menu and Ribbon Tab Groups," on page 101).
Workspace: For details refer to Section 10.3, "Workspace," on page 104.
Display Area for Tools. The Trace View will be opened in this area by default (but can be
customized as desired).
2015 K2L GmbH & Co. KG
23
USER’S GUIDE
60001370A
OptoLyzer Studio
Figure 5.2 Check for Connected Devices
2. Click View (1) in the ribbon (Figure 5.2) to check in a next step whether a supported device is
connected or not. The View ribbon shows all tools that are provided within the OptoLyzer Studio.
3. Click Device Manager (2).
60001370A
24
USER’S GUIDE
2015 K2L GmbH & Co. KG
OptoLyzer Studio
Figure 5.3 View Connected Devices in Device Manager
A window opens (Figure 5.3) that is the central point for the configuration of the connected devices
(different icons for connected devices and disconnected devices) inclusive the properties of the bus
systems which can be accessed by those devices (3). The name and the type of the device is shown
(and can be changed if desired: just insert the new name behind the device icon and click Enter). In
our example an OptoLyzer MOCCA CLF is connected. If several devices are connected, each of them
will be shown in a separate branch. Each channel of a device is presented in its specific branch.
4. Click Twinkle (4) to be sure the proper device is shown. The Active LED of the OptoLyzer MOCCA
CLF twinkles.
5. Drag and drop the window (5) and enlarge the window.
6. Click the small triangles (6) in front of the device and the CAN bus system to view the details. In
our example environment the Bit Rate of CAN 1 has to be adjusted as the test environment is
using a bit rate of 250 kbit/s on channel 1 that is different from the default value (500 kbit/s).
Therefore click the Bit Rate drop-down box of CAN 1 (7) and select the bit rate as desired (250
kbit/s).
7. Close Device Manager, i.e., click the Close button. (This step is optional just to keep the focus
on the next step.)
Figure 5.4 Start Online Monitoring
8. Switch back to Home and click Start (8), or simply press the F5 key. This starts online monitoring
of the traffic transmitted over the bus systems that are supported by the connected devices.
2015 K2L GmbH & Co. KG
25
USER’S GUIDE
60001370A
OptoLyzer Studio
Figure 5.5 Online Monitoring
The monitored messages are shown in a Trace View (a) (Figure 5.5). The name of the Trace View
starts with ‘online’ and is extended by the time stamp that states the start of the online monitoring. The
Trace View presents the messages in a table whereby one row represents one message. The columns
represent the message properties. The title of the column is similar to the name of the message
property. A column is assigned to exactly one property of a single message type. If a message type
does not support a column, the cell of the column of that message row remains empty. The user can
select a message. A selected message is highlighted. Other tools are able to retrieve the selected
message, for example to display details of that message (Section 9.1, "Disassembly," on page 90).
Together with the Trace View the Trace ribbon (b) is shown. This ribbon is an additional ribbon that is
also indicated as Split window (c) in the title bar. The ribbon tab provides access to all functions that
are available for the Trace View. Important functions will be touched within this tour below. A Split
window indicates that the log file can be split, e.g., either vertical or horizontal (d), i.e., two windows
show data both referring to the same source. Other split functions will be handled later on (Section
7.1, "Start Graph," on page 57).
In a next step (before focusing on the Trace View) a Catalog is loaded. A Catalog helps interpreting
the data in a Trace View. Catalog files have to be created externally. Some details are mentioned in
Section 10.3.1, "Catalogs," on page 104.
Notes: It is not a must to add a Catalog but helps presenting data in a user-friendly way.
60001370A
26
USER’S GUIDE
2015 K2L GmbH & Co. KG
OptoLyzer Studio
Figure 5.6 Load CAN Catalog
9. In the Workspace window select Catalog (9), right-click to open the context menu, select Add and
then select CAN Catalog. A dialog box opens.
2015 K2L GmbH & Co. KG
27
USER’S GUIDE
60001370A
OptoLyzer Studio
Figure 5.7 Online Monitoring after Loading a Catalog
10. Navigate to the location where the Catalog you want to use is stored. Catalogs can have file
extension *.dbc or *.xml. Select the CAN Catalog of interest and click Open in the dialog box. The
Catalog is stored in the folder Catalog (e). In this example a Catalog file ‘MotorControlDemo.dbc’
is loaded. It has been created for the example environment and has to be replaced by a customer
file matching to their needs. As soon as the Catalog is loaded parts of data is interpreted as
specified in the Catalog. Figure 5.7 shows an example in column Summary (f). Have a look on the
column in Figure 5.5 and Figure 5.7.
11. To focus on the Trace View perform the following two optional steps: Click the Maximize button
(10) in the OptoLyzer Studio and the Close button (11) in the Workspace tool. As mentioned
before the Workspace can be reopened in the View ribbon without losing information.
60001370A
28
USER’S GUIDE
2015 K2L GmbH & Co. KG
OptoLyzer Studio
Figure 5.8 Focusing on Trace View
The Trace View displays messages, the status bar (g) shows how many messages are shown. The
first value counts the filtered messages, the second value shows the total message count. Because of
filters there might be a discrepancy. In the example above (Figure 5.8) there are no filters active (last
number combined with disabled filter symbol).
When a Trace View is opened a default layout is used. This default layout covers specific properties
that are matching to all supported bus systems although the property names may differ slightly among
the bus systems. The most important properties are arranged to the left of a fixed style operator (h),
others to the right. The fixed style operator is indicated by a broader strip compared to other property
borders. Columns to the left of it will not be scrolled horizontally (default setting). Properties of interest
can be moved (just drag the respective header of the column and move it to the place you want (i))
to the left of the fixed style operator. This helps keeping the focus on details while scrolling other values
horizontally.
12. To optimize the presentation of data content, header and column width click Best Fit All (12).
2015 K2L GmbH & Co. KG
29
USER’S GUIDE
60001370A
OptoLyzer Studio
Figure 5.9 Focusing on Trace View Content
The Trace View shows all messages of all connected devices and supported bus systems. An index
field (j) identifies a message and shows its position within the Trace View. A message has always the
same index. If some messages do not meet filtering criteria, then there will be gaps in Index column
values.
Notes: If Filters are activated, it might be messages are blocked and thus there might be gaps in the
order of index values.
To help identifying the messages each message type has its own color code (k). Hover over the
column headings (l) to view the tool tips for the properties.
13. Click the small triangle (13) in front of a message to expand a Detail View. This Detail View
contains tabs to access the properties that are displayed as a list. The Data Frame tab shows all
properties of a message that can be interpreted without a Catalog or if the message cannot be
assigned to a Catalog entry. The Signal tab shows the data part interpreted by a Catalog. If the
Catalog is missing a Body tab provides the raw data as is, i.e., without any interpretation
(Figure 5.10). All properties in the tabs are displayed in three content variants:
Table 5.1 Value Variants
Value Variant
Description
Value
This raw value is transmitted over the bus system.
Display Value
This value is able to present the value in a user-friendly way as it uses both the
Hexadecimal Integers settings and the Symbolic Names settings that are provided in the
Catalog. Refer to the View ribbon and click the toggle buttons Hexadecimal Integers and
Symbolic Names as desired (shown in Figure 5.3).
Calculated Value
This value is calculated according to meta information in Catalogs.
60001370A
30
USER’S GUIDE
2015 K2L GmbH & Co. KG
OptoLyzer Studio
A unit is presented if it is available for the value. A Detail View can be opened for each arbitrary
message, i.e., more than one Detail View can be displayed in a Trace View. Thus it is easy to compare
the values of messages.
Figure 5.10 Detail View Body and Signal
14. A ribbon entry allows the user to close all Detail Views with a single click. Refer to the Trace ribbon
and click Collapse All as shown in Figure 5.9 (14).
In the next steps the content within the Trace View will be modified (i.e., properties will be hidden and
added).
15. Select the Data property and drag the column down into the window as shown in Figure 5.9 (15)
and drop it. The column is hidden.
2015 K2L GmbH & Co. KG
31
USER’S GUIDE
60001370A
OptoLyzer Studio
Figure 5.11 Adding Columns
16. To add a property (e.g., the hidden Data property in this example) click Column Chooser (16).
The Column Chooser opens. Click onto the small triangle in front of CAN and then click the
triangle in front of Data Frame (why Data Frame: because Data is a property of a CAN Data Frame
refer to (m) in Figure 5.11) and scroll down till Data is displayed (17). Drag & drop Data into the
header of the Trace View window (18). Click Close (19) to close the Column Chooser. Each
property of a supported message can be added in the same way.
17. Hover over the Mode buttons (20) to view the tool tips, then click the Auto Scroll button in
Figure 5.11, view the incoming messages and how they scroll through the window. Afterwards click
the Fixed Position Trace button (20).
Figure 5.12 Example of a Fixed Position Trace View
The Fixed Position Trace shows the last message for each group (refer to Table 5.2) that has been
received by the OptoLyzer Studio. In the example below (Figure 5.12) there are three different
messages recognized. The two CAN Data Frame message types differ in their IDs and therefore two
lines are added. The amount of the different messages is counted and shown for each group.
60001370A
32
USER’S GUIDE
2015 K2L GmbH & Co. KG
OptoLyzer Studio
Viewing is possible in three modes:
Table 5.2 Available Modes
Mode
Icon
Description
Auto Scroll
All incoming messages are displayed at the bottom of the Trace View. As much
messages as possible are shown in the Trace View. The amount of messages that are
currently visible depends on the size of the window. There is no vertical scroll bar. This
mode is only available in online viewing mode, i.e., if Start is clicked in the Home
ribbon. This mode can be selected to check whether new messages are incoming or
not. Auto Scroll is set by default if messages are online received.
Normal
Scroll
(Default)
All incoming messages are attached at the end of the log file that is at the bottom of
the window. There is a vertical scroll bar. This mode is set by default, if log files are
viewed offline. It can be used to view messages in detail (values, data and time stamp
comparison).
Fixed
Position
Trace
A Trace View can be set to Fixed Position mode. In this mode, incoming messages are
not automatically entered at the bottom of the trace list. If there is already a line in the
Trace View with a message of the same group (i.e., for each message type and different
IDs) the content of that line will be updated with the properties of the latest message.
If such a line does not exist already, a new line is added to the Trace View (if the filter
settings allow this). This mode is available in online and offline mode.
Messages belong to the same group if:
They are received on the same channel (implying also on the same device).
They belong to the same message type.
CAN:
They have the same CAN ID.
They have the same value of the Extended flag (11 bit/29 bit identifier).
LIN:
They have the same ID.
18. To explain the different time stamp functions click the Normal Scroll button (20) in Figure 5.11. By
default the Absolute time stamp is set, i.e., is showing absolute values for the time for each
message. In the following windows the Workspace window has been opened again. It will be used
when the log file is stored and assigned to the workspace. This can be done by selecting the View
ribbon and clicking Workspace. Then switch back to the Trace ribbon.
2015 K2L GmbH & Co. KG
33
USER’S GUIDE
60001370A
OptoLyzer Studio
Figure 5.13 Using Time Stamp Functions 1
19. Click Difference time stamp (21) (Figure 5.13) to view the time intervals between the single
messages. Use this mode, e.g., to estimate how long a message sequence takes to complete and
for general comparison purposes if you want to have the first message as reference in the trace
view.
20. Select a message in the trace view (the selected message is highlighted) and click the Set
Reference button (22). The selected message is set as a reference. A small reference icon is
added in front of the message in the trace view (n).
60001370A
34
USER’S GUIDE
2015 K2L GmbH & Co. KG
OptoLyzer Studio
Figure 5.14 Using Time Stamp Functions 2
21. Then click the Relative time stamp (23) (Figure 5.14) to show the time intervals to prior and
following messages (o). Use this mode, e.g., to estimate how long it takes to reply to a message
and for general comparison purposes if you want to have the selected message as reference. To
change the reference just select another message and then click the Set Reference button.
The table below provides a short overview about the different modes.
Table 5.3 Available Modes
Time Stamp
Mode
Icon
Description
Absolute
The time is displayed as absolute value (13:50:45.015.350).
Difference
The displayed value represents the time interval between the reception of the
previous visible message and the current one (00:00:00.000.476). The first
message has the value 00:00:00.000.000.
Relative
The displayed value represents the time interval between the reception of the
current message and a reference message (00:00:00.000.476). The reference
message has the value 00:00:00.000.000. Older messages than the reference
messages have negative values.
As last step the log file is stored in a workspace.
22. As long as online data is received a log file cannot be stored. Therefore click Stop (24) in the Trace
ribbon. This stops online viewing. To don’t lose the content of the trace view click File (25) in the
Application menu and select Save As. A dialog window opens. Specify the name of the file and
the location as desired. Alternatively use the suggested default name that starts with ‘online’ and
is extended by the time indicating the start of the online viewing. File extension will be *.olslog.
Click Save in the dialog box.
2015 K2L GmbH & Co. KG
35
USER’S GUIDE
60001370A
OptoLyzer Studio
Figure 5.15 Example of a Stored and not Stored Online Trace
The name of the file inclusive its extension will be shown in the Trace View tab (26). The extension is
missing in online Trace Views that are not stored. Hover over other online files (27).
Figure 5.16 Assign Log File to Workspace
23. As soon as a log file is stored it can be assigned to a Workspace. The Workspace is the place
where all data is stored that refers to it. Hover the mouse over the caption of the stored trace (28)
and right-click to open the context menu. Select Add to Workspace (29) (Figure 5.16).
The log file is assigned to the Workspace but not to Logs (i.e., a folder that can be seen as an
administrative structure to organize the log files belonging to a Workspace).
Figure 5.17 Drag and Drop Log File within Workspace
24. Select the log file and drag it to Logs (30) and drop it (p). Till now New Workspace is not stored
indicated by an asterisk.
25. Select New Workspace* (31) and click File in the application menu and Save Workspace As.
60001370A
36
USER’S GUIDE
2015 K2L GmbH & Co. KG
OptoLyzer Studio
Figure 5.18 Stored Workspace
26. A dialog window opens. Specify the name of the workspace and the location as desired, e.g., in
the example CAN_Demo_Documentation (q). The Workspace will be stored with file extension
*.olsworkspace.
27. Close OptoLyzer Studio.
2015 K2L GmbH & Co. KG
37
USER’S GUIDE
60001370A
OptoLyzer Studio
Chapter 6
Guided Tour through Activity - Send a Message
The OptoLyzer Studio supports generation of messages and is able to send messages to the bus
systems. This functionality is provided in the tool Activity. This chapter describes how ‘to program’ a
small sample that supports both generation and sending of messages. The sample below is using the
same example environment as described in Figure 4.1 Example Environment on page 21, i.e., an
OptoLyzer MOCCA device has to be connected.
6.1
Start Activity Tool
1. Start OptoLyzer Studio.
Figure 6.1 Load Workspace from Recent List
2. Click File (1) in the application menu (Figure 6.1) and select the workspace from the Recent
Documents list CAN_Demo_Documentation that has been created in Chapter 5. If a dialog box
opens where you are asked whether you want to save a workspace or not, decide as desired. The
selected workspace is loaded inclusive the respective Catalog and the saved log file.
60001370A
38
USER’S GUIDE
2015 K2L GmbH & Co. KG
OptoLyzer Studio
Figure 6.2 Create an Activity
3. In the workspace window select Activities, right-click, select New and Activity File (2). A dialog
box opens where you have to specify name and path of the new Activity. In this example the file
name ‘Speed_Change’ is specified. Default file extension will be *.olsactivity. Finally click Save in
the dialog box. An activity file Speed_Change.olsactivity is added in the folder Activities
(Figure 6.2).
Figure 6.3 Activity Ribbon - Add Empty Activity
Together with an empty Activity window the Activity ribbon is shown. This ribbon is an additional
ribbon, i.e., it is only shown if the Activity window has the focus. The ribbon tab provides access to all
functions that are available for the Activity. Important functions will be touched within this tour below,
others are described in Section 10.3.5, "Activities," on page 107.
The target for the next steps will be to add a sequence of messages in which first the speed of the
engine will be accelerated (Figure 4.1 on page 21), then this speed is kept for a while and then the
speed is reduced. This sequence shall be embedded in a loop.
OptoLyzer Studio provides several methods to approach this target. There are predefined functions
ready to be used partly already including the loop functionality. However, the first steps will be done
from scratch to show how to work inside Activity tool, later on predefined functions will be added.
4. Click Activity (3) in the Activity ribbon.
2015 K2L GmbH & Co. KG
39
USER’S GUIDE
60001370A
OptoLyzer Studio
Figure 6.4 Activity - Select Send Message
5. A document template is added. The template shows some elements that are called in its entirety
Activity (a). An asterisk (b) indicates a changed Activity file and that its current content is not
stored. To get a proper message the elements functioning as placeholders have to be customized.
In a first step the device that sends a message and the message type itself have to be specified.
Therefore click the triangle in front of Empty Action.
6. Select Send Message (4).
60001370A
40
USER’S GUIDE
2015 K2L GmbH & Co. KG
OptoLyzer Studio
Figure 6.5 Activity - View Tool Tip
7. The elements in the document change. A yellow exclamation mark indicates that there is
something missing or wrong. Hover over the icon to view the tool tip (5). The tool tip mentions
that no channel, i.e., no device is specified right now. The red rectangle (c) indicates the place
where information is missing.
2015 K2L GmbH & Co. KG
41
USER’S GUIDE
60001370A
OptoLyzer Studio
Figure 6.6 Activity - Select Device and Channel
8. Click the drop-down box (6) in the red rectangle to select the device and the channel which shall
be used. In our example Device 0 and Channel 1 are selected that has been identified in
Figure 5.3 View Connected Devices in Device Manager on page 25.
60001370A
42
USER’S GUIDE
2015 K2L GmbH & Co. KG
OptoLyzer Studio
Figure 6.7 Activity - Specify Message Type
9. Immediately after selecting device and channel, the Send button (c) will be enabled. Now the
message type has to be specified. Click the triangle behind Type to open the drop-down box and
select CAN Data Message (7) in our example as the data shall be sent without a specific request.
2015 K2L GmbH & Co. KG
43
USER’S GUIDE
60001370A
OptoLyzer Studio
Figure 6.8 Activity - Specify CAN ID
The basic elements of a CAN Data Frame are inserted by default.
A red rectangle shows that information is still missing: The CAN ID, i.e., do we want to use a Control
or a Status message has to be specified.
10. Click Ctrl + Space to get a proposal list (8). The proposal list including Control and Status
information base on the definitions done in the Catalog. (If no Catalog is loaded, there is no
proposal list. Then just type in values that make sense.) Click the Cursor key down and select
Control. Press Enter (Alternatively double-click the selection).
Notes: General procedure when adding the CAN ID (keep in mind that the frame properties are
specified in the Catalog): Concatenated CAN IDs are completed in the same way as it is wellknown from other modern programming languages (as e.g., the context aware code
completion in Visual Studio) and is known as IntelliSense.
The number 16 highlighted in blue (d) indicates that numbers are interpreted as hexadecimal
numbers when inserted manually (Figure 5.3 View Connected Devices in Device Manager on
page 25).
60001370A
44
USER’S GUIDE
2015 K2L GmbH & Co. KG
OptoLyzer Studio
Figure 6.9 Activity - Switch to Signal Tab
11. The message is completed. In a next step details of the CAN Data Frame can be specified that
shall be changed and send to the engine. Therefore switch to the Signal tab (9).
2015 K2L GmbH & Co. KG
45
USER’S GUIDE
60001370A
OptoLyzer Studio
Figure 6.10 Activity - Signal Tab
The signal tab shows specific data of a message. The data is interpreted and presented as signals
according to the specification in the Catalog MotorControlDemo.dbc. In this example the send
message includes two signals. The first signal Set Rotation Speed (d) controls the speed of the
engine. The second signal LED D17 (e) controls a LED on the CAN/LIN micro controller (Figure 4.1
Example Environment on page 21).
Figure 6.11 Activity - Specify Speed
12. Click into the input field and enter a speed, e.g., 5150 (10) in the example to change the rotation
speed of the engine. The number icon (f) to the right of the input field is showing 16 meaning that
manually inserted numbers are interpreted as hexadecimal numbers. Let the other parameters
(Extended and DLC) and signal LED D17 unchanged.
60001370A
46
USER’S GUIDE
2015 K2L GmbH & Co. KG
OptoLyzer Studio
Figure 6.12 Activity - Specify the Name of an Activity
13. The next step describes how to add a user friendly name for the activity. Click into the input field
to the right of Send (11), mark Task1 and enter Speed-up and Slow-down.
Figure 6.13 Activity - Insert a Delay Step 1
14. In a next step a delay is added to the Activity that helps to visually follow the entire Activity
procedure when it is started. Click the plus sign as shown above (12). This adds a second task
as Empty Action. This task can be specified as a delay.
2015 K2L GmbH & Co. KG
47
USER’S GUIDE
60001370A
OptoLyzer Studio
Figure 6.14 Activity - Insert a Delay Step 2
15. Therefore click the triangle in front of Empty Action and select Delay (13).
Figure 6.15 Activity - Insert a Delay Step 3
16. After inserting Delay the application identifies that there are more than one action (h) which are
automatically enumerated and will be sequentially executed. They are automatically grouped in a
sequence (i).
17. Click into the input field to the right of Delay, mark the default value 100 and enter 2000 (14) as
value, i.e., the delay will be 2000 ms.
The target of the next steps is to show how to add and customize a predefined message to reduce
the speed of the engine. Afterwards actions will be moved per drag & drop.
Notes: The described steps are not directed straightforward but rather showing how to operate within
the Activity tool.
60001370A
48
USER’S GUIDE
2015 K2L GmbH & Co. KG
OptoLyzer Studio
Figure 6.16 Activity - Insert Send Message from Activity Ribbon
18. Click onto Can Data Frame (15) in the Activity ribbon.
2015 K2L GmbH & Co. KG
49
USER’S GUIDE
60001370A
OptoLyzer Studio
Figure 6.17 Activity - Customize Second Action
19. Another Activity is inserted (named Send CAN Data Frame1). By default the first CAN channel of
the first device is inserted.
Notes: If more devices are available, click onto the small triangle to open the drop-down box and
control whether the desired device and channel are taken.
20. Add the CAN ID (16) as described above, i.e., click Ctrl + Space to show the pop-up list and select
Control. Then double-click (or press Enter). Press Enter a second time.
21. Set the rotation speed to 50 (17).
22. Change the state of LED D17 to Off (18), i.e., click the triangle next to On and select Off in the
drop-down box.
60001370A
50
USER’S GUIDE
2015 K2L GmbH & Co. KG
OptoLyzer Studio
Figure 6.18 Activity - Drag & Drop an Action
23. Select the handle (j) of the last action. Then drag and drop (19) it to the plus sign of the first
activity.
Figure 6.19 Activity - Collapse All
24. In collapsed state (k) (click the respective Collapse All button before) select the handle of the
residual activity (20) and click Delete (21) in the Activity ribbon to focus on the first activity.
2015 K2L GmbH & Co. KG
51
USER’S GUIDE
60001370A
OptoLyzer Studio
Figure 6.20 Activity - Add Loop
25. In expanded state (click the respective Expand All button before) click the plus sign to add a new
action. An Empty Action is added. Click the triangle in front of the Empty Action to open a dropdown box. Select Loop (22).
60001370A
52
USER’S GUIDE
2015 K2L GmbH & Co. KG
OptoLyzer Studio
Figure 6.21 Activity - Drag & Drop an Action into Loop
26. Select the handle of the Action in which the speed is set to 5150. Drag and drop it to the plus
sign in the loop (23).
27. Repeat the step above for the Delay Action and the Action in which the speed is set low to 50.
Figure 6.22 Activity - Copy Delay Action
28. Click the plus sign to add a new action (24). An Empty Action is added. Select the Delay action
and right-click. Select Copy (25).
2015 K2L GmbH & Co. KG
53
USER’S GUIDE
60001370A
OptoLyzer Studio
Figure 6.23 Activity - Delete Empty Action
29. Select the Empty Action and click Paste in the Activity ribbon. A Delay action is inserted. Delete
the remaining Empty Action (26).
30. Click the Save button in the Quick Access Bar to store the Activity file.
31. Click the green Start Logging button in the Quick Access Bar to start an online Trace View.
Figure 6.24 Activity - Start
32. Click the Start (27) button to start this Activity. This button is a toggle button that switches between
Start/Stop.
60001370A
54
USER’S GUIDE
2015 K2L GmbH & Co. KG
OptoLyzer Studio
Figure 6.25 Activity - Green LED Activity Indicator
After starting the Activity a green LED shows which part of the Activity file is active. In the example
the Loop (l) is active and within the loop the first Delay (m) is active.
33. Click the Stop button to stop the Activity.
34. Click
in
the
Workspace
window.
Then
click
File
followed
by
Save
CAN_Demo_Documentation.olsworkspace. The workspace inclusive the Activity file is saved.
35. Close the OptoLyzer Studio.
2015 K2L GmbH & Co. KG
55
USER’S GUIDE
60001370A
OptoLyzer Studio
6.1.1
Using Predefined Activity Templates
OptoLyzer Studio provides beside an Empty Activity template (a) also predefined Activity templates
prepared for the most common use cases.
Figure 6.26 Using Predefined Activity Templates
They allow an accelerated creation of activities without starting and customizing from scratch. These
templates are arranged in the Activity ribbon in the groups New (b) and Send Message (c).
The entire procedure starting with step number 4 in Figure 6.3 Activity Ribbon - Add Empty Activity on
page 39 can be shortened by using these predefined Activity templates. The following steps cover a
brief summary how to proceed instead of those steps.
1. In the Activity ribbon click Cyclic CAN Data Frame. A template is added that includes a Loop and
a Sequence consisting of two actions, a Send Message action (CAN Data Frame) and a Delay
action. By default, the first CAN channel of the first connected device is inserted in the input field
Send to. Check whether the default entry is the desired one. In addition, it is necessary to specify
the CAN ID to complete the customization of the Send Message action. Afterwards adjust the time
in the Delay action. By default 100 ms are specified.
2. Click the plus sign in the Sequence. This adds an Empty Action.
3. Select the handle of the first action in the Sequence (i.e., CAN Data Frame), right-click and select
Copy. Select the handle of the Empty Action in the Sequence, right-click and select Paste.
4. Copy the Delay Action and paste it to the Empty Action as described in step 3.
5. Select the handle of the Empty Action in the Sequence and click Delete in the Activity ribbon
(optional step to keep the things simple).
6. Customize the CAN Data Frame and Delay as mentioned above.
7. Click Start to start and Stop to stop the Activity.
The example Activity is completed and ready for use.
60001370A
56
USER’S GUIDE
2015 K2L GmbH & Co. KG
OptoLyzer Studio
Chapter 7
Guided Tour through Graph - Monitor Signals
The OptoLyzer Studio is able to graphically display the progress of properties of messages as time
line. The powerful zooming and navigation features allow to focus on values of interest. This
functionality is provided in the tool Graph.
The chapter below describes how to open the Graph and how to zoom on interesting values. One
example will show how to measure the timespan of specific values. The sample below is basing on
the same example environment as described in Figure 4.1 Example Environment on page 21. In
addition, it is assumed that the steps described in Chapter 5, "Guided Tour through Trace View Monitor Messages," on page 23 and Chapter 6, "Guided Tour through Activity - Send a Message," on
page 38 have been performed.
7.1
Start Graph
1. Start OptoLyzer Studio.
2. Load the workspace CAN_Demo_Documentation.olsworkspace stored in step 34 in Section 6.1,
"Start Activity Tool," on page 38 (i.e., click File, Open, navigate to the location where the workspace
is stored, select the workspace file and click Open or select it from the recent list).
3. Start an online Trace View (i.e., switch to the Home ribbon and click Start). A Trace View is started.
Figure 7.1 Split Trace View and Show Graph
4. In the Trace ribbon click Best Fit All (1), Show (2) and select Graph (3) in the list.
2015 K2L GmbH & Co. KG
57
USER’S GUIDE
60001370A
OptoLyzer Studio
Figure 7.2 Split Windows - Empty Graph
The original area reserved for the Trace View is now split in a smaller Trace View area (a) and an
empty area that is reserved for the Graph and is showing a hint how to proceed: ‘Drop data object
from Trace View or Disassembly HERE to define a series’ (b).
After splitting the window the Graph ribbon (c) is shown. This ribbon is an additional ribbon, i.e., it is
only present as long as the Graph has the focus. The new ribbon tab provides access to all functions
that are available for the Graph. Important functions will be touched within this tour. Both Split
windows, i.e., Trace View and Graph refer to the same data source.
Properties of interest are mostly arranged in the body of a message (called Payload in OptoLyzer
Studio). If they are specified in a Catalog and the Catalog is loaded, they can be decoded by the
software. Then they are shown as Signals in the OptoLyzer Studio.
In the following steps the property that represents the speed of the engine will be copied to the Graph
and monitored over a time line. Remember that this speed can be modified using the Activity created
in Section 6.1, "Start Activity Tool," on page 38.
60001370A
58
USER’S GUIDE
2015 K2L GmbH & Co. KG
OptoLyzer Studio
Figure 7.3 Drag & Drop a Property to the Graph
5. Select a message in the Trace View. The ribbon tab changes, now showing the Trace ribbon. Click
Payload (4) in the Trace ribbon.
6. Click the small triangle (5) in front of a message to expand a Detail View. Due to Payload is
clicked only Signals are shown (for comparison purposes view Figure 5.10 or click again Payload).
7. Drag & Drop the Signal ActualRotationSpeed to the empty area (6).
Notes: Not all properties of a message are designed to be shown in a Graph (e.g., it makes no sense
to show the time stamp in the Graph (d)).
Drag & Drop is also supported from the Disassembly and from the Trace View, if the signal
was inserted as column.
2015 K2L GmbH & Co. KG
59
USER’S GUIDE
60001370A
OptoLyzer Studio
Figure 7.4 Graph Ribbon and Graph Overview
Now the Signal ActualRotationSpeed is added to the graphical signal view (Graph) (f) and is
presented in a cartesian coordinate system, where the x-axis represents the time, the y-axis the
values. The Signal is added to the Legend (e). The Signal can be unchecked in the Legend.
Unchecking hides the Signal in the Graph. The software automatically assigns a color to the Signal
that helps to identify the Signal if several signals are added to the Graph. Below the graphical signal
view a Timespan is shown (g). The timespan itself is determined by the software and depends on the
number of signals that are received when starting the Graph. It will be kept as long as it will be
manually modified. All values that are received since starting the Graph are shown in an Overview (h)
at the bottom of the graphical signal view. The Timespan above (g) is presented as part of it (i) and
is highlighted in gray. This time interval is called ViewPort (i). ViewPort Handles separate the
ViewPort within the Overview. Both the ViewPort and the single ViewPort Handles can be moved
in the Overview. The figures below depict extracts of the Overview focusing only on the ViewPort
and how it is modified and moved.
Figure 7.5 Extract Graph Overview - Drag ViewPort Handle
8. Move the mouse cursor over the left ViewPort handle (7) and drag it to the left side. The width of
the ViewPort increases (8) as well as the value of the Timespan (g). In addition, more current
values are shown in the Graph (f) however the granularity decreases.
Notes: As soon as the ViewPort Handle is touched, the Autoscroll feature is disabled and the
ViewPort moves in the Overview. Just click Autoscroll in the Graph ribbon to focus on the
latest values.
60001370A
60
USER’S GUIDE
2015 K2L GmbH & Co. KG
OptoLyzer Studio
In the next steps the most important buttons of the Graph ribbon are clicked and explained.
Figure 7.6 Graph Ribbon With Tool Tips
9. Hover over Autoscroll (k) to view the tool tip and click the button to disable the Autoscroll
function. The Graph shows static values, i.e., the snapshot of messages at that time and the
ViewPort moves to the left side in the Overview as long as newer messages are coming in. Click
Autoscroll again. The snapshot of messages at that time and the ViewPort moves to the right
corner in the Overview
10. Hover over Auto-Y (l) to view the tool tip and click the button to disable the function. The y-axis
will keep the current setting. If higher values are received, it might be the maximum value cannot
be viewed. Click Auto-Y again. If enabled, the y-axis will be automatically adjusted according to
the incoming values to show an optimal representation of the incoming values.
11. Hover over Synchronize (m) to view the tool tip. A selected value in the Trace View is shown as
a vertical line in the Graph (highlighted in orange). A new selection in the Trace View changes the
vertical line in the Graph accordingly. Click the button to view the difference in the Graph. Enable
the feature again. If Autoscroll is enabled, click Go to Selected in the Graph ribbon to jump to
the message selected in the Trace View.
12. Hover over Values (n) to view the tool tip. Hover over the Graph and view how the values are
shown. Then click the button to view the different behavior. Click the button again.
13. Hover over Cursor to view the tool tip. Click the button and hover over the Graph. Then click
Cursor again and hover over the Graph. The cross hairs cursor is shown.
Figure 7.7 Graph - Customize View
14. CIick Legend (9) in the Graph ribbon and view how the Legend will be hidden. The Legend is
located above the Graph. Click the button again to show the Legend (default). The signals in a
Legend can also be checked or unchecked and thus shown or hidden in the Graph.
15. Click Timespan (10) in the Graph ribbon and view that the Timespan located between the Graph
and the Overview is hidden. Click the button again to show the Timespan.
2015 K2L GmbH & Co. KG
61
USER’S GUIDE
60001370A
OptoLyzer Studio
16. Click Overview (11) in the Graph ribbon to hide the Overview below the Timespan. Click the
button again.
In the next steps it will be demonstrated how the Graph can be hidden and shown again.
Figure 7.8 Hide and Show Graph per Dragging
17. Click Hide (12) in the Graph ribbon. The Graph will be hidden. The following step is described for
a vertical splitting (i.e., the Vertical Split button (p) is clicked) but can be also performed for a
horizontal splitting.
Figure 7.9 Show Graph by Dragging - Step 1
18. Move the mouse cursor to the top of the Trace View till a double ended arrow is visible (13).
19. Drag this double ended arrow down (14) until enough space is available to show Legend, Graph,
Timespan and Overview (q).
60001370A
62
USER’S GUIDE
2015 K2L GmbH & Co. KG
OptoLyzer Studio
Figure 7.10 Show Graph by Dragging - Step 2
2015 K2L GmbH & Co. KG
63
USER’S GUIDE
60001370A
OptoLyzer Studio
7.1.1
Search and Measure Using the Graph
The Graph can be used to search for spikes or irregularities just by dragging the ViewPort in the
Overview. In addition, the Graph allows a rough time measurement of signals. To show how this can
be done this section uses the example environment described in Figure 4.1 Example Environment on
page 21. The Activity created in Chapter 6 is used to speed up and slow down the engine (i.e., to
create spike signals which will be searched in the example).
1. Start OptoLyzer Studio if not yet done.
2. Load the workspace CAN_Demo_Documentation.olsworkspace if not loaded by default. I.e.,
click File, Open, navigate to the location where the workspace is stored, select the workspace file
and click Open.
3. Start an Online Trace View. I.e., switch to the Home ribbon and click Start. A Trace View is
started.
4. Split the window as shown in Figure 7.1 Split Trace View and Show Graph on page 57. I.e., in the
Trace ribbon click Best Fit All, Show and select Graph in the list.
Notes: This procedure is described in detail in Section 7.1, "Start Graph," on page 57.
5. Select a message in the Trace View. The ribbon tab changes, now showing the Trace ribbon. Click
Payload in the Trace ribbon.
6. Click the small triangle in front of a message to expand a Detail View.
7. Drag & Drop the Signal ActualRotationSpeed to the empty area. The Graph shows the progress
of this speed signal.
Figure 7.11 Start Activity To Create Spike Signals - Step 1
8. Expand
the
Activities
folder
in
the
Workspace
window
and
Speed_Change.olsactivity (1). Alternatively you can right-click and select Open.
double-click
9. Click Start (2) and wait for a while (e.g., 9 loops).
60001370A
64
USER’S GUIDE
2015 K2L GmbH & Co. KG
OptoLyzer Studio
Figure 7.12 Start Activity To Create Spike Signals - Step 2
10. Click Stop (3).
Figure 7.13 Searching for Values of Interest by Dragging the ViewPort to the Left Side
11. Switch to the Online Trace View. Hover the cursor over the ViewPort in the Overview (a hand
cursor is shown (4)).
12. Start dragging the ViewPort to the left side of the Overview and search for spikes or irregularities.
In Figure 7.13 spikes/irregularities are visible at the beginning of the Overview (a).
Notes: In combination with a small Timespan interval this procedure can be a first help to find spikes
or irregularities or other values of interest very fast and without creating Filters.
2015 K2L GmbH & Co. KG
65
USER’S GUIDE
60001370A
OptoLyzer Studio
Figure 7.14 Identify Value of Interest
13. Drag the ViewPort to the beginning of the ‘spikes/irregularities’ (5). The y-axis of the Signal Graph
will be adjusted automatically (b) if the respective Auto-Y button is activated in the Graph ribbon.
Figure 7.15 Enlarge ViewPort
14. Hover the mouse over the right ViewPort Handle till a double ended arrow is visible and drag it
to the end of the ‘spikes/irregularities’ (6). Nine ‘spikes/irregularities’ are visible in the Graph (c) as
mentioned in step 9.
60001370A
66
USER’S GUIDE
2015 K2L GmbH & Co. KG
OptoLyzer Studio
In a next step the duration of a ‘spike’ is measured via the Graph.
Figure 7.16 Start to Measure Signal Interval - Step 1
15. Hover the cursor to the start of the ramp (7). A dot symbol indicates the location within the series.
Depending on which buttons are activated in the Graph ribbon (Figure 7.6) additional details are
shown as e.g., the value for ActualRotationSpeed (d), the cross hairs cursor shows the time
stamp in the x-axis (e) and its position in the y-axis (f).
Figure 7.17 Start to Measure Signal Interval - Step 2
16. Drag the cursor from the start of the ramp to the end of the ‘spike’ (8) as shown in Figure 7.17.
The covered area is highlighted in gray.
2015 K2L GmbH & Co. KG
67
USER’S GUIDE
60001370A
OptoLyzer Studio
Figure 7.18 Measured Signal Interval
17. After dropping the mouse cursor the Signal Graph zooms the x-axis (g). The covered time interval
equals the measured time and is shown in the Timespan (h). It nearly matches the value of the
delay that has been used in the Activity file (Figure 7.11 and Figure 7.12).
18. Save the online file. I.e., click File and select Save As. Specify name and path.
Figure 7.19 Add Online File to Workspace
19. Right-click in the heading of the online file (8) and select Add to Workspace (9) to assign the file
to the Workspace.
20. Finally move the file to the Logs folder.
21. Save the Workspace.
60001370A
68
USER’S GUIDE
2015 K2L GmbH & Co. KG
OptoLyzer Studio
7.1.2
Online Help in Signal Graph
1. To view the comfortable online help click Info in the Signal Graph ribbon (Figure 7.4).
Figure 7.20 Signal Graph Online Help
2015 K2L GmbH & Co. KG
69
USER’S GUIDE
60001370A
OptoLyzer Studio
Chapter 8
Creating Filters
A Filter provides a set of conditions identifying a set of messages. Filters can be used for example
in Trace Views to reduce the number of displayed messages. The OptoLyzer Studio provides three
types of Filters:
Protocol Filters (immediately available in each Trace View)
Channel Filters (dependent on the connected device, immediately available in each Trace View)
User defined Filters stored in *.olsfilter files
The OptoLyzer Studio already comes with a set of default Filters. They are ready for use and allow to
focus on values of interest. These Filters are available in each Trace View. They are described in
Section 8.2. Section 8.3, "Protocol Filters Versus Channel Filters," on page 74 gives a brief overview
about the interconnection of Protocol Filters and Channel Filters. Powerful and flexible Filters can be
designed by the user. Section 8.4, "How To Create User Defined Filters," on page 77 provides a short
introduction how they can be created. Section 8.4.1, "Fast Alternative How To Add a Filter Condition,"
on page 89 offers a fast method how conditions can be added.
The samples below are basing on the same example environment as described in Figure 4.1 Example
Environment on page 21. In addition, it is assumed that the steps described in Chapter 5, "Guided Tour
through Trace View - Monitor Messages," on page 23 and Chapter 6, "Guided Tour through Activity Send a Message," on page 38 have been performed.
8.1
Good To Know When Working with Filters
1. A filter is a condition, which can be applied to block (hide) or to pass-through (show) the message
in each specified trace window independently.
2. Blocking filters are dominant, passing filters are recessive: This means if a blocking filter and a
passing filter match on a message, the blocking filter wins and the message is blocked.
3. Blocking Protocol Filters override the entire setting on Channel Filter level that has been
customized for the same protocol type. An example is described in Section 8.3, "Protocol Filters
Versus Channel Filters," on page 74.
4. Filters are using the raw value that is transmitted over the bus system (e.g., CAN bus system).
Refer to Figure 5.9 on page 30. The raw values can be monitored in the Detail View in the Trace
View (step 13 in Section 5.1) or in the Disassembly View (Section 9.1, "Disassembly," on page 90).
Notes: If you enter the Display Value and enable a Filter in a Trace View you might think the Filter
is not working properly. Always ensure you enter the raw value in Filter conditions.
5. Filters activated for a Trace View don’t have any impact on the Signal Graph.
6. Signals can be copied from the Detail View (Section 8.4.1, "Fast Alternative How To Add a Filter
Condition," on page 89), Trace View and Disassembly view to create a Filter condition.
7. If you enable one passing filter, only matching messages can pass. However this means also that
this passing filter is a blocking filter for all other messages (keep in mind that this does not mean
a blocking filter is specified). If you enable one passing filter, you have to specify for each kind of
message you want to see in a Trace View its own passing filter.
60001370A
70
USER’S GUIDE
2015 K2L GmbH & Co. KG
OptoLyzer Studio
8.2
Show Filters
1. Start OptoLyzer Studio if necessary.
2. Load the workspace CAN_Demo_Documentation.olsworkspace stored in the sections before if
necessary. I.e., click File, Open, navigate to the location where the workspace is stored, select the
workspace file and click Open.
3. If not automatically shown, open the Trace View file that has finally been stored in Chapter 7,
"Guided Tour through Graph - Monitor Signals," on page 57. I.e., in the Workspace expand Logs,
select the stored Trace View and double-click it. The Trace View opens.
Figure 8.1 Show Filters - Step 1
4. Move the mouse cursor over the status bar of the Trace View till a double ended arrow is visible
(1).
2015 K2L GmbH & Co. KG
71
USER’S GUIDE
60001370A
OptoLyzer Studio
Figure 8.2 Show Filters - Step 2
5. Drag this double ended arrow up (2) to show the hidden default Filters (a). In parallel, the Show
Filters button becomes enabled in the Trace View ribbon when moving up.
Two types of default Filters are available. Each of them is arranged in its own section:
60001370A
Protocol Filters (b)
Channel Filters whereby Channel Filters belong to a connected device (c). Each connected device
is shown in a separate section.
72
USER’S GUIDE
2015 K2L GmbH & Co. KG
OptoLyzer Studio
The default Filters are described in the Table 8.1 below.
Table 8.1 Default Filters
Filter
Protocol
(b)
Icon
Description
Protocol Filters allow to filter all messages of a protocol family.
If Protocol Filters are not clicked (default), all messages of that protocol are displayed (if not
blocked by another filter).
If Protocol Filters are selected, i.e., are in blocking mode, all messages of that protocol are
blocked (not displayed).
Each supported protocol can be controlled by its own Protocol Filter. It depends on the
OptoLyzer Studio Edition license which Protocol Filters are supported. Right now there are a
CAN and a LIN Protocol Filter.
The respective button in front of a channel is a toggle button. Two modes are possible:
The Protocol Filter is not clicked, i.e., not active (default). This means all messages are
passing.
The Protocol Filter is clicked. All messages of the selected protocol type are blocked. By
default, all corresponding channels of the connected devices are blocked.
The Filter counter in the status bar increases (d).
Device
(c)
Each connected device is arranged in its own section showing all of its channels. If an offline
log file is used, the devices stored in the log file are shown if available. Each channel of the
connected device gets its own Channel Filter. A Channel Filter allows to filter all messages of
a channel (e.g., CAN1, CAN2, ...).
If Channel Filters are not clicked (default), all messages of that channel are displayed (if not
blocked by another filter).
If Channel Filters are selected, i.e., are in blocking mode, all messages of that channel are
blocked (not displayed).
Each channel can be controlled by its own Channel Filter. It depends on the connected device
which and how many Channel Filters are supported. Supported devices are listed in Section
1.2.2, "OptoLyzer Studio and Hardware," on page 8.
The respective button in front of a channel is a toggle button. Two modes are possible:
The Channel Filter is not clicked, i.e., not active (default). This means all messages are
passing.
The Channel Filter is clicked. All messages of the selected protocol type are blocked. The Filter
counter in the status bar increases (d).
2015 K2L GmbH & Co. KG
73
USER’S GUIDE
60001370A
OptoLyzer Studio
8.3
Protocol Filters Versus Channel Filters
Notes: Blocking Protocol Filters override the entire setting on Channel Filter level that has been
customized for the same protocol type.
The example below demonstrates this behavior.
Figure 8.3 Enable CAN Channel Filters
For example. If the CAN Protocol Filter is clicked and switches into blocking mode, all CAN channels
of a connected device will be blocked independently of their customization before. Even if all of them
have been switched into blocking mode, one Filter will be shown as active in the status bar.
1. Click CAN2, CAN3, CAN4, CAN5, CAN6 (3) in the section of Device 0. These Channel Filters are
enabled afterwards and switch to blocking mode. As no message has been received via these
channels no message is blocked as visible in Figure 8.3. The first value in the status bar (e) shows
how many messages are shown depending on the filter settings, the second value shows how
many messages are received. In addition, five Channel Filters are activated.
60001370A
74
USER’S GUIDE
2015 K2L GmbH & Co. KG
OptoLyzer Studio
Figure 8.4 Set CAN Protocol Filter
2. Click the CAN Protocol Filter (4). All channel Filters of the same protocol type are blocked
simultaneously (f). In addition, the Filter counter (g) shows that one Filter is enabled (the CAN
Protocol Filter). All messages are blocked (number ‘0’ in status bar) as all received messages
(number ‘53143’ in status bar) are CAN messages. The Trace View shows no messages.
3. Click one of the CAN Channel Filters of Device 0. It is not possible. The Channel Filters are
disabled as long as the corresponding Protocol Filter is enabled.
2015 K2L GmbH & Co. KG
75
USER’S GUIDE
60001370A
OptoLyzer Studio
Figure 8.5 Disable All Filters
4. Click Disable All (5) in the Filters ribbon. All Filters are disabled. The Filter counter in the status
bar shows null active filters. The Trace View shows all received messages. The first number in the
status bar equals the second number in the status bar.
Figure 8.6 Disabled Filters
60001370A
76
USER’S GUIDE
2015 K2L GmbH & Co. KG
OptoLyzer Studio
8.4
How To Create User Defined Filters
This section describes how to create user defined Filters.
Figure 8.7 Create Filter File
1. In the Workspace window, select Filter (1), right-click, select New (2) and then Filter File (3). A
window opens where the name and the location has to be specified. In the example the Filter File
name will be Speed_Greater. Filter File extension is *.olsfilter.
2015 K2L GmbH & Co. KG
77
USER’S GUIDE
60001370A
OptoLyzer Studio
Figure 8.8 Created Filter File
A new Filter File is created (a) and automatically opened (b). In addition, the Filter ribbon (b) is
displayed.
2. Click New CAN Filter in the Filter ribbon (4).
60001370A
78
USER’S GUIDE
2015 K2L GmbH & Co. KG
OptoLyzer Studio
Figure 8.9 Add CAN Filter
A Filter template is added (d). An asterisk indicates a changed Filter file and that its current content
is not stored. The type of the Filter (i.e., CAN) is shown at the top (e) of the template. In addition, the
amount of that type is displayed (starting with 1 in the example). A right-click on the handle of the
Filter (f) allows to perform clipboard actions (i.e., cut, copy, paste, delete) depending on the current
flow of work. The name of the Filter is shown at the top within the blue rectangle (g) and can be
changed (step 3). In front of the name a small triangle allows to collapse or expand the Filter condition.
In collapsed mode the entire Filter condition is shown as formula behind the name. Filter conditions
can only be specified in expanded view in the row starting with the plus sign (h). Clicking on the plus
sign allows to expand the condition (i) according to boolean rules.
There is an alternative how user defined Filter conditions can be created very fast using the drag &
drop feature. The procedure is described in Section 8.4.1, "Fast Alternative How To Add a Filter
Condition," on page 89.
2015 K2L GmbH & Co. KG
79
USER’S GUIDE
60001370A
OptoLyzer Studio
Figure 8.10 Define CAN Filter Condition
3. For example enter as name Show Acceleration and press the Enter key (5). Afterwards click new
to open a list of the available operands (6). Expand the Catalog MotorControlDemo and select
ActualRotationSpeed (representing the value of the corresponding signal) (7) in section Status.
The other entries Data Frame and Remote Frame are CAN default message properties.
Figure 8.11 Specify Condition - Step 1
4. The current one-row-formula for the Filter is shown behind the name (j). Click on the Equals
symbol (8) and select the Greater symbol (9).
5. Click Save in the Quick Access Bar to store the current Filter settings.
60001370A
80
USER’S GUIDE
2015 K2L GmbH & Co. KG
OptoLyzer Studio
In a next step the value has to be specified that will be used as lower limit in the condition. To simplify
the following steps the windows will be arranged in a different order.
Figure 8.12 Specify Condition - Step 2
6. Hover the mouse over the caption of the Filter file (10).
Figure 8.13 Specify Condition - Step 3
7. Click and drag the window (11) as shown in Figure 8.13. The blue rectangle (k) shows the position
of the window within the application when the mouse key is dropped.
2015 K2L GmbH & Co. KG
81
USER’S GUIDE
60001370A
OptoLyzer Studio
Figure 8.14 Specify Condition - Step 4
The Filter window is arranged to the right side of the Trace View. The current state of the user defined
Filter is already shown in the Filter section below the Trace View (l). It is disabled by default.
The next action is an optional step that is performed only to enlarge the window of the Trace View
within the application and to avoid scrolling in the Trace View.
8. Click Auto Hide in the Workspace (12).
60001370A
82
USER’S GUIDE
2015 K2L GmbH & Co. KG
OptoLyzer Studio
Figure 8.15 Specify Condition - Step 5
The lower limit shall be specified using the Trace View and the Signal Graph (to get a visual impression
which value makes sense). This procedure covers step 9 up to step 20 and shows again how you can
navigate within OptoLyzer Studio.
9. Click in the Trace View (13). The Trace ribbon is shown. Click Show Filters (14) in the Trace
ribbon to hide the Filter section below the Trace View.
10. Click Show (15) in the Trace ribbon and select Graph (16).
2015 K2L GmbH & Co. KG
83
USER’S GUIDE
60001370A
OptoLyzer Studio
Figure 8.16 Specify Condition - Step 6
11. Click Legend (17) and Timespan (18) in the Graph ribbon to disable both (target: focus only on
Graph and Overview and finding spikes, i.e., interesting values suitable for lower limit) and scroll
down to the Overview (19).
12. Move the ViewPort to the spikes as shown in Figure 8.16 (20).
60001370A
84
USER’S GUIDE
2015 K2L GmbH & Co. KG
OptoLyzer Studio
Figure 8.17 Specify Condition - Step 7
13. Ensure Synchronize (m) is enabled (i.e., a selected message in the Trace View is shown as a
vertical line in the Graph highlighted in orange and vice versa (n)). Double-click at the start of a
ramp (21) as shown in Figure 8.17. The double click creates a vertical line in the Graph and shows
the corresponding highlighted message in the Trace View.
2015 K2L GmbH & Co. KG
85
USER’S GUIDE
60001370A
OptoLyzer Studio
Figure 8.18 Specify Condition - Step 8
14. Click the small triangle (22) in front of the highlighted message to display the Detail View. Switch
to the Signals tab (23).
15. Select the View ribbon (24) and disable the Hexadecimal Integers button (25) (decimal values
are shown in the tools). This step ensures the proper values and in the matching numeral system
are taken when the lower limit is inserted in the Filter condition. Search for the raw value of
ActualRotationSpeed (o) in the Signal tab of the Detail View and insert this value (3069 as
decimal value) in the Filter condition (26). Press the Enter key.
16. Click Save in the Quick Access bar to store the current Filter settings.
60001370A
86
USER’S GUIDE
2015 K2L GmbH & Co. KG
OptoLyzer Studio
Figure 8.19 Specify Condition - Step 9
17. Select the ActualRotationSpeed in the Detail View and drag it to the Trace View (27) as shown
in Figure 8.19. This step is performed to view and control the values in the Trace View later.
18. Close the Filter File.
19. Collapse the Detail View in the Trace View.
20. Click Hide in the Trace ribbon to close the Graph.
21. Click Show Filters in the Trace ribbon.
2015 K2L GmbH & Co. KG
87
USER’S GUIDE
60001370A
OptoLyzer Studio
Figure 8.20 Specify Condition - Step 10
22. Click the triangle in front of the user defined Filter and select Pass Filter (28).
Figure 8.21 Check Values
23. The Filter is effective immediately (p). Hide the Filters, i.e., click Show Filters in the Trace ribbon
to enlarge the area for the Trace View. Scroll within the Trace View and check the values of
ActualRotationSpeed (29). Only values are visible that are greater than 3069 (decimal value).
Other user defined Filters can be created in the same way as described above or maybe faster as
shown in Section 8.4.1.
60001370A
88
USER’S GUIDE
2015 K2L GmbH & Co. KG
OptoLyzer Studio
8.4.1
Fast Alternative How To Add a Filter Condition
1. Open the Details View in the Trace View and switch to the Signal tab.
Figure 8.22 Specify Condition by Drag & Drop
2. Select the ActualRotationSpeed and drag & drop it to the Filter file.
3. Adapt the value in the filter formula if desired.
Notes: The message can be copied in the same way from the Disassembly and the Trace View.
2015 K2L GmbH & Co. KG
89
USER’S GUIDE
60001370A
OptoLyzer Studio
Chapter 9
Digging in Bits and Bytes
The OptoLyzer Studio provides tools that allow digging deeper on bit and byte level. Thus data can be
analyzed in detail. The following tools are provided:
Disassembly
Bit View
Hex View
The sample below is basing on the same example environment as described in Figure 4.1 Example
Environment on page 21. In addition, it is assumed that the steps described in Chapter 8, "Creating
Filters," on page 70 are performed.
9.1
Disassembly
This tool displays the selected message disassembly in a user friendly way in five columns:
Property Name
Value: showing the raw value that is transmitted over the bus system
Display Value: showing user friendly value according to user settings (e.g., hexadecimal/decimal)
and presented, e.g., in the Trace View
Calculated Value: using meta information in Catalogs
Unit: the physical unit of the value if available in Catalogs
If no Catalog is available, the payload is displayed either in hexadecimal, decimal or ASCII style.
Display Values are displayed dependent on the settings of Hexadecimal Integer and Symbolic Names
in the View ribbon. Hovering over the property names shows a tool tip with description if available.
Notes: The Disassembly shall be experienced as a unit together with the Trace View. This means it
makes sense to open both tools in the Workspace. Data in the Disassembly can be found in
the Trace View and vice versa. However data is presented more user-friendly within
Disassembly. Scrolling (i.e., selecting messages consecutively) in the Trace View will
automatically update the data in the Disassembly.
60001370A
90
USER’S GUIDE
2015 K2L GmbH & Co. KG
OptoLyzer Studio
9.1.1
How To Use the Disassembly
To start the Disassembly follow these steps.
Figure 9.1 Start Disassembly- Step 1
1. Starting from Figure 8.21 on page 88 click Disable All (1) in the Trace View to disable all Filters.
Then switch to the View ribbon (2).
Figure 9.2 Start Disassembly- Step 2
2. Click Disassembly (3) in the View ribbon. The Disassembly is opened.
2015 K2L GmbH & Co. KG
91
USER’S GUIDE
60001370A
OptoLyzer Studio
Figure 9.3 View Data in Disassembly
3. Figure 9.3 shows the hierarchical View with headers (5 columns (a)), Data Frame (b) and payload
(c) properties. In opposite to the Trace View the Disassembly shows all values of a message.
Depending on whether a Catalog is loaded or not parts of the Data Frame and the payload are
presented user friendly. Hovering over the property names shows a tool tip (d) with description if
available. The Signals are identified by specific colors (e) that can also be found in the Bit Editor
Section 9.2, "Bit View," on page 93).
4. Select a message within the Trace View (4) and press the cursor up or cursor down key. Monitor
how the data changes accordingly in the Disassembly.
5. Click Hexadecimal Integers in the View ribbon to switch between hexadecimal and decimal
presentation. View how the values change.
6. Click Symbolic Names in the View ribbon to show names instead of values and vice versa. It is
specified in the Catalog which values are shown as names. View how the values change.
60001370A
92
USER’S GUIDE
2015 K2L GmbH & Co. KG
OptoLyzer Studio
9.2
Bit View
This tool displays dump information of a message on bit and byte level. Section 9.2.2,
"Recommendation when To Use the Bit View," on page 96 shows an example when it makes sense to
use the Bit View.
9.2.1
How To Use the Bit View
To start the Bit View follow these steps.
Figure 9.4 Start Bit View
1. Starting from Figure 9.3 on page 92 switch to the View ribbon if necessary and click Bit View (1).
The Bit View is opened and arranged next to the Disassembly at the bottom by default. You can
arrange the windows in a different order if desired (refer to Figure 8.13 Specify Condition - Step 3
on page 81).
Figure 9.5 How Information Is Spread within the Tools 1
Figure 9.5 shows how information is spread within the tools and which details can be found where.
The example above shows that all details of a message selected in the Trace View are presented in
the Disassembly (a). If you want to know where the signals of a message start within the byte chain,
switch to the Bit View (b). In addition, it shows the bit values for the single signals (c), (d). Keep in
mind that the signals in the Disassembly and Bit View are presented in the same color. The
hexadecimal values of the bytes are shown at the right side in the Bit View. They match the byte
sequence in the Disassembly.
2015 K2L GmbH & Co. KG
93
USER’S GUIDE
60001370A
OptoLyzer Studio
Figure 9.6 Bit View - Details
The Figure 9.6 shows a different message selection in the Trace View and how this message looks
like in the Bit View.
The header shows the position of the bytes (e) within a message (little endian byte order). The
sequence of the bits and bytes are shown on the left side (f). The single bit values (g) of the signals
are arranged in the middle of the Bit View. At the right side the hexadecimal values of the bytes are
shown (h). Each signal is presented in its own specific color (i) using the same color as in the
Disassembly. These colors help to find the respective signals in the Disassembly. Selecting a signal in
the Disassembly automatically selects the respective bits and bytes in the Bit View. OptoLyzer Studio
automatically assigns the colors to the signals (Disassembly) and bits and bytes (Bit View). If a bit is
selected within the Bit View, this bit is displayed in a specific color indicating the current selection (j)
(one bit or several bits can be selected). A small triangle shows in which row of the dump the bit
selection starts (k).
60001370A
94
USER’S GUIDE
2015 K2L GmbH & Co. KG
OptoLyzer Studio
Figure 9.7 Bit View - Tool Tip
2. Hover over a byte sequence of the same color that is not white. The tool tip (2) presents the name
of the signal and its value.
3. Select a bit and let the eyes wander to the right side (3) where the hexadecimal byte values are
arranged. The selection is also shown in the Bytes area.
Figure 9.8 Bit View - Select Bit
4. Again select a bit and right-click (4). A context menu opens. The bit value is shown and can be
copied for further use. Hover over the other items in the list to view the value as bit, hex, code or
ASCII value.
2015 K2L GmbH & Co. KG
95
USER’S GUIDE
60001370A
OptoLyzer Studio
Figure 9.9 Bit View - Copy Data
5. Now select a bit and drag the cursor to the right side as shown above (5). Right-click (6) and
view the value (l). View the indication of the selection in the bytes area (m).
9.2.2
Recommendation when To Use the Bit View
The Bit View is the appropriate tool to view details when you are monitoring short messages as CAN
(e.g., 8 bytes) or LIN messages and/or if the signals do not start with the first bit (i.e., bit 0) of a byte,
i.e., if one byte covers content of different signals or do not end with the last bit of a byte. Figure 9.9
shows an example.
Figure 9.10 Byte - Split Information
Byte 1 covers parts of two signals. The bits 8 up to 13 belong to one signal whereas the bits 14 and
15 belong to a different signal. Both signals are indicated by different colors. The different ranges within
the byte (Hex Byte range on the right side) are also indicated by different colors.
60001370A
96
USER’S GUIDE
2015 K2L GmbH & Co. KG
OptoLyzer Studio
9.3
Hex View
This tool displays the hexadecimal bytes of a message. Section 9.3.2, "Recommendation when To Use
the Hex View," on page 99 provides hints about for which protocol types it makes sense to use the
Hex View.
9.3.1
How To Use the Hex View
To start the Hex View follow these steps.
Figure 9.11 Start Hex View
1. Starting from Figure 9.5 on page 93 switch to the View ribbon if necessary and click Hex View (1).
The Hex View is opened and arranged next to the Bit View at the bottom.
Figure 9.12 How Information Is Spread within the Tools 2
Figure 9.12 shows how information is spread between Trace View, Disassembly and Hex View and
how details can be found. The example above shows that all details of a message selected in the
Trace View are presented in the Disassembly (a). If you want to focus on the hexadecimal values,
switch to the Hex View (b).
2015 K2L GmbH & Co. KG
97
USER’S GUIDE
60001370A
OptoLyzer Studio
2. Close the Bit View (2) to focus on the Hex View.
Figure 9.13 Hex View - Select Byte
3. Select a byte (3) and let the eyes wander to the right side (4) where the corresponding ASCII
values are arranged. The selected ASCII characters are also highlighted.
Figure 9.14 Copy Hex View Data
4. Now select a byte range as shown above (5). Right-click (6) to open the context menu and view
the values (c) when hovering over the single items. View the selected ASCII characters on the
right side (d).
60001370A
98
USER’S GUIDE
2015 K2L GmbH & Co. KG
OptoLyzer Studio
9.3.2
Recommendation when To Use the Hex View
The Hex View is the appropriate tool to monitor long messages as CAN FD (e.g., 64 bytes) or MOST
messages (MHP or AMS messages), e.g., if you have a byte oriented protocol.
2015 K2L GmbH & Co. KG
99
USER’S GUIDE
60001370A
OptoLyzer Studio
Chapter 10
Tools
Figure 10.1 OptoLyzer Studio - Overview
10.1 Quick Access Toolbar
Provides one-click access to
Save
Undo
Redo
Start online monitoring of received messages via connected bus system interfaces in a Trace View
(Chapter 5, "Guided Tour through Trace View - Monitor Messages," on page 23).
Stop online monitoring (once stopped online monitoring cannot be continued in the same Trace
View).
Clear data shown in an online Trace View.
Also additional ribbon tabs can be accessed (not visible in Figure 10.1 but e.g., in Figure 5.5 Online
Monitoring on page 26 and in Figure 10.2). The function behind depends on which window is selected.
This means, e.g., Undo can reload either a deleted filter (if Undo is clicked in the Filter tool) or a
deleted activity (if Undo is clicked in the Activity tool).
60001370A
100
USER’S GUIDE
2015 K2L GmbH & Co. KG
OptoLyzer Studio
10.2 File Application Menu and Ribbon Tab Groups
Beneath the title and the quick access toolbar a combination of a traditional menu bar with a ribbon
provides easy access to different command groups. Furthermore ribbons are added in case additional
tools (e.g., Trace View, Graph, Activity, Filter) are opened.
2015 K2L GmbH & Co. KG
101
USER’S GUIDE
60001370A
OptoLyzer Studio
Figure 10.2 Ribbon Tabs
60001370A
102
USER’S GUIDE
2015 K2L GmbH & Co. KG
OptoLyzer Studio
The table below describes all ribbon tabs and lists the most important functions/tools (i.e., not all
functions/tools). It can be seen somehow as a guide.
Table 10.1 Ribbon Tabs and Important Functions/Tools
Tab
Menu/Ribbon
Description
Important Functions/Tools
File
Traditional
menu
It allows to administrate basic data within
OptoLyzer Studio (e.g., workspace, files,
license).
Home
Ribbon tab
(default)
It provides one-click access to manage
online viewing of the connected bus systems
and some clipboard functions.
View
Ribbon tab
(default)
It provides access to all tools that are
delivered within OptoLyzer Studio and some
settings.
Trace
Ribbon tab
(default)
This tab group is automatically shown if log
files are opened or online viewed.
Graph
Ribbon tab
(additional)
This tab group is automatically shown if the
trace view is split to monitor dedicated
messages/events graphically.
Filter
Activity
Ribbon tab
(additional)
Ribbon tab
(additional)
2015 K2L GmbH & Co. KG
This tab group is automatically shown if
existing user-defined filter files are opened or
new filter files are created. The filter tool is
the place where all user-defined filters are
created.
This tab group is automatically shown if
existing activity files are opened or new
activity files are created. The activity tool is
the place where messages are scheduled,
created and sent.
103
USER’S GUIDE
New
Open
Save
Options with access to
license management
Exit
Start online monitoring
Stop online monitoring
Clear Trace View
Copy & Paste
Delete
Workspace
Device Manager
Disassembly
Hex View
Bit View
Hex/Dec Switch
Split functions (Graph)
Time stamp functions
Reference functions (set,
goto)
Mode (scroll functions)
Logging (Stop and Clear)
Enabling/Disabling Filters
Customization of Trace View
Scroll modes
View modes
Zooming
Customization of visibility
Create/modify user-defined
Filters
Collapse/Expand function
Create/modify Activities
Start/Stop Activities
Collapse/Expand function
60001370A
OptoLyzer Studio
10.3 Workspace
The workspace is the place where all data is stored that refers to it. Thereby files are not copied to a
dedicated location on the hard disk but their corresponding references to the files’ location are stored
in the workspace file. If files are missing they are indicated by a red exclamation mark. By default four
virtual folders (described in Section 10.3.1, "Catalogs" up to Section 10.3.5, "Activities") are offered in
a tree view to help organizing types of data. Virtual means that no folders are created on the hard disk.
If the folders are not needed they can be deleted. Other additional folders can be created if desired.
One workspace can be opened in one OptoLyzer Studio instance. The name of the workspace can be
modified and is shown in the title bar of the main window.
It is also possible to open traces for viewing purposes without being assigned to the workspace.
Modifications within such opened traces will not be stored when closing the workspace.
Common functions like New, Open, Save and Save As can be accessed via the File menu
(Figure 10.2). Saved Workspaces will get file extension *.olsworkspace.
10.3.1 Catalogs
Catalogs contain format descriptions how specific bus data has to be interpreted. Currently CAN and
LIN bus catalogs are supported. They have to be created externally and can be added to the
workspace via the context menu.
Table 10.2 CAN and LIN Bus Formats
Bus Type
Format
Description
CAN
.dbc
Proprietary format to describe CAN network.
.xml
Format that has been derived from the *.dbc format and is presented in *.xml
format.
.ldf
Format description that has been specified by a LIN consortium.
LIN
10.3.2 Log Files
Log files contain messages of supported protocols (right now CAN and LIN protocols), messages that
have been created within the application (e.g., in the tool Activity) and system messages that are
created if e.g., something has gone wrong when creating messages in the Trace View. It is possible
to have separate files for the different protocols or one file containing data of both protocols. Log files
can be added to a workspace respectively to the Trace folder. In addition, they can be copied, renamed
etc. By default, online monitored data is not assigned to this folder. Online data has to be saved first
before the data can be assigned to the workspace. For details refer to Chapter 5, "Guided Tour through
Trace View - Monitor Messages," on page 23.
If a log file is opened, its data will be shown in a dedicated window. In parallel, a specific ribbon tab
Trace is shown. It provides all functions to analyze the data in the window. Each message is shown
as separate row, each property of a message in a single field.
It is also possible to open a log file within the OptoLyzer Studio without assigning it to the workspace.
Notes: The context menu offers among other typical functions Exclude from Workspace and
Delete. Exclude from Workspace (shortcut Del) means the file will be removed from the
workspace and will no longer be part of the workspace. However the log file itself is still
available on the hard disk. This means the data in the log file is still available. Delete (no
shortcut implemented to avoid misuse) means the log file will be deleted, i.e., is not available
on the hard disk anymore. The data is lost.
60001370A
104
USER’S GUIDE
2015 K2L GmbH & Co. KG
OptoLyzer Studio
10.3.3 Graph
A Graph is able to graphically display the progress of a property of a message as time line. Messages
can be bus events identified by the source channel or messages identified by the source channel and
the message ID (CAN ID, LIN ID). The values are shown in a Cartesian coordinate system whereby
the x-axis represents the time and the y-axis the values. The Graph is using the same source as the
Trace window in which context it has be opened.
The Graph provides powerful zooming features that cover zooming in x-axis, y-axis, both axis,
autoscroll, synchronize function. Thus it is possible to focus on the values of interest in an illustrative
kind of way. The graphical view can also be exported (possible file extensions: .png, .gif, .jpg) or
printed as image.
If a Graph is opened, a specific ribbon tab Graph is shown.
Section Chapter 7, "Guided Tour through Graph - Monitor Signals," on page 57 shows how to work
with the Graph.
10.3.4 Filters
Filters are used to specify the messages which shall be displayed in a Trace View. There are several
types of filters.
10.3.4.1 Channel Filters
By default there are channel filters for each bus system of a device that is connected to the OptoLyzer
Studio. They allow to filter all messages of a channel of a bus system (CAN1, CAN2 .., LIN1, LIN2..).
They are automatically available in each log file and can be made visible via the Trace ribbon item
Show Filters or by just dragging the splitter at the bottom (that shows the status bar or a log file) up
(Chapter 8, "Creating Filters," on page 70). Channel Filters can be enabled or disabled. They are not
stored as filter file and thus not listed in the Filters folder.
10.3.4.2 Protocol Filters
They allow to filter all messages of a protocol family, i.e., bus system (CAN, LIN). They are
automatically available in each log file and can be made visible via the Trace ribbon item Show Filters
or by just dragging the splitter at the bottom (that shows the status bar or a log file) up (Chapter 8,
"Creating Filters," on page 70). Protocol Filters can be enabled or disabled. They are not stored as
filter file and thus not listed in the Filters folder.
10.3.4.3 User-defined Filters
They are defined by the user and stored in a filter file whereby the name is arbitrary. User-defined
filters can be created for each supported bus system, i.e., either for a CAN bus system or a LIN bus
system. Filters contain conditions that refer to message properties. A message property can be a
property of the raw message (e.g., ID, Direction) or a signal/parameter formed from Catalog
information. The mode of user-defined filters can be:
— Disabled: The filter is not used.
— Pass Filter: The messages/events matching the filter conditions will be displayed (if not blocked
by some other filters). All other messages will be blocked.
— Blocking Filter: The messages/events matching the filter conditions will not be displayed. All
other messages are displayed (if not blocked by some other filters). However blocking filters
are protocol specific, i.e., a CAN Filter will not block any LIN message.
2015 K2L GmbH & Co. KG
105
USER’S GUIDE
60001370A
OptoLyzer Studio
User-defined Filters can be added or created in the OptoLyzer Studio and will be stored as filter file
(file extension *.olsfilter) within the workspace. They are available in each Trace View and are ready
to be used. The User-defined Filters can be made visible via the Trace ribbon item Show Filters or
by just dragging the splitter at the bottom (that shows the status bar or a log file) up (Chapter 8,
"Creating Filters," on page 70).
If a User-defined Filter file is opened, a dedicated window, the Filter Editor opens. In parallel, a specific
ribbon tab Filter is shown. It allows to create CAN or LIN filters and to collapse or expand the filters.
Notes: When working with Filter specific rules have to be kept in mind to understand the concept.
Refer to 8.1 Good To Know When Working with Filters on page 70.
Section Chapter 8, "Creating Filters," on page 70 shows how to work with Filters.
60001370A
106
USER’S GUIDE
2015 K2L GmbH & Co. KG
OptoLyzer Studio
10.3.5 Activities
Activities are defined by the user and stored in an activity file (whereby the name is arbitrary) and thus
perform actions. A typical example of an activity might be sending of a generated message depending
on a time target. It is possible to create complex structures of conditions to describe the desired
behavior. Activities can be concatenated conditions that are executed sequentially or independent
conditions that can be executed in parallel.
The OptoLyzer Studio provides:
A set of predefined activity templates for the supported bus systems. They can be used for the
connected devices. Examples are Wait for CAN Message, Wait for LIN Message, CAN Data Frame,
LIN Data Frame.
Some generic actions (as e.g., delay and loop). They do not refer to connected devices.
Activities that cannot be executed because of missing devices are indicated by a red rectangle.
Table 10.3 Supported Message Types and Generic Actions
Message Type
Bus Type/Generic
Description
Empty Action
Generic
Placeholder for new Activity
Send Message
CAN, LIN
A message will be sent.
Wait Message
CAN, LIN
The system will wait till a specified message is coming in.
Delay
Generic
Just waiting for a period of time.
Loop
Generic
Scheduled activities will be restarted again and again.
LIN Switch
Schedule Table
Action
LIN
Action that requires a *.ldf file and switches the schedule table of a
running LIN Master. The LIN device must be in master mode.
LIN Wakeup
Action
LIN
Dedicated LIN message that triggers a LIN network to wake up.
LIN GoToSleep
Action
LIN
Dedicated LIN message that brings a running LIN Master into sleep
mode after transmitting a GoToSleep message.
LIN Restart Action
LIN
Dedicated LIN message that restarts the LIN driver of a device (resets
the schedule, set all message buffers to default values, flushes all
diagnostic queues, ...).
Section Chapter 6, "Guided Tour through Activity - Send a Message," on page 38 shows how to work
with the Activity.
2015 K2L GmbH & Co. KG
107
USER’S GUIDE
60001370A
OptoLyzer Studio
Activities can only be used if the corresponding editor window is opened (Chapter 6, "Guided Tour
through Activity - Send a Message," on page 38). In parallel, a specific ribbon tab Activity is shown.
Figure 10.3 Activity Ribbon
The Activity ribbon provides a generic Activity button (a) that adds an empty template. In this case the
Activity has to be designed from scratch. Other groups (b), (c) provide access to predefined Activity
templates for dedicated use cases (Chapter 6, "Guided Tour through Activity - Send a Message," on
page 38 shows some examples). In addition, the ribbon allows to modify or to delete existing activities
and to collapse or expand the activities.
Figure 10.4 Activity - Graphical Overview - Example
After clicking the Activity button in the Activity ribbon, an Activity is added in the window. The single
elements shown in the window are described in the table below.
60001370A
108
USER’S GUIDE
2015 K2L GmbH & Co. KG
OptoLyzer Studio
Table 10.4 Graphical Elements of an Activity
Letter
States
Description
(d)
Each click on Activity in the Activity ribbon adds one Activity.
(e)
Name of the Activity. If an Activity is added the first time a default name is inserted
automatically. This default name depends on which Activity is added. The name can be
modified by just clicking in the input field and entering the name as desired.
(f)
Start
Send
(g)
Expanded
Collapsed
Activity button. There are two types of buttons
Start: This type of button is shown for:
Sequences (i.e., Activity consists of more than one action)
Wait for CAN Message
Wait for LIN Message
Loop
Send: This type of button is shown for Send Messages:
CAN Data Frame
Cyclic CAN Data Frame
LIN Data Frame
Expand/Collapse button
Expanded: All details are visible.
Collapsed: The handle, the exclamation mark (if available), the expand/collapse button,
the Activity button and the name are visible.
(h)
The handle is a graphical element to select an Activity and thus allows clipboard actions.
(i)
An Action is part of an Activity. It stands for one dedicated action that has to fulfill one task.
This can be a:
Send Message (different types)
Wait Message (different types)
Delay
Loop
LIN Switch Schedule Table Action
LIN Wakeup Action
LIN GoToSleep Action
LIN Restart Action
If several actions are covered in one Activity, they are enumerated and build a sequence.
(j)
Name of the Action. If an Action is added the first time a default name is inserted
automatically. This default name depends on which Action is added. The name can be
modified by just clicking in the input field and entering the name as desired.
(k)
The handle is a graphical element to select an Action and thus allows clipboard actions. In
addition, an Action can be moved within an Activity window.
(l)
Drop-down list allowing to select an Action.
(m)
Indicator of an Action (if the Activity consists of more Actions) or of an Activity (if the
Activity consists of one Action).
A green color shows an activity of an Action.
A gray color shows an inactivity of an Action.
green
gray
(n)
Button to extend the Activity. If clicked an Empty Action is added. This Empty Action has
to be customized as desired.
2015 K2L GmbH & Co. KG
109
USER’S GUIDE
60001370A
OptoLyzer Studio
10.4 Errors & Warnings
The Errors & Warnings Tool is the central output view within the OptoLyzer Studio to display errors,
warnings and information. Details are presented about the state of the OptoLyzer Studio and its loaded
plug-ins.
Notes: Trace Errors are not shown in this tool as they are created if e.g., something has gone wrong
when creating messages in the Trace View.
10.4.1
How To Start the Errors & Warnings Tool
To start the Errors & Warnings tool follow these steps.
Figure 10.5 Start Errors & Warnings
1. After starting of the OptoLyzer Studio switch to the View ribbon (if necessary) and click Errors &
Warnings (1).
Figure 10.6 Example of an Error Message
The Errors & Warnings tool is opened. Errors, warnings and information are arranged as checkable
buttons (a). When checked, the events of the checked type are displayed. Figure 10.6 shows one
example of an error message and how it is presented within the tool (b). In addition, the module can
be shown if desired (check Modules).
2. Just click the tab of interest to view its errors, warnings or information if available.
3. Hover over the Save (content is stored in an XML file) and Clear button to view the tool tip (2).
Click the respective button if desired.
60001370A
110
USER’S GUIDE
2015 K2L GmbH & Co. KG
OptoLyzer Studio
10.5 Description
The Description is the central tool within the OptoLyzer Studio to present additional descriptions if
available. The content changes depending on which tool has the focus within OptoLyzer Studio. For
example, if you open the Disassembly (Section 9.1, "Disassembly," on page 90) and select a property,
additional descriptions are presented. If you open the Device Manager or the System Info and select
a device you get details about the selected device.
10.5.1 How To Use the Description
To start the Description follow these steps.
Figure 10.7 Start Description
1. After starting of the OptoLyzer Studio switch to the View ribbon (if necessary) and click Description
(1).
Figure 10.8 Example of a Description
The Description tool is opened. It depends on the selected property whether descriptions are available
or not. Figure 10.8 shows one example of an error message and how it is presented within the tool.
2. For example open the Device Manager (as described in Section 5.1, "Start the OptoLyzer Studio
for the First Time," on page 23) and select a connected device (2). The Description shows the
device description (a).
3. Right-click in the Description to view the features provided in the context menu (3). Select the
respective item as desired.
2015 K2L GmbH & Co. KG
111
USER’S GUIDE
60001370A
OptoLyzer Studio
10.6 System Info
The System Info provides information about the current state of the connected devices and the buses
which can be accessed by those devices. The connected devices are arranged as hierarchical tree.
Each connected device type is indicated by a specific icon that changes when a device is
disconnected. The name, the type of the device and its state are shown. Each channel of a connected
device is arranged in a separate sub branch. These branches list the channel name, the state indicator
and controls for device actions, which can be performed on the channel. Each channel branch contains
the bus properties as child items. It depends on the type of the device whether device actions are
supported or not. The following table lists the device actions of the supported devices.
Table 10.5 Supported Device and Channel Actions
Device
Channel
OptoLyzer MOCCA
Device
Microchip CAN Bus
Analyzer
Actions
Twinkle: Triggers the twinkling of the Active LED.
Relay: Toggles the relay.
CAN
-
LIN
Wakeup
CAN
Terminator: Indicated Enabled/Disabled Terminator (read only)
Table 10.6 Indicators of Supported Devices
Device
Channel
OptoLyzer
MOCCA Device
CAN
Indicator
Description
Device
State
States: Connected/Not Connected
Channel
State
Green: Channel sends/receives properly data.
Yellow: No activity is detected for this channel.
Red: Channel sends/receives data but transmission shows errors.
This state will be kept for 5 seconds and will switch to a yellow icon.
LIN
Channel
State
Microchip CAN
Bus Analyzer
CAN
60001370A
Green: Channel sends/receives properly data.
Yellow: There is no activity detected for this channel.
Red: Channel sends/receives data but transmission shows errors.
This state will be kept for 5 seconds and will switch to a yellow icon.
Device
State
States: Connected/Not Connected
CAN
Channel
State
Green: Activity is detected on the channel.
Yellow: No activity detected.
112
USER’S GUIDE
2015 K2L GmbH & Co. KG
OptoLyzer Studio
10.6.1 How To Use the System Info
To start the System Info follow these steps.
Figure 10.9 Start System Info
1. After starting of the OptoLyzer Studio switch to the View ribbon (if necessary) and click System
Info (1). The System Info tool is opened.
Figure 10.10 Example of a System Info
2. Click the small triangles (2) in front of the device and the channels to view the details.
3. View the statistics of the channel (3).
4. Click the twinkle button of the OptoLyzer MOCCA device to identify the respective device on your
desk (4).
5. Right-click in the System Info to view the features provided in the context menu (5). Select the
respective item as desired.
2015 K2L GmbH & Co. KG
113
USER’S GUIDE
60001370A
OptoLyzer Studio
Chapter 11
Revision History
Table 11.1 Customer Revision History
REVISION
LEVEL
60001370A
60001370A
SECTION/FIGURE/
ENTRY
All
CORRECTION
Initial version
114
USER’S GUIDE
2015 K2L GmbH & Co. KG
OptoLyzer Studio
Further Information
For more information on K2L automotive products, including integrated circuits, software, and MOST®
development tools and modules, visit our web site: http://www.K2L.de. Direct contact information is
available at: http://www.K2L.de/contact.
K2L GmbH & Co. KG
Emmy-Noether-Straße 14
76131 Karlsruhe
Germany
Technical Support
Contact information for technical support is available at: http://www.K2L.de/contact.
2015 K2L GmbH & Co. KG
115
USER’S GUIDE
60001370A