1
EXAMPLE: AXISYMMETRIC MOUNT
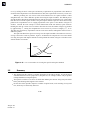
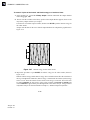
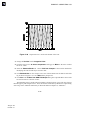
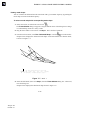
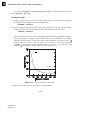
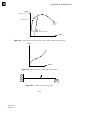
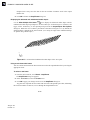
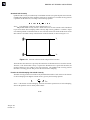
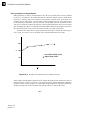
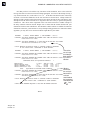
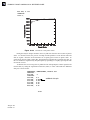
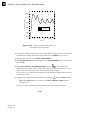
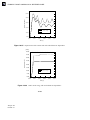
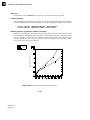
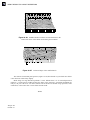
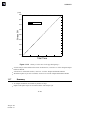
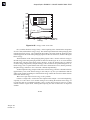
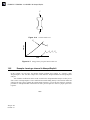
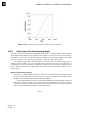
You now have a curve of time-displacement. What you need is a curve showing
force-displacement. This is easy to create because in this simulation the force applied to the
mount is directly proportional to the total time in the analysis. All you have to do to plot a
force-displacement curve is multiply the curve SWAPPED by the magnitude of the load (5.5 kN).
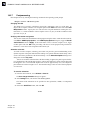
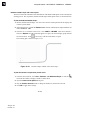
To multiply a curve by a constant value:
1. In the Operate on XY Data dialog box, click Clear Expression.
2. In the XY Data field, double-click SWAPPED.
The expression "SWAPPED" appears in the text field at the top of the dialog box. Your cursor
should be at the end of the text field.
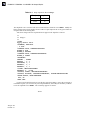
3. Multiply the data object in the text field by the magnitude of the applied load by entering
*5500.
4. Save the multiplied data object by clicking Save As at the bottom of the dialog box.
The Save XY Data As dialog box appears.
5. In the Name text field, type FORCEDEF; and click OK to close the dialog box.
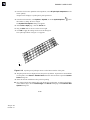
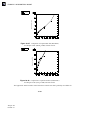
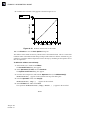
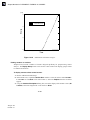
6. To view the force-displacement plot, click Plot Expression at the bottom of the Operate on
XY Data dialog box.
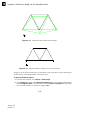
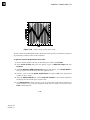
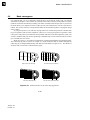
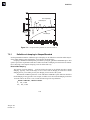
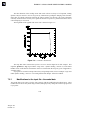
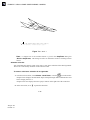
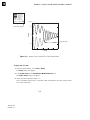
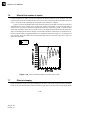
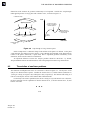
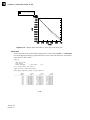
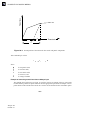
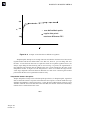
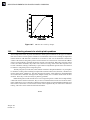
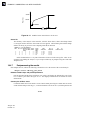
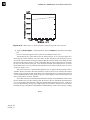
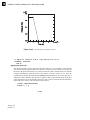
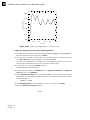
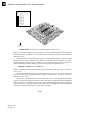
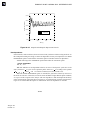
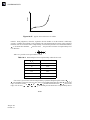
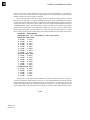
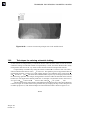
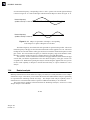
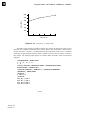
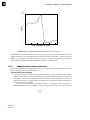
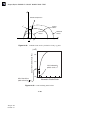
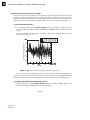
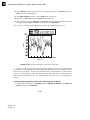
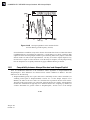
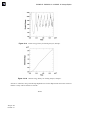
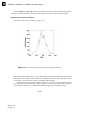
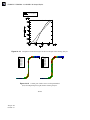
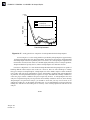
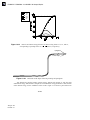
You have now created a curve with the force-deflection characteristic of the mount (the axis
labels do not reflect this since you did not change the actual variable plotted). To get the stiffness,
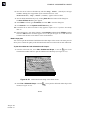
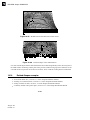
you need to differentiate the curve FORCEDEF. You can do this by using the differentiate( )
operator in the Operate on XY Data dialog box.
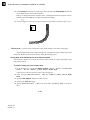
To obtain the stiffness:
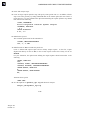
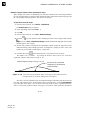
1. In the Operate on XY Data dialog box, clear the current expression.
2. From the Operators listed, click differentiate(X).
differentiate( ) appears in the text field at the top of the dialog box.
3. In the XY Data field, double-click FORCEDEF.
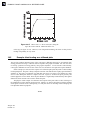
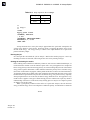
The expression differentiate( "FORCEDEF" ) appears in the text field.
4. Save the differentiated data object by clicking Save As at the bottom of the dialog box.
The Save XY Data As dialog box appears.
5. In the Name text field, type STIFF; and click OK to close the dialog box.
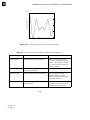
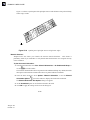
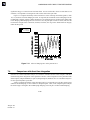
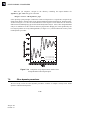
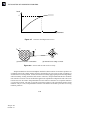
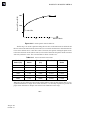
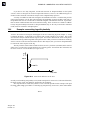
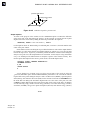
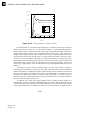
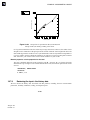
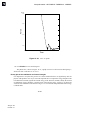
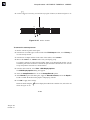
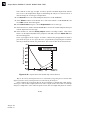
6. To plot the stiffness-displacement curve, click Plot Expression at the bottom of the Operate
on XY Data dialog box.
7. Click Cancel to close the dialog box.
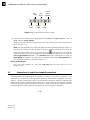
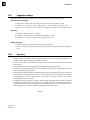
8. Open the Axis Options dialog box and switch to the Title tabbed page.
10–71
Abaqus ID:
Printed on: