1
SpectraVue
Spectral Analysis Program
Document Version 1.29
2007 Sept 20
MOETRONIX
www.moetronix.com
Table of Contents
1
Introduction V1.29 2007-09-20
5
1.1
Functionality
5
1.2
Example Uses
6
1.3
Getting Started
6
1.3.1
System Requirements
7
1.3.2
Installation
7
1.3.3
Uninstall
7
1.4
Program Overview
8
2
Program Details
9
2.1
Screen Views
10
2.1.1
Raw Data
10
2.1.2
2D FFT
10
2.1.3
3D FFT
12
2.1.4
V Waterfall
12
2.1.5
H Waterfall
13
2.1.6
Combo
14
2.1.7
Continuum
14
2.1.8
Phase
15
2.2
Controls
15
2.2.1
Center Frequency Control
15
2.2.2
Demod/Center Frequency Button16
2.2.3
Span Frequency
17
2.2.4
Save/Restore Buttons
17
2.2.5
FFT Ave
17
2.2.6
Smoothing
18
2.2.7
FFT Size
18
2.2.8
V Scale
18
2.2.9
NCO Null
18
2.2.10
Auto Scale
19
2.2.11
Manual Vertical Slide
20
2.2.12
Start/Stop/Pause/Cont
20
2.2.13
Clr Max FFT
20
2.2.14
MEM=FFT
21
2.2.15
Auto Delta
21
2.2.16
Auto MEM
21
2.2.17
NB
21
2.2.18
Mute Button
21
2.2.19
Frequency Lock Button
22
Copyright 2003
2007/09/20
2
2.2.20
Demod On Check Box
22
2.2.21
Demod Channel Select Button 22
2.2.22
RMS/PEAK S-Meter Select
24
2.3
Setup Menus
25
2.3.1
File Menu
25
2.3.2
View Menu
26
2.3.3
Input Source
26
2.3.4
Soundcard Input Setup
27
2.3.5
Wave File In setup
28
2.3.6
SDR-14 Setup
29
2.3.7
SDR-IQ Setup
31
2.3.8
Network SDR-xx Operation
32
2.3.9
Output Setup
36
2.3.10
General Setup
42
2.4
External Radio Setup
49
2.4.2
External Radio Operation Modes50
2.5
Demodulator Setup
54
2.5.1
Mode Selection
54
2.5.2
Demod Setup
55
2.5.3
Signal/Squelch Bar
57
2.6
Miscellaneous Displays
58
2.6.1
Info Box
58
2.6.2
Cursor Frequency Display
59
2.6.3
File Progress Bar
59
3
Technical Details
60
3.1
External Program Control
60
3.1.1
Registered Message
60
3.1.2
Example Message Handler
60
3.1.3
Example Message Sending
61
3.1.4
Available Command Definitions 61
3.2
Demodulator Section
3.2.1
NCO/Mixer/Decimation Stages 64
3.2.2
Demodulation Filters
65
3.2.3
AM Demodulator
66
3.2.4
AGC Compressor
68
3.2.5
FM Demodulator
68
3.2.6
SSB/CW Demodulator
69
3.2.7
DSB Demodulator
70
3.2.8
Re-sampler
70
3.2.9
Noise Blanker
71
63
Copyright 2003
2007/09/20
3
3.3
FFT Implementation
72
4
Operation Hints
73
4.1
Calibration
73
4.1.1
Sample Clock Frequency Calibration
4.1.2
Amplitude Calibration
73
77
Copyright 2003
2007/09/20
4
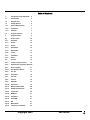
1 Introduction V1.29 2007-09-20
SpectraVue is a Windows based program that takes digitized signal data from a variety of sources
and displays the frequency domain spectrum on the PC screen . It also can be used to demodulate
various signals and output them to a soundcard or wave file. The input data can come from a
soundcard, a RIFF .wav file, or from special RF input capturing devices, SDR-14 or SDR-IQ.
www.rfspace.com
1.1 Functionality
Basic program functionality includes the following features:
Copyright 2003
2007/09/20
5
FFT analysis using 2048 to 262144 point FFT's (real or complex).
FFT amplitude resolutions from 10dB to .01dB per division.
FFT amplitude power is in dB referenced to full scale (a single sine wave with an amplitude of +/32767 or 16 bits).
Various FFT data view modes including waterfalls and 2D and 3D plots.
Display markers for accurate amplitude/frequency measurement.
A continuum display for measuring spectral power over the entire span and/or the peak power
within the span.
Frequency Spans from 5KHz to 30MHz in various step sizes. (Using SDR-xx unit)
Signal demodulation of AM, FM, WFM, USB, LSB, narrow CW modes when using the 50 to
190KHz Frequency Span and SDR-xx unit. Up to two separate demodulation channels can be
active simultaneously.
Programmable demodulation filters.
Saving and playback of captured spectrum using RIFF .wav files.
IF/Panadapter mode that allows external radios to be used in front of the SDR-xx and maintain
display frequency synchronization.
A variety of file saving options ranging from saving the raw data to saving demodulated audio to
saving various waterfall displays using .PNG or JPEG graphics file formats.
Network Client for remote SDR-xx operation.
1.2 Example Uses
General signal frequency domain analysis of spectra.
Radio Astronomy applications where very weak wide bandwidth signals can be viewed with up to
30MHz bandwidth and a 254 Hz bandwidth resolution.
Demodulating various signals and viewing signal activity over a 150KHz bandwidth in real time.
Storing and playing back sampled data for later analysis or demodulation.
Panadapter connected to IF of wideband general coverage receivers.
1.3 Getting Started
SpectraVue is a complicated program and it is suggested that the user familiarize ones self with the basic
operation of the program by spending a few minutes reading through this help file and by playing with the
Copyright 2003
2007/09/20
6
various features of the program. A little time spent in this way will reduce the frustration factor of learning a
new program and its controls.
1.3.1
System Requirements
In order to utilize all the features of SpectraVue a 1GHz Pentium 2 or better with 128M of memory is
required. Slower PCs can still be used if one is willing to accept slower displays and give up the real time
demodulation features.
Windows XP or Win2K is required.
The graphics card is probably the single most important item for maximizing the full potential of
SpectraVue and the SDR-xx. The faster the better.
In the FFT Setup menu there is a "Slow CPU Mode" spin control that the user can adjust to adapt slower
graphics cards/CPUs for best results. The tradeoff is that the display will skip updates to conserve CPU
time.
1.3.2
Installation
The SpectraVue distribution is contained in a single Setup.exe file. Execute this file from the CD or
wherever it is located. The install program will run and step you through the process. One can choose
alternate folders for the program and whether to automatically create a desktop icon and where to place
the shortcut in the Startup Menu.
The installer will create three folders under the SpectraVue main folder.
The \SDR14USBdriver folder contains the USB driver required by the SDR-14.
The \SDRIQUSBdriver folder contains the USB driver required by the SDR-IQ.
The \Palettes folder contains several .pal files that are optional palette files used for the waterfall colors.
The \FilterComp folder contain optional .fcf filter compensation files used for flattening out the SDR-xx filter
shapes.
The two main files for the program are "SpectraVue.exe" and a single dll file "IOModule.dll".
Several .ini files are included with some program settings for a few common modes. The file Specravue.ini
file is saved each time program exits and saves the users current settings.
The "spectravue.pdf" file is the help file which can be read using Acrobat Reader or similar programs.
1.3.3
Uninstall
The "unins000.exe" program can be used to uninstall SpectraVue from your computer or you can use the
shortcut placed in the Windows Program/Start Menu. If any additional files were created during use such
as .ini, .bmp, or .wav files, they will have to be manually deleted.
Copyright 2003
2007/09/20
7
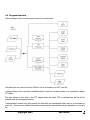
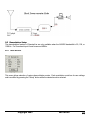
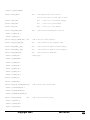
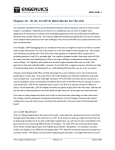
1.4 Program Overview
A block diagram of the overall program functions is shown below.
The data input can come from the an SDR-xx unit, a soundcard, or a RIFF .wav file.
A simple display of the raw data is available which is useful to set audio levels on a soundcard or adjust
DC offsets.
The data stream is then sent to the FFT engine where the basic FFT is calculated as well as all the
spectral peak and averaging functions.
A demodulation section may also process the data with the demodulated audio sent to a soundcard or
wave file. There is more detailed information concerning the demodulator section elsewhere in this help
file.
Copyright 2003
2007/09/20
8
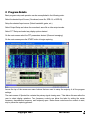
2 Program Details
Basic program setup and operation can be accomplished in the following order:
Select the desired Input Source. (Soundcard, wave file, SDR-14, or SDR-IQ)
Setup the selected Input source. (Select bandwidth, gains, etc.)
Select Output Setup and chose the soundcard, wave file or other output modes.
Select FFT Setup and select any display options desired.
On the main screen select the FFT parameters desired. (Size and averaging)
On the main screen press the START button to begin capturing.
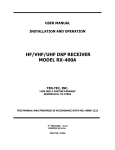
Across the top of the screen are menu buttons that are used to setup the majority of all the program
settings.
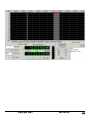
The main screen of SpectraVue contains the primary signal viewing area. Tabs below this area allow the
user to select display variations. Two frequency controls are below the tabs for setting the center
frequency, demodulation frequency, and frequency span. Below these controls are the controls to start,
stop or pause the capturing process.
Copyright 2003
2007/09/20
9
On the lower left are controls for adjusting the several FFT parameters. On the lower right are the
demodulation selection controls and also a general information box that show status and other information.
A slider control to the right of the main viewing screen is used to move the viewing window up and down to
place the displayed signal into view. The Auto Scale button will try and center the display automatically.
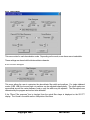
2.1 Screen Views
The main program contains a tabbed view screen where the user can click on a desired display mode tab.
There are seven different view screens that can be selected.
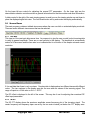
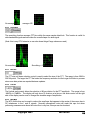
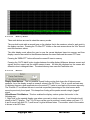
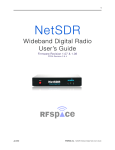
2.1.1
Raw Data
This view is of the raw input data versus time. Its purpose is to give the user a quick look at incoming data
to verify its general amplitude. There are no user controls to this display. The amplitude is automatically
scaled to fit the screen and the time axis is not calibrated but is a function of the sample rate and screen
resolution.
If it is real data then there is only one trace. Complex data is displayed as two different traces with different
colors. The two numbers in the display area are the max and min values of the incoming signal. The
range of inputs is a 16-bit value or 0 to +/- 32767.
The DC offset is displayed to the left of the screen. This may be of use for adjusting the soundcard DC
offset input parameters.
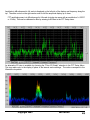
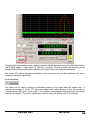
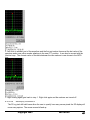
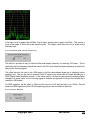
2.1.2
2D FFT
The 2D FFT display shows the spectrum amplitude versus frequency plot of the incoming signal. The
center frequency and frequency span are set by the two main controls just below the FFT display area.
Copyright 2003
2007/09/20
10
Amplitude in dB referenced to full scale is displayed on the left side of the display and frequency along the
top. The slider control on the right can be used to shift the amplitude display up or down.
FFT amplitude power is in dB referenced to full scale (a single sine wave with an amplitude of +/-32767
or 16 bits). This can be calibrated to dBm by entering a dB offset in the FFT Setup menu.
An alternative 2D view is available by choosing the "Color 2D Graph" selection in the FFT Setup Menu.
This view adds color to the display in place of the internal scale markings. The colors correspond to the
Waterfall color palette.
Copyright 2003
2007/09/20
11
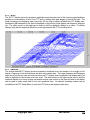
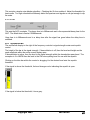
2.1.3
3D FFT
The 3D FFT display shows the spectrum amplitude versus frequency plot of the incoming signal and then
provides a running history in time of the FFT plot by shifting each past display up and to the right. The
center frequency and frequency span are set by the two main controls just below the FFT display area.
Amplitude in dB referenced to full scale is displayed on the left side of the display and frequency along the
top. The slider control on the right can be used to shift the amplitude display up or down. For better
displays, play with the amplitude offset bar on the right and also the FFT smoothing value.
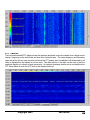
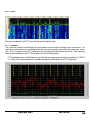
2.1.4
V Waterfall
The vertical waterfall FFT display shows the spectrum amplitude as a color instead of as a height on the
display. Frequency is the horizontal axis and time is the vertical axis. The center frequency and frequency
span are set by the two main controls just below the FFT display area. Amplitude in dB referenced to full
scale is displayed on the left side as a color scale. The slider control on the right can be used to shift the
amplitude display up or down in large increments and the spin control on the lower left side of the display
can be used to make small shifts in the color amplitude map. An optional timestamp feature can be
invoked(from the FFT Setup Menu) to mark the UTC time as the display scrolls down.
Copyright 2003
2007/09/20
12
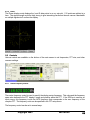
2.1.5
H Waterfall
The horizontal waterfall FFT display shows the spectrum amplitude as a color instead of as a height on the
display. Frequency is the vertical axis and time is the horizontal axis. The center frequency and frequency
span are set by the two main controls just below the FFT display area. Amplitude in dB referenced to full
scale is displayed on the topside as a color scale. The slider control on the right can be used to shift the
amplitude display up or down in large increments. An optional timestamp feature can be invoked(from the
FFT Setup Menu) to mark the UTC time as the display scrolls left.
Copyright 2003
2007/09/20
13
2.1.6
Combo
This view combines the 2D FFT view with the vertical waterfall view.
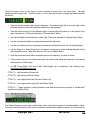
2.1.7
Continuum
The continuum display mode displays the total power over the entire frequency span versus time. An
optional secondary trace can be displayed that also shows the peak power within the same span versus
time. This is invoked from the FFT setup menu by selecting the Enable Peaks check box. Time stamping
can also be enabled(from the FFT Setup Menu) for this scrolling display.
FFT amplitude power is in dB referenced to full scale (a single sine wave with an amplitude of +/-32767
or 16 bits). This can be calibrated to say dBm by entering a dB offset in the FFT Setup menu.
Copyright 2003
2007/09/20
14
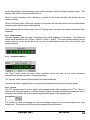
2.1.8
Phase
The Phase display mode displays the I and Q data points in an x-y axis plot. 512 points are plotted at a
time. The signal strength must be fairly strong to give interesting results and also as narrow a bandwidth
so multiple signals don't confuse the display.
2.2 Controls
Various controls are available on the bottom of the main screen to set frequencies, FFT size, and other
common settings.
2.2.1
Center Frequency Control
The center frequency control is used to specify the display center frequency. This value and the frequency
span value determine the FFT display's range and position within the FFT. If the SDR-xx is used as an
input source, this frequency is also the NCO frequency that corresponds to the zero frequency of the
complex FFT. The frequency units can be specified in the FFT setup menu.
The frequency control can be set in several ways.
Copyright 2003
2007/09/20
15
Place the mouse cursor on the digit you wish to change or press one of the arrow keys. The digit
background will change color. Use the mouse or left or right arrow keys to change digit positions within
the control.
Type the desired numeric digit using the keyboard. The selected digit will move to the right so that
an entire frequency value can simply be entered from the keyboard.
Click the mouse on the top of the selected digit to increment that digit value or on the bottom of the
digit to decrement it. (This mode selected in “General Setup” Menu)
Use Left and Right mouse buttons to inc/dec digit. (This mode selected in “General Setup” Menu)
Use the mouse scroll wheel to increment/decrement the digit value.
Use the up or down arrows to increment or decrement that digit value and zero all following digits.
Use the Page Up or Page Down keys to increment or decrement just the selected digit and not the
entire frequency value. (digit value does not roll over to adjacent digits)
Click the left mouse button within the display area on the frequency you wish to center.
If the mouse cursor is in the display area then the mouse scroll wheel will increment or decrement
the frequency in 100Hz steps.
A USB "Power Mate" knob from Griffin Technologies can be mapped to the following keys:
http://www.griffintechnology.com/
CTRL-F1 = digit decrement (Rotate Left)
CTRL-F2 = digit increment (Rotate-Right)
CTRL-F3 = move digit position left (Click and Rotate Left)
CTRL-F4 = move digit position right (Click and Rotate Right)
CTRL-F5 = Toggle frequency control between center and demod function.(Actually a "double-click"
operation is required.(Click)
2.2.2
Demod/Center Frequency Button
The Center frequency control has a dual function when running the program in the demodulation mode.
This button sets the function of the control to either the normal center frequency control or it can be used to
Copyright 2003
2007/09/20
16
set the demodulation center frequency which can be anywhere within the display frequency span. This
button is only active if in the demodulation mode.
When in Center Frequency mode, clicking on a position of the screen will make that position the new
center frequency.
When in the Demo mode, clicking on a position of the screen will make that position the new demodulator
frequency and keep the center frequency fixed.
When operating with an external radio in the HF Tracking mode, this button also selects the external radio
frequency.
2.2.3
Span Frequency
The span frequency sets the range of frequencies that will be displayed on the screen. The display will
always show frequencies from Center - Span/2 to Center + Span/2. The control operates exactly as the
center frequency control except the arrow keys do not automatically invoke the control like the main
frequency control.
2.2.4
Save/Restore Buttons
The “Save” Button under the main center frequency control will save all the current frequency
settings(center and demodulator) to temporary memory.
The “Restore” button restores the frequencies from their saved state.
This button is useful for getting back to a known spot perhaps after tuning around for other signals.
2.2.5
FFT Ave
The FFT average control is used to specify an averaging function that is applied to the FFTs. This is a
point by point running average up until the number of samples reaches the specified average limit then it
becomes a low pas filter with a time constant approximately equal to the averaging value.
This function is useful in averaging out noise and allowing a signal to be more easily viewed in a noisy
background. The down side is that fast moving signals will become blurred.
Copyright 2003
2007/09/20
17
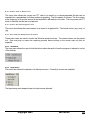
No average
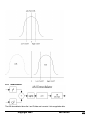
2.2.6
average=100
Smoothing
The smoothing function averages FFT bins within the same sample data block. This function is useful for
wide bandwidth signals and smoothes the overall shape of a wide signal.
(Note: this is very CPU intensive so can slow down things if large values are used)
No smoothing
2.2.7
Smoothing = 6
FFT Size
The FFT size pull down selection control is used to select the size of the FFT. The range is from 2048 to
262144 points. The larger the FFT the better the frequency resolution but the longer it will take to process
since more data points are required between updates.
2.2.8
V Scale
The Vertical scale control allows the selection of dB per division for the FFT amplitude. The range is from
.2dB/Div to 10dB/Div. The display will only show 14 divisions at a time so the slider control on the right
side of the display can be used to change the viewable range of amplitudes.
2.2.9
NCO Null
The NCO Null button can be used to reduce the small spur that appears in the center of the screen due to
DC imbalances in the I and Q signals. Normally atmospheric noise will mask this spur but when
performing measurements where the noise floor is very low, this spur can be dominant.
Copyright 2003
2007/09/20
18
Pressing this button initiates an auto notching procedure that will attempt to remove the DC offsets on the I
and Q digital signals. It takes about 10 seconds to complete. One must make sure there are no real
signals present when performing this calibration so it is best to have the antenna disconnected.
The center NCO spur is frequency dependent so the procedure must be done whenever the center
frequency is changed significantly.
2.2.10 Auto Scale
This button can be used to perform an automatic centering of the signal within the display area. It
performs an average of all the FFT points and adjusts the vertical position so that the average is
somewhere near the bottom of the screen. This function is automatically invoked whenever the vertical
resolution is changed. This control is particularly useful in finding the display trace if it is off screen.
Copyright 2003
2007/09/20
19
2.2.11 Manual Vertical Slide
This control is used to move the viewable vertical window of the display. The control can be changed by
dragging the control arrow or by clicking on either side of the arrow. The total range of the display is -170
to 170 dB referenced to full scale.
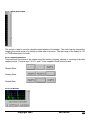
2.2.12 Start/Stop/Pause/Cont
Three buttons at the bottom of the screen control the starting, stopping, pausing, or resuming of the data
capture process. Function keys F10, F11, and F12 are mapped to these buttons as well.
Stopped State:
Running State:
Paused State:
2.2.13 Clr Max FFT
Copyright 2003
2007/09/20
20
This button is used to reset the max hold buffer when the maximum hold display is active.
2.2.14 MEM=FFT
This button is used to store the current FFT display into the reference buffer when the delta FFT mode is
active.
2.2.15 Auto Delta
This control auto scales the display to show the FFT delta buffer.
2.2.16 Auto MEM
This control auto scales the display to show the FFT stored memory buffer.
2.2.17 NB
This control toggles the Noise Blanker on and off. The noise blanker threshold and a duplicate on/off
control are in the Demod Setup Menu.
2.2.18 Mute Button
This control button toggles the squelch control to a mute position and back to its previous setting. It is a
way to quickly mute the audio without shutting down the entire capture session. The button turns red
when muted.
Copyright 2003
2007/09/20
21
2.2.19 Frequency Lock Button
The small button just to the left of the main frequency control can be pressed to lock the frequency display.
The button will turn red indicating a locked condition.
Pressing it again will unlock the frequency display.
This is useful to keep from accidentally moving off frequency.
2.2.20 Demod On Check Box
The “Demod On” checkbox enables or disables the demodulator section. It is only available when the
SDR-xx bandwidth is between 50KHz and 150KHz.
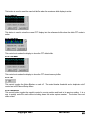
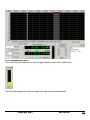
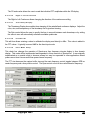
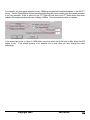
2.2.21 Demod Channel Select Button
This button only appears when the dual demod mode is active.
The button labeled “Demod 0 or “Demod 1” is used to toggle between the two demodulator channels. It
indicates the current frequency and mode of that demodulator channel
The two figures below show the screen display before and after toggling the demod button. Note the
frequency marker is a bright red for the selected channel and a dull red for the non-selected channel.
Copyright 2003
2007/09/20
22
Copyright 2003
2007/09/20
23
2.2.22 RMS/PEAK S-Meter Select
The button below the S-Meter bar is used to toggle between a peak mode or RMS mode.
The Peak mode displays the maximum signal peak within the selected bandwidth.
Copyright 2003
2007/09/20
24
The RMS mode displays the RMS power within the specified bandwidth.
2.3 Setup Menus
Various setup menus are accessible along the top of the program screen.
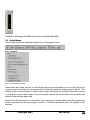
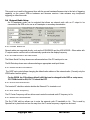
2.3.1
File Menu
2.3.1.1 Load/Save Setup
These menu items allow the user to save all the program setup information into an .ini file that can be
uniquely named and loaded into the program later to restore the particular settings saved in the file. This
allows the user to create a library of various custom setups that can then be quickly loaded without having
to setup all the various options again. The most recently used file list can be clicked on to recall the last
several ini files that have been used.
Note that the file Spectravue.ini is the primary file for saving your settings when exiting the program and
will be overwritten each time the program is exited. It is loaded automatically when the program is first
executed.
Copyright 2003
2007/09/20
25
2.3.1.2 Save FFT to Excel File
This menu item allows the current raw FFT data to be saved to a comma-separated file that can be
imported into a spreadsheet for further analysis or graphing. The file contains 2 columns. The first column
is the frequency in Hz and the second is the amplitude in dB relative to full scale. This only saves one FFT
block of data that was the last one captured.
2.3.1.3 Save Screen Graphics File
This menu item allows the current screen to be saved to a graphics file. The format can be .png, .bmp, or
.jpg.
2.3.1.4 Print/Print Setup/Print Preview
These menu items are used to invoke the Windows printer functions. The current screen can be printed
out. One must stop or pause the capturing process before printing or the screen may not print as
expected.
2.3.2
View Menu
The view menu allows the user to hide the bottom status bar and/or force the program to always be on top
of the desktop.
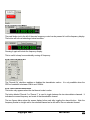
2.3.3
Input Source
This menu item allows the selection of a data input source. Currently 4 sources are available.
The Input setup menu depends upon the input source selected.
Copyright 2003
2007/09/20
26
2.3.4
Soundcard Input Setup
The Soundcard can be selected with the pull down menu or one can use the default Windows
soundcard.
The sample rate must be specified and can range from 5000 to 96000 SPS. (Many soundcards will
not operate above 48000 SPS)
The bandwidth limit depends upon whether the Stereo (Complex) mode is chosen. The maximum
BW is the sample rate if Complex or 1/2 the sample rate it mono (real) data.
The Center frequency is an offset that is applied to the display. This is useful in applications where
the soundcard is used to process base band I/Q inputs from complex mixers. The Center
frequency would be the mixer oscillator frequency.
The Swap I/Q button can swap the left and right channels that will invert the spectrum.
The I/Q Comp section is used to adjust for DC offsets in the I/Q channels. By watching the Raw
Data display (center number is DC offset) one can minimize the DC offset. Adjust the I offset to
make the Green line closer to zero and the Q offset to make the red line closer to zero. The affect
of a DC offset is a large spur in the center of the 2D FFT display.
The alpha and beta controls can be used to compensate for any phase errors between the I and Q
channels. The affect of a phase error is a reduction in sideband rejection. (A carrier will appear
mirrored on the opposite side of the FFT display)
The Sample Offset is a gross adjustment in case a soundcard is off by a complete sample between
the I and Q channels. (One USB soundcard chip has a bug so that I and Q are one sample time
apart.)
Copyright 2003
2007/09/20
27
2.3.5
Wave File In setup
The Wave file input menu allows the user to specify the wave file path and also whether to invert
the spectrum or play the file back in a continuous loop.
Depending on the file, several parameters are displayed along with the name. The first line shows
the file size in samples, the file sample rate, and whether the data is real or complex.
The second line may show the captured data center frequency, the A/D frequency, and display
bandwidth if the SDR-xx was used to generate the wave file.
The third line may show the capture starting time if the file was created with SpectraVue. This is
used to show the original UTC time when playing back wave files. Note that if a capture was
paused or the center frequency changed during creation, then the file data will not be correct for the
entire file.
Wave files created with a program other than SpectraVue will not contain some of the above information.
Copyright 2003
2007/09/20
28
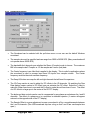
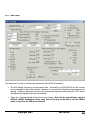
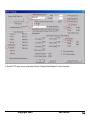
2.3.6
SDR-14 Setup
This setup menu is used to set the main parameters of the SDR-14 hardware.
The A/D Sample Frequency can be entered here. Nominally it is 66,666,667Hz but this number
can be changed to the actual oscillator frequency if more accurate frequency measurements are
desired. Entering a reference frequency and a measured frequency and pressing the "Calc" button
will calibrate the sample frequency automatically.
There are 13 fixed bandwidth setups that can be chosen. If the 30MHz bandwidth is selected, the
AD6620 down converter is bypassed and the entire 33.3 MHz wide A/D data is directly processed
by SpectraVue using a real mode FFT.
Note that for demodulation, only the 50KHzto 190KHz bandwidths can be used. Some PC’s may
not be able to use the 190KHz mode as it pushes the USB bus to the limit.
The AD6620 settings area of the screen displays the current AD6620 decimation rates and filter sizes.
The AD6620 IF gain can be selected from 0 to +24dB in 6dB steps. This value is best kept at +24dB
unless very strong signals are being analyzed and the SDR-14 is being overloaded.
Copyright 2003
2007/09/20
29
The input source can be selected as either direct to the A/D (ch0) or through a preamp and a
30MHz low pass filter (ch1).
Note The direct A/D input should not be directly connected to an antenna. It requires a
bandpass filter and preamp in order to be used as a harmonic sampling receiver above 30MHz.
It is also not protected from voltage spikes and ESD events.
If ch1 is used, the preamp/attenuator RF gain can be selected. The "Calibrated screen" check box
forces the display to remain calibrated regardless of RF gain setting.
If the red clipping light flashes on the SDR-14, use the Channel 1 RF Gain setting to add
attenuation until the red light does not flash. ( it is normal for a random flash to occur during normal
operation due to transients on the antenna)
If the Network Interface is selected, the edit boxes for the desired IP and port addresses are used
to specify the IP address and port. This feature is an option and requires a separate USB to
TCP/IP Server application running to be able to use.
External Radio/Panadapter setup is described in a separate section under Program Details.
The Firmware update button enables a menu to update the SDR-14's internal firmware. One
opens the update .hex file and presses Start to begin the firmware update. The SDR-14 must be
attached and powered up for this menu to be used.
The External HW Sync should remain unchecked for normal operation of the SDR-14.
Copyright 2003
2007/09/20
30
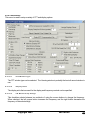
2.3.7
SDR-IQ Setup
This setup menu is used to set the main parameters of the SDR-IQ hardware.
The A/D Sample Frequency can be entered here. Nominally it is 66,666,667Hz but this number
can be changed to the actual oscillator frequency if more accurate frequency measurements are
desired. Entering a reference frequency and a measured frequency and pressing the "Calc" button
will calibrate the sample frequency automatically.
There are 7 fixed bandwidth setups that can be chosen. Note that for demodulation, only the
50KHzto 190KHz bandwidths can be used. Some PC’s may not be able to use the 190KHz
mode as it pushes the USB bus to the limit.
Copyright 2003
2007/09/20
31
The AD6620 settings area of the screen displays the current AD6620 decimation rates and filter sizes.
The AD6620 IF gain can be selected from 0 to +24dB in 6dB steps. This value is best kept at +24dB
unless very strong signals are being analyzed and the SDR-IQ is being overloaded.
The RF Gain selection allows using fixed 10dB step settings or one can enter a variable value for
the preamp. A separate 10dB fixed attenuator can be activated along with the variable gain
preamp. Note that high gain preamp settings will not improve the receiver noise figure above a
certain level but will just raise the noise floor and reduce the dynamic range.
If the Network Interface is selected, the edit boxes for the desired IP and port addresses are used
to specify the IP address and port. This feature is an option and requires a separate USB to
TCP/IP Server application running to be able to use.
External Radio/Panadapter setup is described in a separate section under Program Details.
The Firmware update button enables a menu to update the SDR-IQ's internal firmware. One
opens the update .hex file and presses Start to begin the firmware update. The SDR-IQ must be
attached and powered up for this menu to be used.
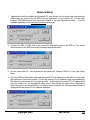
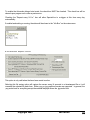
2.3.8
Network SDR-xx Operation
If the network interface is selected instead of the USB interface, a TCP/IP socket is used as the source for
the SDR-xx data. By running a server utility program (SDR14Server) on a remote PC, and SpectraVue on
another PC, one can access the SDR-14( or SDR-IQ) over a wired or wireless network connection.
Copyright 2003
2007/09/20
32
Copyright 2003
2007/09/20
33
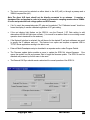
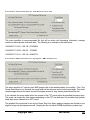
Network Setup
1. SpectraVue should be installed on the remote PC even though it is not going to be used since the
USB drivers are required by the SDR14 server application. On the remote PC, run the utility
program "SDR14Server.exe" that should be installed in the main SpectraVue folder. . It is also
available separately on the www.moetronix.com web pages.
2. Connect the SDR-14 USB cable to the remote PC and apply power to the SDR-xx. The server
should connect to the SDR-xx and the following status should result.
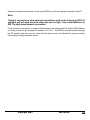
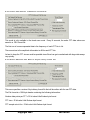
3. On the users client PC, start SpectraVue and select the "Network SDR-xx" in the Input Setup
Menu.
4. Go to the SDR-xx Setup Menu and enter the remote PC's IP address into the edit box at the lower
right hand part of the menu screen. (To find the remote PC's IP address, open a command(dos)
box window on the remote PC and type "ipconfig". It will display the remote PC's IP address that
must be entered into the SpectraVue setup menu.) After exiting the setup menu, SpectraVue
should connect to the remote SDR-xx and on the remote computer, the following status should be
displayed(with the remote PC's IP address displayed)
Copyright 2003
2007/09/20
34
SpectraVue should now be able to run the remote SDR-xx as if it were directly connected to the PC.
Note:
Trying to connect over slow network connections such as the Internet or 802.11b
systems, will not work since the data rates are too high. Use a wired Ethernet or
802.11g high speed network connection.
To aid in testing out a system, one can run SpectraVue on the same remote PC that the SDR14Server
is running on and use the loopback IP address of 127.0.0.1. The SDR-xx data will loopback through
the PC network stack and one can verify that the remote server and SpectraVue setup is working
before trying to debug a network system.
Copyright 2003
2007/09/20
35
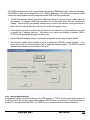
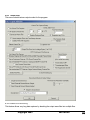
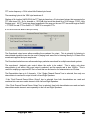
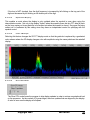
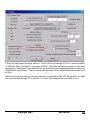
2.3.9
Output Setup
This menu selects various output modes for the program.
2.3.9.1 Wave File Chaining
This feature allows very long data captures by breaking the output wave files into multiple files.
Copyright 2003
2007/09/20
36
The checkbox for chaining multiple files enables a mode where SpectraVue will write to a wave file until
the maximum file size limit is reached and then close that file and start writing to a new file. These
filenames are created from the name provided by the user with a time and date label added to the end of
each filename.
For example if the user chooses a filename of "test.wav" and the chaining feature is enabled, the filename
will be changed to "test_YYMMDD_HHMMSS.wav" where YY is the last 2 digits of the year, MM is the
month, DD is the day, HH is the hour, MM is the minute, and SS is the second. All times and dates are 24
hour UTC time.
The file chaining will continue indefinitely so it is up to the user to make sure enough drive space is
available. It is a good idea to set the file size limit as big as you can deal with to prevent a large number of
files being produced. Perhaps 640 Megs or so would be a good number so it could easily be archived to a
CD.
The SDR-xx can create very large files very quickly so it is a good idea to be aware of how much
space is available and how fast SpectraVue can create large files.
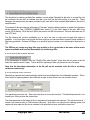
2.3.9.2 Qualify Write With Squelch
If the demodulator is enabled, then the "Qualify Write with Squelch" check box will only save to the file
when the squelch control is open. This is useful for capturing to disk only the active time of a signal.
Note that the timestamp information in the file will not be accurate since the file is not being
written to continuously.
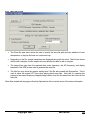
2.3.9.3 Delayed Start Function
SpectraVue captures can be automatically started at a user-defined time for unattended operation. This is
most useful for capturing data to wave files late at night or when there is no one around to start it.
Two parameters must be set. One is the start time in hours and minutes. This allows SpectraVue to be
started up to 24 hours from the current time.
The other parameter is the length of time in minutes that is desired to be captured. The minimum time is 1
minute; the maximum time is 1440 minutes (24hours). Note that if not using the file chaining mode, the
capture will stop when the file size is reached or the specified run time, whichever occurs first.
Copyright 2003
2007/09/20
37
To enable the Automatic delayed start mode, the check box MUST be checked. This check box will be
cleared upon program exit or after a previous run.
Checking the “Repeat every 24 hr.” box will allow SpectraVue to re-trigger at this time every day
automatically.
If enabled and waiting or running, the status will be shown in the "Info Box" on the main screen.
2.3.9.4 Screen Capture to File
This option is only valid when the timed save mode is active.
Selecting this file saving option will capture the screen every N seconds to a timestamped file or it will
overwrite the selected file each time. Either .png or .jpg graphics formats are supported. In general, the
.png works best for everything except the waterfall displays where the .jpg works best.
Copyright 2003
2007/09/20
38
2.3.9.5 Save Continuum Data as .CSV Excel Format File
This menu specifies a comma-separated file that will be written with timestamp information, average
continuum data and peak continuum data. The following is an example of the data format:
12/02/2003 17:23:01, -108.132, -63.530954
12/02/2003 17:23:06, -108.457, -75.24949
12/02/2003 17:23:11, -108.143, -69.852774
2.3.9.6 Save Waterfall Data as 1 byte/pixel
BMP Format File
This menu specifies a 1 byte per pixel .BMP graphics file of the waterfall display to be written. If the "Use
Screen Resolution box is checked, the image width will be the same as the screen pixel width. This mode
creates images that are the same size as the program screen for easy viewing and reduced file size.
If not checked, the image width will be the number of the FFT points within the specified frequency span.
This mode can create very wide images depending on the FFT size and span but provides much greater
detail than can be obtained on a CRT screen.
The graphics files are limited in size by the Output Size limit. Many graphics programs are limited to how
large an image can be displayed as well. Keeping the file size below 100MB is probably a prudent step.
Copyright 2003
2007/09/20
39
2.3.9.7 Save FFT Data as .CSV Excel Format File
This mode is only available in the timed save mode. Every N seconds, the entire FFT data values are
saved to a .CSV format file.
The first row of comma separated data is the frequency of each FFT bin in Hz.
The second row is the amplitude information in dB for each FFT bin.
Its best to keep the FFT size as small as possible since Excel can get overwhelmed with large data arrays
very quickly.
2.3.9.8 Save Absolute FFT Data as 2 byte binary format file
This menu specifies a custom 2-byte binary format file that will be written with the raw FFT data.
The File format is a 1024 byte header containing the following information:
Number data points per FFT = 32 bit value Little Endean byte format
FFT size = 32 bit value Little Endean byte format
FFT sample rate in Hz = 32 bit value Little Endean byte format
Copyright 2003
2007/09/20
40
FFT center frequency = 32 bit value Little Endean byte format
The remaining bytes in the 1024 byte header are 0.
Starting at file location 0x400(1024) the FFT data is placed as a 2 byte signed integer that represents the
FFT data times 100. So for example a -135.23dB point would be saved as a 16-bit integer -13523, Little
Endean word. All FFT points are saved regardless of the span so the next FFT line would begin at 0x400
+ FFTSIZE for real FFTs or 0x400 + FFTSIZE*2 for complex FFTs.
2.3.9.9 Soundcard/Demod Output Setup
The Soundcard output menu allows enabling the soundcard for output. This is primarily for listening to
demodulated signals but can also be used in playing back wave files or listening directly to I/Q data if the
soundcard supports the input sample rate.
The Soundcard selection menu allows selecting a particular soundcard for multiple soundcard systems.
The non-demod playback gain control allows the audio to be scaled. This is active only when
demodulation is not active, the sound output is selected, and the sample rate is less 100KHz. This is
useful for amplifying a captured RF file to a level that can be heard or for retransmission as I/Q data.
The Demodulator has up to 2 channels. If the “Single Channel Demod” box is selected, then only one
demodulator is used and is output to both Left and Right Speakers.
If the “Dual Channel Demod Mono Output” box is selected, then both demodulators are used and
combined into one mono audio stream to both Left and Right Speakers.
If the “Dual Channel Demod Stereo Output” box is selected, then both demodulators are used and each
demodulator audio stream is sent separately to the Left and Right Speakers.
Copyright 2003
2007/09/20
41
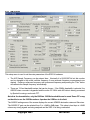
2.3.10 General Setup
This menu is used to setup a variety of FFT and display options.
2.3.10.1
FFT Window Type
The FFT window type can be selected. The Hanning window is probably the best all around window to
use.
2.3.10.2
Display Units
The display units that are used for the display and frequency controls can be specified.
2.3.10.3
L/R Button Freq Change
This checkbox selects between two mehtods of using the mouse buttons to change the frequency.
When checked, the left mouse button increases the frequency and the right button decreases the
frequency of the selected digit.
Copyright 2003
2007/09/20
42
If the box in NOT checked, then the digit frequency is increased by left clicking on the top part of the
digit and decreased by left clicking on the bottom part of the digit.
2.3.10.4
Squelched Display
This enables a mode where the display is only updated when the squelch is open when using the
demodulation modes. Not only is the display "frozen" when the squelch closes but any FFT data file such
as the .bmp capture or binary data file is not written into when the squelch is closed. Any wave file being
written into is unaffected by this setting since they have an independent control for qualifying with the
squelch control.
2.3.10.5
Color 2D Graph
Selecting this feature changes the 2D FFT display mode so that the graticule is replaced by a graduated
color scheme where the 2D display changes color with amplitude using the same palette as the waterfall
display.
2.3.10.6
Slow CPU Mode
The Slow CPU mode forces the program to skip display updates in order to reduce computational load
on the processor. As the number of N grows larger, the more updates that are skipped by the display.
A value of zero runs the display at full speed.
Copyright 2003
2007/09/20
43
2.3.10.7
Mouse Click Resolution
This group of menu items allows the selection of how to round off the frequency when using the mouse to
click close to a signal on the display.
2.3.10.8
JPEG Compression Quality
The image quality of the .jpg compression can be adjusted. One trades off quality for smaller files. The
larger the number, the larger the file and better the quality. .PNG files are best used for all images except
waterfalls. The 2D graphs compress very well with .PNG and there is no image quality loss.
2.3.10.9
Display Update Rate
The Display update rate edit box can be used to cause the display rate to be very slow to allow long
waterfall or continuum captures. The value is from 0 to 60 seconds between updates in 1-second
steps.
2.3.10.10
Assign Display Colors
A submenu allows for changing various display item colors.
Copyright 2003
2007/09/20
44
2.3.10.11
Select Waterfall Color Palette File
A submenu allows one to pick a different waterfall palette file for use with the waterfall displays. *.pal
files are used that are text files that contain a table with 256 rows representing power (1st row highest
power). Each row contains an R,G,B value each with a range of 0-255.
Example format for a couple of rows:
25 255 171
41 232 0
……..
2.3.10.12
Select FFT Compensation File
A submenu allows one to pick a FFT compensation file. A special file can be invoked to flatten out the
filter responses of some of the SDR-xx IF filters. This is useful when doing extremely weak signal
analysis and removes the ripple from the filter pass band.
These files have an extension of .fcf and a name corresponding to the AD6620 filter bandwidth that it
will compensate.
For example the file "Filter1500.fcf" is used to compensate the 1500KHz BW AD6620 filter setting.
Before:
After:
Copyright 2003
2007/09/20
45
2.3.10.13
Memory Modes
Three radio buttons are used to select the memory modes.
The max hold mode adds a second trace on the displays that is the maximum value for each point in
the display over time. Pressing the "Clr Max FFT" button on the main screen above the "info" box will
reset the maximum values.
The delta display mode allows the user to save the current displayed trace into memory and then
display a second trace which is the difference between the stored trace and the current FFT trace.
Pressing the "MEM=FFT" button will save the current fft trace to memory.
Pressing the "AUTO delta" button toggles between the delta display (difference between current and
stored) and the current and the stored memory traces. All three are displayed on the screen with
different colors to distinguish them. The stored memory trace uses the Peak trace color.
2.3.10.14
Markers
Display Peak Markers - This box enables a peak finding routine that shows the 4 highest power
peaks as x's on the display as well as numeric values in the INFO box. This is a more accurate way
of obtaining frequency and amplitude since the actual FFT value is used and not the screen accuracy.
The “Exclude %” box allows the user to exclude a specified percentage of the total screen width
around a previously found peak. This keeps from finding all the peaks around a single “jagged”
signal.
Allow Mouse Click Markers - This box enables the display marker system that works in the
following way:
1. Right click on the spectral display near where you want to attach a marker. A red triangle should
attach to the FFT display. The F3 to F8 keys can be used to position it exactly where you want. F3,
4,and 5 move it left while F6, 7,and8 move it right at different rates. The numeric value of the marker
is shown in the INFO box.
Copyright 2003
2007/09/20
46
2. Left click on another part of the waveform and the first red marker freezes at the last value of the
spectrum and a new yellow marker attaches to the new FFT position. It can also be moved with the
function keys. The numeric value of the delta between the two markers is now shown in the INFO
box.
3. Right clicking again gets back to step 1. Right click again and the markers are turned off.
2.3.10.15
3D Display Parameters
The 3D xy pixel shift edit boxes allow the user to specify how many screen pixels the 3D display will
move every capture. The screen moves left and up.
Copyright 2003
2007/09/20
47
The 3D scale value allows the user to scale the individual FFT amplitudes within the 3D display.
2.3.10.16
Right to Left Continuum
The Right to Left Continuum allows changing the direction of the continuum scrolling.
2.3.10.17
Time Stamp Display
The Timestamp Display box enables time stamping of the waterfall and continuum displays. Adjust the
color, size, and transparency of the timestamp font to give best viewing.
The Spin control allows the user to specify the time in seconds between each timestamp or by setting
the value to zero will automatically calculate a suitable update rate.
2.3.10.18
FFT Max dB
This edit box allows entering a value to calibrate the display read directly in dBm. This value is added to
the FFT values. It typically is around 4dB for the direct input mode.
2.3.10.19
Pulse Mode Setup
This check box changes the operation of Spectravue from frequency domain display to time domain
display. This mode will be implemented and expanded in future versions of SpectraVue. It was originally
implemented as a special mode to observe pulsars but may be expanded to other applications where
power versus time is more useful than power versus frequency.
The FFT size becomes the capture buffer size and the main frequency control toggles between SDR-xx
center frequency and a time position control. The Span control now is in time units instead of frequency.
Copyright 2003
2007/09/20
48
This mode is not useful at the present time with the current hardware/firmware due to the lack of triggering
capability on the current SDR-xx hardware and firmware versions. Later releases may incorporate
triggering to utilize this mode.
2.4 External Radio Setup
An IF/Panadapter mode can be selected that allows an external radio with an IF output to be
connected to the SDR-xx for use as a Panadapter or secondary demodulator.
2.4.1.1 Radio Selection
Several radios are supported directly, such as the ICOM R8500 and the AOR AR5000. Other radios with
IF outputs can be used but will not automatically synchronize the display frequency.
2.4.1.2 Communication Port Selection
The Select Serial Port drop down menu allows selection of the PC serial port to use.
The Bit Rate drop down menu allows selecting an appropriate serial port bitrate.
2.4.1.3 External Device Address
The “ADR” spin control allows changing the default radio address of the external radio. (Currently only the
ICOM radios use this option.)
For the R8500, the CIV address default is 4AH but can be changed in the SDR-xx setup menu,
CIV TRAN should be ON, CIV 731 should be OFF.
2.4.1.4 Inverted IF Selection
The Inverted IF checkbox selects whether the External IF is inverted or not.
2.4.1.5 IF Center Frequency
The IF Center Frequency edit box allows one to enter the external radio IF frequency in Hz.
2.4.1.6 External IF Bandwidth
The Ext IF BW edit box allows one to enter the external radio IF bandwidth in Hz. This is used by
SpectraVue to place limits on how far away from the IF center frequency a signal can be tuned.
Copyright 2003
2007/09/20
49
2.4.1.7 External Center Frequency
The Ext Center Frequency edit box allows one to enter the external radio center frequency in Hz. This is
automatically set if a serial port connection is available to the radio. If the external radio is not supported or
is a block down converter, then the frequency must be entered manually here.
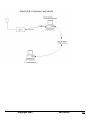
2.4.2
External Radio Operation Modes
The following diagrams show the general hook up schemes.
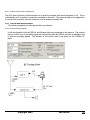
2.4.2.1 HF Tracking Mode
In this configuration, both the SDR-xx and External radio are connected to the antenna. The external
radio is used to tune to a specific signal and demodulate while the SDR-xx provides a wideband view
of all the surrounding signals. The limitation of this mode is that it only works on the 0-30MHz HF
band.
Copyright 2003
2007/09/20
50
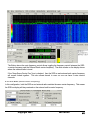
The Button above the main frequency control allows toggling the frequency control between the SDRxx center frequency and the External Radio center frequency. The white marker on the display shows
where the external radio is tuned.
If the “Keep Same Center Freq” box is checked, then the SDR-xx and external radio center frequency
will remain locked together. This also allows demod to occur so one can have 2 extra receive
channels.
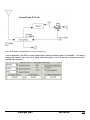
2.4.2.2 IF Mode (Same Center Frequency)
In this configuration, both the SDR-xx and external radio maintain the same center frequency. This means
the SDR-xx display will stay centered on the external radio’s center frequency.
Copyright 2003
2007/09/20
51
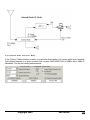
2.4.2.3 IF Mode (Independent Center Frequency)
In this configuration, the SDR-xx tunes independently within the external radio’s IF bandwidth. This allows
keeping the external radio tuned to a signal while being able to tune all around on signals around the
external radio frequency.
Copyright 2003
2007/09/20
52
2.4.2.4 Block Down Converter Mode
If the “Custom” Radio selection is made, one can enter fixed values for a custom block down converter.
The following example is a down converter that converts 8.432123456 GHz to 28MHz with a 4MHz IF
Bandwidth. It is also an inverting downconverter.
Copyright 2003
2007/09/20
53
2.5 Demodulator Setup
The demodulation features of SpectraVue are only available when the AD6620 bandwidth is 50, 100, or
150KHz. For Soundcard input it must be around 48KHz.
2.5.1
Mode Selection
This menu allows selection of various demodulation modes. Each modulation mode has its own settings
and is modified by pressing the "Setup" button while the desired mode is selected.
Copyright 2003
2007/09/20
54
2.5.2
Demod Setup
This menu exists for each demodulator mode. Depending on the mode, some items are not selectable.
These settings are shared with both demodulator channels.
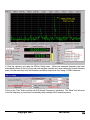
2.5.2.1 Filter Designer
This menu allows the user to customize the demodulator filter width and positions. For single sideband
modes (USB, LSB) the low and high cut positions can be adjusted independently. The other modes are
symmetrical around the center frequency and so only the width may be adjusted. The filter alpha's are
determined by the program and are not user definable.
If the "Show Filter response" box is checked, then the actual filter shape is displayed on the 2D FFT
display. The Hi and Low cutoffs are the -6dB points of the filters.
Copyright 2003
2007/09/20
55
If the high cut off is greater than 3600Hz, then a higher sample rate is used in the filters. This causes a
jump in the shape of filters about this transition point. The higher cutoff filters are not as sharp as the
narrower ones.
2.5.2.2 Demod (CW) Offset Frequency
This edit box provides a way to offset the filter and display frequency for receiving CW tones. This is
essentially the tone frequency that will be heard in the CW mode when the display frequency is exactly the
same as the incoming signal.
This offset can also be used in the USB mode to shift the demodulated signal up in frequency before
sending it out. This can be used to output a 12KHz IF signal to the sound card for further decoding by a
DRM (Digital Radio Mondiale) decoder. If this offset value is >0 then the demodulator frequency display
changes to a center value so the incoming signal is centered as opposed to being at the left side as is
normal for USB signals.
For DRM reception, set the offset to 7KHz and the low cut to 0Hz and the high cut to 10KHz. This will
center the DRM signal around the 12KHz frequency going out the soundcard or wave file.
2.5.2.3 Noise Blanker
Copyright 2003
2007/09/20
56
This controls a simple noise blanker algorithm. Checking the On box enables it. Adjust the threshold for
best results. Too high a threshold will severely distort the spectrum and signals so use just enough to clip
the noise.
2.5.2.4 AGC
This sets the AGC constants. The decay time is in Milliseconds and is the exponential decay time for the
AGC. The Attack time is fixed at 10 Milliseconds.
Hang time is in Milliseconds and is a delay time after the signal has gone before the delay time is
activated.
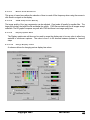
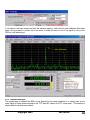
2.5.3
Signal/Squelch Bar
The vertical bar display to the right of the frequency controls is signal strength meter and squelch
control.
The height of the bar is the signal strength. If demodulation is off, then the level and height are the
peak amplitude within the entire current display span.
If demodulation is active, then the level is the signal strength within the demodulator pass band. The
exception is if in NBFM then the level is the FM noise quieting level for use with the squelch.
Clicking on the blue bar within the control or dragging it to the desired level sets the squelch
threshold.
If the signal is above the threshold, the level changes color indicating the squelch is open.
If the signal is below the threshold, it turns grey.
Copyright 2003
2007/09/20
57
The button above the Squelch control is the peak signal strength within the demodulator filter
bandwidth. Pressing the button toggles between dB display and an S meter reading.
The range is S0 to S9 and S9 +10 to S9 +60dB
The small tics are the S units, the longer ones the "over S9" units.
When in the FM mode, the squelch level is not the signal power but is the output of the FM noise
activated squelch so just has a range of 0 to 14.
2.6 Miscellaneous Displays
The program has some other displays scattered around the main screen.
2.6.1
Info Box
Copyright 2003
2007/09/20
58
This text box displays the program status as well as some information on current sample rates and
FFT resolutions.
The first line shows the current status of the program.
The "Fs= xxxxx Hz" is the FFT data sample rate.
The "BW Res" is the bandwidth resolution of the currently selected FFT size and sample rate.
If position markers are active, then the marker information is shown in this box.
2.6.2
Cursor Frequency Display
Just above the info box is the current mouse cursor location if it is enabled and is over a 2D display.
2.6.3
File Progress Bar
The horizontal bar display at the bottom of the screen is active while playing or recording to a file. It
indicates the file progress as well as allows clicking on it to change the current playback position.
If playing back a file, one can click on the progress bar with the mouse and move to that file playback
position. A text balloon will appear to indicate the time pointed to by the cursor. Click on it, don’t try
to drag it across.
While recording, this indicates the % complete of the recorded file determined by the file size limit set
in the “Output Setup” menu.
Copyright 2003
2007/09/20
59
3 Technical Details
This Section describes some of the technical details implemented in SpectraVue.
3.1 External Program Control
Spectravue exposes a limited number of control items to 3rd party programs using a registered message
system.
3.1.1
Registered Message
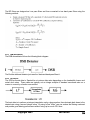
The registered message string used is "SpectraVueExtMsg"
#define SV_REGISTERED_MSG_STRING "SpectraVueExtMsg"
In Microsoft C++ the following line is used to obtain a registered message value
// Registered window message for external process control
const UINT wm_SVMessage = RegisterWindowMessage( _T(SV_REGISTERED_MSG_STRING) );
3.1.2
Example Message Handler
The following message handler macro can be defined
ON_REGISTERED_MESSAGE(wm_SVMessage, OnSVMessage)
An example service routine for messages coming from SpectraVue
// Handler for registered window message wm_SVMessage
// which is posted to all top-level windows in the system
// when communicating with an external process
// wParam contains the command and lParam the data.
LRESULT CSVExtControlDlg::OnSVMessage(WPARAM Cmd, LPARAM Data)
{
// If message is posted from this process do nothing
if ( !(Cmd & SV_TO_EXTERNAL) )
return 0;
Cmd &= ~SV_TO_EXTERNAL;
//get rid of msb flag
switch(Cmd)
{
case SVCMD_STATUS:
switch(Data)
{
case SV_STATUS_OFFLINE:
m_StatusTxtCtrl.SetWindowText("Offline");
break;
case SV_STATUS_IDLE:
m_StatusTxtCtrl.SetWindowText("Idle");
Copyright 2003
2007/09/20
60
break;
case SV_STATUS_PAUSED:
m_StatusTxtCtrl.SetWindowText("Paused");
break;
case SV_STATUS_RUNNING:
m_StatusTxtCtrl.SetWindowText("Running");
break;
}
break;
case SVCMD_SET_CENTER_FREQ:
m_CFreq = Data;
break;
case SVCMD_SET_SPAN_FREQ:
m_SpanFreq = Data;
break;
case SVCMD_DEMOD_0_FREQ:
m_DemodFreq0 = Data;
break;
case SVCMD_DEMOD_1_FREQ:
m_DemodFreq1 = Data;
break;
case SVCMD_DEMOD_MODE:
m_DemodGroup = Data;
break;
}
return 0;
}
3.1.3
Example Message Sending
Example of sending a center frequency command to SpectraVue
::PostMessage(HWND_BROADCAST, wm_SVMessage, (WPARAM)SVCMD_SET_CENTER_FREQ, m_CFreq);
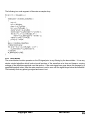
3.1.4
Available Command Definitions
The following command definitions are available and a .h include file is provided in the Spectravue
installation containing the supported commands:
#define SV_REGISTERED_MSG_STRING "SpectraVueExtMsg"
#define SV_TO_EXTERNAL (1<<31) //bit "OR'd" with SVCMD_xxx
#define SVCMD_STATUS
0x10
#define SV_STATUS_OFFLINE
0
#define SV_STATUS_IDLE
1
#define SV_STATUS_PAUSED
2
Copyright 2003
to distinguish msgs coming from SV
//Status values from SV
2007/09/20
61
#define SV_STATUS_RUNNING
3
#define SVCMD_SQUELCH
0x18
//cmd Squelch State value to/from SV
//if zero data sent to SV then audio is muted
#define SVCMD_START
0x20
//cmd to SV to start/resume running
#define SVCMD_PAUSE
0x30
//cmd to SV to pause running
#define SVCMD_STOP
0x40
//cmd to SV to stop running
#define SVCMD_DEMOD_STATE
0x48
//cmd to/from SV demodulation on and off
#define SV_DEMOD_OFF 0
#define SV_DEMOD_ON 1
#define SVCMD_SET_CENTER_FREQ
0x50
//cmd to/from SV's center frequency
#define SVCMD_SET_SPAN_FREQ
0x60
//cmd to/from SV's span frequency range
#define SVCMD_DEMOD_0_FREQ
0x70
//cmd to/from SV's channel 0 demod frequency
#define SVCMD_DEMOD_1_FREQ
0x71
//cmd to/from SV's channel 1 demod frequency
#define SVCMD_DEMOD_MODE
0x80
//cmd to/from SV's demod mode
#define SV_DEMOD_AM 0
//demod types
#define SV_DEMOD_WBFM 1
#define SV_DEMOD_FM 2
#define SV_DEMOD_USB 3
#define SV_DEMOD_LSB 4
#define SV_DEMOD_CWU 5
#define SV_DEMOD_CWL 6
#define SV_DEMOD_DSB 7
#define SV_DEMOD_NFM 8
#define SVCMD_FILE_CAPTURE_MODE 0x88
//cmd to/from SV File Capture modes
#define SV_FILECAPTURE_OFF 0
#define SV_RFFILECAPTURE_ON 1
#define SV_DEMODFILECAPTURE_ON 2
#define SVCMD_SET_RFGAIN
0x90
//cmd to/from SV RF Gain setting
#define SV_RFGAIN_0 0
#define SV_RFGAIN_M10 1
#define SV_RFGAIN_M20 2
Copyright 2003
2007/09/20
62
#define SV_RFGAIN_M30 3
#define SVCMD_SET_IFGAIN
0x98
//cmd to/from SV RF Gain setting
#define SV_IFGAIN_24 0
#define SV_IFGAIN_18 1
#define SV_IFGAIN_12 2
#define SV_IFGAIN_6 3
#define SV_IFGAIN_0 4
#define SVCMD_REFRESH_PAL 0xA0
//cmd to SV to re-read the current .PAL color palette file
3.2 Demodulator Section
The SpectraVue Demodulator section provides a means to demodulate various signals in real time and
output the audio to a wave file or Soundcard. The demodulator is not meant as a high performance
receiver but provides a useful addition for actually hearing various signals in real time.
I/Q data from the input source is sent to the demodulator block. It is first "tuned" to the desired signal using
a complex mixer and software NCO. This allows one to tune in signals anywhere within the input
bandwidth which could be up to 150KHz wide..
Copyright 2003
2007/09/20
63
Next the I/Q streams are decimated down as close to either 8KHz or 48Khz as possible using integer
decimation stages. The decision as to which decimation rate to use is determined by the selected Filter
bandwidth. If the bandwidth is greater than 3600Hz then the higher 48KH rate is used.
Next the signal is either low-pass filtered or band-pass filtered depending on the demodulation mode.
These filters are designed on the fly depending on the cutoff frequencies specified by the user.
The output of the filters is then presented to the appropriate demodulator block that takes the I/Q signal
and extracts the specified modulation as a real audio data stream.
Finally the real audio stream is re-sampled so that the output sample rate is exactly 8KHz or 48KHz. The
soundcard runs at a fixed 48KHz while the wave file data can be either 8KHz or 48KHz.
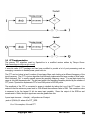
3.2.1
NCO/Mixer/Decimation Stages
This stage shifts the desired signal frequency to zero for base band processing.
The decimation stages down sample the input from 1 to 20 to get as close to 8 or 48KHz as possible
before entering the main filter routines.
The Wideband FM demodulator is a special case where the FM is demodulated before the decimation
stages in order to use the full input bandwidth.
Below is a C code excerpt of the complex mixer/NCO and first decimation stage.
Copyright 2003
2007/09/20
64
3.2.2
Demodulation Filters
The demodulation FIR filter is calculated in real time from the user input cutoff frequencies.
An ideal LP FIR filter is first designed:
The coefficients are then windowed with a Kaiser Window to reduce the side lobes. The maximum FIR
size is limited to 250 taps.
The demodulator uses two filter types. The AM.FM, and DSB demodulators require a LP filter on I and Q
since these signals are symmetric around the zero frequency.
The SSB and CW filters use a BP filter on I and a matching BP filter on Q with a Hilbert 90 degree phase
shifter. The BP filters are designed as LP filters that are then shifted to the proper cutoff frequencies and
the Q side filter coefficients are further processed to introduce a 90-degree phase shift.
Copyright 2003
2007/09/20
65
3.2.3
AM Demodulator
The AM demodulator takes the I and Q data and converts it into magnitude data.
Copyright 2003
2007/09/20
66
Mag = sqrt(I*I + Q*Q)
The magnitude is fed to an AGC block to provide some gain control. Then a simple high pass filter is used
to remove the DC component of the magnitude leaving the audio.
Copyright 2003
2007/09/20
67
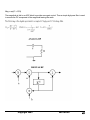
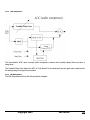
3.2.4
AGC Compressor
The demodulator AGC uses a simple audio compressor scheme with variable decay filters and also a
hang timer.
The Variable Delay Line allows the AGC to "look ahead" in time and have the new gain value ready before
the leading edge of a signal is processed.
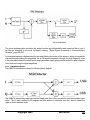
3.2.5
FM Demodulator
The FM demodulator follows the following block diagram.
Copyright 2003
2007/09/20
68
The actual implementation combines the arctan function and differentiation and correction filter in one 6
tap filter as described in the book by Marvin Frerking, "Digital Signal Processing in Communications
Sytstems", page253-256.
A noise gated squelch is implemented by high pass filtering the output of the detector, taking its magnitude
and then low pass filtering the magnitude. As an FM signal increases in strength, the high frequency noise
in the pass-band above the normal audio range decreases rapidly giving a better means to gate a squelch
circuit than just using the signal magnitude.
3.2.6
SSB/CW Demodulator
The SSB/CW demodulator follows the following block diagram.
The SSB/CW demodulator uses two identical band pass filters which provide the final demodulator band
width. The Q data is shifted by 90 degrees and then added or subtracted from the I data to obtain the
upper or lower sideband audio.
Copyright 2003
2007/09/20
69
The BP filters are designed as Low pass filters and then converted to tow band pass filters using the
following method:
3.2.7
DSB Demodulator
The DSB demodulator follows the following block diagram.
The Double sideband detector just uses the I data and band pass filters it.
3.2.8
Re-sampler
The SDR-xx sends data to SpectraVue at various data rates depending on the bandwidth chosen and
actual clock rates. These rates are typically not an integer multiple of standard soundcard rates so a
means to convert by a fraction was needed.
The basic idea is to perform an integer interpolation up by a large number, then decimate back down to the
desired rate using a second integer value. By using a few "tricks" one can reduce the filtering overhead
and provide good aliasing performance without using up too much CPU time.
Copyright 2003
2007/09/20
70
The following is a code segment of the main re-sampler loop.
3.2.9
Noise Blanker
The noise blanker function operates on the I/Q signal prior to any filtering by the demodulator. It is a very
simple minded algorithm which looks at small sections of the waveform at a time and keeps a running
average of the absolute magnitude over that section. If the main signal ever goes above this average by a
specified threshold value, then the main waveform is set to zero until the signal drops below the threshold.
This basically finds any pulse type signal and zeros it out.
Copyright 2003
2007/09/20
71
3.3 FFT Implementation
The primary FFT algorithm used by SpectraVue is a modified version written by Takuya Ooura.
(http://momonga.t.u-tokyo.ac.jp/~ooura/)
It uses his radix 4 FFT package and has been modified to provide a lot of post processing such as
averaging, conversion to decibel power, peak hold, etc.
The FFT can be looked at as N number of band-pass filters each looking at a different frequency of the
input frequency. The FFT is just an algorithm that efficiently implements this large number of filter banks.
Each frequency "bin" is evenly spaced across the sampling frequency range. For real data inputs the
range is only half the sample rate. The bin band width is the sampling frequency divided by the number of
FFT points. SpectraVue implements FFTs from 2048 points to 262144 points.
The amplitude of the FFT is converted to power in decibels by taking the Log of the FFT output. It is
scaled so that the minimum power level is –250 dB and the maximum value is 0dB. This maximum value
is assumed to be the largest 16 bit sin wave input possible. Since the output of the SDR-xx and
soundcards is 16bits, the input signal can never be greater than this.
A pure input sin wave ... Asin(wt)... will produce an fft output
peak of (N*A/Kx)^2 where N is FFT_SIZE.
Kx = 2 for complex, 4 for real FFT
Copyright 2003
2007/09/20
72
To convert to a Power dB range:
PdBmax = 10*log10( (N*A/Kx)^2 + K_C ) + K_B
PdBmin = 10*log10( 0 + K_C ) + K_B
if (N*A/Kx)^2 >> K_C
Then K_B = PdBmax - 20*log10( N*A/Kx )
K_C = 10 ^ ( (PdBmin-K_B)/10 )
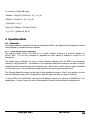
4 Operation Hints
4.1 Calibration
The following ideas are presented to help one calibrate the SDR-xx and SpectraVue for applications where
wither frequency or power accuracy is needed.
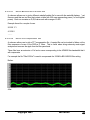
4.1.1
Sample Clock Frequency Calibration
The internal sample clock of the SDR-xx is a crystal oscillator running at a nominal frequency of
66.666…Mhz. It is not oven controlled or adjustable so some means is needed to correct for it in
SpectraVue.
The easiest way to calibrate is to input a known reference frequency into the SDR-xx and accurately
measure it using SpectraVue. The difference in the measured and actual frequency can then be used to
change the value SpectraVue uses for the sample clock. WWV can be used if a decent signal is available
or a good lab source. A local AM station carrier could also be used to get reasonably close.
The following SpectraVue setup can be used to help calibrate the system. After it is up working, one can
save this calibration setup to the .ini setup file to make life easier next time you want to calibrate.
1. Setup SDR-xx for a 50Khz BW, and set the A/D Sample Frequency to nominal of 66666667Hz if not
already there. It doesn’t have to be but for this example it is what it would be the first calibration time.
Copyright 2003
2007/09/20
73
2. Set the FFT setup menu as shown with the "Display Peak Markers" button checked.
Copyright 2003
2007/09/20
74
3. Setup the main screen as follows with an FFT size of 65536, an average of 5 or so, a center frequency
of 10MHz(for WWV), demod OFF, and a span of 500Hz.. Press Start and adjust the screen to allow easy
viewing of the 10MHz peak. Note the little blue x on the peak and its corresponding marker frequency of
10000.065Khz in the info box. This is the measured frequency of WWV and shows that the program is off
by 65Hz.
Remember the program can only measure frequency as accurately as the FFT BW resolution so make
sure you use a large enough FFT to get within 1 Hz or so. The example show a .85HzBW so is ok.
Copyright 2003
2007/09/20
75
4. Stop the capturing and open the SDR-xx Setup menu. Notice the measured frequency has been
automatically placed in the box(if you had peak markers checked and it was marking the correct reference
peak) One can manually enter the Reference and Meas frequencies if not using a 10MHz reference.
5.Click on the "Calc" button and the new A/D Sample Frequency is calculated. The "Meas" box will revert
to the Ref frequency so one doesn’t accidentally keep scaling the A/D sample frequency.
Copyright 2003
2007/09/20
76
6. Go back to the main screen and start the captures again to verify that the new calibration has taken
affect. One may have to perform this a few times to iterate the error to zero if the signal is noisy or the
SDR-xx is still warming up.
4.1.2
Amplitude Calibration
The easiest way to calibrate the SDR-xx and SpectraVue for power amplitude is to simply input a sine
wave signal of known power and adjust the "FFT Max dB" value in the FFT setup menu. This number is
simply added to all the screen values.
Copyright 2003
2007/09/20
77
For example, set ones signal generator to say -20dBm and measure the amplitude shown on the 2D FFT
screen. Use the Peak Markers for best accuracy rather than the cursor marker since the screen resolution
is not very accurate. Enter a value into the "FFT Max dB" edit box in the FFT setup menu that when
added to the measured value will make it display -20dBm. The value can be positive or negative.
In the direct input mode, a value of 4.5dB will be very close since this is the level in dBm where the A/D
begins to clip. If the internal preamp or an external one is used, then one must change the value
accordingly.
Copyright 2003
2007/09/20
78