1
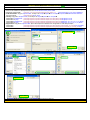
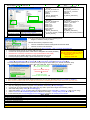
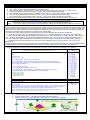
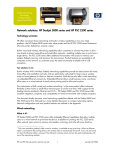
Creating an Atmel QTouch
TM
Library Project
using GCC or IAR
2009-11-17, v14, Paul Russell, Atmel QRG FAE
TM
This document is intended only as a quick start guide for Atmel QTouch Library (TLib). This Guide will show you how to make a
new TLib project from scratch and get to Debug&Run, using either IAR Embedded Workbench, or AVR Studio with WinAVR GCC.
For further details please refer to the appropriate documents listed in Section 2.
Section 1 What is TLib?
TLib is a Library Module that can be linked with your application to provide Capacitive Touch Sensing.
o For those not familiar with libraries, or libraries linked to hardware, then it may help to think of TLib as just
another MCU Module that can optionally control some I/O pins, similar to hardware modules like WDT,
I2C, UART, Timer, ADC …
o All the modules provide registers or settings to select which MCU pins they use.
o There are AppNotes with sample code showing how to use the hardware modules, similarly there are a
Guide and examples showing how to use the software TLib module.
o Much of ROM and Stacks used by a TLib example would be required for a non-touch application, so
incremental resource usage to add Touch is less than in the TLib guide.
AVR MCU
CPU
WDT
Timer
I2C
ADC
UART
TLib
Section 2 Documents and Tools
Ensure you have all the required software installed, and the appropriate equipment and documentation
You may wish to completely uninstall previous versions of all software packages for a fresh start.
a) Install Atmel Tools: http://www.atmel.com Products Touch Solutions QTouch Library QTouch Suite
QTouch Suite: http://www.atmel.com/products/touchsoftware/qtouchsuite.asp?family_id=702
o Install AVR Studio (4.17 or newer)
required for ICE support
includes Debugger for GCC (or IAR)
http://www.atmel.com/dyn/products/tools_card.asp?tool_id=2725
Optional:
o QTouch Library User Guide
o Touch Sensors Design Guide
o Install QTouch Studio (with Visual Studio, .NET) o AVR252 (pdf and zip)
http://www.atmel.com/dyn/products/tools_card_touch.asp?tool_id=4627 o Install QTouch Library (3.1 or newer)
o AVR254 (pdf and zip)
Install Development Environment, choices:
IAR) IAR Embedded Workbench – See Section 3 TLib with IAR
http://www.iar.com/website1/1.0.1.0/107/1/index.php – All Licenses OK: Full, 30 Day, Free Kick Start 4
This Guide was prepared using: IAR Embedded Workbench for Atmel AVR, v. 5.30, 4K Kickstart edition [EWAVR-KS-WEB-5302.exe]
This Guide uses IAR Embedded Workbench to do both Compiling and Debugging (Option: Debug using AVR Studio)
GCC) GCC with Debug using AVR Studio – See Section 4 TLib with GCC
http://support.atmel.no/bin/customer?custSessionKey=&customerLang=en&noCookies=true&action=viewKbEntry&id=226
Reference:
WinAVR GCC: http://sourceforge.net/projects/winavr/files/
This Guide was prepared using: WinAVR-20090313-install.exe and AVR Studio 4.17 (build 666) (112 MB, updated 7/09)
Prepare test PCB – TLib Demo unit, or your own PCB design with Atmel AVR MCU and Touch Sensor Patterns
The Datasheet for the Atmel AVR IC you will use
Please see Help in QTouch Studio for information about TLib Demos, including Schematics and Programming Tools.
This Guide uses TLIB Demos AVRTS2080A and AVRTS2080B as examples (equal to EVK2080A/EVK2080B)
Prepare ICE or ISP compatible with your PCB or the TLib Demo
For compatible Development Tools please refer to AVR IC’s datasheet and AVR IC’s webpage.
Please see Help in QTouch Studio for Development Tools compatible with TLib Demos.
Ensure ICE and drivers are up to date, see Updates section below
Please ensure ICE ISP frequency set according to ICE Instructions (Typically ≤¼ target’s frequency).
If CPU changes frequency “on the fly” please see Section 5 item t2.
Option: Install Additional Software Tools:
• Hawkeye – Viewer for two-wire data (Available from Atmel FAEs, can also display application variables beside TLib, step t4)
• Flip – Tool to In-Circuit Program AT90USB used in TLib Demos http://atmel.com/dyn/products/tools_card.asp?tool_id=3886
• 5030 USB Bridge – In-Circuit Bootload Package for AT90USB MCU as used in TLib Demos (Available from Atmel FAEs)
TM
b)
c)
d)
e)
f) Updates:
Important: Ensure you check all items indicated with:
o
ICE Upgrade: Use AVR Studio to update the ICE’s internal firmware: Tools …… Upgrade (Power Cycle ICE when Upgrade complete)
o
USB Driver: To update USB Driver install Atmel FLIP package, and check installation notes in files Flip Install Folder: Readme, Update USB…
Disconnect other USB devices before doing this procedure.
USB port may show with different driver names. Plug/Unplug ICE or TLib Demo device to find which device in the list is correct.
If issue connecting to ICE by USB, try ICE with RS-232 or a USB to RS-232 adapter (ex. JTAG ICE MKII has both USB and RS-232). USB issues
are usually due to Windows Driver issues and corrected by updating the driver, but in some rare instance it is possible that some other software may
conflict. A reformat and clean Windows install will certainly cure the issue by clearing software history, but that isn’t always reasonable.
o
Section 3 TLib with IAR
Important: Ensure you check all items indicated with:
i1. Create a Project Folder – a new empty folder for the project files, the folder location is your choice.
i2. Prepare project files: copy to Project Folder created in step i1, or add from original location: Header *.h, Library *.r90, Example *.c
o Refer to the Tables and Examples listed in the Atmel QTouch Library User Guide
[TLib Path] = C:\Program Files\Atmel\Atmel QTouch Libraries 3.1\
(Use actual path of your TLib installation)
o Default TLib install path:
o TLib API Header: Copy to Project Folder, or step i4 do: ProjectOptionsC/C++CompilerPreprocessorAdditional Include directories
[TLib Path]\include\touch_api.h
All TLib projects:
o Library: Copy file to Project Folder, or at step i4 do: ProjectOptionsC/C++Compiler…
AVRTS2080A Keys/Slider/Rotor: [TLib Path]\megaAVR, tinyAVRand XMEGA libray\QTouch library\library files\libv1g4-8qt-k-2rs.r90
[TLib Path]\megaAVR, tinyAVRand XMEGA libray\QTouch library\library files\libv1g4-8qt-k-0rs.r90
AVRTS2080A only Keys:
AVRTS2080B Keys/Slider/Rotor: [TLib Path]\megaAVR, tinyAVRand XMEGA libray\QMatrix library\library files\libt88_8qm_4x_2y_krs_2rs_YL_LO_NIB.r90
AVRTS2080B only Keys:
[TLib Path]\megaAVR, tinyAVRand XMEGA libray\QMatrix library\library files\libt88_8qm_4x_2y_k_0rs_YL_LO_NIB.r90
o Application: Copy file to Project Folder: (Note: 2080 examples have different sensor assignments from other library examples)
[TLib Path]\megaAVR, tinyAVRand XMEGA libray\QTouch library\Example projects\2080A_iar_example\main_atmega88.c
AVRTS2080A:
[TLib Path]\megaAVR, tinyAVRand XMEGA libray\QMatrix library\Example projects\TS2080B_qm_example_iar\main.c
AVRTS2080B:
i3. Start IAR Embedded Workbench, create a new empty project, select Project Folder created in step i1, save project.
Project Folder
Project Name
i4. Add Library and Application files copied in step i2: Project Add Files… (Header file is handled automatically)
Select only 1 Library
i5. Save the Workspace in Project Folder created in step i1: File Save Workspace.
Project Folder
Project Name
i6. For Debug Build continue at step i7, or for Release Build continue at step i21
IAR - Build for Debug
i7. For debugging in IAR Embedded Workbench select Debug Build with:
o Select Debug Tool (ICE): Project Options Debugger = JTAG ICE MKII, Dragon …
o Build format: Project Options Linker Format Debug Information for C-Spy (This is Default for new IAR Projects)
Debug Tool
Project must be highlighted
to access Project Options
Selected
Debug Tool
is shown in
the Menu bar
Debug Tool
i8. Select the appropriate Target IC: Project Options General options Target
o AVRTS2080A - ATmega88
o AVRTS2080B - ATtiny88
Target IC
i9. Enable I/O Bit Definitions and set size of Stacks:
Project Options General Options System
AVRTS2080A Keys/Slider/Rotor:
o CSTACK ≥ 0x40 (64) Data
o RSTACK ≥ 0x2C (44) Return Addresses
AVRTS2080A only Keys:
o CSTACK ≥ 0x30 (48) Data
o RSTACK ≥ 0x28 (40) Return Addresses
AVRTS2080B Keys/Slider/Rotor:
o CSTACK ≥ 0x35 (53) Data
o RSTACK ≥ 0x20 (32) Return Addresses
If application
performs any
additional
functions then
stack sizes
should be
appropriately
adjusted.
AVRTS2080B only Keys:
o CSTACK ≥ 0x25 (53) Data
o RSTACK ≥ 0x20 (32) Return Addresses
i10. Set TLib build options: Project Options C/C++ compiler Preprocessor Tab (or put in C file before: #include "touch_api.h")
Add to Defined Symbols:
QTouch - only Keys
QTouch - Keys/Slider/Rotor
_QTOUCH_
QT_NUM_CHANNELS=8
QT_DELAY_CYCLES=1
SNS=D
SNSK=B
_DEBUG_INTERFACE_
_ROTOR_SLIDER_
QMatrix - Keys/Slider/Rotor
_QMATRIX_
QT_NUM_CHANNELS=8
DELAY_CYCLES=4
PORT_X=B
PORT_YA=D
PORT_YB=C
PORT_SMP=D
TLib Configuration, see details in QTouch Library User Guide SMP_BIT=7
Remove to save memory,
_DEBUG_INTERFACE_
_DEBUG_INTERFACE_
Add for QTouch Studio or Hawkeye
QT_MAX_NUM_ROTORS_SLIDERS=2
QT_DELAY_CYCLES=** Match to Sensor Tuning (QTouch Charge Time) _ROTOR_SLIDER_
DELAY_CYCLES=**
Match to Sensor Tuning (QMatrix Dwell Time)
_QTOUCH_
QT_NUM_CHANNELS=8
QT_DELAY_CYCLES=1
SNS=D
SNSK=B
_DEBUG_INTERFACE_
QMatrix - only Keys
_QMATRIX_
QT_NUM_CHANNELS=8
DELAY_CYCLES=4
PORT_X=B
PORT_YA=D
PORT_YB=C
PORT_SMP=D
SMP_BIT=7
_DEBUG_INTERFACE_
QT_MAX_NUM_ROTORS_SLIDERS=0
i11. Optional Settings (Depending on project requirements):
Option: No Heap
Optimization: Size: High
Option: Multi-File
i12. Save the Workspace: File Save Workspace.
i13. Build the Project: ProjectRebuild All (or: ProjectMake)
o If any errors then check that you have a matching set of:
Target AVR IC
Header.h
Library.r90
Application.c
o
Known Issue – Linker Warning w6:
Builds for some AVR will present this warning, please ignore.
Linking
Warning[w6]: Type conflict for external/entry "_A_DDRC", in module main_atmega88
against external/entry in module burst_10_BC;
class/struct/union field/base types do not match for field/base ''; class/struct/union
field names do not match: DDRC_Dummy7 vs DDRC_DDC7
:
:
Total number of errors: 0
Total number of warnings: **
i14. Connect Programmer. For photos of ICE connections see QTouch Studio – Help – In Circuit reprogramming
•
Powerdown Target and ICE (or unplug USB from each)
*Avoid misconnections:
•
Connect ICE to Target (ISP 6wire, or dW 2wire if debugWire was already enabled) Make pin alignment mark on PCB and
ICE using a bright colour paint pen:
•
Recheck Pin1 is correctly connected to Target (Label PCB and ICE Cable)
ISP6pin5: Gnd
•
Connect ICE to PC (USB or RS-232), If power switch then turn on ICE
ISP6pin6: Reset-/dW
•
Powerup Target (Connect USB), If power switch then turn on Target
i15. Load into Programming Tool: ProjectDownload and Debug
Debug Tool
Selected Debug Tool
is shown here
i16. You may need to enable Debug Wire – dW is disabled in new ICs, for Power Measurements, and for Release Builds
ProjectDownload and Debug YesPower Down Target Power Up Target OK
•
To enable debugWire ensure ICE is connected to Target using ISP 6wire cable (Vcc, SPI/ISP, Reset/dW, Gnd)
Power Down Target
DWEN Fuse for dW:
(Unplug USB from AVRTS2080)
Option: ICE cable change
ISP 6wire to dW 2wire
Power Up Target (Connect USB to AVRTS2080)
i17. After enabling debugWire you can switch ICE to use dW 2wire cable (dW, Gnd), freeing the ISP pins for Touch, SPI…
i18. To disable debugWire for Low Power measurements or Release Builds:
Debug Tool
o In Debug Tool Menu enable: Ending Session Disables DebugWire
o Exit Debug mode: Debug Stop Debugging (auto disables DWEN fuse)
o ICE will need ISP 6wire cable for further actions
i19. Run the Program and do your tests: DebugGo
If your program outputs appropriate diagnostic data then you may view the data using QTouch Studio or Hawkeye
Note: Pins connected to ICE won’t be able to Touch Detect. Use debugWire cable to free these pins (step i17).
i20. To stop debugging: DebugStop Debugging
For Release Build continue at step i21, if finished continue at step i32
IAR - Build for Release (or for Debugging in AVR Studio)
i21. Select Release Build to create a file for final testing and production (Option: use other software to FLASH, like AVR Studio)
o Select Programming Tool (ISP, ICE): Project Options Debugger = STK600, JTAG ICE MKII, Dragon, …
o Select output format. Typical formats include “motorola”, “intel hex”… (Production output typically doesn’t contain debug info)
o Some tools only program ICs mounted on PCB, while tools like STK600 support in-circuit programming and programming sockets.
For programming with IAR use Motorola format.
Debug Tool
Project must be highlighted
to access Project Options
Selected
Debug Tool
is shown in
the Menu bar
Debug Tool
i22. Select the appropriate Target IC, see Step i8: Project Options General options Target
i23. Enable I/O Bit Definitions and set size of Stacks, see Step i9: Project Options General Options System
i24. Set TLib build options for Release: Project Options C/C++ compiler Preprocessor Tab
NDEBUG
This IAR definition is used for Release Builds
see Step i10 for required TLib Definitions
_DEBUG_INTERFACE_
Release code usually has a dedicated interface, so if unused remove the TLib Diagnostics code
i25. Save the Workspace: File Save Workspace.
i26. Build the Project, see Step i13: ProjectRebuild All (or: ProjectMake)
i27. If you are using different software for programming then skip to step i32
For programming with other software it may be necessary to disable DebugWire, see step i18
i28. Connect Programmer using ISP 6wire cable, see Step i14
Recheck Pin1 is correctly connected to Target (Label PCB and ICE Cable)
i29. Load into Programming Tool:
ProjectDownload and Debug
.Don’t Click RUN.
Debug information
isn’t included in
release build so may
see this message.
i30. Set for debugWire disable upon exit to minimize IC power:
Debugger Menu enable: Ending Session Disables debugWire.
i31. Finished Programming: DebugStop Debugging (debugWire module in IC is disabled through setting in step i30)
IAR - Finish
i32. Powerdown Target (Unplug USB from EVK2080)
i33. Power down Programmer.
i34. Disconnect Programmer from Target.
i35. Powerup Target and test it.
i36. Log results.
i37. Exit all software tools
IAR Completed
Section 4 TLib with GCC
Important: Ensure you check all items indicated with:
o GCC Style Note:
For data in ROM using GCC see PROGMEM: http://www.nongnu.org/avr-libc/user-manual/pgmspace.html
AVR Libc Guide: http://www.nongnu.org/avr-libc/user-manual/index.html
g1. Start AVR Studio, create a new AVR GCC project in desired new project folder, select ICE and AVR IC, save project
Select
AVR
IC
Select
Debug
Tool
Select TLib working area
Maybe: c:\TLib d:\TLib
g2. Check the Stack Starting address matches the Datasheet:
Project Configuration Options Memory Settings Stack settings
For most AVR the stack is automatically set,
but for ATtiny88 used in demo AVRTS2080B use:
Specify Initial Stack address [ 0x2FF ]
g3. Prepare project files: copy to Project Folder created in step g1, or add from original location: Header *.h, Library *.a, Example *.c
o Refer to the Tables and Examples listed in the Atmel QTouch Library User Guide
[TLib Path] = C:\Program Files\Atmel\Atmel QTouch Libraries 3.1\
(Use actual path of your TLib installation)
o Default TLib install path:
o TLib API Header: Copy to Project Folder
All TLib projects:
[TLib Path]\include\touch_api.h
o Library: Copy file to Project Folder
AVRTS2080A Keys/Slider/Rotor: [TLib Path]\megaAVR, tinyAVRand XMEGA libray\QTouch library\library files\libavr4g2-8qt-k-2rs.a
AVRTS2080A only Keys:
[TLib Path]\megaAVR, tinyAVRand XMEGA libray\QTouch library\library files\libavr4g2-8qt-k-0rs.a
AVRTS2080B Keys/Slider/Rotor: [TLib Path]\megaAVR, tinyAVRand XMEGA libray\QMatrix library\library files\libt88_8qm_4x_2y_krs_2rs_YL_LO_NIB.a
AVRTS2080B only Keys:
[TLib Path]\megaAVR, tinyAVRand XMEGA libray\QMatrix library\library files\libt88_8qm_4x_2y_k_0rs_YL_LO_NIB.a
o Application: Copy file to Project Folder: (Note: 2080 examples have different sensor assignments from other library examples)
[TLib Path]\megaAVR, tinyAVRand XMEGA libray\QTouch library\Example projects\2080A_gnu_example \main_atmega88.c
AVRTS2080A:
AVRTS2080B:
[TLib Path]\megaAVR, tinyAVRand XMEGA libray\QMatrix library\Example projects\TS2080B_qm_example_gnu\main.c
g4. Add Application file to Project: Right Click on project Add Existing File(s)… add .c from step g3
g5. Select Library Path, and add library .a from step g3
1.Project 2.Configuration Options 3.Libraries 4.Folder 5.Path
Select Project folder created in step g1, Folder appears as .\ 6.Select .a from step g3 7.Add Library 8.OK
4
1
5
3
7
2
6
8
g6. Set TLib build options: 1 Project 2 Configuration Options 3 Custom Options 4 Item to Add: -D… 5 Add 6 OK
More…
Repeat Steps 4 and 5 for each item.
QTouch - only Keys
QTouch - Keys/Slider/Rotor
Add to Defined Symbols: (or put in C file before: #include "touch_api.h")
-D……
-D……
3
4
5
6
TLib Configuration, see details in QTouch Library User Guide
Remove to save memory, or
add for QTouch Studio or Hawkeye
-DQT_DELAY_CYCLES=** Match to Sensor Tuning (QTouch Charge Time)
-DDELAY_CYCLES=**
Match to Sensor Tuning (QMatrix Dwell Time)
-D_DEBUG_INTERFACE_
-D_QTOUCH_
-DQT_NUM_CHANNELS=8
-DQT_DELAY_CYCLES=1
-DSNS=D
-DSNSK=B
-D_DEBUG_INTERFACE_
-D_ROTOR_SLIDER_
-D_QTOUCH_
-DQT_NUM_CHANNELS=8
-DQT_DELAY_CYCLES=1
-DSNS=D
-DSNSK=B
-D_DEBUG_INTERFACE_
QMatrix - Keys/Slider/Rotor
-D_QMATRIX_
-DQT_NUM_CHANNELS=8
-DDELAY_CYCLES=4
-DPORT_X=B
-DPORT_YA=D
-DPORT_YB=C
-DPORT_SMP=D
-DSMP_BIT=7
-D_DEBUG_INTERFACE_
-D QT_MAX_NUM_ROTORS_SLIDERS=2
-D_ROTOR_SLIDER_
QMatrix - only Keys
-D_QMATRIX_
-DQT_NUM_CHANNELS=8
-DDELAY_CYCLES=4
-DPORT_X=B
-DPORT_YA=D
-DPORT_YB=C
-DPORT_SMP=D
-DSMP_BIT=7
-D_DEBUG_INTERFACE_
-DQT_MAX_NUM_ROTORS_SLIDERS=0
g7. Build: Build Rebuild All
If any errors then check that you have a matching set of:
Target IC, Header.h, Library.a, Main.c
WinAVR GCC Notes (compared to IAR):
•
There is no difference between Debug Build and Release Build
•
There is no need to set Stack sizes
g8. Connect Programmer. For photos of ICE connections see QTouch Studio – Help – In Circuit reprogramming
•
Powerdown Target and ICE (or unplug USB from each)
*Avoid misconnections:
•
Connect ICE to Target (ISP 6wire, or dW 2wire if debugWire was already enabled) Make pin alignment mark on PCB and
ICE using a bright colour paint pen:
•
Recheck Pin1 is correctly connected to Target (Label PCB and ICE Cable)
ISP6pin5: Gnd
•
Connect ICE to PC (USB or RS-232), If power switch then turn on ICE
ISP6pin6: Reset-/dW
•
Powerup Target (Connect USB), If power switch then turn on Target
g9. Load into Programming Tool: Debug Start Debugging (or Build Build and Run)
g10. First Time you use ICE with an AVR you may need to enable debugWire (DWEN Fuse for dW):
Debug Start Debugging Use SPI OK Power Down Target Power Up Target OK
To enable debugWire ensure ICE is connected to Target using ISP 6wire cable (Vcc, SPI/ISP, Reset/dW, Gnd)
After enabling debugWire you can switch to dW 2wire cable (dW, Gnd), freeing the ISP pins for Touch, SPI…
Power Down Target
(Unplug USB from EVK2080)
Option: ICE cable change
ISP 6wire to dW 2wire
Power Up Target
(Connect USB to EVK2080) .
g11. Run the Program and do your tests: Debug Run
If your program outputs appropriate diagnostic data then you may view the data using QTouch Studio or Hawkeye
Note: Pins connected to ICE won’t be able to Touch Detect. Use debugWire cable to free these pins (see step g10).
g12. To stop debugging: Debug Break, then Debug Stop Debugging
g13. To disable debugWire for Low Power measurements or Release Builds:
•
Stop any debugging session in progress: Debug Break, then Debug Stop Debugging
•
Connect ICE to Target using 6wire ISP cable (You may wish to power down target while switching cables)
•
Start fresh debug using: Debug Start Debugging
•
Select ICE Options: ALT-O, or bottom option in Debug pulldown menu: Debug **** Options (****=ICE you are using)
•
Select: Connection Disable debugWire Yes wait for message “…leaving debug mode” OK OK
In AVR Studio Help see: On-Chip Debugging with the JTAGICE mkII, subsection: Re-enabling the ISP Interface
GCC - Finish
g14. Powerdown Target (Unplug USB from EVK2080)
g15. Power down Programmer.
g16. Disconnect Programmer from Target.
g17. Powerup Target and test it.
g18. Log results.
g19. Exit all software tools
GCC Completed
Section 5 TLib Timing, Low Power, Diagnostics
This section is still Under Construction - Feel free to suggest topics for this section (through QTouch Forum or [email protected])
t1. Some options for Timing and Low Power Control (Refer to AVR IC’s Datasheet for Low Power modes):
a. Use __delay_cycles () with appropriate count for required period.
b. Like (a) but set CPU to slow before, then fast after, such that AVR is using Low Power during __delay_cycles()
c. Use Timer to generate an interrupt, and use __sleep() with Low Power Mode while waiting.
d. Use Watchdog with low speed oscillator as wakeup source, and use __sleep() with Low Power Mode while waiting
e. Use a pin as an External Interrupt Source, and use __sleep() with Lowest Power Mode while waiting
f. Set for wakeup upon communications event, and use __sleep() with Lowest Power Mode while waiting
For (e) and (f) the Touch Response timing and Low Power Mode are controlled by the External source, and can vary.
t2. If CPU changes frequency “on the fly” then ensure CPU switches back to starting frequency before using debugger functions.
o Assign a spare AVR input pin as Normal/FastDebug- (This can be temporary assignment during code development)
Debug
o Design code to run CPU as needed when pin is HI (internal pullup), but to keep CPU at full speed when this pin is LO.
Option
o Use a switch or jumper wire to connect Debug Pin to Gnd when need to interrupt code for debugging (Reload, Breakpoint, View memory…).
t3. Interface and Protocol options:
In some projects the AVR will be both the Host processor and the Touch controller such that an interface isn’t required, while in other
cases the interface will be predefined by existing equipment, possibly as either a serial protocol or Pin-Per-Key interface (PPK). For
cases where a simple new interface protocol is required the below ideas may help, as the diagnostic output for QTouch Studio and
Hawkeye isn’t suitable for real products do to the high volume of data output.
An example of a simple single byte protocol, with optional host control of timing/power and sensor configuration:
o Tx: 1 byte of 8 touch status bits, or 1 slider position (255=NoTouch), or if AKS enabled the can Encode the Touch status like:
0x00~0x7F:Slider7bit, 0x80~0xBF:Wheel6bit, 0xC0~0xEF:Key0~47, 0xF0~0xFD:Error0~13, 0xFE:Calibrating, 0xFF:NoTouch
o Rx: 1~2 bits of received byte to control sampling response time (power): Fast, Low Power, and FullSleep(Can’t Touch), see t1.
o Rx: Use some bits to select configuration so one firmware file can be used for many products or operating modes, reducing
programmed IC stock and production costs. Also for run-time reassign of sensors, ex: KeysSlider, use qt_reset_sensing()
Multi-byte IO:
o Simple using Bit7 as First byte Flag: First byte Bit7=1, other bytes Bit7=0, Data in Bits0~6 of each byte, many Keys/Sliders/Wheels.
o Numerous other protocols exist that include byte synchronization and/or checksum: I2C, DLE Stuffing, STX-ETX, etc.
t4. Hawkeye may be used to monitor Touch Data and application specific data in near real time (Copy-Paste below to *.c and *.txt)
This can be helpful if the project needs to be debugged in real time, or if the ICE pins are needed by the application.
Standard diagnostic data output modified for monitoring by Hawkeye
to append 3 bytes of application data and a cycle counter.
static void report_debug_data( void )
{
uint8_t i;
int16_t sensor_delta;
static uint8_t b_count; // Counter
output_to_debugger( (uint8_t *) &board_info, (uint8_t) sizeof( board_info ) );
output_to_debugger( (uint8_t *) &qt_measure_data.channel_signals[0], (uint8_t) sizeof( qt_measure_data.channel_signals ) );
output_to_debugger( (uint8_t *) &qt_measure_data.channel_references[0], (uint8_t) sizeof( qt_measure_data.channel_references ) );
for( i = 0u; i < QT_NUM_CHANNELS; i++ )
{
sensor_delta = qt_get_sensor_delta( i );
output_to_debugger( (uint8_t *) &sensor_delta, sizeof( int16_t ) );
}
output_to_debugger( (uint8_t *) &qt_measure_data.qt_touch_status, (uint8_t) sizeof( qt_measure_data.qt_touch_status ) );
output_to_debugger( (uint8_t *) &sensor_config[0], (uint8_t) sizeof( sensor_config ) );//#Channels
send_debug_byte(b_appdata0);
send_debug_byte(b_appdata1);
send_debug_byte(b_appdata2);
send_debug_byte(b_count ++);
}
Hawkeye Control File
+ 4Bytes
D, 1, 1, Model
D, 1, 2, ch_signals0
D, 1, 3, ch_signals1
D, 1, 4, ch_signals2
D, 1, 5, ch_signals3
D, 1, 6, ch_signals4
D, 1, 7, ch_signals5
D, 1, 8, ch_signals6
D, 1, 9, ch_signals7
D, 2, 2, ch_references0
D, 2, 3, ch_references1
D, 2, 4, ch_references2
D, 2, 5, ch_references3
D, 2, 6, ch_references4
D, 2, 7, ch_references5
D, 2, 8, ch_references6
D, 2, 9, ch_references7
-D, 2,11, sensor_deltas0
-D, 2,12, sensor_deltas1
-D, 2,13, sensor_deltas2
-D, 2,14, sensor_deltas3
-D, 2,15, sensor_deltas4
-D, 2,16, sensor_deltas5
-D, 2,17, sensor_deltas6
-D, 2,18, sensor_deltas7
B, 3, 11, sensor_states
D, 3, 12, rotor_slider0
D, 3, 13, rotor_slider1
B, 1, 11, sensorcfg0
B, 1, 12, sensorcfg1
B, 1, 13, sensorcfg2
B, 1, 14, sensorcfg3
B, 1, 15, sensorcfg4
B, 1, 16, sensorcfg5
B, 1, 17, sensorcfg6
B, 1, 18, sensorcfg7
B, 4, 11, AppDataB0
B, 4, 12, AppDataB1
B, 4, 13, AppDataB2
B, 4, 18, CycleCounter
Minimized Diagnostic Data output for one key (Ref, Sig, Delta, Status) and an application status word
Minimized Hawkeye File
static void report_debug_data( void )
{
int16_t sensor_delta;
output_to_debugger( (uint8_t *) &qt_measure_data.channel_references[0], (uint8_t) sizeof( qt_measure_data.channel_references[0] ) );
output_to_debugger( (uint8_t *) &qt_measure_data.channel_signals[0], (uint8_t) sizeof( qt_measure_data.channel_signals[0] ) );
sensor_delta = qt_get_sensor_delta(0); output_to_debugger( (uint8_t *) &sensor_delta, sizeof( sensor_delta ) );
output_to_debugger( (uint8_t *) &qt_measure_data.qt_touch_status, (uint8_t) sizeof( qt_measure_data.qt_touch_status ) );
output_to_debugger( (uint8_t *) &w_appdata0, (uint8_t) sizeof( w_appdata0 ) ); /* 16 bit */
}
D, 1, 1, Ref
D, 1, 2, Signal
-D, 1,3, Delta
B, 1, 4, Sensor_States
D, 1, 6, AppDataW0
t5. Hawkeye Operation:
a. Start [ Hawkeye.exe ], use FileOpen to select a Hawkeye Control file with format matching: report_debug_data( void )
b. Logging: Start, Finish , Click Open to see data (automatic filename)
c. Hawkeye 3D Graph control using Mouse (click Display Icon to select data to display):
Zoom: Mouse: Scroll Up-Down
Tilt: Mouse: Click&Drag Viewpoint
+
―
- End -
Select data
to Display