1
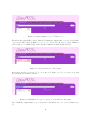
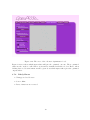
Figure 3.20: The view of the “Genetic Optimisation” tab
Figure 3.20 now shows which input values will give the optimised outcome. These optimised
values are the on the so-called Pareto front and are visualised with the red dots. Hence, when
clicking these red dots information will be given about which input values gives the optimised
output values.
3.7.4
Likely Errors
• Unsupported webbrowser
• Server offline
• Pareto functions are not used
19