1
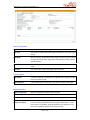
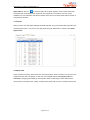
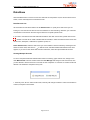
TempCentre Lite Help (20120530 Rev. A)
2. Graph View, multiple curves of record are plotted in one graph window, and every curve are marked
with different colors and character marks, example is shown below.
3. List View, when in multi-records mode, summary will change to tabular form to list all items in columns,
example is shown below.
Page 13 of 14