1
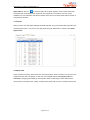
TempCentre Lite Help (20120530 Rev. A)
Start Time/First Point
The time data logger starts recording at, also the time of the first data point
recorded.
Stop Time
The time data logger stops recording.
Data Points
The total number of data points recorded.
Trip Length
The total time between first and last data point recorded.
Alarms
Alarm Limits
Temperature threshold in ℃ or ℉.
Alarm delay
Time threshold for triggering alarm.
Total Time
Total time above or below alarm limit.
Alarm Events
Total number of events below low alarm limit or over high alarm limit.
Alarm Status
Status of alarm condition.
2. Graph View
Select Graph tab to view data points to be plotted in graph as curve.
Hover, move cursor to the data curve, a tips containing summarized information of the data point below
appears.
Zoom In, right-click mouse and hold to drag a range horizontally to zoom in the data curve in this range.
Analyze left-click mouse and hold to drag a range horizontally to analyze the data curve of this range, a
tips containing summarized information like max, min temperature and MKT values over this selected
time range will appear.
Restore Default View, click icon
to restore current graph to default view.
Page 9 of 14