1
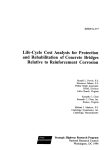
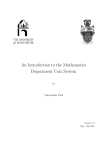
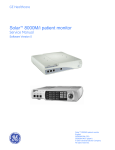
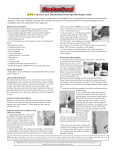
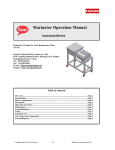
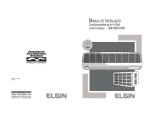
Concrete Thickness Gauge
Quick Start Guide
1. Connect the test head to the hand held reader
2. Turn Power on by depressing power switch on top of reader
3. Enter guess for design thickness of concrete element (in centimetres).
The equipment will automatically add 33% to this to ensure the correct
thickness is found.
4. Note if the design thickness is more than 60cm the thick mode of
operation will be automatically selected. This requires a secondary
impact device (ie hammer to be used. Refer to the users manual for
details.
5. A pulse velocity must be set for accurate thickness readings. Select
option 2 (Cal/Data) in the menu.
6. Option 2 from this menu an insitu calibration. Find some concrete of
known thickness. Enter the thickness (in centimetres). Press 1 to fire
the striker. A pulse velocity should be returned. If not try again; making
sure the concrete surface is reasonably smooth.
7. Option 1 from this menu allows the velocity to be set by the user. This
can be estimated with the chart in the Users Manual (page 8) using an
estimation of the concrete strength
8. Once velocity, it will return to the main menu. Thickness testing can
begin.
9. Hold the test head on the concrete where a thickness is desired.
Press 1 to do the test. After a second or two the thickness should be
displayed.
10. This can be stored or dismissed. If any error message is displayed
refer to the manual for meaning.
11. Install the software included with the equipment and use the CTG
download icon to start the download. When downloading ensure that
the option 2 (Cal/Data) then 4 (Download/recall) is chosen on the hand
held unit
12. The resulting *.dat file stored in the created CTG folder can be viewed
using Excel or Notepad. (See page 11-14 for detailed description)
Please refer to the user manual for more detailed instructions if any difficulty is experienced
IE Theory
The
he CTG operates on the principles of the Impact Echo (IE) test method. This
method was developed specifically for use on concrete to allow single-sided echo
testing for thickness measurements and flaw detection. The IE test method uses
a sensor to measure and record the waveform resulting from an impact to the
surface adjacent to the sensor. This time domain data (time versus amplitude)
includes energy from the initial impact as well as energy from echoes of the initial
impact which have traveled through the concrete and echoed off of the back side
(or off of any shallow cracks parallel to the test surface). By performing a Fast
Fourier Transform (FFT) on the data (converting it to frequency versus
amplitude), the echoes from the backside become clear and easy to see,
appearing as amplitude peaks in the frequency versus amplitude (spectrum) plot.
It is important to remember that each specific frequency in the spectral display
corresponds to a specific thickness or depth.
The simple formula T=C/2F’ is used to find the thickness of the concrete (where
T=Thickness, C=the velocity of the waveform through the concrete and F’ is the
frequency found by performing the FFT). It is important to remember that for this
relationship to hold the concrete must act as a plate whereby the width and
breadth of the concrete is at least 3 times the thickness.
CTG- Concrete Thickness Gauge User Manual
The CTG series of instruments are powerful, hand-held
devices designed primarily to measure the thickness of
thin concrete slabs and walls in the range of
approximately 4cm out to about 2.4m without the need
for drilling, coring, or other means, and with only access
to one side of the member required. In addition, the CTG1T system allows saving and downloading of the test
results into a spreadsheet for profile generation, etc.,
while the CTG-1TF system also allows downloading of
saved waveforms into a powerful analysis software
package that lets the user perform additional analyses of
the data. This additional analysis capability turns the
CTG-1TF into a fully functional Impact Echo (IE) based
flaw detection system, capable of analyzing echoes from
multiple cracks and other flaws.
The CTG units feature a graphical display of the received
signal spectrum (which can be saved and recalled on the
unit), which allows visual indication of data quality, easy
differentiation of bad data, and even the location of partial
cracking damage. This line of instruments can also be
used to determine relative concrete quality (by measuring
concrete compression wave velocity) for test cylinders
and other samples with known thicknesses. The device
can also be used for thickness measurements of many
materials other than concrete, such as plastics, stone,
etc., depending on the properties and internal structure of
the material being tested.
The CTG line includes the capability for measuring in two
ranges. The THIN range uses the internal solenoid
striking as an impact source, and is used to measure
thicknesses from 4 to about 50cm. The THICK range is
used for thicknesses greater than 50cm, and requires the
use of an external hammer (for greater low-frequency
energy) to generate the impact for echo frequency
measurements. The range setting of the unit is
automatically set upon start-up based on the design
thickness entered by the user, or can be manually
selected during use from the main menu.
The CTG lines are rugged, battery-powered units
designed for easy, fast, and reliable operation by anyone
with no special training required for basic operation. This
operation manual begins with a description of the
hardware and simplified operating instructions for all
three models, continues on to a more detailed
explanation of the various features and functions
available, and then includes sections specific to the
operations of the special features of the CTG-1T and
CTG-1TF. Please note that for the CTG-1TF, this manual
only includes instructions on collecting and downloading
the data. Instructions on the use of the TFS software for
full data analysis on the users PC are included in a
separate manual for the TFS software.
Page 1
BASIC OPERATION
Hardware Connection
The CTG system consists of several
basic parts: the CTG main body with
integral cable, the test head (which
includes the sensor, solenoid
impactor, for THIN mode tests), and a
selection of external hammers for THICK mode tests.
Hardware connection consists of connecting the
connector on the end of the integral cable to the test
head.
NOTE: Do note allow dirt or moisture to enter the ends of
the test head or cable connectors, as this may interfere
with the connection and/or operation of the unit.
To connect the test head, butt the two connectors
together and rotate the cable connector until it partially
engages. Then rotate the lock ring of the cable connector
clockwise to screw it down until it locks into place on the
test head. The connector should engage fully onto the
test head connector and click into place during the
locking process.
CTG Operation
Once the test head is connected to the cable, the CTG
may be turned on by pushing the push-on/push-off power
switch. The CTG model (CTG-1/CTG-1T/CTG- 1TF) and
the version number of the software will display
momentarily, followed by a display of the number of
records currently saved in memory. The program will
then ask the user for the slab or wall design thickness
(‘Enter design thickness.’ (in or cm)). At this point, use
the keypad to enter the expected or
design thickness of the test area. This
design thickness will be used by the
CTG to set the range (THIN or
THICK), Max
Thick (maximum test thickness, see
below) at 33% greater than the
expected thickness, and to select one of three peak
picking algorithms which are each optimized for a certain
thickness range. As an example, if an expected thickness
of 23cm is entered, the Max Thick will be set to 28cm, the
THIN mode will be selected, and the ‘medium’ thickness
picking optimization routine will be used for automated
data analysis.
If the expected thickness is not known, simply enter
a large value to allow the unit to search a wider range
of thicknesses.
For thinner unknown sections such as slab or walls to be
tested with the internal solenoid (THIN mode), enter a
value of 50cm. For thicker structures to be tested in
THICK mode enter a value of 1m if the thickness is not
known. For very thin sections, such as sidewalks or
driveways, we recommend entering 12-15cm as the
design thickness. The graphical display of the entire
collected spectrum will then allow the user to narrow
down the actual depth range for later tests, if needed.
The computed Max Thick value is momentarily displayed
immediately after the design thickness is entered. The
unit will not measure thicknesses greater than Page
the 2
displayed Max Thick value unless the Max Thick value is
changed in the ‘Calibrate’ Menu discussed below. The
alternative way to change the thickness range of the unit
(such as changing to a different slab or wall thickness) is
to cycle the power off and then back on, and enter the
new design thickness. Note that in THICK mode, the
minimum thickness is about 30cm. Thus, if testing thinner
members (< 30cm) in THICK mode, the results will not be
correct.
After the expected thickness is entered, the main menu
(Test, Cal/Data, Resolution, or Mode) will appear.
To perform a simple test using the built-in default
concrete properties values, simply press the test head
against the concrete and press any RED key - ‘1', ‘3', or
‘0' - or the red FIRE button on the side. In THIN mode,
the impactor on the test head should click one to four
times and the screen will clear. In THICK mode, the
screen will display ‘Strike Surface...’. At this time, impact
the surface next to the test head with a small hammer.
Strike the surface within about 15cm of the test head.
The selection of hammers is discussed in a section
below. For either mode, if valid data was obtained, in a
few seconds the thickness will appear (in inches or
centimeters, depending on the English/Metric units
switch), along with a spectral display of the data with the
picked peak marked. The marked peak is the frequency
peak used to compute the displayed thickness. At the
lower left side of the screen, the option to EXIT or SAVE
is presented. Pressing ‘1' (EXIT) will clear the last
reading and display the main menu again. Pressing ‘2'
(SAVE) will save the data in memory, including the
displayed spectrum, and display to the user the current
record number the data was saved under. The unit is
capable of storing up to 300 records, after which a
‘Memory Full’ message will appear and no more data will
be saved. To save more records, the memory must be
first cleared (see section on Data/Recall menu). The unit
is now ready for the next test. Note that multiple impacts
(in THIN mode) after a FIRE command are caused by
automatic gain adjustment and re-firing of the unit if the
signal received was too strong or too weak in a given
test. There is no gaining in the THICK mode, as the unit
is fixed at the lowest gain setting due to the higher
energy typically produced by external hammers.
THICK Mode Hammer Selection
When testing in THICK mode, the selection of the proper
hammer is important in obtaining the best quality data.
For tests on walls expected to be between 60-150cm in
thickness, a ½ kg steel hammer will be the best choice.
For thicker structures, use of a 1.5 kg or larger hammer
On/Off
Backlight
will result
in clearer data. Units
Operational Controls
Page 3
Backlight
The CTG has a built-in backlight for the display to allow
operation in low-light conditions. Simply press in the
‘Backlight’ switch to activate. Note that the continuous
use of the backlight will reduce the battery life by a few
hours.
English/Metric Units Selection
The CTG can operate with either English units or Metric
units. The units are selected by the push-on/pushoff
button at the top of the CTG labeled ‘English/Metric’. For
English units, the thicknesses are displayed in inches
(in), and velocities in feet per second (ft/s). For Metric
units, the thicknesses are displayed in centimeters (cm)
and velocities in meters per second (m/s). Changing the
units switch with a thickness or velocity displayed will
immediately recomputed the thickness or velocity in the
new units and re-display the new reading.
Changing the units will also re-compute the current
velocity for thickness calculations and Max Thick value to
the new units selected.
OPERATION NOTES AND HINTS
Max Thickness: The CTG with the THIN/THICK software
will work on concrete walls and slabs with thicknesses
ranging from approximately 4cm to over 1.8m under ideal
conditions. In THIN mode, the most reliable readings
from the unit will result from tests in the 5-25cm range.
Slabs which are in the thinner end of the operating range
(less than 10cm) will sometimes give false readings
which are much too thick (such as 25-30cm from a 4.5cm
thick slab) if the design thickness (and thus Max Thick) is
set high (such as 25-30cm). This is normal, and is due to
additional resonances present in a thinner slab. Note that
this type of response will be particularly likely when
testing on a thin section with the unit set to THICK mode.
To eliminate the possibility of these false readings, the
CTG requires the user to input a design thickness, from
which the operating mode and peak picking algorithm are
selected and the Max Thick value computed. This will
limit the maximum thickness range of the CTG to 33%
greater than the entered design thickness.
Note that if the unit is then used to test thicker
concrete, the design thickness value will have to be
changed by reentering a new Max Thick value or by
cycling the unit off and then on and entering a new
design thickness
Display Messages
Several different messages may be displayed instead of
the thickness after a test if the test does not yield clear
results. If the CTG does not receive good data with a
clear echo peak from the concrete thickness, the unit will
not give a thickness reading and will instead give a
message to the user indicating why a reading was not
Page 4
obtained.
A message of “No Signal, Retest, Press any Key”
indicates that the signal level seen by the transducer was
insufficient. This will typically happen if the test is done
with the test head in air or otherwise not in good contact
with a smooth concrete surface. For THIN mode, this can
also result from the anvil not being in direct contact with
the concrete surface, either because it is over a hole or
depression, or if the solenoid is set too high and is not
striking the anvil top. If this message appears repeatedly
on flat concrete when testing in THIN mode, adjust the
solenoid position downward by 2-3 mm and retest. For
tests done in THICK mode, this message also means
that the signal received was not sufficiently strong to
trigger the system. The most common cause in the
THICK mode is a failure to impact the surface within the
6 second time window during which the unit waits for a
trigger in THICK mode. If this happens, simply repeat the
test and be sure to strike the surface within 6 seconds of
pressing the FIRE key. If the surface was struck, but the
message still appears, check the transducer contact
and/or repeat the test with a harder impact. A message of
“Delam/Debond, Press any Key” (THIN mode only)
indicates that the signal level was too high. This is typical
of tests on delaminated concrete or very thin material.
This message will also appear if a test is attempted on a
table top or metal surface, or if a test is done through
unbonded tile or other topping material. Occasionally, this
message may appear if testing on the end of a concrete
cylinder or other undamped test sample.
If this is the case, try re-testing with less pressure (or no
pressure) applied to the test head. A message of “High
Signal: Retest, Press any Key..” (THICK mode only)
indicates that the impact of the hammer was too strong,
and that the test needs to be repeated with a lighter
impact. Note that the CTG does not require a strong,
hard hot to collect good-quality data. A light strike with
the hammer allowed to rebound off of surface is usually
the best.
A message of “No Echo, Retest, Q=0, any key...”
indicates that the signal amplitude was good but that no
clear echo peaks were found in the record. This can
happen if the tested member is very thick, if the concrete
is internally honeycombed or has multiple fractures, or if
the back side is very uneven (such that no single
thickness is seen). This message can also happen if the
design thickness value is set too low for the concrete
thickness being tested. Note that the IE method relies on
seeing reflections from changes in sound wave velocities
to measure thickness. If the concrete is on top of a
similar stiff material (such as rock or a cementitious base
course) no echos may result and this message will
appear. This message can also appear in THIN mode if
the batteries are very low (low battery light on or flashes
during impacts) and the impact is therefore too weak to
produce a strong signal.
A message of “Adjust Sol. UP, Press any key...” (THIN
mode only) indicates that the solenoid may be too close
to the anvil on the concrete surface. This will happen if
the anvil is resting on a high spot under the impactor or if
the solenoid needs to be adjusted up in the frame. Page
If the5
message repeats at several locations, adjust the solenoid
up by 2-3 mm and repeat the test.
The “Q value = X” message, where the X is a number 09, is an indication of the sharpness of the echo peak. For
tests with a valid thickness, higher Q values are
indicative of a smooth, even back side. Concrete slabs
on grade or walls with uneven back sides will generally
result in a lower Q value. Note that a low Q does not
necessarily indicate a poor reading, but may indicate that
the actual concrete thickness in the area of the test
location varies over a range due to uneven concrete.
Tests on samples such as standard concrete cylinders
will normally give the highest Q values (9 typically) due to
the sharp resonance of the cylindrical shape. The Q
value can be correlated with the spectrum on the screen,
with sharper spectral peaks resulting in higher Q values.
High/Low Resolution Mode: The CTG offers two
selectable thickness resolution modes. The default mode
is approximately 2.5% of the thickness reading, while the
high-resolution mode is approximately 1% of the
thickness reading. Selecting the resolution mode is done
by pressing either ‘7' (low resolution) or ‘9' (high
resolution) when the main menu is displayed. The option
displayed at any given time will be the option that is
currently NOT selected, as this allows the user to change
options, if desired. The screen will clear momentarily as
the new resolution mode is stored, and then the main
menu will reappear. Note that the computation of the
thickness after each test will take about twice as long in
high resolution mode as compared to the default low
resolution mode. Note too that for CTG-1TF systems, the
time data is saved and downloaded as high resolution for
all tests, regardless of the selected mode. Batteries: The
rechargeable batteries in the CTG should last 14-16
hours typically on one charge if the backlight is not used,
or 10-12 hours if the backlight is used. To charge the
batteries, simply plug the charger (only use the charger
supplied) into a 110 VAC outlet (220 vac if ordered with
that option) and plug the other end into the jack on the
right side of the CTG. Allow the unit to charge 10-12
hours (overnight) to fully recharge. Charging is best done
at room temperatures to maximize battery life and to
allow a full charge. Note that the unit can be used while
charging, if desired, but that this will slow down the
charge rate. The ‘LOW BATTERY’ light on the front of the
unit will light up (or flash during tests) when there is about
½ hour of operating time left on the batteries. Operating
the unit after the low battery light is on continuously may
result in erratic readings or error messages. Battery
Replacement: The batteries in the CTG should typically
last for 500-1000 recharge cycles before reduced
operating time from an overnight recharge is noticed. The
battery pack in the CTG consists of 10 A-A sized
batteries in a holder. If needed, they can be replaced by
the user with new rechargeable batteries or with standard
alkaline batteries. Battery replacement is a simple matter
of opening up the back of the CTG to expose the battery
compartment, disconnecting the battery pack connector,
and then replacing the batteries (top and bottom) in the
holder. After replacement, reconnect the battery
connector and replace the battery pack into the space in
the CTG. Finally, replace the 6 screws removed Page
to 6
access the battery pack. If the new batteries are
rechargeable, it will be necessary to charge the unit
overnight before use, as rechargeable batteries normally
come in a discharged state. Caution: Do not attempt to
recharge non-rechargeable batteries (such as
alkaline cells), as damage to the unit or personal
injury may result. Also, only replace the batteries
Page 6
with nickel-cadmium rechargeable batteries or nonrechargeable alkaline cells. The use of Li-Ion or other
similar batteries may also result in damage to the
unit or personal injury, as the charging system has
not been designed for these batteries.
CALIBRATION
The CTG measures thicknesses of concrete by
measuring the time required for an echo to bounce off the
back side of the concrete member being tested. The
thickness is then computed by using this travel time
along with the speed of sound in the concrete. The speed
of sound in concrete can vary over a range of typically +/10- 15%, 3,000 to 4,300 meters per second (m/s))
depending on the mix design, aggregate type, and age of
the concrete. Lower strength mixes typically have
velocities in the lower range, while high strength mixes
have higher velocities. The default velocity is 3,657 m/s,
which is a typical value found in normal slabs and walls
with 20-27.5MPa concrete mixes. Using this velocity with
no additional calibration should give thicknesses within
10% or less of the actual value for most concrete
structures. To increase the accuracy, the CTG offers two
easy ways to calibrate the unit to the specific concrete
being tested.
The first calibration method requires a test location with a
known thickness. This can be on any testable part of the
member being tested, or on a structure or test cylinder
made from similar concrete. From the main menu, press
‘2' (Cal), and then ‘1' (Thickness). Next enter the
thickness in the units requested (depending on the
current Units switch setting), either inches or centimeters,
at the calibration location, and then press ‘ENT’. Next,
press the test head onto the surface at the known
thickness location and perform a test (press a red key or
the FIRE button). If valid data is obtained, the CTG will
display the measured velocity at the test location. Be
sure that the velocity displayed is reasonable for the
material being tested (i.e. in the normal concrete velocity
range for concrete tests). If the velocity is not as
expected, repeat the test or move to a different location.
Note that a thickness-based calibration should not be
done in THIN mode on very thick (over 25 cm) or very
thin (under 8 cm) members for the best reliability. When
testing in THICK mode, we recommend a thickness
range of 60-150cm for the best calibration data. In
addition, calibration should be done on a smooth, clear
surface with a flat backside to obtain the clearest
possible data. Once a valid velocity obtained, the unit will
now use this velocity for all subsequent tests until it is
turned off or the unit is re-calibrated. If large amounts of
testing are anticipated for a particular type of concrete,
the user should write down the velocity displayed to allow
the direct entry of the velocity in the future (after the unit
has been turned off and the velocity re-sets to Page
the 7
default) using the procedure described in the next
paragraph. The second calibration method is the direct
entry of the velocity of the concrete in either ft/s or m/s.
This method of calibration can be used if a velocity has
already been determined for a particular concrete type
(from a previous thickness-based calibration, for
instance), or if the approximate velocity is known based
Page 7
on experience with similar concrete batches or the
general mix design. To enter the velocity directly, from
the main menu press ‘2' (cal/data), then ‘2' (Velocity).
Input the velocity in ft/s or m/s, as requested on the
display. Note that the velocity must be in the range of
1,500 to 7,600 m/s to be accepted. Pressing ‘ENT’ with a
valid velocity entered will save the velocity and return to
the main menu, ready to test.
If no location is available on the test member with a
known thickness, then the accuracy of the thickness
readings can still be improved over the default accuracy
by inputting a typical value from the table below based on
the estimated strength of the concrete. Typical velocity
ranges for normal concrete designs are as follows:
14-20MPa: 3353m/s
20-31MPa: 3657.6m/s (default value)
31-38MPa: 3962m/s
38-48MPa: 4267m/s
Note that these values are general guidelines only, and
should only be used if a direct calibration cannot be
done. Using these values should improve the accuracy of
the thickness measurements, but will not result in
accuracies equal to those from a direct calibration.
Please note that while the CTG can be used to measure
velocity of an unknown concrete material, use of these
measured velocities to back-calculate strength (such as
from the table above) is NOT recommended and will not
necessarily be accurate without correlation testing to
actual strength values for a particular mix design.
GRAPHICAL SPECTRAL DISPLAY
The CTG includes a graphical display which presents the
frequency spectrum of the data collected for each test,
although the spectrum plot includes a scale on the
bottom which shows approximate thickness rather than
frequency to simplify the data analysis. The automatically
picked thickness echo peak is noted on the display with a
small cross. This peak is the one used to compute the
measured thickness which is numerically displayed on
the left side of the screen (i.e T=7.9 in). The sharpness of
this peak is reflected in the Q value displayed right under
the thickness value.
Note that the thickness range displayed is different for
THIN and THICK modes. This is due to the different
sample rates for the two modes, which results in different
frequency spectral ranges. All required conversions are
taken care of by the internal software during mode
switching.
21.3in
3.7in
Page 8
CTG-1T Display: Test on a 3.7 inch slab with 25 inch
Max Thick
There are several advantages to having the complete
spectral display (rather than just the picked thickness
value). The most important is that the validity of the
picked peak can be checked. For cases such as very thin
concrete, there are often several peaks present, with a
high-frequency (shallow) peak from the actual thickness
echoes, and one or more low-frequency (deep) peaks
resulting from structural resonances. A typical example is
presented below of a test on a thin (3.7 inch) concrete
slab on grade, but with the Max Thick value set to 24
inches.
The CTG automatically picked the low-frequency
structural resonance peak at 21.3 inches as the thickness
peak, but there is a clear thickness echo peak present at
3.7 inches.
Correct Thickness of 3.7in
The correct (shallow) thickness peak can be
automatically picked by simply re-setting the Max Thick
value to a lower value. From the spectra shown above, it
is clear that there are no other significant peaks present
beyond the very low frequency peaks at the left end of
the spectra, so any Max Thick value in the range of 5 to 8
inches would be usable. A re-test at the same location
after setting the Max Thick value to 6 inches is presented
below. As can be seen, this pectra does not include the
low-frequency (deep) data, and the automatic pick is
correct at 3.7 inches.
CARE AND MAINTENANCE
The CTG is a rugged unit designed for construction site
use, but it is not indestructible. Certain precautions
should be taken to ensure the reliable operation of the
unit.
1. The CTG should not be exposed to direct rain or other
moisture.
2. Take care not to drop the CTG or the test head, as
damage may result.
3. Do not pick up the CTG or the test head by the cable,
as the cable and connector are not designed for this type
of stress.
4. The display screen can be damaged by impacts,
excessive pressure, or sharp objects.
5. Do not leave the power switch in the ON position once
Page 9
the batteries have been discharged unless the unit is
being used
with the external power supply/charger attached.
6. The test head should be kept clean and free of mud
and dirt, as mud can interfere with the operation of the
solenoid impactor and small rocks or other objects on the
sensor face can result in poor data or low signal
amplitudes.
7. When moving the test head to a new location, take
care not to drag the transducer head (the orange
urethane button on the bottom of the large round
cylinder) across the concrete, as this will cause
excessive wear n the transducer.
8. While the test head will operate properly on wet
concrete or even through a film of water, do not
submerge the test head. If the test head falls into water,
disconnect the cable, clean off any mud or dirt, and allow
it to dry out as soon as possible.
9. The keypad is designed for finger operation. Do not
operate the keypad with a sharp object (such as a pencil
end) as this may pierce the keypad cover and damage it.
10. When placing the test head on a surface, place the
rear feet down first and then rotate the unit down into
position. This will ensure proper contact between the
transducer tip and the test surface.
CTG-1T/F SPECIAL FEATURES
The CTG-1T and CTG-1TF are versions of the CTG
which allow the user to output a table of test results
through the serial port to a PC for subsequent storage,
manipulation and display. In addition, the CTG-1TF also
downloads the saved time domain data traces collected
for each saved test. This time domain data can then be
analyzed by the TFS signal analysis software package.
One feature common to both the CTG-1T and CTG-1TF
is the inclusion of a time/date clock which can be set by
the user. The time and date of each test is saved along
with each saved data set for subsequent download.
This section of the manual will discuss the setting and
use of the Real Time Clock (RTC) and the data
downloading procedure. Included is a discussion of the
use of the Windows-based download software, the
downloaded results data formats, and typical
applications. This manual does not include instructions
on the use of the TFS software for analysis of the
downloaded data using
CTG-1TF systems, as the TFS software has it’s own,
much more extensive user manual.
CLOCK CHECK/SET
The clock functions on the CTG-1T and CTG-1TF are
accessed from the “cal/data” selection (2) on the main
menu. Next, select “Download/Recall” (4) and then
“Clock Set/Display” (3).
The currently set date and time will be displayed in the
format:
‘Date = MM/DD/YY’
‘Time = HH:MM:SS’
If these settings are correct, simply select “Exit” (2) to
return to the main menu. If the date or time needs to be
set, press 1 to select the “Set Time/Date” option. After
pressing 1, the screen asks for the date in the format
MMDDYY, where MM is the current month, DD is the
Page 10
current date, and YY is the current year. After entering
the digits requested (June 3, 2002 is entered as 060302),
press ENT to enter the date and move to the time set.
Enter the time in the format HHMM, where HH is the
current hour (in 24 hour format) and MM is the current
minute. Then press ENT to enter the time and return to
the main menu.
DATA SAVING AND DOWNLOADING
For the CTG-1T and CTG-1TF, the test results and test
time/data are saved automatically each time the user
elects to save a record from the test results display
screen. In addition, for the CTG-1TF, the time domain
waveform data for the current test is also saved at the
same time. The test result which are saved by the unit for
each test include the test number (displayed upon
saving), the measure thickness (in inches or centimeters,
depending on units switch setting), the Q value, the units
(1 for English, 0 for metric), the Max Thick setting, the
velocity at the time of test, and the time and date of the
test. These parameters are downloaded in ASCII format
into a tabular format file which can be easily read in by
Excel or other spreadsheet programs.
To download the data, the user must first install and run
the CTG-1T/F download software on a Windows PC
(WIN 95/98/2000) with a free serial (COM) port. The
software is capable of using COM1-COM4 for download.
To install the download software, first insert the software
CD in to a CD drive. Using Explorer, or other file display
software, open the CD directory and double click
(execute) the SETUP file. Follow the instructions onscreen to install the software and select the location for
the shortcut on the START menu. If a single computer is
to be used often for downloading, it may be useful to
create a shortcut on the desktop to the download
software as well. Please note for certain computers, there
have been reports of errors in registering certain files
during loading. If this occurs, simply choose ‘Ignore’ and
continue on. The software in all cases has loaded
correctly. After the
completion of software loading, the normal location for
the shortcut is under the START menu, PROGRAMS,
CTG- 1TF DOWNLOAD. Open this menu item to access
the download software shortcut. Drag this shortcut out
into the desktop to create an easily-accessible icon.
Executing the download software will open up the main
download dialog box, as pictured below. The box shows
Page 11
the pre-selected default file names, as well as the various
options for use.
base name and directory location
downloading multiple sets of data.
DOWNLOAD DIALOG BOX FUNCTIONS
Results File Name Display and Selection The download
software allows the user to select a file name and
location for the downloaded ASCII results data (‘Select
Results File’ button) and shows the currently selected
results file name and location. This is the only file name
option applicable to the CTG-1T systems. Please note
that if an existing file name and directory is selected as
the download target, or if the default file name and
directory is used all the time, the download software
WILL OVERWRITE any data currently in that file.
Download Data File Name Display and Selection
The time domain data for CTG-1TF systems is
downloaded to a series of files, with the total number of
files equal to two times the number of saved records.
Each downloaded data set creates a *.DAT file and a
*.PRM file for use by the TFS analysis software. The
naming of these files is done by starting with a usercreated base file name (up to 5 characters) to which the
test number is appended to create the final full file name.
Thus, if the base name is “TEST”, the file names of the
time data after download will be TEST1.DAT,
TEST1.PRM, TEST2.DAT, TEST2.PRM, etc. The base
name is input into the “Download Base Name” box. The
data directory is set through the “Download Data
Directory” box. Please note that the CTG download
software WILL OVERWRITE existing data if the same
Select Port
The Select Port option allows the user to select which
COM port to use for the data download. Note that up to 4
COM ports can be displayed, but that only valid ports
which are currently NOT IN USE will be displayed for
possible selection. If no valid ports are found, a message
is printed in a message box at the lower left corner of the
screen. If this occurs, then either a serial port needs to be
freed up from it’s current use (such as running an
external modem or mouse), or additional COM ports
must be installed or turned on. Note that most
motherboards allow the activation or deactivation of the
COM ports in the CMOS setup mode. If one or more
serial ports have been turned off, they will not be usable
until turned on again. If more than one valid COM port is
shown on the screen, select the port that will be used for
the download. Note that one of the most common
problems in downloading data is the selection of a
different COM port in the software than the one to which
the download cable is connected.
is
used
for
Clear CTG
The Clear CTG button is used to ERASE all data
currently stored in the CTG, if it is in DOWNLOAD mode.
Pressing this button will bring up a confirmation
message, asking the user to click one more time, and
then will erase all stored data in the CTG connected to
Page 12
the COM port. Please be careful with this function, as the
data cannot be recovered once erased.
Download CTG and Status Window
The Download CTG button is used to download the data
from the CTG. Do not click on this button until the desired
data file names and directories for the results and the
time data (as applicable) have been set. Also, this button
should be clicked only AFTER the CTG is in the
DOWNLOAD mode, as described below. When data is
being downloaded, the current file number being sent is
displayed in the status window located directly under the
Download CTG button.
The status window then allows the user to monitor the
progress of the download operation.
OK and Cancel Buttons
Both of these buttons can be used to exit the program. At
this time, there is no difference in function between them.
DOWNLOADING PROCEDURE
The basic procedure for downloading data is
for both the CTG-1T and CTG-1TF, with the
that the CTG-1TF requires the selection of an
file base name for the downloaded data files.
The step-by-step procedure is as follows:
1. Connect the CTG to a PC serial port via the
cable supplied with the unit.
2. Start the download software.
3. Select the correct COM port
the same
exception
additional
download
4. Select the desired file name and directory for the
ASCII results data file.
5. Set the file download base name and directory for time
domain file downloads (CTG-1TF only)
6. Turn on the CTG unit, enter a dummy design thickness
of any valid value (9 inches, etc)
7. On the CTG, press ‘2' to enter the cal/data menu, then
press ‘4' to select Download/Recall, then press ‘4' again
to select Download. The number of saved results will
appear on the screen and the CTG is now in
DOWNLOAD mode.
8. Click on the ‘Download CTG’ button on the software.
Note: you have about 25 seconds to click on the
‘Download CTG’ button after the selection of Download
on the CTG
Download/Recall menu (while the CTG is displaying the
number of saved records). If no action is taken within 25
seconds, the CTG will exit DOWNLOAD mode and will
go back to the main menu. To download data, simply
start again by pressing ‘2', then ‘4', then ‘4' when ready.
After clicking the ‘Download CTG’ button, the download
process will begin. For CTG-1T units, the downloading
will be fast, as only the results data is being sent.
Downloading of 100 records should only take 5-10
seconds. For CTG-1TF units, the downloading requires
just under 1 second per record to complete due to the
additional data being sent. Thus, 100 records will take
about 1.5 minutes to download. At the end of a
successful download, the status window will show the
total number of records downloaded. Click on ‘OK’ to exit.
At this point, the user of a CTG-1TF unit can use the TFS
Page 13
software to analyze the data. This is discussed in the
TFS user manual. Users of CTG-1T and CTG-1TF units
can use a spreadsheet program to look at the
downloaded data results file. This file is discussed below.
CTG RESULTS FILE
The CTG results file is an ASCII file with data arranged in
columns. The column format is as follows:
1. Test Number
2. Measured Thickness (in or cm)
3. Velocity (in ft/s or m/s)
4. Max Thick Value (in or cm)
5. Q Value (1-9)
6. Units of Test (0=Metric, 1=English)
7. Date of Test (MM/DD/YY)
8. Time of Test (HH:MM:SS)
The columns of information are separated by spaces, so
click on the “spaces as delimiters” box, or otherwise tell
the spreadsheet program to split up the data based on
the location of spaces.
One typical application of the spreadsheet data is to plot
the thickness versus test point. If the tests were
performed along a line of evenly-spaced points, the
resulting plot will be a profile of concrete thickness along
a line across the slab or wall. If multiple lines are tested,
the data can be imported into a program such as Surfer
to create a 2-D plot of thickness across an area.
A typical plot from a spreadsheet showing the thickness
profile of a slab on grade is presented.
This is a plot of tests conducted at 1 foot intervals across
a 60 foot slab, and shows the typical variation of slab
thickness that can occur. A data set such as this one can
be collected in 10 minutes or less on a clear floor with no
obstructions to be moved.
DOWNLOAD TROUBLESHOOTING
If problems are experienced in downloading, the most
likely cause is a problem in the serial connection between
the computer and the CTG unit. If the download software
runs, but no data appears to be downloading (the counter
does not increment), check the following:
1. Be sure the CTG unit is in DOWNLOAD mode, as
described in the download procedure above, prior to
clicking on “Download CTG’.
2. Be sure that there are saved records in the CTG
(Number of saved records is greater than 0).
when importing the data into a spreadsheet, be sure to
Page 14
3. Check the connection between the CTG unit and the
serial port - is the serial port active, is the connection
sound, is the connector plugged into the correct port?
4. Verify the battery condition on the CTG unit - is the low
battery light on?
Page 15