1
User
Manual
Customer Service
877-881-8002
www.equinosis.com
Equinosis™ LLC
Last Updated 01/29/13
Page 1 of 81
Lameness Locator® User Manual
INDEX
BACKGROUND……………………………………………………………………………………………………..4
THE SENSORS………………………………………………………………………………………………………5
Turning the Sensors On and Off……….……………………………………………5
Charging the Sensors…………………………………………………………………….6
Attaching the Sensors to the Horse……………………………………………….9
The Head Sensor………………………………………………………………..9
The Right Front Pastern Sensor……………………………………….10
The Pelvic Sensor…………………………………………………………….12
LAMENESS LOCATOR SOFTWARE………………………………………………………………..15
Opening Lameness Locator…………………………………………………………..15
Overview of Lameness Locator Start Screen…………………………………16
Adding New Cases to Database……………………………………………………..19
Adding New Owner and Horse Information………………19
Adding New Horse To Existing Owner in Database……21
STEP BY STEP: Data Collection………………………………………..................24
Adding Custom Trials, Surfaces and Blocks………………………………….30
Rules of Thumb For Collecting Good Data……………………………………34
STEP BY STEP: Generating An Analysis Report…………………………….35
Report Generation of Archived Data (Delayed Data Analysis)……..43
Reviewing Previously-Generated Reports……………………………………45
Equinosis LLC
Page 2
Lameness Locator® User Manual
THE LAMENESS LOCATOR REPORT……………………………………………………………47
Horse Specific Data……………………………………………………………………….48
Ray Diagrams………………………………………………………………………………..48
Calculated Lameness Values (A1/A2, Max and Min Values) …..........49
Comments on Interpreting the Lameness Locator® Report…………51
Evaluating the Lunge…………………………………………………………………….51
Evaluating Flexion Tests……………………………………………………………….54
Comments on Evaluating Change Due to Blocks or Therapy…………55
Comments on Compensatory Lameness Patterns…………………………55
Expert System Assessment……………………………………………………………57
Baseline Straight…………………………………………………………57
Lunging……………………………………………………………………….58
Compensatory Lameness Patterns………………………………58
Blocking………………………………………………………………………59
DUAL REPORT FUNCTION……………………………………………………………………………60
TABULAR REPORT FUNCTION.……………………….………………………………………….63
DATA BACK UP..…………………………………………………………………………..…………………65
APPENDIX: REPORT INTERPRETATION EXAMPLES……………………………..66
Equinosis LLC
Page 3
Lameness Locator® User Manual
BACKGROUND
Lameness Locator® is a wireless inertial sensor-based, motion analysis system specifically designed to
objectively detect and evaluate lameness in horses. Inertial sensors are non-invasively attached to the
head (accelerometer), right distal forelimb (gyroscope) and pelvis (accelerometer). Movement data is
wirelessly transmitted in real time to a tablet PC, where a series of motion analysis algorithms are
implemented to analyze the collected motion. These positions and types of motion sensors were
chosen only after completion of an in-depth search for the most sensitive motion positions and
parameters for determination of lameness in horses. Vertical motion of the torso was found to be the
parameter that most closely mimics vertical ground reaction forces on the limbs, which is a direct
measure of lameness in horses.
The motion analysis algorithms of Lameness Locator® do not simply track and display trajectories of the
instrumented body positions and report these to the user. The algorithms developed for Lameness
Locator® were specifically designed to analyze motion related to lameness in the horse. They are an
adaptation of fault detection engineering where lameness (the fault) perturbs expected motion in a
sound horse. Lameness Locator® reports which limb or limbs are involved in the lameness, the intensity
of lameness in each limb, and the interval during the stride cycle at which lameness severity is greatest,
helping to differentiate impact-type or beginning of stance lameness from push-off type or end of
stance lameness. The equine veterinarian, with existing knowledge of anatomy and biomechanics, can
use this information to help further localize the foci of lameness within the limb.
The sensors of Lameness Locator®, because they sample motion at 200 times per second, are more
sensitive than the human eye, which samples at only about 20-25 times per second. Small differences in
motion amplitude of the torso caused by impact and push off of the right and left halves of the body can
be detected by the inertial sensors that would not be detected with the unaided human eye. This higher
sensitivity will also detect compensatory movement patterns in the opposite half of the body that are
normally not seen or appreciated subjectively. The veterinarian can use the whole torso movement
picture, both primary and compensatory patterns, to help objectively detect and evaluate lameness in
the horse.
Work on the concept of Lameness Locator® began at the University of Missouri in the early 1990s. The
motion analysis algorithms were developed over several years after investigating the characteristic
motion in lame and sound horses using naturally-occurring and induced lameness models, high-speed
cameras and the equine treadmill. Adaptation of these algorithms to an inertial sensor based system
began in the year 2000. Equinosis LLC, a faculty startup company funded by local angel investors was
formed in 2008. Further support of Equinosis for additional research and development is provided by
the National Science Foundation Small Business Technology Transfer Research grant program.
Equinosis LLC
Page 4
Lameness Locator® User Manual
THE SENSORS
Each set of Lameness Locator® sensors consists of head and pelvic accelerometers and a right forelimb
(RF) gyroscope. For ease of use in the clinical arena, some users may prefer to have multiple sets of
sensors. Each set will have color coded labels (white, green and/or brown) for identification.
The Head Sensor
The sensing unit in the head sensor is a uni-axis (vertical) accelerometer. The head sensor is labeled
HEAD, with a serial number. The drawing of the horse head on the label is oriented to facilitate proper
directional placement of the sensor on the horse. There is a small, rectangular 3M Dual Lock tape patch
attached to its non-labeled side.
The Right Forelimb Sensor
The sensing unit in the right forelimb sensor is a uni-axial gyroscope. The right forelimb pastern sensor
is labeled RIGHT FRONT with a serial number. The drawing on the label indicates that the sensor should
only be applied to the right front limb, oriented to facilitate proper directional placement on the horse.
There is a small, rectangular 3M Dual Lock tape patch attached to its non-labeled side.
The Pelvic Sensor
The sensing unit in the pelvic sensor is a uni-axial (vertical) accelerometer. The pelvic sensor is labeled
PELVIS with a serial number. The drawing of the pelvis on the label is labeled to facilitate proper
directional placement of the sensor on the horse. There is a small, rectangular 3M Dual Lock tape patch
attached to its non-labeled side.
Turning the Sensors On and Off
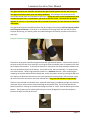
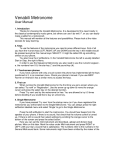
The sensor on/off switch is magnetic and embedded within the sensor casing. Turning the sensors on
and off is performed with a magnet, which is supplied with the system. The magnetic switch is located
near the left charging plate on the short end of the sensor.
Equinosis LLC
Page 5
Lameness Locator® User Manual
To turn the sensor on, place a magnet adjacent to the end of the sensor near the left charging plate. A
GREEN LED will turn on (visible from the side of the sensor) and, after about 3-4 seconds, begin blinking
rapidly. Move the magnet away from the sensor after the sensor LED begins blinking. The LED will begin
to blink more slowly, about two to three times per second. The sensor is now turned ON. Repeat with
the other two sensors and they are then ready for use. If the LED begins blinking but quickly turns off,
the sensor battery charge is low and should be re-charged. If the sensor will not turn on, the batteries
are completely discharged. Recharge the sensor by inserting into the Lameness Locator charging
station.
Green LED will illuminate here
Each Lameness Locator® sensor is designed with an automatic “power-off” feature. The sensor will
automatically shut off if not connected to the Lameness Locator® software after 20-30 minutes,
depending on existing battery charge. This functionality is designed to spare battery power if the user
inadvertently forgets to shut off the sensors after use.
To turn the sensor off, hold the magnet at the same previously-described position for 3-4 seconds until
the LED stops blinking. Note: the sensors cannot be turned off unless they are disconnected from the LL
software (refer to software navigation).
Charging the Sensor Batteries
Each sensor is equipped with an on-board, 4.5 volt, rechargeable, lithium polymer battery. The sensors
are recharged by placing within the 3-port battery charging station supplied with the Lameness Locator®
system (see below). DO NOT TRY TO CHARGE UP THE SENSORS WITH ANY OTHER BATTERY CHARGER.
Your Lameness Locator® sensors should be fully charged upon receipt, so you should not need to
charge them prior to first use.
Inserting the Sensors to the Battery Charger
Plug the battery charger into a standard AC, 110-volt, wall socket using the Equinosis 5V-DC
power adapter cord.
ONLY USE THE DC ADAPTER SUPPLIED WITH THE LAMENESS LOCATOR BATTERY CHARGER. THIS
IS A 5 VOLT DC ADAPTER. USING A HIGHER VOLTAGE DC ADAPTER WILL DESTROY THE SENSORS.
Equinosis LLC
Page 6
Lameness Locator® User Manual
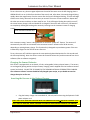
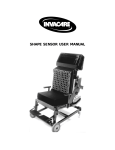
Insert the sensor into the charging station bay as indicated below, at an angle, such that the
conductive plates on the end of the sensor line up with the charging station pins.
CONDUCTIVE PLATES
INSERT ON ANGLE
CHARGING PINS
Press the end of the sensor with the lip down to snap the sensor into the bay.
**Note- attempting to force the sensors into the charging station bay otherwise, may
damage the charging station pins.
When the sensor is correctly inserted into the charging bay, a RED LED on the left side of the
sensor will turn on indicating charging has begun.
Charging indicator LED
When sensors are fully charged, this LED will turn off.
Equinosis LLC
Page 7
Lameness Locator® User Manual
Removing the Sensors From the Battery Charger
Hold the battery charger in the palm of one hand and use the thumb of the other hand to apply
pressure inward and upward on the lip of the sensor. Once this end of the sensor is free, remove
the sensor at an angle.
Prolonging long term life of the Lameness Locator® sensors
It is best not to continuously charge sensors unattended overnight. Unattended charging of the
sensors overnight will repeatedly “top off” the sensor batteries and is not recommended for routine
charging. Repeating this night after night will degrade long term battery life due to progressive battery
terminal corrosion.
The sensors will require 1 to 2 hours to fully charge from the fully depleted-low voltage state. Charging
will be considerably faster when only partially discharged. Sensors are fully functional without full
charge.
Do not leave the Lameness Locator® sensors inside the car or truck cab during a hot day. The lithium
polymer batteries will degrade more quickly at high temperatures. Also, and most importantly, if the
temperature rises above 138 degrees F, the battery may combust or become irreversibly damaged.
Equinosis LLC
Page 8
Lameness Locator® User Manual
Attaching the Sensors to the Horse (Instrumenting the Horse)
Attaching the Head Sensor
Turn on all sensors prior to attaching them to the horse. There are two appropriate methods of
attaching the head sensor, using either the custom designed Equinosis® head bumper, or attaching
directly to the crownpiece of a halter. In either case, the sensor should be attached with the label side
facing up and the green LED facing the horse’s LEFT side. The drawing of the horse head on the label
of the sensor should be oriented to match the direction of the horse (i.e. nose to nose). Also, the
sensor should be on the most dorsal aspect of the head, as close to the poll as allowable by the felt
head bumper or halter.
When attaching the head sensor, it is important to check that the head halter fits the horse snugly. If
the halter is too big for the horse’s head, the halter may rotate on the horse’s head as the horse is
restrained by the handler with the lead shank while the horse is moving (especially in misbehaving or
excited horses, or during the lunge). One easy method of tightening up a halter that is too large on the
horse’s head is to simply bunch up the nose band and connect straps attached to the tie ring with some
tape.
Attaching the Head Sensor to the Lameness Locator® Neoprene Head Bumper
Attaching the head sensor to the Lameness Locator® felt head bumper is, in most instances, the best
method. The location of the sensor attachment site on the bumper is in a previously-determined,
optimum position for measuring the head acceleration most applicable for detection of lameness in the
horse trotting over ground.
Also, attaching the head sensor to the Lameness Locator® felt head bumper reduces wiggle and noise
from the head sensor during data collection. While attached to the head bumper, the sensor will move
more reliably in better synchrony with the entire head. The head sensor is simply “snapped” onto the
Equinosis LLC
Page 9
Lameness Locator® User Manual
head bumper by pressing the sensor into the 3M Dual Lock tape pad on the head bumper immediately
in front of the halter strap loop. For best results, after attachment of the head sensor, the user should
check that the head sensor is situated as close to the midline of the poll as possible before collecting
data. This is best evaluated while viewing from the front of the horse.
Attaching the Head Sensor Directly to the Head Halter
In horses that are too head shy to tolerate placement of the felt head bumper over the ears, or that will
not wear the bumper without excessive head shaking, the sensor can be attached to the most dorsal
aspect of the crownpiece of a halter or bridle (see picture above). When the sensor is attached in this
position, the vertical movement of the head measured by the sensor is attenuated slightly, especially if
the horse carries its head high during the examination. However, since the lameness analysis algorithms
rely on the shape of the vertical head movement signal, and not on the absolute amplitude of the signal,
this is in most horses of only minor importance.
To attach the sensor to the halter, a strip of 3M Dual Lock tape can first be attached to the most dorsal
position on the crown piece of the halter. With most clean Nylon or cloth halters, the sticky side of the
3M Dual Lock tape will usually be strong enough by itself to hold the sensor for at least a few trials.
Alternatively, the 3M Dual Lock tape strip can be taped or glued into this position on the head halter.
The sticky side of the 3M Dual Lock tape does not affix well to leather halters, especially if they are dusty
or soiled. One solution that has worked well is to have, on hand, halters of different sizes with the 3M
Dual Lock tape already glued in place. One should take care to use a sufficient length of 3M Dual Lock
tape since adjusting the buckle of the crown piece after attaching the sensor will likely move the sensor
off of the most dorsal aspect and require repositioning.
Attaching the head sensor to a round or rope halter or bridle is best accomplished using the felt head
bumper.
Attaching the Right Forelimb Sensor
The right forelimb sensor should be applied to the dorsal aspect of the right forelimb pastern. It can
also be applied to the dorsal aspect of the right forelimb hoof wall, but putting the sensor on the hoof
wall should only be attempted when the horse is examined on a hard, flat and smooth surface. Putting
the sensor on the dorsal hoof wall and trotting the horse in dirt or sand may damage the sensor.
Putting the right forelimb sensor on any other but the right forelimb will result in incorrect results.
Equinosis LLC
Page 10
Lameness Locator® User Manual
The right forelimb sensor should be attached to the right forelimb pastern with the label facing out
(not against the limb) and the green LED facing LATERALLY. The drawing of the distal limb on the
sensor label should match the orientation of the horse. Putting the sensor on the limb backwards, with
the label facing the limb, or upside down, will result in incorrect results. The results will be exactly
opposite of correct (i.e. the wrong limbs will be selected for lameness) for both forelimb and hind limb
evaluations.
The right forelimb sensor should be placed on the dorsal aspect of the pastern with its long axis parallel
to the long axis of the limb. If the sensor is not parallel with the long axis of the limb, due to either
improper positioning, or rotation greater than about 30 degrees off midline, mistakes in the analysis
may occur.
Using the Lameness Locator® Pastern Wrap Pouch
The pastern wrap pouch should be wrapped around the right forelimb pastern. Position the first part of
the wrap on the limb such that, when fully encircling the limb, the pastern pouch is situated on the most
dorsal aspect of the pastern. To achieve this position in most horses, the wrap should be started on the
dorsal or dorsolateral aspect of the pastern. For smaller horses, start more dorsally. For larger horses,
start more laterally. Wrap snugly around the pastern in a clockwise direction. After completing the
wrapping, secure with attached hook and loop tabs. Attach the pastern sensor by pressing the 3M Dual
Lock Tape on the bottom of the sensor to the Velcro patch on the pastern wrap. Pull the sensor pouch
up around the sensor and secure with hook and loop tabs. The green LED should be facing laterally.
If data is to be collected on excitable horses, especially while lunging, an additional single strip of elastic
cloth tape may be used to secure the proximal edge of the pastern wrap. This will help prevent the
pastern pouch from rotating on the limb and causing the sensor to “move” from the dorsal aspect of the
pastern. If the pastern sensor moves significantly (more than 30 degrees) from the dorsal position,
lameness analysis will likely be incorrect.
Equinosis LLC
Page 11
Lameness Locator® User Manual
Attaching the Pelvic Sensor
The pelvic sensor is attached between the tubera sacrale on the dorsal midline of the pelvis. In most
horses, this is the highest point of the pelvis. The sensor is attached to a strip of 3M Dual Lock tape
spanning the tuber sacrale. Care should be taken to ensure that the sensor is on midline. This is best
accomplished by viewing sensor location from behind with the horse standing squarely on both hind
limbs. The pelvis sensor should be attached with the labeled side facing up and the LED facing to the
horse’s LEFT. The drawing of the pelvis on the sensor label should be oriented in the same direction of
the horse (i.e., tail to tail).
Finding the Center of the Dorsal Pelvis (Between the Tuber Sacrale)
In most horses, finding the tuber sacrale is not difficult. In fat horses or in horses with voluminous
gluteal muscle mass, it may be challenging. One method that works well in any horse is to first palpate
the dorsal spinous processes of the lumbar vertebra, moving straight back until the most dorsal aspect
of the pelvis is reached (see picture below). The center between the tuber sacrale should be within this
area.
Attaching the 3M Dual Lock Tape Across the Tuber Sacrale
The pelvis will rotate to one side when the horse is not standing with equal weight on both hind limbs.
It is important to try to find the center between the tuber sacrale when the horse is bearing weight
equally on both hind limbs. Using a long piece of 3M Dual Lock tape (approximately 2 inches) to span
across the tuber sacrale area will give the user latitude for repositioning the sensor later, if needed. In
many cases, the 3M Dual Lock tape will stick to the body well enough without clipping of hair or
additional gluing or taping. In horses with very long hair, especially if it is dirty, shortening the hair in
the area with clippers may be necessary.
Attaching the Pelvic Sensor to the Strip of 3M Dual Lock Tape on the Pelvis
In horses with short and clean hair, it will usually suffice to simply press the 3M Dual Lock tape on the
underside of the pelvic sensor strip of 3M Dual Lock tape on the horse. The exact center between the
Equinosis LLC
Page 12
Lameness Locator® User Manual
tuber sacrale can be found by pressing your finger down on the 3M Dual Lock tape strip (see picture
below). The deepest valley induced by this pressure is the approximate center between the tuber
sacrale. After attaching the sensor to the 3M Dual Lock tape strip on the horse, the midline position
should be checked by standing behind the horse and viewing while it is standing squarely on both hind
limbs.
Using Reinforcement Tape to Stabilize the Pelvic Sensor
In horses with long hair, horses that are dusty or dirty, horses that may sweat, horses that are wet, or
horses with hair that is slick (e.g., after being groomed with commercially-available products), it is best
to stabilize the pelvic sensor by additionally securing it with reinforcement tape. The purpose of the
tape is to stabilize the sensor and prevent it from wiggling independently of the vertical motion of the
pelvis. Wiggling will create noise in the signal which will make the data analysis more difficult. A good
rule of thumb to use to decide if additional reinforcement is required is to assess sensor attachment by
grabbing and lifting it slightly pulling gently up. If the sensor moves up by more than a few millimeters,
this indicates that the 3M Dual Lock tape strip applied to the horse is sticking only to the hair and not to
the skin of the horse. Additional taping will make data analysis more accurate and easier to accomplish,
particularly if evaluating subtle hind limb lameness. The taping should apply downward pressure on the
top of the sensor and does not need to conform to the sides of the sensor. A recommended method of
taping is presented below. In some cases, two strips criss-crossed may be sufficient. For added security,
up to six strips may be used.
Equinosis LLC
Page 13
Lameness Locator® User Manual
Utilizing the pelvic clip attachment accessory:
This new attachment accessory was devised to provide secure and firm pelvic sensor attachment
without additional taping, which will be most advantageous in horses with long hair, slick coats from
grooming sprays, and in horses that will sweat. However, this plate may be used in any horse, and users
may find that setup time will be further reduced by using this plate.
Two types of plates are included with the system. One has dual lock tape on both sides of the
plate, and one has dual lock tape on only the top portion of the plate. The conformation of the
pelvis will dictate which plate will work best for the individual horse.
For horses with well-defined gluteal musculature and a marked depression between the tuber
sacrale (such as well-fed Quarter Horses), you may elect the plate with dual lock tape on both
sides of the plate, which elevates the plate slightly. This allows some tension to be put on the
plate by the clips.
In horses with prominent tuber sacrale, and/or decreased gluteal musculature, use the plate
with dual lock tape on only one side, otherwise too much tension will be on the plate and it may
not properly grab the hair. Note - In some horses with extremely prominent sacral tuberosities
the pelvic sensor plate may not be the best alternative for attachment and taping may still be
necessary.
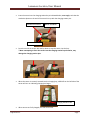
1. Attach the sensor to the plate with the sensor LEDs facing one of the clips.
2. Place the plate over the sacral tuberosities taking into consideration the correct position
and orientation of the pelvic sensor. The sensor should be on the dorsal midline with
the plastic lip projecting forward and the LEDs facing towards the left side of the horse.
3. Open one clip, press down slightly and grab a tuft of hair (pinching as many stands of
hair as possible).
4. Repeat for the opposite clip.
5. Gently pull the sensor up to verify if the plate is well attached to the horse.
Equinosis LLC
Page 14
Lameness Locator® User Manual
LAMENESS LOCATOR® SOFTWARE
Opening Lameness Locator®
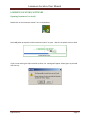
Double-click on the Lameness Locator® icon on the desktop.
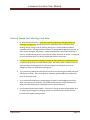
Select YES, when prompted, to allow Lameness Locator® to open. Wait for the splash screen to load.
If you are not utilizing the Equinosis back up drive, this message will appear. Select ignore to proceed
with start up.
Equinosis LLC
Page 15
Lameness Locator® User Manual
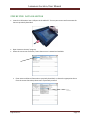
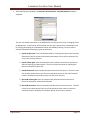
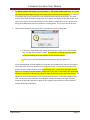
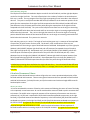
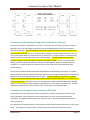
Overview of Lameness Locator® Start Screen
1
2
3
5
6
4
7
8
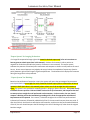
There are three drop down menus along the top of the screen: 1) Current sensor group, 2)
Current horse, and 3) Actions. There is 4) one green GO button (
), 5) one toggle button to
Connect to and Disconnect from the sensors (
), 6) a text screen for
messages, 7) three “video player-like” buttons for starting, pausing and stopping data collection,
and 8) a large area for live display of data collection from all three sensors.
Current sensor group: Selects the unique three sensor set to be used to collect
data. The user must select the correct set of sensors from the drop down menu
(sets are named via their color coded labels) before collecting data.
Current horse: After connecting to the sensors, any data collected will be placed
in the folder and associated with the horse and owner displayed in the Current
Equinosis LLC
Page 16
Lameness Locator® User Manual
horse drop down text box. To be included in the Current horse drop down list,
the owner and horse must have been previously entered by the user into the
database. (See Manage Horses and Owners) This is important! You must ensure
that the horse to be measured is displayed in the Current horse drop down text
box before collecting data. The list is arranged in alphabetical order by horse.
The name of owner is enclosed in curly brackets {} following the name of horse.
Actions: There are five selections in the Actions drop down list. 1) Manage
Horses and Owners, 2) Add New Horse, 3) Analyze Trial Data, 4) Archive Data for
Export, and 5) About Lameness Locator®.
Manage Horses and Owners: Selecting “Manage Horses and Owners”
brings the user to the Manage Owners window. This will be the most
commonly selected option from the Actions drop down list. The user will
select this option when first adding a new owner and horse to the database.
Add New Horse: Selecting “Add New Horse” brings the user to the Manage
Horses window. If another horse owned by this owner has previously been
added to the database, then the user can directly add another horse to the
database.
Analyze Trial Data: Selecting “Analyze Trial Data” brings the user to the
Manage Trials window for the horse selected in the Current horse drop
down list.
Archive Data for Export: This option brings the user to an Export Data
window. Within the Export Data window, the user can name, compress and
backup all sensor and report data in a folder of choice. Back up should be
performed regularly (i.e. weekly), and the zipped folder should be moved to
an external hard drive for storage.
About Lameness Locator®: Selecting “About Lameness Locator” displays
Lameness Locator® software version information.
Green GO button (
): Selecting this button activates the selection in the
Actions drop down box.
Connect and Disconnect toggle button: The first selection connects to sensors.
Subsequent selection disconnects from sensors.
NOTE: Once sensors are connected, Current sensor group, Current horse, and Actions
drop down lists become inactive.
Message area: Messages appear to inform users of connection status or errors in
Lameness Locator® software.
Equinosis LLC
Page 17
Lameness Locator® User Manual
Start/Pause/Stop Buttons: start, pause and stop data collection.
NOTE: Start, pause and stop data collection buttons are inactive until sensors are connected to the
receiver of the Motion Computing tablet PC.
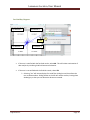
Live display area: a “strip chart-like” area indicating streaming live data
collection for all three channels. The top chart displays live vertical head
acceleration. The middle chart displays live right forelimb pastern angular
velocity. The bottom chart displays live vertical pelvic acceleration. When the
signal reaches the far right edge of the screen, it will continue at the left edge of
the screen.
Equinosis LLC
Page 18
Lameness Locator® User Manual
ADDING NEW CASES TO THE DATABASE
A case must be added to the database before any data can be collected. Adding a case to the database
populates (i.e. adds a new entry to) the Current horse drop down list. Most often, the user will need to
add both a new owner and a new horse to the database. In some cases, when owners have multiple
horses, any subsequent cases added after the first horse can be directly added to the database without
re-entering owner information. NOTE: Once a horse is added to the database, the information does
not have to be re-entered for future evaluations. The user simply selects the horse from the Current
horse drop down menu.
ADDING NEW OWNER AND HORSE INFORMATION:
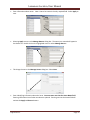
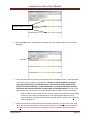
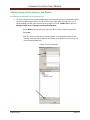
If necessary disconnect from the sensors. Select Manage Horses and Owners from the Actions
drop down list.
Select green GO button.
This opens the Manage Owners dialog box. Select New.
Equinosis LLC
Page 19
Lameness Locator® User Manual
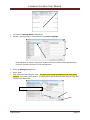
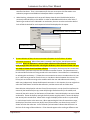
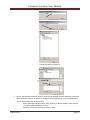
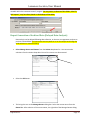
Enter information about owner. Note: Owner last name is the only required field. Select Apply to
save.
Selecting Apply returns to the Manage Owners dialog box. The owner just entered will appear in
the Owner List. Double click on the highlighted owner or select Manage Horses….
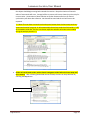
This brings the user to the Manage Horses dialog box. Select New.
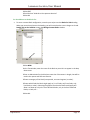
Enter identifying information about the horse. You must enter text into the Horse Name field.
Entering information into all other text boxes is optional. Entering text into the Name field will
activate the Apply and Revert buttons.
Equinosis LLC
Page 20
Lameness Locator® User Manual
Enter horse information. YOU MUST
ENTER TEXT INTO THE HORSE NAME FIELD
Select Apply to save or select Revert to erase entered data and return to a blank Manage Horses
window. After saving horse information, close the window by selecting Close twice to return to the
Lameness Locator® start screen (to get ready to collect data). The horse just entered will now
appear in the Current Horse field.
****THE MOST COMMON REASON FOR FAILING TO POPULATE THE CURRENT HORSE DROP
DOWN LIST IS FAILING TO SELECT APPLY AFTER ENTERING THE NAME OF THE HORSE.****
ADDING A NEW HORSE WHEN OWNER ALREADY IN THE DATABASE:
Select Add New Horse from the Actions drop down list.
Select green GO button.
Equinosis LLC
Page 21
Lameness Locator® User Manual
This opens the Manage Owners dialogue box.
Browse in the Owner list for a desired owner, and select to highlight.
Note that when the owner is selected, the owner information boxes become populated with
previously entered information for the selected owner.
Select the Manage Horses button.
Select “New”.
Enter information describing the horse. You must at least enter information in the Horse Name
text box. Every other field is optional. The Apply button will not become active until you enter text
into the Horse Name field.
Enter information about horse
Equinosis LLC
Page 22
Lameness Locator® User Manual
Select Apply to save this information, or select Revert to erase entered data and return to a blank
Manage Horses window. Close the window by selecting Close twice to return to the Lameness
Locator® start screen (to get ready to collect data). This horse will now appear in the Current Horse
dropdown field.
****THE MOST COMMON REASON FOR FAILING TO POPULATE THE CURRENT HORSE DROP DOWN LIST
IS FAILING TO SELECT APPLY AFTER ENTERING THE NAME OF THE HORSE****
Equinosis LLC
Page 23
Lameness Locator® User Manual
STEP BY STEP: DATA COLLECTION
Insert the USB receiver into a USB port in the tablet PC. Turn on your sensors and instrument the
horse as previously described.
Open Lameness Locator® program.
Select the correct set of sensors, if more than one set is owned and available.
Enter owner and horse information as previously described, or choose the appropriate horse
from the current horse drop down menu if previously entered.
Equinosis LLC
Page 24
Lameness Locator® User Manual
Select Connect to Sensors on the Lameness Locator® start screen.
After this button is selected and the sensors are found and connected to the LL software, the
small “unplugged” icon on the Connect to Sensors button will change to a small “plugged” icon.
If the software cannot connect to the sensors, a message will be displayed in the text box at the
top of the window indicating no connection. **** Common reasons for not being able to
connect to the sensors are 1) sensors are not turned on, 2) the USB receiver is not plugged
into the USB port, and 3) a sensor is not charged up sufficiently.
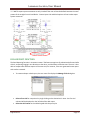
Lameness Locator® software will then query the battery status of each sensor. Check battery
charge of sensors: Once all of the batteries on each sensor are checked, the Lameness Locator®
software will display the charge state (in volts) of each sensor in a colored box above each
channel. Consult table below for significance of different voltage levels.
CHARGE LEVEL COLOR
DESCRIPTION
GREEN
SUGGESTED ACTIONS
NONE
MAXIMUM CHARGE
YELLOW
RED
Equinosis LLC
MID-LEVEL CHARGE
APPROXIMATELY 30 TO 60
MINUTES OF ACTIVE CHARGE
REMAINING
LOW CHARGE
CONTINUE COLLECTION OF
CURRENT TRIAL, BUT
RECHARGE BEFORE NEXT
DATA COLLECTION
Page 25
Lameness Locator® User Manual
Voltage levels of 3 sensors
Select the Start button. Selecting the start button will open the Enter Basic Trial Information
dialog box.
Enter trial information by selecting a trial option from the drop down menu. Entering Surface,
Limb, Block, Location and Notes are optional. Trial options include straight line, lunge left,
lunge right, before flexion, LF distal limb flexion, LF proximal limb flexion, RF distal limb
flexion, RF proximal limb flexion, LH distal limb flexion, LH proximal limb flexion, RH distal
limb flexion, RH proximal limb flexion, Straight uphill, and Straight downhill. The user is also
able to enter their own custom trial, surface and block options (refer to end of this section).
Note: In order to select a block, the user must first choose the limb that is being blocked
from the “Limb to block” drop down menu. After selecting limb blocked, a list of
relevant blocks for the fore and/or hind limb selected will then appear in the “Blocks for
limb” drop down list.
Blocks performed previously will be stored and remain checked in the “Blocks for limb” drop
down list if the next data collection occurs within two hours. All checked blocks will remain in
the “Blocks for limb” drop down list in subsequent trials on the same horse and in reports
Equinosis LLC
Page 26
Lameness Locator® User Manual
saved for that horse. Thus, it is unnecessary for the user to re-enter this information as an
evaluation progresses and additional subsequent blocks are performed.
When blocking, subsequent trials set up will always show the initial limb blocked, with its
previously selected blocks, as the default. In order to add additional blocks to other limbs, if
switching to another limb is indicated in an evaluation, the user must then select the desired
limb. All blocks checked for each respective limb will be displayed in the report.
Trial information must be entered
Click OK when ready
To start collection of data, the user must enter information in the Trial box. All other
information is optional. When information is entered in the Trial box, the OK button will be
activated. When the OK button is selected, data collection will be initiated. If you are not
ready to begin data collection after selecting the OK button, select the Pause button until you
are ready to initiate the trial and data collection. For example, the horse may be instrumented
in one location (an exam room) but then evaluated in another location. The pause button can
be selected while the horse is being moved to this new location. Data collection is reinitiated by
re-selecting the start button. ***Note that once connection to sensors is made and a trial is set
up, it is best not to get too far from the horse, or introduce a barrier between the user and the
horse (such as the horse moving to the outdoors while the user and tablet remain indoors),
which may inadvertently disrupt the Bluetooth connection. In this situation, the user might then
select the START button to initiate data collection, and the sensors will not collect data.
Data collection is displayed in real time from all three sensors in a strip chart-like interface with
sensor #1 (the head sensor) on top, sensor #2 (the right forelimb sensor) in the middle, and
sensor #3 (the pelvic sensor) on the bottom of the window. Sensor #1 displays raw vertical head
acceleration. Sensor #2 displays raw right forelimb pastern angular velocity. Sensor #3 displays
raw vertical pelvic acceleration. When within range, the display of the sensors is synchronized,
i.e. each channel tracks at the same rate. When approaching the limits of transmission range,
the display of the three sensors may briefly lose synchronization; one channel may track at a
slower rate than the other two. Loss of channel synchronization indicates that the horse is at
the limit of the range of data collection. If the channels appear to be tracking at different rates
Equinosis LLC
Page 27
Lameness Locator® User Manual
the subject should begin moving back towards the receiver. Resynchronization of channels
within a few seconds will occur. Storage buffers on sensors will ensure channel synchronicity for
correct results. Continuation of data collection at further distances after loss of channel
synchronicity will abort data collection. No data will be saved and the trial will have to be
repeated.
****Note: The user does not need to select the pause button when the horse stops and turns
around at the end of a jog strip. LL will automatically discard any strides that fall outside +/- 10%
of the median stride rate. The user can further adjust the selection of strides to be included
during the analysis process****
Collect at least 25 total strides, with at least 6 contiguous strides before the horse stops and
turns around. After collecting the desired amount of data, the user can stop collection by
selecting the Stop button.
Stop collection button
Equinosis LLC
Page 28
Lameness Locator® User Manual
After selecting the stop button, the Amend Trial Information - Save/Discard Data window is
displayed.
The user can amend information to the database for this collected trial, such as changing a field
or adding notes. At the bottom of the window, the user has 5 options from a drop down menu
for saving or discarding the collected data and for immediately analyzing. The user makes a
selection followed by selecting the green arrow button.
Save & analyze now: This is the default selection. Selecting this option saves the data,
disconnects from the sensors and initiates data analysis of the trial just collected. This
is the most common selection.
Save & collect again: Saves the data, disconnects and then reconnects to the sensors
without launching into data analysis. The user will have the option of analyzing the
data just collected at a later time.
Save & disconnect: Saves the data then disconnects from the sensors. The user is then
free to select options from any of the three drop down menus on the main Lameness
Locator® window (Current Sensor Group, Current Horse, Actions).
Discard & collect again: Does not save data then disconnects and reconnects to
sensors to prepare for another data collection.
Discard & disconnect: Does not save data then disconnects from the sensors. The user
is then free to select options from any of the three drop down menus on the main
Lameness Locator® window (Current Sensor Group, Current Horse, Actions).
Equinosis LLC
Page 29
Lameness Locator® User Manual
Adding Custom Trials, Surfaces, and Blocks:
For additions to either the Trial or the Surface list:
To enter a custom Trial or Surface configuration, move the pen stylus over the desired heading
you wish to add a custom option (Trial or Surface). When you move the stylus over one of
these headings, you will notice that the curser changes to a hand. Double click to open the
Manage Custom Trials or Manage Custom Surfaces window.
Select NEW. A text box will open. Enter the desired Trial or Surface respectively.
Select OK.
The new Trial or Surface option will now appear in the drop down menu for that
heading. Note that custom additions will appear at the bottom of the list, they will
not be listed alphabetically.
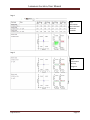
Custom Trial Entry Example
Equinosis LLC
Page 30
Lameness Locator® User Manual
Custom Surface Entry Example
You can also edit the Lameness Locator® preset lists by hiding them from appearing in the drop
down menu (for instance, to reduce the length of options appearing in your drop down menu,
you can hide presets that you do not use).
Upon opening a Manage Custom Trials, Surfaces, or Blocks window, select the plus
(+) sign to expand the Built in trial list.
Select any trial/surface/block you wish to “hide”
Equinosis LLC
Page 31
Lameness Locator® User Manual
Select EDIT
Check the box “Hide this trial to prevent selection”
Select OK
For the additions to the Blocks list:
To enter a custom Block configuration, move the pen stylus over the Blocks for limb heading.
When you move the stylus over the heading, you will notice that the curser changes to a hand.
Double click on the heading to open the Manage Custom Blocks window.
Select NEW.
In the Text window, enter the name of the block as you wish it to appear in the drop
down menu.
Enter an abbreviation for the block not more than 5 characters in length, that will be
used in the reports and PDF save function.
Choose a category of the block (intrasynovial, nerve and regional, or other).
Choose which limbs the block might apply to (i.e. all limbs, only front limbs, only
hind limbs, or other). Selecting the physical area that the block would apply will
allow it to show up only in the list of forelimb blocks, only in the list of hind limb
blocks, or both, etc….
Select OK.
Equinosis LLC
Page 32
Lameness Locator® User Manual
o
Custom blocks will appear within the category of your choosing
(intrasynovial, nerve and regional etc…) at the bottom of the respective
list.
*** Note that you may, in the future, go into the Manage Custom Trial, Surface, and/or Block windows
and edit your custom additions, by selecting the desired trial, surface, or block (single click to highlight in
blue), and select EDIT. You may alter the information for that block, or check the box “Hide this
trial/surface/block to prevent selection, so that it no longer appears in your drop down list.
*** Note that the expert system comments that are invoked when comparing pre and post blocks will
ONLY be invoked when the user utilizes the STRAIGHT LINE preset trial option. Using custom trials will
not invoke the expert system comments.
Equinosis LLC
Page 33
Lameness Locator® User Manual
Rules of Thumb For Collecting Good Data:
An ideal collected data set is a total of at least 25 strides from a well-behaved horse
trotting in a straight line. Misbehaving horses, especially if there is excessive head
shaking, rearing, trying to run off, bucking, kicking, etc., will not produce reliable or
repeatable results. Although Lameness Locator® is equipped with algorithms that will, to
some extent, disregard “bad strides”, excessive bad behavior will increase variability of
analysis. In bad-behaving horses it is prudent to collect more than 25 strides. Trotting the
horse up and down twice in a 90 foot runway will suffice in most cases.
It is best to collect at least six contiguous strides for every portion of a collected data set,
i.e. before the horse turns around and trots back. Lameness Locator® software may not
select starting and ending points of a particular segment to analyze if less than six
contiguous strides are collected in that segment.
Try to minimize gradual gait transitions from walk to trot by having the handler move off
with the horse briskly. If the horse does not lead well, gentle prodding from behind by
touch or sound may help.
Try to minimize head jerking by encouraging the handler to avoid tugging on the lead
shank to get the horse’s attention. The handler should maintain control of the horse’s
head, but avoid influencing or inhibiting the horse’s head movement.
Use the Pause button when needed. If the horse is acting up while collecting data, such
as cantering or bucking during lunging, the user can select the Pause button until the
horse resumes regular trotting activity.
Equinosis LLC
Page 34
Lameness Locator® User Manual
STEP BY STEP: GENERATING AN ANALYSIS REPORT
Overview
You can generate a Lameness Locator® Analysis report immediately after collecting data or you can
batch collect many trials and generate the reports later. A report can be generated in less than 15
seconds. The default selection is Save and Analyze Now.
To analyze data immediately after stopping data collection, the user simply selects the Green Activation
Arrow Button.
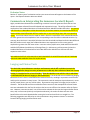
Display of head acceleration signal with segment selection will appear.
A plot of raw vertical head acceleration (green signal) of the entire collected trial versus time is
displayed.
Blue and red asterisks on the raw head acceleration signal indicate the beginning (blue
asterisks) and ending (red asterisks) time indices of the data in the trial that has been selected
for analysis.
FIRST USER INTERACTION: The user is asked: ”Is this selection correct?”
Lameness Locator® uses a series of algorithms to determine when the horse is trotting. Only
data from strides when the horse is trotting can be depended upon to give accurate
determination of lameness with Lameness Locator®. Remembering how the data in the trial
was collected, i.e. trotting back and forth twice in a straight line, trotting off once after a flexion
test, or continuously lunging, will help the user determine whether the selected data is
representative of the trial. For example, in the case below, the horse started from a standstill,
trotted off in one direction, turned around, trotted back in the other direction, and then
stopped.
Equinosis LLC
Page 35
Lameness Locator® User Manual
Vertical head acceleration
Start points for data analysis
(blue stars)
End points for data analysis
(red stars)
Horse trotting
Horse turning around
(included in analysis)
Not included in analysis
Equinosis LLC
Page 36
Lameness Locator® User Manual
The default analysis will include any stride within +/- 10% of the median stride rate. Any strides
not included between beginning blue and ending red asterisks will not be analyzed. For example,
in the above case, the first parts of the trot in both directions will not be analyzed. The horse
may not have taken off briskly enough to get into a regular trot within the first few strides. Also,
notice in this horse, the vertical acceleration of the head as it takes off on a trot is greater than
during the middle and end of the trial when it is slowing down. This is a common occurrence.
There are two options to select from the “Is the selection correct?” dialog box:
If the user is satisfied with the starting and end points, select “yes” in the Selection
box. This will initiate further analysis. In most cases, the default selections of the
starting and ending points are sufficient to give the best analysis.
If the user is not satisfied with the starting and end points, select “no”.
In this example below, the last segment of strides was not included in the selection for analysis.
This occasionally occurs if a minimum of 6 contiguous strides is not achieved in one direction
(before the horse stops and turns around). By selecting “No”, a stride filter sliding bar tool will
appear. To increase the stride selection, slide the bar to the right in increments until the desired
selection is achieved. To decrease the selection, slide the bar to the left in the same manner. The
upper limit of the stride selection is 0.5, or strides that fall within +/- 50% of the median stride
rate. If a selection is not made with the sliding bar pulled all the way to the right, then the
variability of the stride rate was too great for this segment, and inclusion of those strides for
analysis would not be desirable.
Equinosis LLC
Page 37
Lameness Locator® User Manual
These strides
not included
Stride Filter Sliding Bar
Slide bar to the right in increments
until the desired selection is made
These strides are
now included
When satisfied with the selection, select OK.
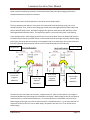
Plots of head and right forelimb signals
After selecting OK, forelimb lameness evaluation is initiated.
During the processing, the user will notice a series of plots appearing and disappearing on the
screen.
Each plot is a graphical display of right forelimb pastern angular velocity (from the right forelimb
sensor) and the computed trajectory of vertical head movement.
Equinosis LLC
Page 38
Lameness Locator® User Manual
The right forelimb pastern angular velocity signal is green. The head acceleration signal is red
with red asterisks at head maximum positions and blue asterisks at head minimum positions.
Each right forelimb angular velocity peak represents the approximate time of break over of the
right forelimb foot.
Below is an example tracing from just one stride of the signals being plotted.
Right forelimb angular velocity
(green signal)
Maximum head
positions (red
asterisks)
1 stride
Vertical head movement (red signal)
Minimum head
positions (blue
asterisks)
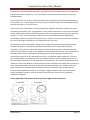
SECOND USER INTERACTION. “Do you want to remove outlier strides (horse misbehaving)?”
The forelimb lameness ray diagram will then be plotted.
A window appears asking the user “Do you want to remove outlier strides (horse
misbehaving)?”. Despite the presence of correction algorithms within the Lameness Locator®
software that help reduce the influence of head tossing, it may be beneficial to utilize this
option in horses that are misbehaving or tossing the head erratically. In current users’
experiences, this occurs primarily when the horse is lunging. Removing outliers in these cases
reduces the standard deviation of Max Diff Head and Min Diff Head in the final report. This
reduction of variability will improve the confidence of forelimb lameness results. The presence
of significant outliers can be assessed by inspection of the forelimb lameness ray plot. Rays
much longer than most in a group, or that point in a direction away from the group, are outliers.
Equinosis LLC
Page 39
Lameness Locator® User Manual
Forelimb Ray Diagram:
QUADRANT 2
QUADRANT 1
outlier
QUADRANT 3
QUADRANT 4
If the user is satisfied with the forelimb results, select NO. This will initiate continuation of
data analysis by initializing hind limb lameness evaluation.
If the user is not satisfied with the forelimb results, select YES.
Selecting “Yes” will initiate display of a stride filter sliding bar tool that allows the
user to delete outliers. Sliding the bar to the left will remove outliers, leaving them
shaded gray so that you can determine what was removed.
Equinosis LLC
Page 40
Lameness Locator® User Manual
Slide bar to the left to
remove forelimb outliers
Outlier removed
Once satisfied, select OK to complete hind limb analysis.
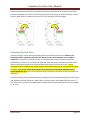
Plots of Pelvic and Right Forelimb Signals (Hind limb Lameness Evaluation)
Following the decision to remove outlier strides for the forelimb evaluation, another
series of Lameness Locator® algorithms for evaluation of hind limb lameness are
initiated.
Each plot is a graphical display of right forelimb pastern angular velocity (from the right
forelimb sensor) and the computed trajectory of vertical pelvic movement.
Equinosis LLC
Page 41
Lameness Locator® User Manual
The right forelimb pastern angular velocity signal is green. The pelvic acceleration signal
is red with red asterisks at maximum positions and blue asterisks at minimum positions.
Each right forelimb angular velocity peak represents the approximate time of break over
of the right forelimb foot.
Below is an example tracing from just one stride.
Maximum pelvic positions
(red asterisks)
1 stride
Minimum pelvic positions
(blue asterisks)
Right forelimb angular velocity
Vertical pelvic movement
(red wave)
THIRD USER INTERACTION: Displaying the Report
The remaining data analysis will then proceed to completion. The user is not asked to remove outliers in
pelvic movement because pelvic vertical movement is will not be erratic; there is little need to remove
outliers. After completion of data analysis, the user is asked to save the results. Selecting YES will save
the results and display the report. Selecting NO will discard the results (raw trial data, however, are
retained).
FOURTH USER INTERACTION: Saving Report as PDF File
After viewing the report and closing the report window, the Save Report to File window will open. The
user can save the report as a PDF in the Documents Library of the tablet PC. This will allow the user
quick access to reports of a particular horse when needed later or for easy printing or copying of reports
to another location, such as is needed with medical records in practice management software. The
report file will be generated and named. The name of the file will include the owner last name, horse
name, type of report (single, dual or tabular), the trial, block, limb, and date and time of collection. Each
report will be saved within a unique and auto-generated owner and horse subfolder in the Documents
library. Simply select OK to save the PDF file of this report to the Documents Library. To exit without
saving in this separate location, select Cancel. Note that even if Cancel is selected the report is still
Equinosis LLC
Page 42
Lameness Locator® User Manual
viewable within the Lameness Locator® program. For easy access, a shortcut of this folder, titled “LL
PDF Reports”, may have been placed on the desktop of the tablet.
Report Generation of Archived Data (Delayed Data Analysis)
Data analysis can be delayed following data collection, or the user can regenerate analyses on
previous collected data (for instance the user may want to re-run the analysis and change the
stride selection or remove outliers).
Select Manage Horses and Owners from the Actions drop down list. You cannot make
selections from the Actions drop down list until the sensors are disconnected.
Select the GO button.
This brings the user to the Manage Owners dialog box. Select the correct owner from the
Owner list. After selection of the correct owner, the right side of the Manage Owners dialog
Equinosis LLC
Page 43
Lameness Locator® User Manual
box is automatically filled in with the information previously added. To go to the specific horse
to be analyzed from that owner, either A) double-click on the owner’s name in the Owner list,
or B) select Manage Horses button (lower right corner of screen).
B) Or…Select here to go to horses of
this owner
1) Select the correct owner from
Owner list
A) double-click to go to horses of
this this owner
This brings the user to the Manage Horses dialog box. Select the correct horse from horse list.
After selection of the correct horse, the right side of the Manage Horses dialog box is
automatically filled with the information previously added. To go to the trials collected from the
horse to be analyzed, either A) double-click on the horse’s name in the Horse list, or B) select
Manage Data and Reports button (lower right corner of screen).
1) Select correct horse from
Horse list
Horse info
B) Or…Select here
to go to Data
and Reports of
this horse
A) (double-click to go to Data
and Reports of this horse)
This brings the user to the Manage Trials dialog box. Select the correct trial from Trial list. After
selection of the correct trial, the right side of the Manage Trials dialog box is automatically filled
with the information previously added about the trial at data collection. Either double-click on
the selected trial, or select Analyze Trial Data (lower right corner of screen).
Trial info
Or…Select here to go
to Analyze Trial Data
1) Select correct trial from Trial
list
A) double click to Analyze Trial
Data
Equinosis LLC
Page 44
Lameness Locator® User Manual
This will bring the user to the Manage Analysis Results dialog box. Select Generate New
Analysis on the lower left side of the screen, which will launch the analysis.
After selecting Generate New Analysis of the selected trial, data analysis is initiated.
Reviewing Previously-Generated Reports
Open Lameness Locator®.
Select Manage Owners and Horses from the Actions drop down list.
Select the GO button.
This opens the Manage Owners dialog box. Select the desired owner by double clicking on the
owner’s name OR single clicking and then selecting Manage Horses.
Equinosis LLC
Page 45
Lameness Locator® User Manual
This opens the Manage Horses dialog box. Select the desired horse by double clicking on the
horse’s name OR single clicking and then selecting Manage Data and Reports.
This opens the Manage Trials dialog box. Select the desired trial by double clicking on the trial
OR single clicking and then selecting Analyze Trial Data.
This opens the Manage Analysis Results dialog box. To view the report, select a report by
double clicking on the desired report, OR single click and select View.
Equinosis LLC
Page 46
Lameness Locator® User Manual
The Lameness Locator® Report
Owner,
horse and
trial specific
data
Hind limb
lameness
ray
diagram
Forelimb
lameness ray
diagram
Calculated
Lameness
values
Expert
System Text
and
Evaluator
Notes
Lameness
values
Equinosis LLC
Page 47
Lameness Locator® User Manual
Horse Specific Data:
The Lameness Locator® report includes data specific to the owner, horse, and trial entered by the user
before data collection. The date that the data was collected (day and time) is reported. Any notes
made by the user before or after data collection for the specific trial are reported at the bottom of the
Lameness Locator® report.
Ray Diagrams:
The ray diagrams displayed in the Lameness Locator® report give the user a quick, qualitative scan of the
lameness detected in the horse. The ray diagram on the left displays the qualitative description of
forelimb lameness and the ray diagram on the right displays the qualitative description of the hind limb
lameness.
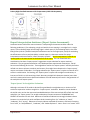
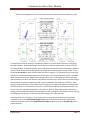
The Forelimb Ray Diagram:
The x-axis is Max Diff Head (the difference in the maximum position of the head after the stance phase
of the right front limb compared to the left front limb), with positive values to the right and negative
values to the left of the origin in the center. The y-axis is Min Diff Head (the difference in the minimum
position of the head during the stance phase of the right forelimb compared to the left forelimb), with
positive values above and negative values below the origin in the center. The axes are in mm units.
Each blue ray represents one stride. The single thicker red ray in the forelimb ray diagram indicates the
mean vector of Max Diff Head and Min Diff Head. The length of each ray is a measure of the amplitude
of asymmetry of head motion for that stride. The location of the ray within the quadrants of the ray
diagram indicate side, and timing or type of forelimb lameness. Rays in the upper half indicate right
forelimb lameness. Rays in the lower half indicate left forelimb lameness. Rays in the upper right
quadrant (labeled ↓RF IMPACT) indicate a right forelimb beginning of stance (impact) lameness. Rays
in the upper left quadrant (labeled ↓ RFPUSHOFF) indicate a right forelimb end of stance (push off)
lameness. Rays in the lower left quadrant (labeled ↓ LF IMPACT) indicate a left forelimb beginning of
stance (impact) lameness. Rays in the lower right quadrant (labeled ↓ LF PUSHOFF) indicate a left
forelimb end of stance (push off) lameness.
Rays centered on the positive and negative y-axis indicates right forelimb or left forelimb mid-stance
lameness, respectively. Rays centered on the positive and negative x-axis are difficult to interpret
conclusively. These could indicate either extreme end of stance asymmetry of one limb or early impact
lameness of the other limb. Impact lameness is more common in the forelimb than push off lameness.
Speeding the horse up may assist in analysis by adjusting the location of the rays within the forelimb ray
diagram.
A shaded circle surrounds the axis of the plot, with the radius of the circle representative of the +/- 6
mm threshold of Max Diff Head and Min Diff Head. Note that many rays will fall outside of this
threshold area, due to the typical high variability of head movement. However, the thicker red ray
indicating the mean vector will allow the user to appreciate whether the mean values of Max Diff Head
and Min Diff Head exceed threshold.
Equinosis LLC
Page 48
Lameness Locator® User Manual
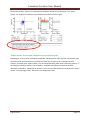
Hind Limb Ray Diagram:
The left plot of the hind limb evaluation depicts results for the left hind limb, and the right plot depicts
results for the right hind limb. The x-axis of both plots is the number of strides in the entire data set.
Each ray is a stride. The rays progress from left to right representing first to last stride in the collected
data set. The y-axis in each plot shows Max Diff Pelvis (the difference in the maximum position of the
pelvis after the stance phase of the right hind limb compared to the left hind limb) and Min Diff Pelvis
(the difference in the minimum position of the pelvis during the stance phase of the right hind limb
compared to the left hind limb). The y-axis on the left plot moves from zero at the origin to increasing
negative Max Diff Pelvis above the horizontal and from zero at the origin to increasing negative Min Diff
Pelvis below the horizontal. The y-axis on the right plot moves from zero at the origin to increasing
positive Max Diff Pelvis above the horizontal and from zero at the origin to increasing positive Min Diff
Pelvis below the horizontal. The y-axes are in mm units.
Each red plus green ray is a stride. The length of each red plus green ray is a measure of the amplitude
of asymmetry of pelvic motion for that stride. The location, color and directions of the rays are
representations of the timing or type of hind limb lameness exhibited. Red upward rays in the right plot
(labeled ↓RH PUSHOFF) indicate right hind limb push off lameness (less upward thrust of the pelvis
after right hind limb push off). Red upward rays in the left plot (labeled ↓LH PUSHOFF) indicate left
hind limb push off lameness (less upward thrust of the pelvis after left hind limb push off). Green
downward rays in the right plot (labeled ↓RH IMPACT) indicate right hind limb impact lameness (less
fall of the pelvis during right hind limb stance). Green downward rays in the left plot (labeled ↓LH
IMPACT) indicate left hind limb impact lameness (less fall of the pelvis during left hind limb stance).
A shaded area spanning above and below the origin indicates the +/- 3 mm threshold of Max Diff Pelvis
and Min Diff Pelvis. Unlike in the forelimb plot, there is no average (mean vector) indicated in the hind
limb plot.
Calculated Lameness Values:
Inspection of the calculated lameness values will give the user a more quantitative description of the
forelimb and hind limb lameness. There are two general measures that are reported for both forelimb
and hind limb lameness; 1) the A1/A2 ratios, and 2) the maximum and minimum height differences for
head and pelvic motion.
The A1/A2 values
A2 can be considered the amount of head or pelvic movement following the center of mass of the body,
or the expected, normal movement. A1 can be considered the amount of head or pelvic movement due
to lameness. The A1/A2 ratios are general measures of the asymmetry of movement over the entire
collected trial. A1/A2 ratio is reported for RF (forelimb lameness attributed to asymmetry in the right
forelimb), LF (forelimb lameness attributed to asymmetry in the left forelimb), RH (hind limb lameness
attributed to asymmetry in the right hind limb), and LH (hind limb lameness attributed to asymmetry in
the left hind limb). As a general rule of thumb, the threshold between soundness and lameness for
A1/A2 of the right and left forelimb is 0.50. A1/A2 forelimb ratios above 0.50 are suspicious of
forelimb lameness with an increasing suspicion as the A1/A2 increases. As a general rule of thumb, the
Equinosis LLC
Page 49
Lameness Locator® User Manual
threshold between soundness and lameness for A1/A2 of the right and left hind limb is A1/A2 0.17.
A1/A2 hind limb ratios above 0.17 are suspicious of hind limb lameness with an increasing suspicion as
the A1/A2 increases.
The Max Diff and Min Diff values
Max Diff Head, Min Diff Head, Max Diff Pelvis and Min Diff Pelvis are reported as a mean +/- standard
deviation over all analyzed strides. These are specific measures of head and pelvis vertical height
asymmetry between the right and left halves of the stride. They are reported in units of millimeters.
The Max value is a measure of maximum head or pelvic height difference after the stance phase of the
right compared to the left half of the stride. The Min value is a measure of minimum head or pelvic
height difference during the stance phase of the right compared to the left half of the stride.
Max Diff Head: The Max Diff Head is a measure of the difference in maximum head height that occurs
after right forelimb stance to that which occurs after left forelimb stance. A Max Diff Head greater than
+6.0 mm or less than -6.0 mm is consistent with forelimb lameness. A Max Diff Head greater than +6.0
mm may indicate either a right forelimb impact lameness or a left forelimb push off lameness. A Max
Diff Head less (more negative) than -6.0 mm may indicate either a right forelimb push off lameness or a
left forelimb impact lameness. Side and timing of forelimb lameness is dependent on the amplitude and
sign of the combined Max Diff Head and Min Diff Head values.
Min Diff Head: The Min Diff Head is a measure of the difference in minimum head height that occurs
during right forelimb stance to that which occurs during left forelimb stance. A Min Diff Head greater
than +6.0 mm or less than -6.0 mm is consistent with forelimb lameness. A Min Diff Head greater than
+6.0 mm may indicate a right forelimb impact, midstance, or push off lameness. A Min Diff Head less
(more negative) than -6.0 mm may indicate a left forelimb impact, midstance or push off lameness. Side
and timing of forelimb lameness is dependent on the amplitude and sign of the combined Max Diff Head
and Min Diff Head values.
Max Diff Pelvis: The Max Diff Pelvis is a measure of the difference in maximum pelvis height that occurs
after right hind limb stance to that which occurs after left hind limb stance. A Max Diff Pelvis greater
than +3.0 mm or less than -3.0 mm is consistent with hind limb lameness. A Max Diff Pelvis greater than
+3.0 mm is consistent with a right hind limb push off lameness. A Max Diff Pelvis less (more negative)
than -3.0 mm is consistent with a left hind limb push off lameness.
Min Diff Pelvis: The Min Diff Pelvis is a measure of the difference in minimum pelvis height that occurs
during right hind limb stance to that which occurs during left hind limb stance. A Min Diff Pelvis greater
than +3.0 mm or less than -3.0 mm is consistent with hind limb lameness. A Min Diff Pelvis greater than
+3.0 mm is consistent with a right hind limb impact lameness. A Min Diff Pelvis less (more negative)
than -3.0 mm is consistent with a left hind limb impact lameness.
Equinosis LLC
Page 50
Lameness Locator® User Manual
Evaluator Notes:
Results of “expert system” evaluations and any user-entered notes will appear at the bottom of the
report. See Report Evaluation Assistance below.
Comments on Interpreting the Lameness Locator® Report:
Highly variable data collected from misbehaving or anxious horses will generate results that are less
reliable than data collected from well-behaved and cooperative horses. This will be reflected in the
amplitudes of the standard deviations of the Head and Pelvic Max Diff and Min Diff values. As a general
rule of thumb, it is desirable to collect data such that, in the lame situation, the standard deviations of
Head and Pelvic Max Diff and Min Diff are smaller than, or not much larger than, their corresponding
means. Conclusions about lameness made on data in which the amplitudes of the standard deviations
are much greater than the amplitude of the corresponding means should be considered tentative. By
contrast, when the horse is sound (A1/A2 values less than thresholds and Head and Pelvic Max Diffs and
Min Diffs within normal range) the standard deviations are expected to be of the same general
amplitude or greater than the mean values. Lameness values (A1/A2 ratios, Head and Pelvic Max Diffs
and Min Diffs) below threshold may still be significant (i.e. indicate very mild asymmetry) when the
standard deviations of the Head and or Pelvic Max Diffs and or Min Diffs are also less than their
respective mean values.
MAX AND MIN DIFFS OF HEAD AND PELVIS ARE CONSIDERED TO BE BETTER MEASURES OF FORELIMB
AND HIND LIMB LAMENESS THAN THE A1/A2 RATIOS.
Lunging and Flexion Tests
The thresholds reported between soundness and lameness and the 95% confidence intervals for
detecting significant change in severity of lameness are valid only after collection of data from a horse
trotting in a straight line for at least 25 strides. These thresholds are not valid for trials in which data
is collected while the horse is lunging or after flexion tests. The thresholds are not valid during lunging
because the horse’s torso is tilted toward the inside of the circle, resulting in asymmetric vertical head
and/or pelvic movement in many horses. This asymmetric vertical movement is quite dramatic in some
normal (sound) horses, yet very mild in others. Asymmetries are greater for lunging circles smaller in
diameter. The thresholds are also not valid after flexion tests since the consequences of most flexion
tests are evaluated within the first 10 strides as the horse trots off from the examiner after the flexion
test. However, Lameness Locator® can still be used to evaluate the horse at the lunge and after flexion
tests, and, in some cases (similarly to subjective evaluation), the results of these tests are more
beneficial than the results obtained after trotting the horse back and forth in a straight line. The
following suggestions are offered as an aid to practitioners using Lameness Locator® to evaluate
lameness during lunging and after flexion tests.
Equinosis LLC
Page 51
Lameness Locator® User Manual
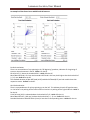
Evaluating the Lunge:
When horses are lunging, especially if lunging in a tight circle, their torso is tilted toward the center of
the circle. This creates a potential natural asymmetry in both vertical head and vertical pelvic
movement. This asymmetry can be quite dramatic in some horses, even when lameness is not present.
However, in the normal horse, the asymmetry should be an expected pattern for that lunging direction
Surface on which the horse is lunging influences the expected patterns.
It is important to use Lameness Locator® to evaluate the lunge by comparing lunging in one direction to
lunging in the other direction, side-by-side. This can be easily done by using the Dual Report function
within Lameness Locator® software (See instructions on generating a dual report below).
Some normal horses display symmetric vertical movement of head when lunging, while others show
quite dramatic asymmetric movement.
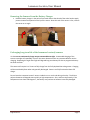
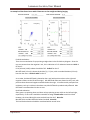
On hard surface, an inside forelimb impact asymmetry may be seen. On soft surfaces, an outside
forelimb push off asymmetry may be seen (see below).
HARD SURFACE FORELIMB EXAMPLE
SOFT SURFACE FORELIMB EXAMPLE
Equinosis LLC
Page 52
Lameness Locator® User Manual
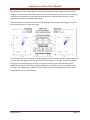
Some normal horses display symmetric vertical movement of the pelvis when lunging, while others
show quite dramatic asymmetric movement.
Two commonly seen hind limb patterns in normal horses are shown below.
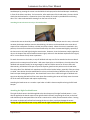
The first commonly seen pattern is less pelvic fall in the inside hind limb and less pelvic rise on the
outside hind limb. Thus, a horse, when lunging to the left may have negative Min Diff Pelvis values and
positive Max Diff Pelvis values, and when lunging to the right may have positive Min Diff Pelvis values
and negative Max Diff Pelvis values. This asymmetry pattern is most commonly seen in soft footing.
In the example below, while lunging to the left, the horse comes down less on the inside hind limb (the
left hind limb) and the horse pushes off less on the outside hind limb (the right hind limb). While lunging
to the right, this horse does the same but in the opposite limbs as it comes down less on the inside hind
limb (the right hind limb) and pushes off less on the outside hind limb (the left hind limb).
Lunge to right
Lunge to left
Come down less
hard on left
(negative
MINDIFFs)
Push off less
hard on right
(positive
MAXDIFFs)
Push off less
hard on left
(negative
MAXDIFFs)
Come down less
hard on right
(positive
MINDIFFs)
The easiest way to remember this common, “expected-normal”, pelvic motion pattern is to imagine a
pivot point between the left and right hind limb plots (see above). When lunging to the left rays point to
rotate around in a counterclockwise direction, i.e. the same direction of movement as the live horse.
When lunging to the right rays point to rotate around in a clockwise direction, i.e. the same direction of
movement as the live horse. In one in-depth study, this pattern was seen in 11.7% of normal horses
while lunging.
Equinosis LLC
Page 53
Lameness Locator® User Manual
Another commonly seen pattern is less upward and downward movement of the pelvis on the inside
hind limb (see below). This pattern is most commonly seen while lunging on harder and firmer surfaces.
In one in-depth study, this pattern was seen in 12.5% of normal horses while lunging.
Evaluating Flexion Tests
Lameness Locator® can be used to objectively quantify the effect of flexion tests. However, the
threshold and 95% confidence intervals of the lameness values reported above are not valid for
comparison. A baseline trial, without flexion, of the approximate number of strides as would be
evaluated after a flexion test, should first be collected. Most practitioners evaluate the results of the
flexion test by observing the horse trotting off away from them for less than 10 strides. So, it is
important to collect a baseline trial, without flexion, of the horse trotting off in one direction only for 812 strides. The user can select “Before flexion” from the trial list to identify it separately from a
typical straight line trial. This trial can then be used as the baseline comparison to the post flexion test
collections.
For example, below are the hind limb lameness ray diagrams of a horse before (left plot) and after (right
plot) a positive left hock flexion test. Before flexion, A1/A2 LH was 0.36 and Max Diff Pelvis was -4.9
mm. After flexion, A1/A2 LH increased to 0.67 and Max Diff Pelvis decreased (absolute value increased)
to -12.3 mm.
Equinosis LLC
Page 54
Lameness Locator® User Manual
Comments on Evaluating Change Due to Blocks or Therapy:
The variance of A1/A2 is dependent on the mean. This means that as lameness severity increases or
decreases, the amount of change in A1/A2 that can be considered significant will also increase or
decrease accordingly. The 95% confidence interval for a significant change in forelimb A1/A2 is 0.31
times the value of A1/A2. The user can assume that a change in forelimb A1/A2 value for RF or LF by
>0.31*(A1/A2) after block or treatment will occur randomly (i.e. no affect of block or treatment) only
one out of 20 times if the examination were conducted again. The 95% confidence interval for a
significant change in hind limb A1/A2 is 0.23 times the value of A1/A2. The user can assume that a
change in hind limb A1/A2 value for RH or LH by >0.23*(A1/A2) after block or treatment will occur
randomly (i.e. no affect of block or treatment) only one out of 20 times if the examination were
conducted again.
The variances of Head and Pelvic Max Diff and Min Diff are not dependent on the mean. This means
that as lameness severity increases or decreases, the amount of change in Head and Pelvic Max Diff and
Min Diff that can be considered significant is constant. The 95% confidence interval for a significant
change in Max Diff Head and Min Diff Head and Max Diff Pelvis and Min Diff Pelvis is +/- 6.0 mm and +/3.0 mm, respectively. Therefore, the user can assume that a change in Max Diff Head or Min Mid Diff
Head > 6 mm or a change in Max Diff Pelvis or Min Diff Pelvis >3 mm will occur randomly (i.e. no affect
of block or treatment) only 1 out of 20 times if the examination were conducted again.
Comments on Compensatory Lameness Patterns:
Primary lameness in the forelimb can cause compensatory (or false) vertical pelvic asymmetry and
primary lameness in the hind limb can cause compensatory (or false) vertical head movement
asymmetry. Knowledge of these patterns will assist the user in correctly identifying the location of
primary lameness.
The compensatory lameness patterns in trotting horses have sometimes been referred to as the “Law of
Sides”. According to the “Law of Sides”, a horse with primary hind limb lameness may show
Equinosis LLC
Page 55
Lameness Locator® User Manual
compensatory ipsilateral forelimb asymmetry, and primary forelimb lameness may show compensatory,
contralateral hind limb asymmetry. This “Law of Sides” has been tested and reported in many peerreviewed studies.
The first part of this law, primary hind limb lameness with compensatory (false) forelimb asymmetry is,
in many cases, true. The second part of this law, primary forelimb lameness with compensatory (false)
hind limb asymmetry, is only half correct.
The first part of the “Law of Sides” can be problematic for subjective evaluation of lameness because
mild, barely perceptible or even “imperceptible” primary hind limb lameness in some horses will induce
a false, compensatory ipsilateral forelimb asymmetry that is more apparent than the primary hind limb
lameness. In such a case, attempting to localize a primary forelimb lameness by blocking will be
unrewarding. However, because the Lameness Locator® sensors are more sensitive than the naked eye
by virtue of their higher sampling rate, this mistake will occur less often.
The second part of the “Law of Sides”, stating that an apparent forelimb and contralateral hind limb
lameness is most likely a true primary forelimb lameness with a false, compensatory hind limb
asymmetry, is only half true. Horses with primary forelimb lameness may have compensatory pelvic
movement asymmetries in either or both (ipsilateral and contralateral) hind limbs. Horses with primary
forelimb lameness have increased pelvic fall during impact on the contralateral hind limb, thus
mimicking less pelvic fall on the ipsilateral hind limb (i.e. an ipsilateral impact asymmetry). They also
have increased pelvic rise during push off of the ipsilateral hind limb, thus mimicking less pelvic rise in
the contralateral hind limb (i.e. a contralateral push off asymmetry). This complex compensatory pelvic
movement rarely causes difficulty in the subjective lameness evaluation since visible pelvic asymmetry is
rarely appreciated except in the more severe primary forelimb lameness cases. However, this small
pelvic asymmetry can be measured with Lameness Locator® and used as an aid in some cases for
correctly identifying forelimb lameness, for example, in highly excitable horses with excessive head
tossing unrelated to lameness, when the results of the head sensor motion are too variable for
unequivocal evaluation.
Primary Right Hind Limb Lameness with Compensatory Right Forelimb Asymmetry
Equinosis LLC
Page 56
Lameness Locator® User Manual
Primary Right Forelimb Lameness with Compensatory Hind Limb Asymmetry
Report Interpretation Assistance (Expert System Assessment):
Lameness Locator 2013 offers users assistance in interpreting the lameness variables under the
following conditions; 1) for evaluating a single trial with the horse trotting in a straight line in a single
report, 2) for evaluating lunge left and lunge right in a dual report, 3) for evaluating which is the most
likely primary limb in a potential multiple limb lameness case in the single report, and 4) for evaluating
the effectiveness of nerve and joint blocks in a dual report in a beta test version of a report
interpretation assistance feature, called “the expert systems”. Result interpretation is offered as a
general guide in the notes section at the bottom of the LL report. The user should take into
consideration that these “expert systems” suggestions cannot substitute for expert veterinary
evaluation. They are generated based on rules developed from experimental observations. Not all
horses move following all the rules. These algorithms used in the “expert systems” will likely be further
refined over time to enhance sensitivity and accuracy for straight line evaluations the “expert system”
require a minimum of 18 strides. For lunging evaluation the “expert system” requires a minimum of 25
strides in each direction. For blocking, the “expert system” requires two straight line evaluations, at
least one of which is a trial containing a block. Not every multiple limb lameness situation (more than
one limb is measured to have at least weak evidence of a mild lameness) will result in the generation of
the multiple limb “expert system”
“Expert System” for Straight line Evaluation:
Although a minimum of 25 strides is advised for a good baseline straight data set, a minimum of 18
strides are required to invoke a straight line “expert system” evaluation. Based on criteria related to
the A1/A2 ratios, and on the means and standard deviations of the max and min diffs of both the head
and pelvis, the “expert system” for straight evaluation will report measures of CONFIDENCE and
SEVERITY of lameness for each limb. Measures of confidence indicate how strongly the data indicate
lameness in a particular limb, with confidence levels increasing from “no” evidence, to “weak”,
“moderate”, and “strong”. Measures of severity indicate amplitude of lameness, with levels increasing
from “mild”, to “mild/moderate”, “moderate”, and “moderate/severe”. Note: there is no “severe” level
Equinosis LLC
Page 57
Lameness Locator® User Manual
of lameness severity. Each limb is evaluated for confidence and severity of lameness. The “expert
system” for straight line evaluation is presented at the bottom of the LL report.
“Expert System” for Potential Compensatory Lameness Patterns:
Depending on circumstances, confidence, amplitude, and distribution (right forelimb, left forelimb, right
hind limb or left hind limb impact or push off type lameness) of lameness in a multiple lame limb
situation, a multiple limb “expert system” may be invoked indicating which limb is most likely primary. If
the multiple limb expert system is not invoked (i.e. amplitude and pattern of lameness variables
equivocal) a code (ML1….ML18) will be reported. This is an internal indication that multiple limb “expert
system” is functioning properly. Most users can disregard this code.
Equinosis LLC
Page 58
Lameness Locator® User Manual
“Expert System” for Lunging Evaluation:
For lunge left compared to lunge right trials viewed in the dual report only (refer to instructions on
how to generate a dual report later in this manual). Evidence for lameness is either positive or
negative for forelimbs and hind limbs (severity of lameness is not assessed). This expert system
evaluates the patterns of head and pelvic movement and compares to known normal patterns of sound
horses. Known normal patterns are judged to be normal unless the amplitude of asymmetry (head or
pelvic) between right and left lunges is significantly different. The direction which displays the lameness
during the lunge best is also presented.
“Expert System” for Blocking:
Based on the satisfaction of particular criteria, the system will report the percentage of improvement
pre- to post-block on two straight line trials viewed in the dual report (refer to instructions on how to
generate a dual report later in this manual), when at least one of the straight line trials contains a
block. The system is not invoked for comparing blocks in lunging or flexion test trials. The system is only
invoked if the user specifies a limb and a block in the trial set up information, and compares that trial
to some previous straight line trial performed on the same day. For best results, the user should
compare a blocking trial to the immediately preceding trial in order for appropriate calculation of
improvement to be reported. For instance, if a baseline straight with no block was performed and
indicated a LF lameness, followed by a PDN block of the LF, the user would compare these two trials. If
after the LF block, the horse then switched to a RF lameness, and the user then performed a PDN block
of the RF, the user should compare the RF blocking trial to the LF blocking trial, rather than the original
baseline straight.
Equinosis LLC
Page 59
Lameness Locator® User Manual
**** NOTE: expert system comments are only invoked if the user utilizes the default Lameness Locator®
presets of the straight line trial and blocks. Custom input trial and block options will not invoke expert
system comments.
DUAL REPORT FUNCTION
The Dual Reporting function in Lameness Locator® facilitates comparison of evaluations before and after
a block, comparing lunging in one direction to the other, and the effects of flexion tests. The user is also
able to compare two different reports of the same trial, for instance, if the user generated a new report
with outliers removed.
To create and open a dual report, the user must first display the Manage Trials dialog box.
Select a first trial for comparison by single clicking on the desired trial. Note: the first trial
selected will be displayed on the left side of the dual report.
Select the Ctrl button on the tablet keypad with the pen stylus
Equinosis LLC
Page 60
Lameness Locator® User Manual
Select a second trial for comparison. Note: the second trial selected will be displayed in the
right side of the dual report.
Once the second trial is selected, the Analyze Trial Data button changes to Compare Analysis
Results.
Select Compare Analysis Results.
This opens the Analysis Comparison Reports dialog box.
If more than one report has previously been generated for a specific trial, the user must select
by single clicking the desired report to be included. Once selected, the trial to be included will
be highlighted in blue. As soon as two reports, one for each trial, have been successfully
selected, the View button will be activated.
Equinosis LLC
Page 61
Lameness Locator® User Manual
After successful selection of two
reports, View button becomes active
Must select one report for each Trial
(Analytical Result)
Optional: You can change the order of reports by selecting the check box (lower left of
window). This will place the first selected report on the right, and the second selected report
on the left.
Select View to generate the Dual Report.
All calculated lameness values (A1/A2, Max Diff and Min Diff) are reported for both forelimbs and hind
limbs for both trials in the middle of the report side-by-side with the first selected trial on the left and
the second selected trial on the right (unless the Change Order box was checked on previous screen).
Remember that thresholds utilized for baseline straight trials are not valid for trials in which data is
collected while the horse is lunging or after flexion tests.
Equinosis LLC
Page 62
Lameness Locator® User Manual
First selected trial report
Second selected trial report
Equinosis LLC
Page 63
Lameness Locator® User Manual
TABULAR REPORT FUNCTION
The Tabular Report function in Lameness Locator® facilitates comparison of evaluations of more than
two reports, such as before and after multiple blocks, or comparing the effects of multiple different
flexion tests.
To create and open a tabular report, the user must first go to the Manage Trials dialog box.
Select a first trial for comparison.
Select the Ctrl button on the tablet keyboard with the pen stylus
Select the subsequent trials for comparison.
Once a third trial is selected, the Analyze Trial Data button changes to Tabulate Analysis Results.
Select as many trials as you would like to view on one report.
Select Tabulate Analysis Results.
This opens the Analysis Tabulation Report dialog box.
Select View to generate the Lameness Locator® Tabular Report of Multiple Trials. Note that in the
tabular reports, the first analysis of any trial is used for comparison.
The report will include multiple pages. Use the forward arrow button at the top of the screen to
page forward through the report.
Equinosis LLC
Page 64
Lameness Locator® User Manual
Page 1
Trial
information
and calculated
lameness
variables
Page 2
Trial
Information
and ray
diagrams
Equinosis LLC
Page 65
Lameness Locator® User Manual
DATA BACKUP
With frequent and regular backup all previously collected data can be reinstalled on your LL system in
the unlikely event of a hard drive crash or other system configuration malfunction.
Lameness Locator® now employs a semi-automatic back up USB drive that can remain inserted in the
tablet computer at all times. A scheduled back up of the Lameness Locator program will occur
automatically every Monday at 1AM, as long as the tablet is left plugged in and turned on. Should you
miss a scheduled back up, you will be prompted to back up your data upon your next start up of
Lameness Locator®. You can run a back up in the background, and will not be prohibited from utilizing
the program.
Additionally, you can always run a manual back up, if you choose to back up your data more frequently
than weekly.
TO RUN A MANUAL BACK UP OF LAMENESS LOCATOR® RAW DATA FILES USING THE
EQUINOSIS USB BACK UP DRIVE:
Be sure the Equinosis USB backup drive is inserted into one of the USB ports of the tablet.
Open Lameness Locator.
Select Archive Data For Export from the Actions Drop Down Menu.
Export data window will open.
Check the “archive data to external Equinosis drive”.
Select “Export Data”. Data will be compressed into a zipped file.
When the backup is completed an “Export Succeeded” message will appear in the window next
to the “Export Data” button. Select Close.
TO RUN A MANUAL BACK UP OF LAMENESS LOCATOR® RAW DATA FILES USING A NONEQUINOSIS USB BACK UP DRIVE:
Insert USB memory stick/drive into one of the USB ports of the tablet.
Open Lameness Locator.
Select Archive Data For Export from the Actions Drop Down Menu.
Export data window will open.
Leave the “archive data to external Equinosis drive” UNCHECKED.
Check “allow renaming or moving the copy of the exported data file”.
Select “Export Data”. Data will be compressed into a zipped file.
Upon completion, a “Copy Exported Data File As…” window will open. For your convenience
you can rename the auto-generated file to something you will easily recognize, such as
“LLbackup01.12.12.7z”. You must include the “.7z” file extension.
Select where you would like to put the folder from the column on the left. Scroll down to locate
the USB drive (D:) and select, then SAVE.
When the backup is completed an “Export Succeeded” message will appear in the window next
to the “Export Data” button. Select Close.
Equinosis LLC
Page 66
Lameness Locator® User Manual
User Manual Appendix
Examples of Report
Interpretations
Equinosis LLC
Page 67
Lameness Locator® User Manual
EXAMPLES OF VARIOUS LAMENESS AND TIPS TO KEEP IN MIND WHEN INTERPRETING THE REPORT
When reviewing LL Report data, it is helpful to consider a “four strike” approach.
1) Consider using a “four strike rule”.
a. For the forelimb:
i. Inspect the ray diagram. Is there an accumulation of rays in any particular
direction or quadrant, such as LF impact or RF push off? If yes, that’s strike one.
ii. Check the A1/A2 ratios for the LF and the RF. Is either greater than 0.5? If yes,
that’s strike two.
iii. Check the Max Diff Head and Min Diff Head mean values (the mean value is first
to the left of the slash (/). Is the absolute value of either or both greater than
|+/- 6| mm? If yes, that’s strike three.
iv. If either or both Max or Min mean values are elevated, is the standard
deviation, which is the second number to the right of the slash (/), less than the
mean value? The standard deviation provides a measure of data variability.
Standard deviations greater than their respective means indicate that the data
is not very consistent. If the standard deviation is less than the respective
mean, this indicates that the data is consistent and reliable. If the standard
deviation is less than the respective mean, that’s strike four.
b. For the hind limb:
i. Inspect the ray diagram. Is there an accumulation of rays (green down or red
up) in any particular direction or quadrant? If yes, that’s strike one.
1. Left hind push off asymmetry/lameness = red rays up on left
2. Left hind impact asymmetry/lameness= green rays down on left
3. Right hind push off asymmetry/lameness= red rays up on right
4. Right hind impact asymmetry/lameness = green rays down on right
ii. Check the A1/A2 ratios for the LH and the RH. Is either greater than 0.17? If yes,
that’s strike two.
iii. Check the Max Diff Pelvis and Min Diff Pelvis mean values. Is the absolute value
of either or both greater than |+/-3| mm? If yes, that’s strike three.
iv. If either or both Max or Min mean values are elevated, is the standard deviation
less than its respective mean value? If the standard deviation is less than the
respective mean, this indicates that the data is consistent and reliable. If the
standard deviation is less than the respective mean, that’s strike four.
Four strikes is a strong indicator of consistent asymmetry for a particular limb, which in turn is
consistent with either primary or compensatory lameness for that limb. Two to three strikes
may still be evidence of asymmetry and lameness, but the evidence is weaker. Less than 4
strikes may, on one hand, indicate more subtle or milder asymmetry but true lameness, or, on
the other hand, increased variability of data, making the determination of lameness less reliable.
Inspecting the standard deviations assists the user in these situations (less than 4 strikes). For
Equinosis LLC
Page 68
Lameness Locator® User Manual
example, one might observe rays concentrated in the “LF beginning of stance” quadrant, an
elevated LF A1/A2 ratio of 0.8, but the Max Diff Head and Min Diff Head are both below the
threshold of |+/- 6| mm, for example 4.0 and 5.8 mm, respectively. In a situation where the
horse was presented for evaluation of lameness or decreased performance, as opposed to, for
example a pre-purchase evaluation, this data may still be useful for deciding which limb to
further investigate. If the standard deviations are less than the mean values, despite the mean
values being below the threshold, i.e. a three strike situation, this may be indicative of a subtle
yet consistent asymmetry or lameness. Alternatively, in the situation of a mean Max Diff Head
and or mean Min Diff Head above threshold, but with high standard deviations (higher than the
mean values), the data may be too variable to make a strong case for lameness. Perhaps the
horse was acting up, tossing its head, etc. Measures to decrease variability, like collecting
additional trials or mildly sedating the horse (0.1 cc Dormosedan) before collecting more data,
may be beneficial to generate more consistent results.
It is important to reiterate that users should not look only at the left and right A1/A2 ratios for
determination of lameness. A1/A2 ratios are gross measures of the entire collected trial. The
user should inspect both Max Diff and Min Diff mean values as part of a complete evaluation.
Mean Max Diff and Min Diff values are more sensitive indicators of lameness, which indicate
timing of peak pain within the stride, and along with their respective standard deviations,
indicate the variability of the dataset - something that A1/A2 values do not provide.
Equinosis LLC
Page 69
Lameness Locator® User Manual
An example of data from a horse with symmetric movement in both front and hind limbs.
Forelimb evaluation:
There is a characteristic “starburst” pattern in the forelimb ray diagram of a normal (sound)
horse, without an accumulation of rays in any particular direction or quadrant.
A1/A2 ratios are less than 0.5 for both LF and RF.
Max Diff Head (0.3) is below threshold of |+/-6| mm.
Min Diff Head (0.8) is below threshold of |+/-6| mm.
Standard deviation of Max Diff Head is 6.9 mm, substantially greater than its mean (0.3 mm).
Standard deviation of Min Diff Head is 6.2 mm, substantially greater than its mean (0.8 mm).
So, there are 0 strikes for the forelimb evaluation.
Hind limb evaluation:
There are short green rays down on the left indicating slight decreased impact in the left hind
limb and short red rays up on the right indicating slight decreased push off in the right hind limb.
In this case is would be reasonable to assign 1 weak strike to each hind limb.
However, the LH and RH A1/A2 ratios are both less than 0.17. No strike.
Max Diff Pelvis (2.5 mm) is below threshold of |+/- 3 mm|. No strike.
Min Diff Pelvis (-0.75 mm) is below threshold of |+/- 3 mm|. No strike.
This evaluation should be considered within normal limits.
Equinosis LLC
Page 70
Lameness Locator® User Manual
An example of data from a horse with LF lameness on the straight and during lunging.
Forelimb evaluation:
There is an accumulation of rays pointing straight down in the forelimb ray diagram. Since the
rays are centered near the negative Y axis, this is indicative of a LF midstance lameness. Strike 1
for the LF.
LF A1/A2 ratio (1.48) is above threshold of 0.5. Strike 2 for the LF.
Min Diff Head (-13 mm) is above threshold of |+/- 6| mm, with a standard deviation (9.2 mm)
less than the mean. Strikes 3 and 4 for the LF.
As a review, the Max Diff Head is plotted on the x-axis (with positive values to the right and
negative numbers to the left of the origin). Min Diff Head values are plotted on the y-axis, with
positive values above and negative numbers below the origin. In lameness with peak pain near
midstance, such as is evident in the above case, Min Diff Head is predominantly affected. Max
Diff Head is not affected and is close to zero.
Hind limb evaluation:
Short green rays pointing down and short red rays pointing up are visible on the left and right,
respectively. In this case is would be reasonable to assign 1 weak strike to each hind limb.
However, the LH and RH A1/A2 ratios are both less than 0.17. No strike.
Max Diff Pelvis and Min Diff Pelvis below threshold. No strike.
This hind limb evaluation should be considered within normal limits.
Equinosis LLC
Page 71
Lameness Locator® User Manual
Below is the lunging data for this horse, with circle left on the left and circle right on the right.
It is important to evaluate lunging in one direction always as a simultaneous comparison to lunging in
the other direction. Evaluating lunging in one direction in a separate single report is not useful and is
not recommended. Thresholds between normal and abnormal (sound and lame) reported by Lameness
Locator were determined by trotting horses in straight lines and analyzing at least 25 strides. These
thresholds do not hold for data collected while the horse is lunging. This is because many horses lunge
with the torso tilted substantially towards the center of the circle, which frequently results in head and
pelvic movement asymmetry between left and right halves of the stride. However many horses lunge
with equivalent torso tilt in one direction compared to the other and, in horses that are trained to lunge,
head and pelvis movement asymmetry will be “equal in amplitude” but “opposite in direction” while
lunging in opposite directions. Also, research with lunging horses using this equipment has determined
that certain patterns of movement are common in normal horses and that the acceptable patterns for
normal horses are somewhat dependent on “hardness” of ground. Data collected while the horse is
lunging is best evaluated by simultaneous comparison of the ray diagrams and lameness values resulting
from lunging in one direction to that resulting from lunging in the other direction.
On hard ground, such as asphalt, it is not uncommon for normal horses to exhibit head movement
asymmetry that mimics inside forelimb impact (beginning of stance) lameness and to exhibit pelvic
movement asymmetry that mimics inside hind limb impact (beginning of stance) and push off (end of
stance) lameness.
Equinosis LLC
Page 72
Lameness Locator® User Manual
On soft ground, such as sand, it is not uncommon for normal horses to exhibit head movement
asymmetry that mimics outside forelimb push off lameness and to exhibit pelvic movement asymmetry
that mimics inside hind limb impact and outside hind limb push off lameness.
Lunging data in the above case indicates LF lameness while lunging in either direction, with exacerbation
of LF lameness while lunging to the left. Hind limb results display a common patterns that are “equal
and opposite” when comparing lunging in one direction to lunging in the other direction. Note that
while lunging to the left, left hind (inside hind limb) impact and right hind (outside hind limb) push off
asymmetries are displayed. Similarly for lunging to the right, right hind (inside hind limb) impact and left
hind (outside hind limb) push off asymmetries are displayed. This is a common pattern in normal
horses while lunging. The ray diagrams from lunging in opposite directions are “mirror images” of each
other. In this particular case, the amplitudes of push off asymmetries between the two lunging
directions are not equal; however, the significant LF lameness may be contributing to compensatory
movements in the pelvis. The most significant lameness in this case is the LF.
Equinosis LLC
Page 73
Lameness Locator® User Manual
An example of data from a horse with RF and LH lameness.
Forelimb evaluation:
There is an accumulation of rays pointing in the “RF Beginning” quadrant, indicative of a beginning of
stance or impact lameness in the RF. Strike 1 for the RF.
RF A1/A2 is 1.27, above the threshold of 0.5. Strike 2 for the RF.
Mean Max Diff Head is 23.3 mm and mean Min Diff Head is 24.6 mm, both higher than the threshold of
|+/- 6| mm. Strike 3 for the RF.
The standard deviation of Max Diff Head (10.97) and Min Diff Head (8.57) are both smaller than their
respective means. Strike 4 for the RF.
Hind limb evaluation:
There is a preponderance of red rays pointing up on the left. This indicates LH push off type lameness,
i.e. the horse is not pushing off the left hind limb as hard as it is pushing off the right hind limb. Strike 1
for the LH.
LH A1/A2 ratio (0.31) is elevated above the threshold of 0.17. Strike 2 for the LH.
Mean Max Diff Pelvis (-8.0 mm) is above the threshold of |+/- 3| mm. Strike 3 for the LH.
Standard deviation of Max Diff Pelvis (4 mm) is less than its corresponding mean. Strike 4 for the LH.
Equinosis LLC
Page 74
Lameness Locator® User Manual
This evaluation has four strikes against a RF (impact type) and four strikes against LH (push off type)
lameness. The horse either has 2 limbs that are lame, the RF and the LH, or the horse has a primary RF
lameness with compensatory contralateral push off lameness in the opposite hind limb. Further
evaluation of the horse is needed to differentiate.
Forelimb lameness evaluation while the horse was lunging is shown below, with lunging to the left on
the left and lunging to the right on the right.
The first thing one notices is that the forelimb ray diagram on the left does not have a preponderance of
rays pointing in the opposite direction as the forelimb ray diagram on the right. Comparing between
lunging to the left and lunging to the right, the length of the rays may be approximately equal in
amplitude but they are not pointing in opposite directions. Instead there is an accumulation of rays
pointing in the “RF Beginning” quadrant for both lunging to the left and lunging to the right. This is a
strong indication of a true RF lameness.
Equinosis LLC
Page 75
Lameness Locator® User Manual
The horse was re-evaluated at a straight line trot after a RF PDN block, resulting in the analysis below.
Notice the rays in forelimb ray diagram are shorter. In addition, more rays are pointing in the “RF End”
quadrant than before block. There is still lameness in the RF but of less severity.
The RF A1/A2 ratio has decreased from 1.2 before block to 0.55 after block - a decrease, or
improvement, of greater than 50%.
Mean Max Diff Head decreased from 23.3 mm before block to 5.0 mm after block - a decrease, or
improvement, of 18 mm - greater than 75%. Mean Min Diff Head decreased from 24.6 mm before block
to 8.3 mm after block - a decrease, or improvement, of 16 mm - greater than 66%. This is an indication
of significant improvement after PDN block and strong evidence for the location of lameness.
The LH is relatively unchanged indicating that the LH lameness is a real and potential completely
separate issue, and not due to compensatory movement due to the primary forelimb lameness.
Equinosis LLC
Page 76
Lameness Locator® User Manual
The horse was re-evaluated after a RF abaxial sesamoid nerve block, with the following analysis results.
The horse now exhibits the classic “starburst” pattern in the forelimb ray diagram that is common in
horses that are not lame. In addition the RF and LF A1/A2 ratio are both below the threshold of 0.5 and
the Max Diff Head and Min Diff Head are both below the threshold of |+/- 6| mm. Because the mean
Max Diff Head and Min Diff Head are now small, the standard deviations of Max Diff Head (7.0) and Min
Diff Head (6.2) are greater than their corresponding means. Low Max Diff Head and Min Diff Head mean
values with relatively higher standard deviations is typical for horses with generally symmetrical
movement, i.e. are not lame.
After the resolution of the right front lameness, the left hind limb lameness is still measurable. This is a
secondary lameness and is not compensatory for the forelimb lameness.
Equinosis LLC
Page 77
Lameness Locator® User Manual
An example of data from a horse with RH lameness on the straight and during the lunge.
It should first be mentioned that, in this trial, only 19 strides were evaluated. In order to acquire more
reliable results, trials should be collected such that at least 25 strides are analyzed. Depending on the
activity, not every stride collected will be analyzed. Thus, it is best to collect 25 to 35 strides per trial.
Forelimb evaluation:
There is an accumulation of rays in the "LF End" quadrant. This is indicative of LF end-of-stance or push
off type lameness. End-of-stance forelimb lameness is uncommon. Strike 1 for LF.
LF A1/A2 (0.6) is slightly elevated above the threshold of 0.5. Strike 2 for the LF.
Mean Max Diff Head (9.9 mm) is slightly elevated above the threshold of +/- 6 mm, Strike 3 for the LF,
and the standard deviation (8.2 mm) is slightly less than the mean, Strike 4 for the LF.
Although they are weak strikes, just outside normal range, this horse has 4 strikes against the LF.
Hind limb evaluation:
There is a preponderance of red rays pointing up on the right, indicating RH push off type lameness.
Strike 1 for the RH.
RH A1/A2 ratio (0.35) is double normal threshold of 0.17. Strike 2 for the RH.
Mean Max Diff Pelvis (10.8 mm) is elevated above the threshold of +/- 3 mm, Strike 3 for the RH, and
the standard deviation (2.5 mm) is less than the corresponding mean, Strike 4 for the RH.
This horse has 4 strikes against the LF and RH; however, the strikes are stronger (relatively higher above
normal threshold) against the RH than LF. The RH lameness is more convincing than the LF and
therefore the most likely to be predominant.
Equinosis LLC
Page 78
Lameness Locator® User Manual
Note: For hind limb evaluations, Max Diff Pelvis values reflect the end-of-stance or push off
phase of stride and the Min Diff Pelvis values reflect the beginning-of-stance or impact phase of
the stride. By convention LH lameness results in negative (< 0) Max Diff and Min Diff values and
RH lameness results in positive (>0) Max Diff and Min Diff values. For example, a RH push off
type lameness would have Pelvic Max Diff values that are above threshold |+/- 3 mm| and
positive (> 0).
The lunging data for this horse is shown below with lunging to the left on the left and lunging to the
right on the right.
Remember, users should not simply compare calculated lameness values (A1/A2 ratio, Head and Pelvis
Max and Min Diffs) to the normal threshold values listed on the report. Users should instead compare
calculated lameness values between lunging to the left and lunging to the right.
Forelimb evaluation:
There is no accumulation of rays in any direction or quadrant when the horse is lunging to the left. Most
rays are pointing down toward the LF when the horse is lunging to the right, so there is slight evidence
Equinosis LLC
Page 79
Lameness Locator® User Manual
of LF lameness when the horse is lunging to the right. However, there are no consistent elevations of
mean Max Diff Head or Min Diff Head in one direction compared to the other and the standard
deviations of Max Diff Head and Min Diff Head are greater than their respective means. There is no
strong evidence that this horse has forelimb lameness during the lunge.
Hind limb evaluation:
The pattern seen while the horse is lunging to the left, red rays up on the right hind (positive mean Max
Diff Pelvis) and green rays down on the left hind (negative mean Min Diff Pelvis) are often seen in sound
horses, i.e. this is an expected pattern in normal horses. An “equal-in-amplitude”, but “opposite-indirection”, expected pattern for this horse while lunging to the right would be red rays up on the left
hind (negative mean Max Diff Pelvis) and green rays down on the right hind (positive mean Min Diff
Pelvis). However, when lunging to the right both Max Diff Pelvis and Min Diff Pelvis are positive. The
positive Max Diff when lunging to the right is unexpected. The horse is displaying RH push off lameness
when lunging to the right. This is consistent to that seen while the horse was trotting in a straight line.
Equinosis LLC
Page 80
Lameness Locator® User Manual
An example of a horse with notable pelvic asymmetry.
Horses with asymmetric vertical tuber sacrale heights may register asymmetries in vertical pelvic
movement. This may be artifactual due to the physical asymmetry of the horse, or it may be due to
lameness. Asymmetric vertical tuber sacrale height is an important physical exam finding that should be
noticed and noted when instrumenting the horse. It should be taken into account when evaluating the
results. The side with the higher tuber sacrale may register as an impact asymmetry and the side with
the lower tuber sacrale may indicate push off asymmetry. As an example, in the case below, this horse
exhibits asymmetric pelvis, with the left tuber sacrale higher than the right. No other abnormal findings
were noted when evaluating the horse in motion.
Equinosis LLC
Page 81