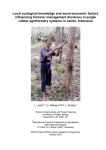
1
Local knowledge and livelihoods:
tools for soils research and dissemination in
Ghana
“Bridging Knowledge Gaps between
Soils Research and Dissemination in Ghana”
(DFID PROJECT R7516)
Catharine Moss, Will Frost, Beatrice Obiri-Darko, John Ayisi Jatango, Helga Dixon
and Fergus L. Sinclair
School of Agricultural and Forest Sciences
University of Wales, Bangor
Gwynedd, LL57 2UW, UK
October, 2001
LOCAL KNOWLEDGE AND LIVELIHOODS:
TOOLS FOR SOILS RESEARCH AND DISSEMINATION IN
GHANA
There are three tools contained in this pack. They are:
1. The Agroecological Knowledge Toolkit
2. Livelihood and land use diagrams
3. Technology Choice Tool
Livelihood and land use diagrams and the Technology Choice Tool are paper based tools, whereas the
Agroecological Knowledge Toolkit requires the use of a computer.
F ARMERS’ KNOWLEDGE OF NATURAL RESOURCE MANAGEMENT : USING THE AGROECOLOGICAL
KNOWLEDGE T OOLKIT (AKT):
This tool is for exploring knowledge of soil fertility management held by farmers, researchers and extensionists in
the forest and forest-savanna transition zones of Ghana. Farmers’ local knowledge from five different areas of the
Brong Ahafo, Ashanti and Western regions has been recorded, in addition to the knowledge of researchers and
extensionists working with cover crops in the Brong Ahafo region. The tool includes the Agroecological
Knowledge Toolkit software, six knowledge bases and the instructions for using them.
To use this tool you will need the instructions that follow and you will have to install the software and knowledge
bases from the CD Rom that is included in this pack.
LIVELIHOOD AND LAND USE DIAGRAMS
This is a tool for synthesising information about rural livelihoods. It is intended to be used as part of a Participatory
Rural Appraisal exercise to help researchers maximise use of existing information, to bring greater definition to
PRA exercises and to guide researchers in thinking about different social groups. The tool focuses on land use as
this is considered to be highly significant to the majority of rural livelihoods, although users may adapt the tool as
appropriate to include other aspects of livelihoods.
This is a paper based tool. To use this tool you will need the instructions that follow using some qualitative and/or
quantitative data about land use, cropping activities and other sources of income gathered from a PRA exercise or
another data source.
TECHNOLOGY CHOICE TOOL
This tool brings together information about livelihoods and technologies to facilitate the choice of appropriate
technologies based on farmers’ circumstances. It can be used to determine which groups of farmers a particular
technology is suitable for and hence to prioritise research work in consideration of its potential impact, or to
produce a technology specification for a target group.
This is a paper based tool. To use this tool you will need the instructions that follow and some qualitative and/or
quantitative data about livelihoods and corresponding information about the requirements of a particular soil
fertility technology.
"This publication is an output from a research project funded by the UK Department for International Development
(DFID) for the benefit of developing countries. The views expressed are not necessarily those of DFID. [R7516
Natural Resources Systems Programme]."
FARMERS’ KNOWLEDGE OF NATURAL RESOURCE MANAGEMENT:
USING THE AGROECOLOGICAL KNOWLEDGE TOOLKIT (AKT)
USING
FARMERS’ KNOWLEDGE
Nowadays, nearly everybody agrees that local knowledge and practices should be recognized in development initiatives aimed
at technology development by and for rural farming communities. Interest amongst research, education and development
institutions to investigate and document local knowledge has grown significantly over the last few years.
The University of Wales, Bangor is a leading institution in the development of a knowledge- based systems (KBS)
methodology to acquire and use local knowledge in research and development. The university spearheaded the development of
this novel approach to acquire, store and use local ecological knowledge about agroecosystems in collaboration with various
national and international research institutions in Asia, Africa and Latin America. It promotes systematic collection and
collation of ecological knowledge from farmers and development professio nals. The Agroecological Knowledge Toolkit
(AKT5) is a tailor- made computer software that enables representation of statements of knowledge in a computer readable
form which allows exploration of local ecological knowledge using computer based search and reasoning facilities.
Work so far has revealed that farmers in general have sophisticated knowledge of ecological processes occurring in the
farming system and that local knowledge is largely complementary to scientific knowledge, but is not taken into account when
planning research. While knowledge differs to some extent between communities, a common framework and terminology
occur across large distances.
THE AGROECOLOGICAL KNOWLEDGE TOOLKIT (AKT5)
What is the purpose of this AKT guide?
The instructions that follow will guide you through six existing knowledge bases created in the south of Ghana. By following
these instructions you will be introduced gradually to the AKT software, at the same time as learning about farmers' knowledge
of soil fertility management in Ghana.
This publication is not intended to guide users through the creation of their own knowledge bases. The methodology for
creating knowledge bases from knowledge elicited from stratified sectors of the population using iterative semi- struc tured
interviews can be found in the user manual - Dixon et al. (2001). The principles of knowledge base creation have also been
explained Sinclair and Walker (1998) and Walker and Sinclair (1998)1 or you may visit the AKT website at:
http://www.bangor.ac.uk/afforum
What is AKT?
AKT is a methodology and software that enables the user to create a knowledge base about a chosen topic e.g. soil fertility
management or vegetable pests, by collating knowledge from a variety of sources (generally farmers, scientists, extension
workers and scientific literature). So far, AKT has been used primarily as an analytical research tool. However knowledge
stored in this way can also be consulted by natural resource scientists and development workers. This publication takes a novel
approach by guiding first time users of AKT through some existing knowledge bases created in Ghana.
What is knowledge?
To define knowledge is to enter a philosophical minefield, nevertheless an explicit definition is required in this context. For the
purposes of AKT, knowledge is the outcome of the interpretation of data, independent of the interpreter. (Data is a recorded set
of observations, either qualitative or quantitative). Thus knowledge is distinct from understanding, which is a result of the
interpretation of knowledge or data and is specific to the interpreter.
What is a knowledge base (KB)?
A knowledge base is a store of knowledge. It consists, fundamentally, of a collection of statements. Each statement is tagged
(referenced) with the source of the knowledge (which is generally either a person or a document).
Knowledge that is stored in this way is organised according to a number of principles:
• Topics arrange knowledge around specific subject areas e.g. ‘weed management’, ‘soil fertility indicators’. Topic
hierarchies gather similar topics under broader areas e.g. ‘weed management’ and ‘grass weeds’ both fall under the
more general topic of ‘weeds’.
• Object hierarchies organise knowledge about specific objects (material or conceptual things) under more generic
terms e.g. Triplochiton scleroxylon, Milicia excelsa and Ceiba pentandra are all types of tree and would therefore fall
under the more general object ‘trees’.
1
Dixon H., Doores F., Joshi L., and Sinclair F., 2001 Agroforestry Knowledge Toolkit for Windows: methodological guidelines, computer software and manual for WinAKT.
School of Agricultural and Forest Sciences, University of Wales, Bangor.
Sinclair F., and Walker D., 1998 Acquiring Qualitative Knowledge about Complex Agroecosystems. Part 1: Representation as Natural Language . Agricultural Systems56, 3,
pp.341- 363
Walker D., and Sinclair F., 1998 Acquiring Qualitative Knowledge about Complex Agroecosystems. Part 2: Formal Representation. Agricultural Systems 56, 3, pp.365-386
THE GHANA KNOWLEDGE BASES
Six knowledge bases have so far been created in Ghana as part of the two DFID funded research projects – ‘Bridging
knowledge gaps between soils research and dissemination’ and ‘Shortened bush fallow rotations for sustainable livelihoods in
Ghana’. A team of researchers from the Forestry Research Institute of Ghana, the Ministry of Food and Agriculture and the
University of Wales, Bangor undertook the work during 2000 – 2001 in the forest and transition zones.
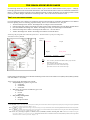
THE L OCAL
KNOWLEDGE BASES
Five knowledge bases were created to record farmers existing local knowledge of soil fertility management in five different
locations spanning areas of contrasting population density, forest cover and market access. They are:
1. Atwima knowledge base: farmers’ knowledge from two villages in the Atwima district
2. Oda knowledge base: farmers’ knowledge from four locations in the Asankrangwa area in the Wassa Amenfi district
3. Peri-urban Kumasi knowledge base: farmers’ knowledge from four peri-urban villages around Kumasi
4. Subriso knowledge base: farmers’ knowledge from Subriso No. 3 in Tano district
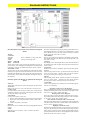
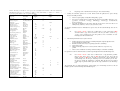
5. Yabraso knowledge base: farmers’ knowledge from Yabraso in Wenchi district
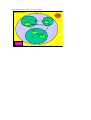
Location of the five field sites within the forest and
transition zones of Ghana
Characteristics of the five study sites
Population
density
Atwima
-
Peri-urban
+
Tano
+
Wenchi
+
(Savannah)
Key
Black
Red
+
-
Wassa Amenfi
(Transition)
(Forest)
Tree Cover
sites covered by the Shortened Bush Fallow project and the
Knowledge Gap project
sites covered by the Knowledge Gap project
good market access for the sale of food crops
poor market access for the sale of food crops
Further background information on livelihoods and farming at these sites can be found in Frost (2000); Moss (2000a); (2000b)
and Obiri-Darko et al. (2000)2 .
Topics covered by the knowledge bases include:
1. Soil fertility: the properties of good soil
a. soil fertility
b. soil moisture
c. soil texture
2. Soil types: the properties of different types of soil
a. black soil
b. red soil
c. sandy soil
3. Soil fertility management
a. fallowing
b. inorganic fertiliser
2
Frost, W. 2000 . Farmers’ knowledge of soil f ertility and weed management in Atwima district, Ghana: The implications for participatory technology development. Unpublished
MSc. Thesis. University of Wales, Bangor. 91 pp.
Moss, C., 2000a. Livelihoods and local knowledge of soil fertility management in peri-urban Kumasi, Ghana. School of Agricultural and Forest Sciences University of Wales,
Bangor, UK. 24pp.
Moss, C., 2000b. Livelihoods and local knowledge of soil fertility management at Oda -Kotoamso, Wassa-Amenfi District, Western Region, Ghana. School of Agricultural and
Forest Sciences University of Wales, Bangor, UK. 38pp.
Obiri - Darko, B., Ayisi-Jatango, J., Anglaaere, L., Cobbina, J., Moss, C., McDonald, M., Sinclair, F., and Young, Einir., 2000. Livelihood systems and farmers ecological
knowledge in Ghana: a report on three districts. Shortened Bush-fallow Rotations for Sustainable Livelihoods in Ghana (DFID Project R7446). School of Agricultural
and Forest Sciences University of Wales, Bangor, U.K.
c. poultry manure
d. preparation of land after the fallow
4. Trees: their role in soil fertility management
a. trees and soil fertility
b. trees and soil moisture
5. Weeds (see particularly the atwima.kb):
a. weed management
b. weeds as indicators of soil fertility
Different knowledge bases focus on different aspects of farmers’ knowledge depending on the farming activities at each
location and the knowledge of the informants. For example, the peri-urban Kumasi knowledge base is the only one to hold
knowledge on the use of poultry manure, and no local knowledge base contains information on leguminous cover crops as
informants had no knowledge of this technology.
THE
COVER CROP KNOWLEDGE BASE
The cover crops knowledge base was created through compilation of information on cover crops from literature available in
Ghana and from interviews with cover crop researchers and extensionists in Ghana. The majority of information available
concerned mucuna as it has been better researched than other cover crops and therefore the majority of the statements in the
knowledge base are about mucuna. Topics include:
• establishment of cover crops
• biomass production
• crop interactions with cover crops
• management of cover crops
• weed suppression
• varietal information
HOW TO CONSULT KNOWLEDGE BASES
Local knowledge can help researchers and development workers to explain the rationale behind farmers’ actions and can
contribute to developing appropriate solutions to development problems. Knowledge bases can be consulted in 4 main ways:
• by viewing sets of statements that fall under specific topics
• by performing a search for particular terms (words)
• by using customised tools (small computer programs supplied with AKT that interrogate and reason with the
knowledge base)
• by representing statements on a diagram and using these to investigate causal processes.
A number of instruction sheets are included in this package which are aimed at enabling the user to consult the knowledge
bases provided. It is suggested that the user starts with A quick sightseeing tour around AKT to familiarise themselves with
the different functions of the software. Once this is completed the user can then move on to consulting the knowledge bases on
particular topics of interest using any of the 5 examples provided:
• Soil fertility: farmers’ concepts
• What do peri-urban farmers know about inorganic fertiliser?
• Fallowing and soil fertility
• Trees and soil fertility
• Cover crops: local and expert knowledge
These illustrate the type of knowledge contained in the knowledge bases and the ways to access it. After completing the Quick
sightseeing tour around AKT the user will be able to consult knowledge bases using topics, searches and diagram
exploration. These skills are reinforced and developed in the other examples and the use of AKT tools is introduced in Trees
and soil fertility. Once the user has completed these sheets, or even before, they should be able to explore the knowledge
bases independently of the instructions provided. Some information on performing basic functions within AKT is included
below. A separate page, Diagram instructions shows how diagram functions are used. Definitions of key terms and concepts
used in the instructions and in the software are included in the Glossary. However, the user should note that not all functions
of the software are explained in this publication because the same software is used for both creating and accessing knowledge
bases. The user manual (Dixon et al., 2001 3 ) provides a comprehensive guide to the software and the creation of knowledge
bases.
3
Dixon H., Doores F., Joshi L. , and Sinclair F., 2001 Agroforestry Knowledge Toolkit for Windows: methodological guidelines, computer software and manual for WinAKT.
School of Agricultural and Forest Sciences, University of Wales, Bangor.
OPENING,
CLOSING , SELECTING , SAVING AND PRINTING KNOWLEDGE BASES
Opening AKT
Before opening a knowledge base, you must have the AKT program open. To do this double click on the AKT icon, and when
prompted, click on OK.
Opening a knowledge base
To open a knowledge base go to KB → Open KB…, then select the knowledge base you want to open and click on Open.
Dialogue boxes
Users will notice that with AKT it is possible to have a large number of dialogue boxes open at the same time and these appear
on the taskbar at the bottom of the screen. If new users find this confusing they should remember to close dialogue boxes once
they are finished with.
Working with multiple knowledge bases
You can have more than one knowledge base open at the same time, but you can only work interactively with one knowledge
base at the same time (unless you are using tools). The name of the current knowledge base is displayed at the top of the
screen. To view which other knowledge bases are open go to KB → Select KB…. To switch between open knowledge bases
you must then select the knowledge base you want and click on OK.
Printing parts of a knowledge base
It is possible to print sets of statements and diagrams from AKT.
Printing statements: There are 2 options for printing statements. You may print them out directly from the knowledge
base, or you may save them as a text file and open them in another application such as Word, to view and print them.
When you have the set of statements in front of you that you wish to print or save, click on Print Statements. You will
then be asked if you want to save them as a text file. If you do, click on Yes, if you wish to print the statements directly
from AKT click on No.
• Printing hierarchy diagrams You cannot print topic or object hierarchy diagrams directly from AKT. Instead you copy
them to the click board and then paste them into another application such as Powerpoint, to view and print them. In order
to do this, bring the diagram up on the screen (View Tree), then click on Copy to Clipboard. When you have done this,
open the application that you wish to view them in, and click on the Paste command.
• Printing statement diagrams Statement diagrams (i.e. diagrams that represent a set of statements from the knowledge
base) can be printed either directly from AKT or copied to another application. To print a diagram directly from AKT go
to your chosen diagram and click on Print Window. To copy statement diagrams to another application, follow the same
procedure as for printing hierarchy diagrams.
•
Saving a knowledge base
If you have made some alterations to the knowledge base which you want to save, e.g. by creating a diagram, you can save the
altered knowledge base. Go to KB → Save Kb As… , specify a new name for the changed knowledge base and click on Save.
Closing a knowledge base
To close the current knowledge base go to KB → Close KB…
Closing AKT
To close AKT go to File → Exit from AKT
GLOSSARY: KEY TERMINOLOGY AND CONCEPTS FOR USING AKT
Action
AKT
Attribute
Boolean search
Causal statement
Comparison
Comparison statement
Control structures
Data
Diagram
Formal language
Formal Term
Knowledge
Knowledge base (Kb)
Link
Link statement
Local knowledge
Memo
Natural Language Statement
Navigate
Node
Object
Object hierarchy
Primitives
Process
Prolog (WinProlog)
Source
Subobject (of an object)
Superobject (of an object)
Synonym
Systems tools
Tool
Topic
Topic hierarchy
User defined tools
Value
WinAKT
A type of formal term used to refer to a process carried out by man for the purpose of
managing his crops or livestock etc. for example: weeding, planting.
Agroecological Knowledge Toolkit: a methodology and software for creating knowledge
bases.
A type of formal term used to describe an object, process or action. Attributes are generally
measurable e.g. height, colour, frequency, rate, gradient, temperature.
A keyword search mechanism for retrieving statements containing particular keywords.
Any combination of words may be used in conjunction with ‘and’ and ‘or’.
A statement about the causal relationship between two objects, processes or actions.
A type of formal term used in comparison statements.
A statement comparing the properties of two objects.
When working with tools: program segments within AKT which control when and upon
what knowledge primitives are used.
A set of observations which may be quantitative or qualitative.
A way of graphically representing causal and link statements.
The restricted syntax (grammar) by which knowledge is coded into AKT.
Terms (words) - the key components in a formal language statement that do not belong to
the formal grammar.
The outcome, independent of the interpreter, of the interpretation of data or information.
An articulated and defined set of knowledge stored on a computer which can be accessed
and processed systematically.
a) A type of formal term used in link statements.
b) On a diagram – the connection between two nodes represented by an arrow.
A type of statement used to represent knowledge that cannot be represented by any other
type of statement.
Knowledge based on locally derived understanding, formed by experience and observation.
A facility within AKT which provides additional explanatory information about a formal
term, statement, diagram, topic or knowledge base.
A statement which has been automatically translated by AKT from the formal language to
a stylised English language translation.
A command used when working with diagrams that adds to a diagram all the nodes
immediately associated with a user selected node or statement.
Causal and link statements can be represented on a diagram by two nodes connected by a
link. Thus a node is the diagrammatic representation of one half of a causal or link
statement which appears as a rectangular or circular box. There are four types of node: i)
objects, ii) processes, iii) actions, and iv) attributes of either objects, processes or actions.
A type of formal term used to refer to a material or conceptual thing e.g. pests, soil, cows,
policy or household.
A way of organising knowledge about specific objects under more generic terms e.g.
Triplochiton scleroxylon, Milicia excelsa and Ceiba pentandra are all types of tree.
Small program segments within AKT employed for running a tool.
A type of formal term used to refer to a change or flux in the real world e.g. decomposition,
erosion.
An artificial intelligence programming language used for developing AKT software.
The origin of the information contained in a statement . There are two types of sources:
interview sources and reference sources.
An object falling below another object in an object hierarchy e.g. grass weeds may be a
subobject of weeds.
An object above another object in an object hierarchy e.g. weeds may be a superobject of
grass weeds.
A word with the same meaning as a formal term, frequently used to specify the
corresponding botanical name of a local name for a plant species.
Tools stored within AKT which can be used to interrogate and evaluate a knowledge base
A small computer program supplied with AKT that interrogates and reasons with the
knowledge base.
A collection of statements organised around a particular subject e.g. Weed management
and Grass weeds.
A collection of topics organised under a broader subject area e.g. Weed management and
Grass weeds both fall under the topic hierarchy Weeds.
Tools created by the knowledge base user that are stored separately to the main AKT
program in a file with an .mcr extension.
A type of formal term that is always attached to an attribute and describes that attribute e.g.
5kg, 20 ha, 3 months, yellow, tall, rapid.
The old name for AKT: Agroforestry Knowledge Toolkit for Windows.
DIAGRAM INSTRUCTIONS
Brief Description of the Buttons on left hand side of diagram
window.
'Object'
'Attribute'
'Process'
These commands are only used when
'Acti on'
creating a knowledge base.
'Link'
'Delete' Node/Link
'Hide'
Node/Link
Allows user to hide a node or link on the diagram if necessary to
increase clarity. Note underlying knowledge base is unchanged, and
if diagram is redrawn the hidden links/nodes will be restored.
'Show/Hide' Label
Allows user to turn on / off the labelling for a selected link. Select
the button, then press the 'mouse left button' down on the 'start' node
and holding the button down, move to the 'end' node and release the
mouse button (used to hide unwanted labels and improve clarity of
the diagram).
Brief Description of the Buttons on right hand side of diagram
window.
'Zoom In'
Allows more of the Kb to be seen on the diagram. (4 zoom levels)
'Zoom Out'
Reduces the area to be seen on the diagram. (4 zoom levels)
'Centre Zoom'
Click this button, place the mouse pointer over a node that you
would like to appear in the centre of the diagram, and click once.
The diagram will be re-positioned.
'Label Mode'
Clicks on this button will in turn :
1. dis play symbol information for all the links on the diagram.
2. display the stylised english labels for all the links on the
diagram.
3. remove all symbols / link labels
'Refresh'
Refreshes the current window and returns any highlighted nodes to
normal.
'Undo'
Will undo the last Navigate, Causes or Effects operation.
'Show Paths'
Will create a diagram showing all the possible paths between two or
more highlighted nodes. The nodes can be highlighted by a right
mouse double click over the node, and will turn green. Another
double click will return node to normal.
'Print Window'
Prints a copy of the current diagram on the default system printer.
The diagram will map onto either portrait or landscape mode. (Can
also print to a file )
'Navigate'
Will display on the same diagram all the parent and child nodes of
the selected node. Click 'navigate' then single click of the mouse on
required node.
'Statements'
Produces a list of all the statements represented on the diagram.
'Causes'
After clicking 'Causes' button, position new cursor over a node and
click l.h. mouse button. WinAKT will now redraw diagram
showing all causal paths leading to selected node.
'Effects'
After clicking 'Effects' button, position new cursor over a node and
click l.h. mouse button. WinAKT will now redraw diagram
showing all the effects resulting from the selected node.
'Select Diag.'
Allows user to quickly move backwards or forwards through the
current set of diagrams.
Dragging of nodes across the diagram.
Select any node by pressing the mouse left button down upon it,then
holding button down, move to the new position. The progress of the
node can be seen with a dotted node shape.
Resizing nodes on the diagram.
Select any node by pressing the mouse right button down upon it,
then holding button down resize node as required. The new outline
of the node is shown with a dotted outline
Show all links associated with a selected node.
Double click left mouse button on required node, and all statements
associated with the node will be listed. Details of the statements can
then be shown, deleted or printed.
Highlight a particular node.
Double click right mouse button on required node, and node will
turn green. By selecting two or more nodes and pressing the 'Show
Paths' button system will create another diagram showing all the
possible paths between the two or more highlighted nodes. Another
double click will return node to normal.
A QUICK SIGHTSEEING TOUR AROUND AKT
Go to the main menu (top left) and select KB → Sources…
This quick tour around AKT with the Atwima knowledge base is designed to familiarise you with the AKT
software and with ways of manipulating knowledge bases.
Getting started:
1. Load the AKT program (5.0) onto your computer by double clicking on the appropriate icon.
2. Open the atwima.kb by selecting KB from the menu at the top left hand side of the page and
choosingOpen Kb… Then select the atwima kb and click on Open.
Welcome Dialog Box
Read the Welcome dialog box to get an idea of what the knowledge base is about. Press Further Details to
find out more about where, when and how the knowledge base was made. Click on Pictures/Diagrams. Read
the text at the top and then view each picture by selecting it from the list, and then clicking on Select. When
you have finished with each picture or diagram click on the X at the top right to close it. These diagrams
provide some background information about the livelihoods of the farmers who provided the knowledge. The
section of this folder 'Livelihood and land use diagrams' gives instructions for drawing them. Click on Close to
return to the Welcome screen.
Press Topics.
Topic hierarchies
Topics are ways of organising information around particular subject areas e.g. ‘Fallow length’ or ‘Weed
management’. In topic hierarchies information about specific subject areas is arranged under a more
general subject e.g. ‘Fallow length’, ‘Fallow management’ and ‘Fallows and soil types’ all fall under the
general topic hierarchy of ‘Fallows’.
On the left you can see a list of the topic hierarchies in the knowledge base. Highlight ‘Soil types’. On the
right you will see a column containing a list of all the topics in this topic hierarchy, to the right of this you will
see ‘Soil types’ highlighted in blue and immediately below all the subtopics under it.
Click on View Tree and scroll down the page. This shows you the full topic hierarchy. Click on Close. Select
‘Red soil in the ‘Topics in hierarchy’ list. You will see that it now appears in the ‘Topic’ box with ‘Soil types’
specified as the supertopic above it and ‘Fallows on red soil’ and ‘Fertility of red soil’ specified as the
subtopics below it.
Sources tell you the origin of the information contained in a statement. All statements have a source, which
can be of 2 types: an interview with a person e.g. a farmer or scientist, or a reference e.g. a journal
reference.
On the left is a list of all the sources interviewed for the knowledge base. Let us look at one of them. Highlight
the name ‘Asmoah et al Kyereyase 2000a’ and press Details. A dialog box appears giving you the name of the
interviewers, interviewees and date of interview. You are also given the gender, age and ethnic origin of the
interviewees and a location which is their town of residence. If you press Memo, you will be given any further
details that the knowledge base creator felt to be important. Press Close on all three dialog boxes.
Topics
From the main menu select KB → Topics…
This gives you a list of all the topics in the knowledge base. Highlight ‘Management actions’ and press
Details/Edit. In the dialog box that appears you will see in the ‘Boolean Search String’ how the topic was
created – it is a search for any of the following action words – ‘burning’, ‘clearing’, ‘cutting’, ‘harvesting’,
‘planting’, ‘uprooting’, ‘use’, ‘work’. Click on Show use in statements at the bottom of the dialog box and a
list of all the statements on management actions will appear. There are 107 statements in all. As you scroll
through the list of statements you will notice that the translation does not sound like natural use of English this is illustrated and explained in the section introducing you to diagrams below. Close the list of statements
and the topic details.
Try the same thing with the topic ‘Weed control’.
Question: How many statements are there on weed control?
All knowledge in the knowledge base is represented through statements - these are the basic units of the
knowledge base. There are 4 different types of statement. Attribute statements tell you about the properties
(attributes) of something – they are descriptive. Causal statements give you information about causal
relationships. Comparison statements compare the properties of two objects. Link statements represent
knowledge that cannot be represented by the other types of statements.
You can see that 107 is a large number of statements to look through. We will now continue to look at smaller
collections of knowledge. Close all open dialogue boxes and return to the main menu.
Highlight in turn each topic hierarchy listed in the Topic Hierarchies dialog box (on the left hand side of the
screen).
Object Hierarchies
Question: What topics does the topic hierarchy ‘Weeds’ cover?
From the main menu select KB → Object Hierarchies…
Press Close on both dialog boxes to return to the Welcome Memo and Close again to arrive at the main menu.
Sources
What we refer to as objects are words used to refer to material or conceptual things e.g. pests, soil, cows,
policy, household. Object hierarchies are another way of sorting knowledge by arranging specific objects
under more general objects e.g. esa, funtum and onyina are all types of trees. Esa, onyina and funtum are all
therefore subobjects of the object ‘trees’, or alternatively, ‘trees’ is a superobject of the objects esa, onyina
andfuntum. Object hierarchies are, therefore, similar in structure to topic hierarchies.
On the left you can see a list of the object hierarchies in the knowledge base. Highlight ‘trees’. On the right
you will see a long column containing a list of all the objects in the hierarchy, to the right of this you will see
‘trees’ highlighted in blue and immediately below all the subobjects under it.
Click on View Tree and scroll down the page. This shows you the full object hierarchy, trees. Click on Close.
Select ‘timber tree’ in the ‘Objects in Hierarchy’ list. You will see that it now appears in the ‘Object’ box with
‘trees’ specified as the superobject above it and odum, okoro, opam, wawa specified as the subobjects below it.
Now Close all dialog boxes.
Formal Terms
Go to the main menu and select KB → Formal Terms…
Formal terms are the key components of statements. Objects are one type of formal term. Other types include
actions – activities with a human agent e.g. harvesting or planting, and processes – activities without a human
agent e.g. decomposition or germination. You will notice that underscores e.g. asase_tuntum, are used instead
of spaces in the AKT program. Words which require a capital letter are put in brackets e.g. 'Chromolaena
odorata'.
Press the downward arrow on ‘Type’ next to the word ‘all’ to see the different types of formal terms. Select
object. All the objects in the knowledge base are now listed. Scroll down and get an idea of the objects in the
knowledge base. Highlight asase_tuntum and press Details. This tells you what asase_tuntum is – black soil.
Press Show use in hierarchies. You will see that asase_tuntum appears in the object hierarchy soil. Press OK.
Press Show use in statements. The 5 statements that appear are all the statements in the knowledge base that
mention asase_tuntum. Under ‘Diagram Selection Type’ at the bottom of the dialog box press All Statements .
Introduction to diagrams
The diagram that you see before you will show you all the statements with asase_tuntum that can be
represented diagrammatically.
Diagrams are a way of representing
represented on a diagram. One statement
by an arrow. The different colours and
process, object and attribute nodes. The
statement.
statements. However
is represented by two
shapes of the boxes
words written within
only causal and link
nodes (a rectangular or
indicate different types
the nodes are the key
statements can be
oval box) connected
of node – action,
terms used in the
Press the Label Mode button twice. This gives you the statements written on the diagram in full. You can
make the statements more legible by dragging the nodes across the screen to separate them out. Alternatively
you can drag the statements themselves around the screen.
Statements are typed into the knowledge base as formal language statements using a formal grammar (like
a code) specific to AKT. These are then translated by the AKT program into stylised natural language
equivalents. This use of computer generated translation explains why some statements in the knowledge
base do not sound like natural English use.
Click on Formal Terms, select ‘cassava_mix’ and click on Details. An explanation is given here. Close all the
dialogue boxes and return to the diagram.
When working with complex diagrams it is helpful to remember to switch the label mode off. Turn the label
mode off now by clicking once more on Label Mode. Click on Navigate on the right hand side of the screen
and then click on the node, ‘fallow length’. (The Navigate button gives you the immediate causes and effects of
each node). ‘Fallow length’ will be highlighted in green and some additional nodes will appear connected to
‘fallow length. Carefully drag sideways all new nodes to reveal any further nodes underneath (by pressing the
left hand mouse button over the node and dragging the node away). The red lines indicate that there is more
than one line or arrow on top of one another. Click the Navigate button again and click on ‘soil
cocoa_suitability’. More nodes appear. Continue to build up the diagram by selecting Navigate each time and
clicking on one of the new nodes.
When you have finished, go to the main menu (top left hand corner) and select Diagram → Hide Diagrams.
Boolean Search
Go to the main menu (top left). Select KB → Boolean Search. Go to ‘Display KB terms of type’ and click on
the downward arrow to select ‘object’. Select asase_kokoo’. Press Details to see the term’s synonym and then
press Close on the Formal Term Details dialog box.
Now press Select and ‘asase_kokoo’ will appear in the Boolean Search String at the bottom of the dialog box.
Then press the AND button. Highlight ‘asase_tuntum’ and press Select once more. (If you want to check the
synonym for ‘asase_tuntum’, press Details.) Press Search. Two statements will appear. These are the only
statements in the knowledge base which include both ‘asase_kokoo’ and ‘asase_tuntum’.
In the Search Results dialog box press Close. In the Boolean Search dialog box press Clear. Now do the same
thing again, selecting ‘asase_kokoo’ and ‘asase_tuntum’, only this time using OR instead of AND. Press
Search.
Now you have 30 statements. This is because you have selected all the statements that include either
‘asase_kokoo’ or ‘asase_tuntum’.
In the Search Results dialog box press Close. In the Boolean Search keep ‘asase_kokoo or asase_tuntum’ in the
Boolean Search String but this time select ‘superobject’ in the ‘Search Options’ box so that it is highlighted in
the same manner as ‘object’. Press Search once more. You will now have 157 statements because, besides
statements using ‘asase_kokoo’ or ‘asase_tuntum’ you have also selected the statements related to the
superobject of ‘asase_kokoo’ and ‘asase_tuntum’ i.e. ‘soil’.
Question: What is the effect of cropping asase tuntum for 6 years?
Closing a knowledge base and finishing off
If you want to find out what is meant by cassava_mix, click on the Statements button on the right to get a list
of all the statements represented on the diagram. Then select statement 93 and click on Details. At the top of
the dialogue box you will see the natural language statement and at the bottom its formal language equivalent.
Close the knowledge base by selecting KB → Close KB… and close AKT by going to the main menu File →
Exit from AKT.
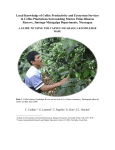
SOIL FERTILITY: FARMERS’ CONCEPTS
This section will use the Oda knowledge base from the Wassa Amenfi district to examine farmers’
knowledge of :
•
Soil properties that change over time
•
Different types of soil found at different locations in the landscape.
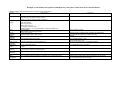
Farmers at the five field locations used a number of different terms to refer to soil fertility:
Twi
Asase okyene adee
Asase a enyine
Ahooden
Seradee
Asase mu seradee/
ahooden asa
Ahooden fofro aba mu
English translation
Land that is good for crop growth/fertile
Land that is well grown (has had a lot of vegetation on the fallow)
Strength
Fat
The fat/strength in the land is finished
New strength has come into (the land)
1
SOIL FERTILITY
Close the two formal term dialogue boxes and go to KB → Topic hierarchies…
On the left, select the hierarchy ‘Soil properties’.
On the right, select the topic ‘Soil fertility’ and click on Topic Statements.
iv.
v.
vi.
Looking through the statements we find knowledge about the following subject areas (the statements
have been rearranged to make them easier to read):
1. Soil fertility indicators
There are 2 statements about how farmers tell if soil is fertile or infertile:
The statement numbers (e.g. 4 and 5) refer to the statement number in the knowledge base.
For further details refer to: Frost 2000; Moss 2000a and b; Obiri-Darko et al., 2000
i.
ii.
iii.
4: the soil fertility is fertile if
•
the topiah leaves colour is green and the topiah leaves size is broad or
•
the adupren leaves colour is green and the adupren fruit size is big or
•
the clearing of land amount is complete and the burning of land amount is complete and
topiah presence is sparse or
•
the asogyere presence is a_lot or fertility indicator presence is positive
Load or select the Oda knowledge base.
Go to KB → Formal Terms…
Scroll down the list of terms until you come to ‘fertility’. Highlight ‘fertility ‘ and click on
Details. Read the definition and synonyms.
5: the soil fertility is infertile if
•
the topiah leaves colour is yellow and the topiah leaves size is small or
•
the growth of topiah amount is stunted or
•
the adupren fruit size is small or the adupren leaves size is small or
•
the infertility indicator presence is positive
It became apparent during the research that farmers have an aggregate concept of soil fertility. They
frequently associate fertile soil with soil that has a high organic matter content and refer to fertile soil as
land that crops grow and yield well one. This was sometimes confusing as e.g. land that is good for rice
is not good for cocoa and vice versa. Fertile soil is also associated with land that requires little weeding.
Although farmers hold an aggregate concept of soil fertility they are aware of the following:
•
Soil texture
Soil moisture
•
•
Soil fertility (meaning soil nutrients or else aggregate soil fertility – it was sometimes
difficult to distinguish between the two)
vii.
viii.
ix.
x.
1
Frost, W. 2000. Farmers’ knowledge of soil fertility and weed management in Atwima district, Ghana: The implications for
participatory technology development. Unpublished MSc. Thesis. University of Wales, Bangor. 91 pp.
Moss, C., 2000a. Livelihoods and local knowledge of soil fertility management in peri-urban Kumasi, Ghana. School of
Agricultural and Forest Sciences University of Wales, Bangor, UK. 24pp.
Moss, C., 2000b. Livelihoods and local knowledge of soil fertility management at Oda -Kotoamso, Wassa Amenfi District, Western
Region, Ghana. School of Agricultural and Forest Sciences University of Wales, Bangor, UK. 38pp.
Obiri -Darko, B., Ayisi -Jatango, J., Anglaaere, L., Cobbina, J., Moss, C., McDonald, M., Sinclair, F., and Young, Einir., 2000.
Livelihood systems and farmers ecological knowledge in Ghana: a report on three districts. Shortened Bush -fallow
Rotations for Sustainable Livelihoods in Ghana (DFID Project R7446). School of Agricultural and Forest Sciences
University of Wales, Bangor, U.K.
the
Select statement 4 and then click on Details.
Click on Formal Terms. Select ‘adupren’ and click on Details. You will now find out
what adupren is. Press Close and then repeat with the other plant names that you are
unfamiliar with.
The last part of statement 4 refers to ‘fertility indicator’, and if we click on Details for this
word, and then on Show use in hierarchies we see that it is a member of a hierarchy of
the same name. Go to KB → Object hierarchies… and from the left select ‘fertility
indicator’.
Look at the other members of this hierarchy by selecting the plant name and clicking on
Object Details. Then look at statement 5 in the same way.
Farmers use plant growth and the presence of particular plant species as indicators of fertile soil.
Topiah (Chromolaena odorata) is the most prevalent weed and fallow species in the forest and
transition zones of Ghana. To find out more about farmers’ knowledge of this species do the
following:
xi.
Return to the information about the formal term, ‘topiah’, and click on Show use in
statements. A further list of statements appears.
From these statements it becomes clear that topiah, as a species capable of spreading rapidly onto an
abandoned fallow, aids rapid regeneration of the land. However its persistence increases the frequency of
weeding necessary on land that has been fallowed for less than 6 years.
2. Factors influencing soil fertility
Alternatively go to Diagram → Show Kb Diagrams highlight ‘101’, ‘Soil fertility’ and click
on Select. You will then see a diagram of the topic ‘Soil fertility’ where the nodes and labels
have already been rearranged.
xiii.
4. Different types of soil
Close all unnecessary dialogue boxes and return to the topic statements for ‘Soil fertility’. A number of
the statements in this topic refer to factors that influence soil fertility:
Hide the diagrams by going to Diagram → Hide Diagrams. Then return to the list of statements for the
topic ‘Soil fertility’.
19: an increase in duration of continuous_cropping of land causes a decrease in fertility of soil
69: application of inorganic_fertiliser causes an increase in fertility of soil
20: decomposition of Gliricidia_sp. leaves causes an increase in fertility of soil
21: decomposition of Leucaena_sp. leaves causes an increase in fertility of soil
22: decomposition of Acacia_sp. leaves causes an increase in fertility of soil
151: cultivation of cowpea causes an increase in fertility of soil
40: an increase in content of soil organic_matter causes an increase in fertility of soil
104: the fallow maturity is mature causes the soil fertility is fertile
91: upland surface_runoff soil causes a decrease in fertility of upland soil
92: upland surface_runoff soil causes an increase in fertility of lowland soil
153: the asase_tuntum texture is loose causes the soil fertility is fertile
204: the fertility of asase_fufuo is greater_than red_soil if the asase_fufuo texture is muddy
209: the fertility of asase_tuntum is greater_than asase_fufuo
211: the fertility of asase_tuntum is greater_than red_soil
Farmers are aware that :
•
Leguminous tree and crop species increase soil fertility but do not know about the mechanisms
involved.
•
Decomposition of organic matter increases soil fertility.
•
Erosion on sloping land depletes the upper slopes, but adds fertility to lower slopes.
•
SOIL TYPES
i.
ii.
iii.
•
3. Influence of soil fertility
iv.
Other statements refer to factors resulting from an increase or decrease in soil fertility:
v.
3: the replanting of cassava frequency is 3 times if the soil fertility is fertile
196: a decrease in fertility of soil causes an increase in duration of fallow
13: the soil fertility is infertile causes a decrease in yield of crop
68: an increase in fertility of soil causes an increase in amount of growth of crop
14: the soil fertility is infertile causes grass growth weeds
45: the soil fertility is infertile causes an increase in amount of growth of nsensan
52: the soil fertility is infertile causes the growth of plant amount is stunted
•
•
•
xii.
Increased soil fertility results in improved plant and crop growth and yields.
Infertile soil results in stunted plant growth and more weeds, particularly grass weeds.
Farmers’ actions are also influenced by soil fertility, cassava can be cropped for longer on fertile
soil, on infertile soil farmers leave the fallow for longer.
To view all the statements in the topic ‘Soil fertility’ on a diagram click on All Statements at
the bottom of the list of topic statements for ‘Soil fertility’. Drag the nodes (boxes) around to
view them all clearly. You can use the Zoom In and Zoom Out buttons on the left to help you
to see and rearrange all the nodes. Click twice on Label Mode to view the statements next to
the nodes. These labels can also be dragged around to make them easier to read.
Farmers are aware of the relative inherent fertility of different types of soil. We will explore
this in more detail next.
Close all open dialogue boxes and go to the topic hierarchies menu (KB → Topic
hierarchies…). Select ‘Soil types’. You will see that there are 7 topics in the hierarchy.
Click on Topic Details and you will see that the topic consists of all subobjects of soil.
Go to KB → Object hierarchies and then select ‘soil’. You will see all the different types
of soil in the hierarchy. Click on View Tree.
During the fieldwork farmers did not exhibit any standard system of referring to different types
of soils in the area. Soils were referred to according to their most important distinguishing
feature.
Close the tree. Then view more detail for asase_fufuo and asase_tuntum by selecting the
type of soil and clicking on Object Details.
Close all unnecessary dialogue boxes and return to the topic hierarchy soil. Select each
topic in turn and view its Topic Statements.
1. Knowledge of upland and lowland soils
On upland:
•
Drying out of the soil is a concern due to the sunshine it receives in its exposed position and to
surface runoff.
•
Surface runoff not only diminishes soil moisture availability but also contributes to a decline in
fertility.
On lowland:
•
Moisture is abundant due to the protection offered by the shade of the surrounding hills, and
surface runoff from the uplands.
•
However waterlogging can be a problem after heavy rain.
•
Surface runoff contributes to the fertility of lowland soil.
Soil surveys carried out in this area have found that lowland alluvial soils around the Tano and Totua
rivers are more fertile (in this case, have greater nutrient availability) than the upland soils. Farmers’
observations demonstrate that they are aware of the moisture limitations of different soils, but the small
number of observations about soil nutrients show that their understanding and ability to disaggregate in
this respect is more limited.
SOIL TEXTURE
i.
ii.
2. Black soil, red soil and sandy soil
Black soil is
•
More fertile than other types of soil (asase fufuo and red soil).
•
It can be either sandy or clayey in texture:
o Where it is clayey moisture availability is limiting,
o Where it is sandy water infiltration and availability are high. It is also considered
more fertile when this occurs.
Red soil
•
Is sometimes gravely,
•
Generally has a high clay content causing cracking when dry and limiting moisture availability,
but where the subsoil is black or loose, moisture availability is high,
•
Heats up less than asase fufuo and generally exhibits better moisture retention than the latter,
but is less fertile than asase fufuo when the latter is muddy.
•
iii.
Sandy soil is
•
Loose in texture causing drainage to be rapid, water retention low and it to become hot with the
sun shining on it. However where it is muddy water retention is high.
Farmers’ differentiation of the types of soil in the area was based on their topographical positio n and
colour. Farmers referred to different types of soil based on their most important distinguishing
characteristic rather than using a systematic classification. Farmers gave broad descriptions of different
types of soil but also recognised that these were locally variable.
3. The subsoil
Farmers are aware of the lower layers of the soil. Hard clayey or rocky subsoil limits the potential of land
use for cocoa. Where continuous cropping has taken place gravel becomes exposed.
Farmers are aware of the different properties of different soil types with regard to soil texture and
moisture availability and make some observations about the relative fertility of the different soils. Their
observations about the subsoil in the area are prompted by the fact that cocoa is the most important crop,
and although the alluvial soils of the area are relatively suitable for it, some of the upland soils are more
marginal. Although farmers are able to explain some aspects of plant growth in terms of soil structure,
depth, moisture or fertility, they claim that some areas of their knowledge are lacking, for instance they
cannot explain why crops sometimes do not do well on an area that has just been cleared from a well
developed forest, or why cocoa will sometimes thrive on a soil on which plantain does not. They have
virtually no knowledge of soil acidity which is an important limiting factor to crop growth at Oda, or of
soil pests.
Return to the list of topics under the soil properties hierarchy. Select ‘Soil texture’ and
click on Topic Statements.
All these statements are causal statements (you can see this by clicking on Numerical,
after which the statements will be listed according to type). View the statements on a
diagram by clicking on All Statements or alternatively, by going to Diagram → Show
KB Diagrams, clicking on ‘103’ for ‘Soil texture’ and then Select. A diagram of these
statements that has already been arranged will appear. You may use the Label Mode
button on the left to view the full statements or to turn the labels off.
Looking at the diagram it becomes apparent that farmers perceive that the presence of trees, the
type of soil, the presence of organic matter, soil cover and sunlight all have an influence on
how hard or soft the soil is.
To view more about the factors which have an indirect influence on soil texture click on
Statements on the right hand side of the diagram. A list of the statements represented on
the diagram will then appear. Click on Most (connected node) on the right hand side of
the page. A new diagram will then be drawn showing the node with the most connections
– in this case ‘soil hardness’, highlighted in green. The direct causes of soil hardness are
shown on the diagram. To explore the indirect causes click on Causes (bottom, right) and
then click on the node ‘soil hardness’. A number of additional nodes will appear which
will require rearranging. Once you have rearranged your diagram you can continue to
explore causal links by clicking on Navigate and then clicking on the node you want to
explore.
SUMMING UP
•
•
•
•
•
•
•
•
•
Farmers have an aggregate concept of soil fertility at Oda.
However texture, moisture availability and fertility are important properties that are
distinguished.
Farmers use plant growth and the presence of particular plant species as indicators of fertile
soil.
Farmers view weeds and soil fertility as closely related.
Farmers view some plant species as playing both positive and negative roles – Chromolaena
odorata is viewed positively as a species that grow s rapidly on the fallow shading out other
weeds and producing a lot of biomass, but on crop land it is a persistent weed.
Soil fertility is closely related to soil organic matter content.
Areas where farmers’ knowledge is particularly sparse are
o Soil pests,
o Soil acidity and
o Causal processes that indirectly influence soil fertility such as the mechanisms by
which leguminous plants add nitrogen to the soil.
Farmers know that the presence of some tree species on crop land enhances soil properties
whereas other species have a negative effect.
Farmers differentiate between different types of soil based on colour and location and are
aware of their potential for crop growth.
LIVELIHOOD AND LAND USE DIAGRAMS
Livelihood and land use diagrams synthesise information about income generating activities and the use
of land and other resources by different groups of people within a community. They are intended to be
used as part of a Participatory Rural Appraisal exercise.
Participatory Rural Appraisal is a valuable tool that is used both to obtain information and to empower
individuals and communities through involving local people in the process of problem definition, data
collection, decision making and implementation. However the focus of this tool is less on empowerment,
and more on collecting and organising data, and ensuring that the data collected represents the different
social groups in the community.
PRA exercises are frequently time consuming and often resource intensive where locations are remote.
They result in large amounts of information, which require an equal effort to analyse. Researchers can
embark on PRAs without a sufficiently well defined problem or set of q uestions and many PRAs do not
address issues of social relations, the exclusion of particular social groups and gender (Slocum et al.,
1998)1.
It is therefore the intention to provide a tool which:
• Helps researchers maximise the use of existing information, whether it is contained in reports and
other documents or is the personal knowledge of local researchers and therefore makes information
gathering more cost effective
• Helps to bring greater definition to problems and questions for PRA exercises to answer. It helps
researchers to organise existing information. This leads to the identification of gaps in existing
knowledge that need to be filled through further targeted research
• Focuses on the analysis of information according to gender and other social classes so that different
social groups are not excluded.
The focus of the diagrams is land use by both individuals and households. The following factors are
relevant to the natural resource based livelihood strategies of individuals:
• land use
• access to land
• labour
• other income generating activities.
However the information represented can be tailored to the purpose for which the diagram is being drawn.
For example research with an agricultural remit will concentrate more on cropping patterns whereas
research on the use of forest resources would concentrate more on forest land use. Current definitions of
livelihoods are acknowledged (Carney, 19982 ) and the diagrams are flexible enough to include other
capabilities, assets and activities relevant to the livelihoods of individuals or households. The diagrams
represent best, land use and income generating activities of individuals and other ways of representing
e.g. relationships between different social groups with the community or capturing the dynamic nature of
livelihoods, can be used alongside them.
The instructions for drawing the diagrams now follow. As you go through the instructions you should
make a list of the information that you do not have or that you are unsure of. In this way you will be able
to target any further research to fill in missing the data.
1
Slocum R., Wichhart Lori., Rocheleau D., and Thomas-Slayter B. (1998) Power, process and participation – tools for change.
Intermediate Technology Publications. London, UK.
2
Carney D., (1998) Implementing the sustainable rural livelihoods approach in D. Carney (ed.) Sustainable Rural Livelihoods:
What contribution can we make? Pp 3 – 26. Department of International Development, London, UK.
DRAWING
LIVELIHOOD AND LAND USE DIAGRAMS
The method for drawing livelihood and land use diagrams is divided into two parts. In the first part it is
necessary to identify the land use patterns, access to land, use of labour and income generating activities
of different members of the population. In the second part the actual drawing of the diagram takes place.
An example is given using the village of Oda-Kotoamso, Wassa Amenfi district, Ghana, with the example
response following each question.
A
I DENTIFYING
SOURCES OF INCOME AND LAND USE
1. Identify the target community that you are attempting to describe.
For this example the target community will be the inhabitants of Oda-Kotoamso, Wassa Amenfi
district, Ghana.
2. Make a list of all the different criteria to disaggregate the population within the target area. Our
work suggests that gender, age, access to land, ethnic group and marital status (which influences a
woman’s degree of independence) are all relevant to livelihood strategies. Research with a poverty
focus would also include wealth.
•
•
•
•
•
Gender
Age
Access to land
Ethnicity
Marital status
3. List the income generating activities and other sources of income relevant to the people within the
target community.
•
•
•
•
•
•
•
Farming
Teaching
Barbering, carpentry, etc.
Agricultural labour
Galamsie (surface gold mining)
Trading
Kenkey (a maize food) making and other agro-processing activities and trading activities
4. For each activity listed in 2, identify the individuals who take part in the activity. Where the
activity is carried out jointly with other individuals consider who a) takes decisions b) holds
responsibility c) provides labour for it. Activities can be ranked according to how important they
are to different groups within the community.
Source of
income
Farming1
Men
Women
Younger
people
•••••
Older
people
•••••
Married
people
•••••
Single
people
•••••
•••••
•••••
Teaching
Barbering,
carpen try, etc.
Agricultural
daily wage
labour (by
day)
Galamsie
(surface gold
mining)
Kenkey
making and
other agroprocessing
activities and
trading
activities
Income from
tre e crops
elsewhere
Income from
land sale or
sharecropping
•
••
•
•
••
•
••
•
••
•
••
•••
•
•••
••
•••
•••
•
•••
•••
•••
•••
•••
•••
•••
•••
••
••
••
••
••
••
••
••
Ethnic
group *
Access to
land #
Land
owners
1
Men and women farm as individuals, rather than as households. Amongst married
people men dominate decision making. Responsibility and labour are shared .
However wives provide more labour on their husbands’ farms than vice versa. Not all
married women have their own farms.
*
In this example the population consists predominantly of the indigenous Wassa
population (>90%). Other ethnic groups present are Brong, Dagarthis, Fanti and Ewe.
Due to their low numbers they are not considered in this analysis.
#
Access to land has less influence on the type of income generating activity carried
out, but influences more the type of crops grown and cropping pattern.
••••• Practiced by almost all (>90%) people
•••• Practiced by many (>70% and <90%) people
Practiced by quite a few (>50% and <70%) people
•••
Practised by some (>20% and <50%) people
••
Practised by very few (<20%) people
•
5. Classify land use within the area. E.g. settlement, cemetery, sacred grove, farmland, fallow land.
•
•
•
•
•
•
•
Settlement
Farm land
Fallow land
Cemetery
Sacred grove
Agroforestry project land
CMB cocoa farm land
6. What different types of farm and fallow land can be found within the community? Establish a
more detailed classification of farm and fallow land considering parcels of land which are
spatially distinct for which land use (within one year or one season) is distinct (in terms of
management input, and productive output).
Agricultural land use at Oda
Land use
Mature cocoa
Other mature tree
crops
Young cocoa
Other young tree crops
Mixed food crop farm
with the establishment
of tree crops
Agroforestry (The
Oda-Kotoamso
Community
Agroforestry Project)
Food crop farms
Description
Age 8 years or more and fully yielding
Oil palm
Citrus
Rubber
Coffee
Age 4 – 7 years and not yet yielding to full potential
Oil palm
Citrus
Cocoa is established with plantain, cocoyam and cassava as shade crops with additional vegetable intercrops. Food crops
are harvested for three years.
The same system is practised for oil palm and citrus although the shade properties of intercrops are less important.
Alternatively oil palm may be re-established on old sites as old trees are felled and tapped for palm wine and akpeteshie.
Mixed food crops or
Kola or
Maize/cowpea or
with
Oil palm or
Timber trees
with
Cassava or
Without any other crop
Maize/cassava
1.
M i x e d f o o d c r o p s (subsistence plus surplus)
Plantain and cassava are the major crops with some additional intercrops which may include vegetables, cocoyam,
yam, maize, cowpea or groundnut. Pepper is the most common vegetable, garden egg, tomato and okro are also
grown. Mixtures of crops predominate although parts of the farm may contain a single crop such as yam or cassava.
2.
I n t e r c r o p p i n g a n d c r o p r o t a t i o n (cash or subsistence plus surplus)
Maize/ cassava intercrop
Major season maize and minor season cowpea
3.
S o l e c r o p p i n g (cash or subsistence plus surplus)
Cassava
Maize
Rice
Sugar cane
4.
Vegetables (cash)
Mixtures or sole stands of pepper, garden egg, tomato and okro.
7. Are there any temporal relationships between the land use types previously specified? How is land
rotated between different uses?
Fallow land
→
Old fallow (secondary
forest)
→
Agroforestry (The OdaKotoamso Community
Agroforestry Project) fallow
land
→
Fallow land
→
Mixed food crop farm
with the establishment
of tree crops
Mixed food crop farm
with the establishment
of cocoa
Mixed food crops or
Maize/cowpea or
Cassava or
Maize/cassava
With timber, oil palm or
kola
Food crop farms
→
Young tree
crops
→
Mature tree
crops
→
Fallow
land
→
Young cocoa
→
Mature
cocoa
→
Fallow
land
→
Timber, oil
palm or kola
→
Fallow land
→
Fallow land
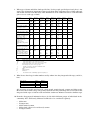
8. What type of farms and fallow land specified in 6. do the people specified previously, have? Are
some types of farm more important to some people than others (in terms of area of land cultivated,
and income derived from that land)? This information can be ranked. How does each individual
gain access to each type of land?
Land use
Men
Women
Mature tree crops –
cocoa
Young tree c rops – cocoa
•••••
VFGP
•••••
FGP
•••••
FGP
•••
FG
•••
FG
•••
FG
Mixed food crop farm
with the establishment of
tree crops – cocoa
Mature tree crops –other
Young tree crops – other
Mixed food crop farm
with the establishment of
tree crops – other
Mixed food crops or
Maize/cowpea or
Cassava or
Maize/cassava
With timber, oil palm or
kola
Mixed food crops
(subsistence plus surplus)
Intercropping and crop
rotation (cash or
subsistence plus surplus)
Sole cropping (cash or
subsistence plus surplus)
Vegetables (cash)
Key
•••••
••••
•••
••
•
V
F
G
S
P
A
Younger
people
•
FG
•••••
FG
•••••
FGP
•••
FG
•••
FG
•••
FG
Older
people
•••••
VFG
••••
FG
••
FG
Married
people
•••••
VFG
•••••
FG
•••••
FG
Single
people
•••••
VFG
•••••
FG
•••••
FG
•••
FG
•••
FG
•••
FG
•••
FG
•••
FG
•••
FG
•••
FG
•••
FG
•••
FG
•••
AF
•
AF
•••
AF
•
AF
•••
AF
•••
AF
•••
FG
•
FG
•••
FG
•••
FG
•••
FG
•••
FG
•••
FG
•
FG
•••
FG
•
FG
•••
FG
•••
FG
•••
FG
•••
FG
•
FG
•
FG
•••
FG
•••
FG
•••
FG
•••
FG
•••
FG
•••
FG
Ethnic
group
Access
to land
SPA settlers
Means of acquisition of land
Practiced by almost all (>90%) people
Practiced by many (>70% and <90%) people
Practiced by quite a few (>50% and <70%) people
Practised by some (>20% and <50%) people
Practised by very few (<20%) people
Clearing of virgin or otherwise unclaimed forest
Family land and inheritance
Gift
Sharecropping
Purchase
The Oda Kotoamso Community Agroforestry Project
9. What livestock are kept, in what numbers and by whom? Are they integrated with crops, and if so,
how?
Livestock
Sheep <10
Goats are taboo
Poultry <100
Men
+
+
Women
+
All categories of people own livestock - single people, married people, younger and older people.
However women tend to keep only poultry whereas men may own sheep also. Livestock are not
integrated with crops at Oda but roam around the settlement. Manure is not used to fertiliser crops.
10. From the disaggregated information above decide which different groups of individuals in the
community have sufficiently different livelihoods to be considered separately.
•
•
•
•
•
Older men
Younger men
Older married women
Older single (divorced or widowed) women
Younger women
B
DRAWING
THE LIVELIHOODS AND LAND USE DIAGRAM
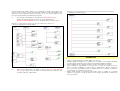
11. Decide upon suitable boundaries for a household. Represent the household with a box.
12. Which members of the household should be represented on the diagram? Group the individuals
specified in 10. to represent characteristic households. Represent these individuals within the box.
Identify the other individuals in the household e.g. child dependants and add them to the diagram.
Older peoples’ livelihood
Men
Women
Other family
dependants
For this example we are taking older men and older women (wives). Other dependants are loosely
defined and include resident children and nephews.
13. Represent the income generating activities identified for these individuals in 4. in the boxes
Older peoples’ livelihood system
Men
Non agricultural
income generating
activities
Women
Agro-processing
and trading
Income from
tree crops at
other towns
Income from
land rent
Other family
dependants
14. Represent land use identified in 8. for each individual. For the example below the emphasis will
be on agricultural land use.
Older peoples’ livelihood
Non agricultural
income generating
activities
Men
Women
Agro-processing
and trading
Fallow land
Farm land
Farm land
Fallow land
Food
crops
Tree-crops
Food
crops
Income from
land rent
Income from
tree crops at
other towns
Other family
dependants
Tree -crops
15. Add temporal relationships to land use using dotted arrows.
Older peoples’ livelihood
Non agricultural
income generating
activities
Men
Women
Agro-processing
and trading
Fallow land
Farm land
Farm land
Fallow land
Food
crops
Tree-crops
Food
crops
Income from
land rent
Tree -crops
Income from
tree crops at
other towns
Other family
dependants
16. Indicate the sources of labour used for agricultural activities using full arrows. Include labour
sharing strategies within the household and labour that is brought in from outside the household.
Hired labour (mainly young
men of Oda)
Older peoples’ livelihood
Non agricultural
income generating
activities
Men
Women
Agro-processing
and trading
Fallow land
Farm land
Farm land
Fallow land
Food
crops
Income from
land rent
Tree-crops
labour
Food
crops
Tree -crops
Income from
tree crops at
other towns
Other family
dependants
Extended
family labour
17. Represent livestock on the diagram indicating any relationships which integrate livestock with
crops.
Hired labour (mainly young
men of Oda)
Older peoples’ livelihood
Non agricultural
income generating
activities
Men
Women
Agro-processing
and trading
Fallow land
Farm land
Farm land
Fallow land
Food
crops
Tree-crops
Income from
land rent
labour
Food
crops
Tree -crops
Income from
tree crops at
other towns
Livestock
(sheep
and poultry)
Other family
dependants
Extended
family labour
18. Separate diagrams can be drawn to represent the land use patterns of different individuals in more
detail. These may include details of land access and cropping patterns.
Livelihoods and land use of older men
Older men
Farm land
Non agricultural
income generating
activities
Food crops
Fallow
Mixed
food crops
Sole and
intercropping
Yam stakes,
wood, fruit etc.
FGV
Mixed food crops
with young trees
Shade trees
Tree crops
FGV
Cocoa - young
Cocoa - mature
Oil palm
Income from
tree crops at
other towns
Citrus
Livestock
(sheep
and poultry)
Income from
land rent
Livelihoods and land use of older women
Women (wives)
Farm land
Agro processing
and trading
Food crops
Fallow
FG
Yam stakes,
wood, fruit etc.
Mixed food crops
with cocoa
Shade trees
Tree crops
Cocoa - young
FG
Livestock
(poultry)
Cocoa - mature
COVER CROPS: LOCAL AND EXPERT KNOWLEDGE
The cover crops knowledge base was created to analyse knowledge transfer about cover crops in the
Brong Ahafo region. Cover crop research in the forest and transition zones has been carried out by the
Crop Research Institute and the Soil Research Institute in Kumasi, and the Sedentary Farming Systems
Project and the Integrated Food Crop Systems Project in conjunction with the Ministry of Food and
Agriculture in the Brong Ahafo region.
i.
ii.
Open the cover crops kb. (Ignore the first message that appears and just click on OK).
Read through what the knowledge base is about in the Welcome screen and under
Further Details.
Click on Topics, then select ‘Mucuna’ from the list of topic hierarchies on the right. View
the differ ent topics about mucuna by clicking on View Tree on the left.
Close the Mucuna hierarchy tree. Then select the topic ‘Sole cropping of mucuna’ and
click on Topic Statements.
iii.
iv.
v.
To find out the sources of these recommendations select statement 55 and click on
Details.
The source is given at the top of the dialogue box as ‘MOFA, 2000 Ghana extension
2001a’. Click on Sources, select this source and click on Details. The recommendation
comes from the Land and Water Management Unit of MOFA.
Close the dialogue boxes and repeat the procedure to find out the source of statement 214.
These are not the only recommendations for cover crop spacing in the knowledge base.
Press Close (twice) to close the source information and return to statement 214. Click on
Formal Terms, select ‘spacing’ and click on Details. Then click on Show use in
statements. 18 statements appear.
Not all of these statements are about mucuna. To find only those statements with both
‘mucuna’ and ‘spacing’ go to KB → Boolean Search (top left hand side of the page).
Type ‘spacing and mucuna’ in the search box at the bottom, select ‘object’ and
‘subobjects’. Click on Search.
vi.
vii.
viii.
ix.
The statements that appear are as follows:
This time there are 14 statements.
55: the mucuna spacing is 80cm x 50cm if sole_cropping of mucuna or inter_cropping mucuna short_season_cereal
56: the weeding of mucuna time is in the range 2 WAP to 4 WAP if sole_cropping of mucuna
172: the Mucuna spp Rajada dry_matter accumulation is 4.4t/ha if the sole_cropping of mucuna location is
northern_Guinea_savanna_zone
197: the weeding of mucuna frequency is twice if the sole_cropping of mucuna location is Ghana
198: the weeding of mucuna time is 1WAP if the sole_cropping of mucuna location is Ghana
199: the weeding of mucuna time is 4 WAP if the sole_cropping of mucuna location is Ghana
214: the mucuna plant spacing is 40cm x 40cm if sole_cropping of mucuna
351: the sole_cropping of mucuna time is major_season causes the mucuna dry_matter accumulation is in the range
3.2t/ha to 4.0t/ha if the mucuna location is transition_zone_of_Ghana and the growth of mucuna duration is 4 months
457: sole_cropping of mucuna causes the cover_cropping of mucuna results is best if the weed type is aggressive and
the mucuna time_of_use is first
475: the weeding of mucuna frequency is once causes an increase in amount of establishment of mucuna if
sole_cropping of mucuna
492: the application urea maize rate is 90kg/ha causes the subsequent_crop maize grain yield is 57% increase if
control_treatment is maize_with_no_fertiliser and the sole_cropping of mucuna time is major_season and the
sole_cropping of maize time is minor_season and the mucuna location is transition_zone_of_Ghana and the growth
of cover_crop duration is 4 months
556: the application fertiliser mucuna rate is 45:18:18 kg NPK/ha causes the subsequent_crop maize yield is same if
control_treatment is maize_with_recommended_dose_of_fertiliser and the sole_cropping of maize time is
major_season and the mucuna location is transition_zone_of_Ghana
562: the sole_cropping mucuna researcher management is positive causes the subsequent_crop yield_increase is
100%
644: the subsequent_crop_grain_yield of mucuna is greater_than Canavalia ensiformis if the sole_cropping of
cover_crop time is major_season and the cover_crop location is transition_zone_of_Ghana and the growth of
cover_crop duration is 4 months
•
x.
Different plant spacing is given depending on the purpose for which mucuna is grown.
Mucuna as a green manure requires closer spacing whereas when it is grown for seed it
requires wider spacing. Suggestions for sole cropping and intercropping the cover crop
are, however, fairly similar.
Return to the Boolean search. Click on the downward arrow under ‘Display Kb terms of
type’, scroll down and select ‘topic’. From the list below find ‘International research’ and
add it to the search string so that it says ‘spacing and mucuna and 'International research'’.
Compare the resulting statements with a search for ‘spacing and mucuna and 'Ghana
research and extension'’.
•
In general the Ghanaian results suggest closer spacing than the more general international
ones.
2. Weeding
xi.
Return to the statements for the topic ‘Sole cropping of mucuna’.
•
•
Weeding the mucuna cover crop is known to increase establishment (statement 475).
However there are contradictions about the number of times this should be carried out
(statements 56, 197, 198, 199).
Sole cropping of mucuna is recommended if the cover crop is being used for the first time
to combat aggressive weeds (statement 457).
Reading through the statements there is the following knowledge:
xii.
1. Crop spacing
•
Two statements suggest different spacing for planting mucuna as a sole crop (statements
55 and 214).
More comprehensive information about weeding requirements of mucuna is found under
the topic ‘Weeding requirements of mucuna’.
3. Biomass production
•
xiii.
Two statements suggest quantities of biomass produced by mucuna (statement 172 and
351), one for a particular species in the northern Guinea savanna zone and one for 4
months growth in the transition zone.
Again, more comprehensive information about biomass production can be found under
the topic ‘Biomass production of mucuna’.
4. Influence of mucuna on maize yields
•
•
Maize yields are higher in the transition zone after a mucuna cover crop of 4 months
growth in the major season than after a Canavalia ensiformis cover crop of the same
duration (statement 644).
Under researcher management a mucuna cover crop can produce a 100% yield increase in
a subsequent crop (statement 562).
5. Research using fertiliser with mucuna
•
Research shows that mucuna cannot supply all of a subsequent maize crop’s nitrogen
requirements (statement 492). However it appears to be able to supply 50% of a maize
crop’s NPK requirements (statement 556 – you can check the recommended rate of
fertiliser for maize by going to the statement Details for this statement, clicking on
Formal Terms, selecting ‘maize_with_recommended_dose_of_fertiliser’ and clicking on
Details).
COMPARING THE KNOWLEDGE OF RESEARCH AND EXTENSION
Knowledge bases can be used to compare what is known by different people. Within the cover crops kb
there is knowledge about cover crops from the research community and from extensionists in Ghana.
xiv.
xv.
xvi.
xvii.
xviii.
•
Go to KB → Topic Hierarchies… Select ‘Research and extension’ and click on View
Tree to view the topics in the hierarchy.
Close all the open dialogue boxes.
Go to KB → Topics … Select the topic ‘Ghana extension’ and click on Select, click on
AND and then choose the first topic in the list 'Application of fertiliser to mucuna' and
click on Search. There is only one statement for this topic.
Repeat this procedure, replacing 'Application of fertiliser to mucuna' with other topics
about mucuna.
Compare the knowledge of ‘Ghana extension’ with the knowledge of the research
community by replacing ‘Ghana extension’ with ‘Ghana research’ and ‘International
research’ and searching for different topics.
For the majority of topics about mucuna, there are more statements from research than there
are for extension: e.g. ‘Application of fertiliser to mucuna’ gives 5 statements for research and
1 statement for extension, ‘Biomass production of mucuna’ gives 79 statements for research
and 8 statements for extension. However a few of the topics have similar numbers of
statements for research and extension. These are ‘Crop interaction with mucuna’,
‘Intercropping mucuna’, ‘Seed production of mucuna’, ‘Sole cropping of mucuna’, ‘Weeding
requirements of mucuna’.
xix.
Do a topic search for knowledge of the research community about the weeding
requirements of mucuna using the search string ‘('International research' or 'Ghana
research') and 'Weeding requirements of mucuna'’.
Knowledge of the research community:
•
Establishment of mucuna on land dominated by Imperata cylindrica requires the grass to be
slashed twice.
•
Maize requires weeding 3 times if no cover crop has been grown, but once if it was preceded
by a cover crop.
•
Mucuna only requires 1 weeding during establishment if it is well done.
•
Weeding sole cropped mucuna increases establishment.
•
Mucuna does not need weeding during establishment if the spacing is adequate and growth is
normal.
•
Neglecting to weed volunteer mucuna causes 65% maize lodging and a reduction in maize
yield of 35%.
•
If mucuna and maize are planted at the same time the mucuna must be weeded 1 to 3 times to
prevent it climbing the maize.
•
Mucuna is easier to weed than Imperata cylindrica and Chromolaena odorata.
xx.
Repeat the search, but this time using ‘'Ghana extension' and 'Weeding requirements of
mucuna'’.
Knowledge of extension:
•
Mucuna should be weeded between 2 weeks and 4 weeks after planting if it is sole cropped.
•
Mucuna should be weeded twice if it is sole cropped, at 1 week, and 4 weeks after planting.
•
Maize requires weeding 2 or 3 times if no cover crop has been grown, but once or twice if it
was preceded by a cover crop.
•
The control of volunteer mucuna is easy as it does not resprout when cut.
•
Weeding increases the establishment and ground cover of mucuna.
•
Cover cropping with mucuna increases the ease of weeding of the crop grown after it.
There is some disagreement over the number of times that maize must be weeded after growing a
cover crop in comparison to the number of times without a cover crop which suggests that although
the benefits in terms of mucuna’s suppression of weeds are likely to be positive, they may be
variable and the situations in which mucuna provides the most benefits in terms of weed
suppression have not been clearly defined by research or passed on to extension.
xxi.
xxii.
Go to KB → Object Hierarchies …. Select ‘mucuna’, and then click on View Tree. A
long list of different types of mucuna can be seen. Some of the names are specific to
Ghana and others are used in international research. There has been no uniform way of
referring to different types of mucuna and two different names for the same genotype may
be used hindering communication and learning about their properties and suitability for
use with different cropping patterns.
Click on Close and return to the mucuna hierarchy. Select ‘black_seeded_mucuna’ and
then click on Object Details, read the information, click on Show use in hierarchies, and
Show use in statements to view further knowledge. Repeat this procedure for some of
the other mucunas listed in the hierarchy.
Continue to explore the knowledge base using the topics and Boolean searches.
TREES AND SOIL FERTILITY
Farmers recognise trees as important in the restoration of soil fertility during the fallow and for
protecting the soil from drying out. They also recognise the influence of different species on soil
moisture and soil fertility.
T REES
Farmers at all 5 sites recognised both negative and positive implications of having trees on farm.
i.
ii.
iii.
•
•
Farmers’ knowledge in the atwima kb shows that the number of trees on farm is influenced by:
The length of the fallow,
The type of soil,
Management actions e.g. not cutting young and sprouting trees at the start of the fallow
and
The presence of Panicum maximum which hinders colonisation of fallow land by trees.
The presence of trees on the farm has both positive and negative effects:
Decreasing density of trees makes rainfall more erratic.
Decomposing leaves, fruit and logs increase soil fertility.
Trees shade the soil and make it cool (enyunu).
Trees cause a decrease in wind speed on farm.
Shading decreases the yield of mature cocoa trees but prolongs their life.
Trees shade out undergrowth and weeds – particularly Chromolaena odorata and
Panicum maximum on the fallow.
iv.
•
Open the atwima.kb. Go to KB → Boolean search. Type in the word ‘trees’ and make
sure ‘object’ is selected. Click on Search. A list of 42 statements appears.
To draw a diagram, click on All Statements at the bottom of the page. Rearrange the
nodes on the diagram so that they are all visible. (Alternatively go to Diagram → Show
Kb Diagrams and select diagram ‘128’, ‘Trees’).
Look at the nodes, and if the meaning of the diagrammatic representation is unclear,
double click on a node with the left mouse button and this will take you to the statements
for that node.
To explore the influence of the reduction in wind speed on farm caused by the presence of
trees, click on Effects (bottom, right) and then click on the node ‘wind speed’. Rearrange
the resulting nodes.
A decrease in wind speed reduces the likelihood of plantain being blown over, and the effectiveness
of the dispersal of the seeds of acheampong (Chromolaena odorata).
v.
vi.
Repeat iv. for other nodes on the diagram.
Compare farmers’ knowledge at Atwima with farmers’ knowledge at Yabraso in Wenchi
district by opening the yabraso knowledge base and doing a Boolean search for trees.
Compare the results of your search from the yabraso.kb with that from the atwima.kb.
THE INFLUENCE OF DIFFERENT TREE SPECIES O N SOIL FERTILITY AND
SOIL MOISTURE
Farmers at the five sites recognised the influence of different tree species on soil properties –
predominantly soil moisture and soil fertility.
•
•
To see what tree species are mentioned in the knowledge bases do the following :
i.
Open all the local knowledge bases (atwima, oda, peri-urban kumasi, subriso and
yabraso).
ii.
Go to Tools → Open Tool File…
iii.
Find the GhanaTools.mcr and click on Open.
iv.
Scroll down the list of tools on the left, and select ‘trees’.
v.
Click on Details. Read the information in the ‘Description’ box at the top of the
page. (You do not need to read or understand the information below it).
vi.
In the dialogue box on the left click on Run and select ‘List trees by scientific name'.
Click on OK. You will then obtain a list of all the Latin names of trees in the
knowledge bases. The tool output also tells you in which knowledge bases the
different trees occur.
vii.
To list the trees by local name, run the tool again, but this time choose the option
‘List trees by local name’.
To view the statements about the influence of tree species on soil moisture do the following:
viii.
Go to Tools → Tools → User Tools → Ghana Tools → tree_species_search. This
tool enables you to search for tree species within a set of topic statements.
ix.
Click on Run, and when prompted to do so, choose the topic ‘Trees and soil
moisture availability’.
x.
At the end you will obtain a list of statements for the topic ‘Trees and soil moisture
availability’ and you will be told the number and names of the trees that appear in
these statements. You will now have a list of statements that show the influence of
individual tree species on soil moisture availability.
The table on the next page summarises farmers comments from the topic ‘Trees and soil
moisture availability’ and the topic 'Trees and soil fertility'.
Farmers’ knowledge of the influence of tree species on soil fertility and soil moisture. (The letters stand for the
individual knowledge bases A = Atwima, O = Oda, P = Peri urban kumasi, S = Subriso, Y = Yabraso. ‘+’
represents a positive influence and ‘-’ a negative influence).
Tree species
Local name
Acacia_sp.
Albizia adianthifolia
Albizia ferruginea
Albizia spp.
Alchornea cordifolia
Alstonia boonei
Antiaris toxicaria
Bombax buonopozense
Ceiba pentandra
Celtis mildbraedii
Cola gigantea
Acacia
Pampena
Aweamfosamena
Okoro
Gyama
Nyamedua
Kyenkyen
Akonkodie
Onyina
Esa
Awapuo
Watapuo
Denya
Senya
Domini
Nyankyerene
Doma
Funtum
Gliricidia
Foto
Mahogany
Kwakwuedauba
Kumanini
Leucaena
Nnan_furo
Mango
Pepewa
Odum
Sasamamsa
Nworama
Srono
Esia
Cylicodiscus gabunensis
Daniellia oliviera
Ficus capensis
Ficus exasperata
Ficus spp.
Funtumia elastica
Gliricidia_sp.
Glyphea brevis
Khaya spp.
Lannea welwitschii
Leucaena_sp.
Mallotus oppositifolius
Mangifera indica
Margaritaria discoidea
Milicia excelsa
Newbouldia laevis
Parkia biglobosa
Petersian thus
macrocarpus
Phyllanthus reticulatus
var. glaber
Piptadeniastrum
africanum
Pterygota macrocarpa
Rauvolfia vomitoria
Red odoma (Ficus spp./
Ficus capensis)
Ricino dendron heudelotii
Solanum erianthum
Spathodea campanulata
Terminalia ivorensis
Terminalia superba
Trema orientalis
Triplochiton scleroxylon
Vitellaria paradoxa
Awobe
Soil
moisture
+
Soil fertility
+
Wama
Pepediawuo
Kokoanisua
Emire
Ofram
Sesea
Wawa
Kranku
•
Soil fertility
-
Some trees grow rapidly covering fallow land quickly: ogyama.
For some trees farmers did not explain how they increased soil fertility: kakapenpen, foto,
pepediawuo, kokoanisua, Acacia_sp., Gliricidia_sp., Leucaena_sp., aweamfosamena,
kyenkyen, mahogany.
The rapid decomposition of the flowers, fruit and woody parts of some trees adds to soil
fertility: domini, kumanini, odoma, onyina, nyamedua, wama.
O
S
AOS
P
OS
OS
OS
O
S
A OP
O
To find more information about an individual tree species across all the loaded knowledge bases do the
following :
Y
AO
S
xii.
O
PY
A
P
A OPS
OPS
OSY
S
A
A
A
•
The following information about onyina is retrieved:
O
A
S
A
S
Y
PY
O
S
Y
O
Farmers suggest that onyina increases soil fertility through the rapid decomposition of its
woody parts and leaf and flower fall.
Branches are brittle and can cause crop damage (but add to soil fertility).
Onyina hosts capsids.
Shade provided by young trees is too dense, but that of taller trees is good for crop
growth.
There is some contradiction concerning comments relating to soil moisture availability.
A
S
O
It is possible to search for statements under a common topic throughout all the loaded knowledge bases.
xiii.
S
O
OS
AS
OP
OS
S
PY
Y
Go to Tools → Tools → User Tools → Ghana Tools → term_search. Click on Run,
and when asked to, type in the local name of the tree you wish to search for e.g.
‘onyina’ (Ceiba pentandra). The tool then produces a list of statements for each
knowledge base that contain this term.
AOS
AY
A
O
S
Repeat steps viii to x but this time select the topic ‘Trees and soil fertility’.
Viewing the statements produced we see that farmers claim that particular tree species directly
increase soil fertility as follows:
O
Dahoma
Keyja
Kakapenpen
Odoma kokoo
Soil
moisture
-
xi.
A
A
A
A
O
AS
A
O
OS
A
A
Go to Tools → Tools → User Tools → Ghana Tools → topic_hierarchies_common.
Click on Run. Select ‘Trees’, click on OK, then select the topic ‘Trees and soil
fertility’ and click on OK again. You will be presented with a list of statements for
each knowledge base for the topic. Following each set of statements you also have
the option of viewing the statements on a diagram. When all kbs have been searched
a final output is provided which again lists the topic statements for each knowledge
base.
The statements that are obtained through this search method give all knowledge about trees and soil
fertility in general as well as knowledge about individual species.
FALLOWING AND SOIL F ERTILITY
Fallowing is the traditional and frequently the only means of restoring soil fertility in the forest and
transition zones of Ghana. Agricultural scientists frequently consider fallowing to be an outdated and
destructive practice and would like farmers to practise more sedentary agriculture. However, uptake of
more sedentary farming systems is slow and consideration of farmers’ knowledge concerning fallowing
may suggest reasons why.
2. Crop growth and yields
This exercise will examine farmers’ knowledge of fallowing in Atwima district in the Ashanti region.
o
i.
ii.
iii.
Open or select the Atwima knowledge base.
Go to Kb → Topic hierarchies…
Select ‘Fallows’ in the box on the left.
THE DURATION OF THE F ALLOW
iv.
From the box on the right, select ‘Fallow length’ and click on Topic Statements
You will find that 28 statements appear. By examining the content of the statements it can be seen that
they fall under the following headings:
52: an increase in length of fallow causes an increase in rate of growth of rice
276: the fallow length is 2 years causes the crop yield is average if the asase_kokoo presence is positive
283: the fallow length is 3 years causes the crop yield is average
Farmers can achieve a satisfactory yield on fallows that are shorter than those that are required to
return soil to ‘high’ levels of fertility.
3. Weeds
5: the nyanya appearance is first if the fallow length is long
60: the fallow length is >1 year causes a decrease in density of esre seed
61: the fallow length is 5 years causes a decrease in density of acheampong if the asase_kokoo presence is positive
179: clearing of fallow causes the presence of weeds seed is high if the fallow length is not >5 years
270: the fallow length is 1 y ear causes an increase in rate of growth of weeds
272: an increase in length of fallow causes a decrease in strength of weeds
vi.
1. Fertile soil and the duration of the fallow on different soil types
55: the fallow length is short causes a decrease in fertility of soil
66: the fallow length is 5 years causes the density of earthworm is high
71: the fallow length is in the range 8 years to 10 years causes the black_layer depth is 15cm
387: an increase in length of fallow causes an increase in fertility of soil
73: the fallow length is in the range 15 years to 20 years causes the fertility of soil is high if the afonywie presence is
positive
84: the fallow length is in the range 5 years to 10 years causes the fertility of soil is high if the asase_kokoo presence
is positive or the asase_tuntum presence is positive
85: the fallow length is 6 years causes the fertility of soil is high if the ateche presence is positive
v.
o
o
o
Generally farmers recognise the longer land is left to fallow, the greater the fertility of the soil, and
refer to the build up of organic matter in the topsoil and the presence of earthworms.
Farmers know that different types of soil require different periods of time to regain high levels of
fertility:
o Afonywie requires 15 to 20 years.
o Asase kokoo requires 5 to 10 years.
o Asase tuntum requires 5 to 10 years.
o Ateche requires 6 years.
Although farmers are satisfied with the crop yields that they obtain, weeds are more of a problem
after a short fallow. Panicum maximum (esre) is a problem on very short fallows, and acheampong
(Chromolaena odorata) on fallows of less than 5 years.
vii.
Select statement 73 and click on Details. Click on Formal Terms, select ‘afonywie’ and
click on Details. You will see that this is a sandy loam soil. Close the 3 dialogue boxes.
Repeat this procedure for statement 84 with ‘asase_kokoo’ and ‘asase_tuntum’ and for
statement 85 with ‘ateche’.
If you do not know what esre is, select statement 60 and click on Details. Click on
Formal Terms, select ‘esre’ and click on Details. You will see that ‘esre’ is the grass
Panicum maximum. Close the dialogue boxes and repeat the procedure to find out what
acheampong is in statement 61.
Statement 5 mentions nyanya. Select statement 5 and click on Details. Click on Formal
Terms, select ‘nyanya’ and click on Details. Nyanya is a weed that appears before other
weeds on crop land if the fallow has been long. Click on Show use in hierarchies.
Nyanya is both a weed and an indicator of fertile soil. Click on OK. Click on Show use in
statements. Examining the statements that then appear provides more information about
nyanya. When you have read the statements return to the statements for the topic ‘Fallow
length’.
4. Fallow vegetation
41: a decrease in length of fallow causes a decrease in density of trees
59: the fallow length is in the range 5 years to 10 years causes the nfofoa_kwae presence is positive
68: the fallow length is in the range 8 years to 10 years causes the death of undergrowth proportion is 100%
101: clearing of kwae causes development of nfofoa_kwae if the fallow length is long
o
Farmers are aware of the changes in vegetation on fallow land as abandoned farm land reverts to
forest
5. Crops grown and cropping periods
62: the fallow length is 5 years causes the crop cropping_period is 2 years if the asase_kokoo presence is positive
63: the fallow length is in the range 8 years to 10 years causes the crop cropping_period is in the range 4 years to 5
years if the asase_kokoo presence is positive
138: the afonywie cropping_period is 1 year causes the fertility of afonywie is high if the fallow length is long
142: the afonywie cropping_period is in the range 2 years to 3 years causes the fertility of afonywie is low if the
fallow length is long
367: the fallow length is in the range 7 years to 10 years causes the cocoa_suitability of soil is high if the
asase_kokoo presence is positive
391: the fallow length is 2 years causes the growth of plantain rate is zero
o
o
The duration of the fallow also influences the length of time the land can be cultivated. 4 or 5 years
cultivation is possible after a fallow of twice that duration, whereas only 2 years is possible when
the land has only been fallowed for 5 years.
The duration of the fallow also influences the type of crops that can be grown. Cocoa and plantain
require fallows of longer duration than other crops.
6. Soil pests
56: a decrease in length of fallow causes an increase in density of soil_pest
58: the fallow length is long causes the soil_pest presence is absent
o
There are 2 statements in the knowledge base that show that farmers are aware of the influence of
fallow length on soil pests, however farmers’ knowledge in this respect is fairly minimal and lacks
more specific information about the type of soil pests encountered.
viii.
ix.
x.
Return to the lists of statements for the topic ‘Fallow length’. To view a diagram of all the
causal statements click on All Statements at the bottom of the dialogue box. The
diagram can be rearranged by dragging the nodes (boxes) around the page. To view a
diagram that has already been rearranged in this way go to Diagram → Show Kb
Diagrams. Select diagram ‘119’, ‘Fallow length’ and click on Select.
The diagram shows all the direct implications of fallow length. To explore more of the
indirect influences through causal processes, click on Effects at the bottom right of the
screen and then click on ‘Fallow length’.
The number of nodes now increases and the diagram becomes more complicated. We are
now going to explore the connection between ‘fallow length’ and ‘weeds density’ using
the diagram. The node ‘fallow length’ is already highlighted in green. To find and then to
highlight the node ‘weeds density’ click on Statements on the right hand side of the page.
This will give you a list of all statements shown on the diagram. The first statement
contains the words ‘density of weeds’. Select this statement and then click on Find on the
right. You will find two additional nodes highlighted for you on the diagram. Unhighlight
the node ‘crop yield’ by double clicking on it with the right hand mouse button. Now
only two nodes will be highlighted – ‘weeds density’ and ‘fallow length’ (although your
diagram is rather large and you may not be able to see both at the same time on the
screen). Now click on Show Paths. A new diagram is drawn which shows all the causal
pathways between ‘fallow length’ and ‘weeds density’. Rearrange the diagram to make
the connections between the nodes clear.
o
Farmers understand that trees on the fallow protect the soil from sunlight and shade out weeds.
Longer fallows are more effective at shading out weeds.
CLEARING FALLOW LAND
The topic ‘Fallow management’ provides further information about fallows, weed growth and labour
requirements.
xi.
Return to the topic hierarchy ‘Fallows’ and this time select the topic ‘Fallow
management’ and click on Topic Statements.
The list of statements produced can be arranged under the following headings:
1. Weed growth
185:
186:
187:
188:
273:
274:
the clearing of fallow season is harmattan causes a decrease in density of germination of weeds
the clearing of fallow season is harmattan causes the density of sprouting of weeds stump is low
the clearing of fallow season is rainy causes an increase in density of germination of weeds
the clearing of fallow season is rainy causes the density of sprouting of weeds stump is high
the fallow stage is mature causes the clearing of weeds frequency is 2
the fallow stage is not mature causes the clearing of weeds frequency is in the range 3 to 4
o
o
The season when the fallow is cleared influences weed growth
The type of vegetation on the fallow influences the number of times it is subsequently necessary to
weed crops.
2. Ease of land clearing
438: the clearing_ease of fallow acheampong is greater_than fallow esre
442: the clearing_ease of fallow acheampong is greater_than fallow nfofoa_kwae
o
It is easier to clear fallows dominated by acheampong (Chromolaena odorata) than those that are
secondary forests or esre (Panicum maximum) fallows.
SUMMING UP
•
•
•
Considerations of the time required to restore soil fertility during the fallow may be over estimated
given that farmers can achieve average yields after short fallows.
Short fallows may have a greater influence on weed growth than on crop yields. Panicum maximum
is a problem on very short fallows, whereas Chromolaena odorata prevails on fallows of less than 5
years.
Farmers grow different crops after shorter fallows than they would after longer fallows and are able
to use land for a longer period after longer fallows.
WHAT DO PERI-URBAN FARMERS KNOW ABOUT INORGANIC FERTILIZER?
Farmers in peri-urban Kumasi use inorganic fertilizers for the commercial production of vegetables, rice
and occasionally maize for cash sale. They have also been taught by extension agents about using
fertilizer on plantain, and have experimented with this.
FARMERS ’ KNOWLEDGE OF THE USE OF INORGANIC FERTILIZER
i.
ii.
iii.
iv.
v.
Load or select the peri-urban kumasi kb.
Go to Kb → Topic hierarchies…
Select ‘Soil fertility management’ from the menu on the left.
On the right, under ‘Topics in hierarchy’ select ‘Inorganic fertilizer’
Click on Topic Statements. Browse all the statements about farmers knowledge of
inorganic fertilizers.
Looking through the statements it becomes apparent that farmers have knowledge of the following
subjects:
1. Type of fertilizer
The two main types of fertilizer readily available at the time of the research were compound
fertilizer 15:15:15 NPK and sulphate of ammonia (referred to as ‘ammonia’). Ammonia is used for
top dressing rice and at flower set stage of garden egg and other vegetables. A number of other
fertilizers are available in Kumasi e.g. Phostrogen, but knowledge of these was not expressed by the
interviewees.
101: application of ammonia causes the rice leaves colour is green
118: application of ammonia causes an increase in amount of setting of garden_egg flowers
166: application of ammonia causes an increase in size of fruit
168: the application of ammonia amount is excess causes rotting of fruit
220: the duration_of_work of compound_fertilizer is greater_than ammonia
2. Application of fertilizer
Only farmers who had used fertilizer could talk about application rates. These were generally
dictated by what farmers could afford at the time of fertilizer purchase, by their own
experimentation and by the appearance of the crop (e.g. yellow leaves) and farmers’ perception of
the initial fertility of the soil. Farmers frequently could not specify how much fertilizer they used.
Work done in the Brong Ahafo region found that vegetable farmers’ practices were highly variable
with some farmers applying recommended rates, others applying far more than recommended rates
1
and others applying far less (Awiti et al., 2000 ). Nevertheless farmers in peri-urban Kumasi were
aware of the dangers of using too much fertilizer or applying it without water:
93: the application of inorganic_fertilizer amount is excess causes go_to_seed of cabbage
120: the application of inorganic_fertilizer amount is excess causes crumbling of crop leaves
1
Awiti, S., Binney, K., Chan, M.K., O’Connell, N., Jackson, D., Kiff, E., and Nelson D., 2000 Improved Vegetable Production in
the Forest -Savanna Transition Zone, Ghana with special reference to the maintenance of soil fertility. Natural Resources
Institute, University of Greenwich/ Ministry of Food and Agriculture, Brong Ahafo region, Ghana.
168: the application of ammonia amount is excess causes rotting of fruit
136: application of inorganic_fertilizer causes death of crop if no_rainfall
105: application of inorganic_fertilizer causes the crop leaves colour is yellow_with_black_spots if no_rainfall
3. Crop growth
42: the soil fertility is infertile causes the growth of crop amount is stunted if no_application of
inorganic_fertilizer
60: application of inorganic_fertilizer causes the crop leaves colour is green if the crop leaves colour is yellow
61: application of inorganic_fertilizer causes the growth of crop amount is good if rainfall
82: application of inorganic_fertilizer causes the growth of crop rate is very_fast
101: application of ammonia causes the rice leaves colour is green
119: application of inorganic_fertilizer causes an increase in amount of spreading of crop
4. Yield
62: application inorganic_fertilizer vegetables causes the fruit size is big
72: application of inorganic_fertilizer causes an increase in yield of crop
81: application of inorganic_fertilizer causes an increase in number of plantain suckers
85: application of inorganic_fertilizer causes an increase in size of plantain finger
86: application of inorganic_fertilizer causes an increase in size of maize cob
166: application of ammonia causes an increase in size of fruit
With regards to crop yield farmers emphasized the size of vegetables and maize cobs rather than the
overall quantity harvested (which is more difficult to calculate), except in the case of plantain
suckers which form a source of income through sale to other farmers.
5. Palatability of tubers and vegetables
167: application of inorganic_fertilizer causes
187: application of inorganic_fertilizer causes
202: application of inorganic_fertilizer causes
188: application of inorganic_fertilizer causes
a decrease in palatability of vegetables
a decrease in palatability of cassava
a decrease in palatability of plantain
a decrease in palatability of cocoyam
Farmers recognized that fertilizer application decreased the palatability of tubers and vegetables.
This is best known in the case of cassava where fertilizer application affects the quality of the
cassava for fufu.
6. Vegetable shelf life
83: application of inorganic_fertilizer causes a decrease in shelf_life of garden_egg fruit
94: application of inorganic_fertilizer causes a decrease in shelf_life of cabbage
7. Other factors
Farmers are also aware that using fertilizer influences the effect of pest attacks:
172: application of inorganic_fertilizer causes a decrease in amount of plantain base damage termites
174: application of inorganic_fertilizer causes the soil temperature is cool
The final statement 174 illustrates farmers’ use of terminology for talking about productive soil.
Farmers associate soil that is good for plant growth with soil that has a high organic matter content
which is thus cool in temperature. This way of referring to soil as ‘cool’ is hence transferred to soil
that is good for plant growth because fertilizer has been applied.
vi.
Diagram representing statements from the topic: Poultry manure (the nodes have been rearranged
by dragging them around the diagram)
To view all the causal statements on a diagram click on All Statements. You can
rearrange the diagram by dragging the nodes (boxes) around. Alternatively go to
Diagram → Show Kb Diagrams, select ‘120’ ‘Inorganic fertilizer’ and click on Select.
Diagram representing statements from the topic: Inorganic fertilizer (the nodes have been
rearranged by dragging them around the diagram)
SUMMING UP
•
•
•
•
vii.
When you have finished, hide your diagram by going to Diagram → Hide Diagrams.
Close all open dialogue boxes and return to the main menu. Then follow the same
procedures for the topic ‘Poultry manure’.
•
Farmers in peri-urban Kumasi use inorganic fertilizers on cash crops.
Quantities applied are dependent on the fertility of the soil, farmers’ cash constraints, information
from other farmers and extension agents, and their own experiments with different quantities.
Farmers emphasise the size of fruit when referring to the effect of the fertilizer on crop yield.
They are unlikely to apply fertilizer to root crops such as cassava and cocoyam because they
perceive a decrease in palatability as a result of doing so. Poultry manure is however, considered to
have a lesser effect on palatability. Farmers are satisfied with the use of fertilizer on plantain but
cannot justify the cost of application over large areas.
Farmers remain unaware of potential long term negative effects of continued use of inorganic
fertilizers on soil structure or acidity but they have some perception that fertilizer can influence the
effect of pest attacks.
TECHNOLOGY CHOICE TOOL
This tool brings together information about livelihoods and technologies to facilitate the choice of
appropriate technologies based on farmers’ circumstances. It can be used in two ways:
1. Technology to target group: given a particular technology , the tool can be used to suggest a
target group of farmers for whom it is suitable
2. Target group to technologies: given a particular target group, it can be used to produce a set of
criteria which an appropriate technology must fulfil.
Where the necessary statistics are available the tool can be used to help prioritise research work by
providing information on the size of a potential target group for a particular technology.
The tool can also be used to produce a list of additional requirements that must be met if a technology is
to be adopted by a particular target group. E.g. using a mucuna cover crop to raise maize yields by 50% in
the Brong Ahafo region may only provide sufficiently substantial cash benefits to be adopted if farmers
are able to store the maize and wait until the price rises before selling it. This is likely to require sufficient
control over cash flow to prevent the necessity of selling early and additionally, adequate storage
technology to minimise post harvest losses.
METHOD 1: TECHNOLOGY TO TARGET GROUP
1. Identify the technology
2. Identify the target area e.g. the forest and transition zones of Ghana
3. List all the different criteria to disaggregate the people within the target area. Our work suggests
that location, gender, age, ethnic group, origin (which frequently influences the terms of access to
land) and marital status (which influences the degree of independency or dependency of a person
and the roles they must fulfil) are all relevant to livelihood strategies and opportunities for the
uptake of new technologies. Wealth is also likely to be an important factor.
4. Consider the following questions in relation to the technology you have chosen and fill in the table
that follows them.
Factors that influence farmers’ ability to adopt a technology
Crops and cropping patterns (1)
•
Which crops and cropping patterns that are practiced within the community is your chosen technology
suitable for, which is it unsuitable for?
• What modifications would be neces sary to current cropping patterns to enable farmers to adopt the
technology?
Inputs
• What inputs (organic or inorganic) are required for the technology you have chosen?
• Can they be obtained, whether freely or for sale?
• Are there any other requirements whic h must be met to obtain the input e.g. in terms of organisation,
personal contacts, travel, transportation of the input to the farm. How many visits are required by the
farmer before the input is obtained?
Labour availability
• What additional labour is required for the technology?
• When is it necessary?
• Is labour available at this time?
Capital availability
• How much capital is required to finance the use of this technology in terms of:
• Cost of inputs
• Costs associated with obtaining inputs e.g. cost of transport to purchase inputs, cost of
transportation of inputs to the farm
• Cost of additional labour required to use the technology
Cash flow
• When is cash necessary for the technology?
• Is cash available at this time? (Cash flow may be represented on a seasonal calendar, together with
labour requirements and marketing of the crop).
Land type and soil fertility
• What type of land or soil is necessary for the technology to produce effective results? (E.g. some
technologies will only produce significant yield in creases on poor soil).
Marketing of produce
• Will farmers be marketing a new crop? If so, is a ready market available? If it is not, will farmers be
willing and able to market the crop themselves? (I.e. will they be able to transport the crop to market,
and what will the transaction costs be?)
• Does practising the technology change the harvesting date? If so, what influence does this have on
farmers’ ability to market the crop, and the returns that they receive from it? (I.e. are buyers available
at this time? Is the market price for the crop more, less, or the same as if the crop were harvested at
the original time?)
Tenure conditions
• What tenure conditions are necessary to practice the technology?
Farmers’ knowledge
• What are the minimum knowledge or training requirements for the technology to be effective?
• What do farmers already know about the technology or the principles behind it?
• Do they have any additional knowledge that will influence their willingness or ability to practise it?
Other beliefs
• Do farmers hold any beliefs that would influence their readiness to accept your chosen technology e.g.
the belief that animal manure is dirty?
Farm management
• What are the management requirements of the technology, over and above any changes in labour
requirements? I.e. is constant vigilance and frequent trips to view the farm required? Is precise timing
of management actions required or is the timing of management actions flexible? Are farmers able to
provide sufficient management for the technology to be effective?
Factors that influence the effectiveness of a technology
Marketing issues
• Will farmers benefit from storing the crop and selling it at a later date in conjunction with using the
soil fertility management technology? If so, do farmers have adequate knowledge of post harvest
storage technology to minimize losses? Do they have the materials (storage facilities and other inputs
such as chemicals) to store the crop? Are they able to manage their cash flow situation sufficiently in
order not to need cash at an earlier date and so to sell early?
Capital returns
• Does the technology increase or reduce capital costs?
Changes in labour
• Overall i.e. considering several cropping seasons and at a household level, do labour requirements
change as a result of using the technology? If so, is there an overall increase or a decrease in the
amount of labour required?
• At an individual level, who is likely to pay for, or to perform additional labour associated with the
technology?
• Who is likely to benefit from reduced labour requirements associated with the technology?
Crops and cropping patterns (2)
• Having considered all of the above factors, reconsider again which crops and cropping patterns the
technology is suitable for.
Factors
Requirement
a
Ability of different groups of farmers to satisfy requirements
b
c
d
e
f
Requirements influencing farmers’ ability to adopt the technology
Target crops (1)
Cropping
patterns (1)
Inputs
Labour
availability
Capital
availability
Cash flow
Land type and
soil fertility
Marketing of
produce
Tenure
conditions
Farmers’
knowledge
Other beliefs
Farm
management
Factors that influence the effectiveness of a technology
Marketing issues
Capital returns
Changes in
labour
Target crops (2)
Cropping
patterns (2)
5. How do the factors outlined in 4 affect the ability of the different groups of farmers identified in 3 to adopt the specified technology? Put the names of the
different groups of farmers into the table (top, right). Then, using the appropriate columns, indicate which groups are able to satisfy the requirements of
the technology.
g
Example 1: Use of poultry manure as a substitute for inorganic fertiliser in commercial vegetable production
Technology: poultry manure for commercial vegetable production
Target group: farmers at Subriso No. 3 in Tano district, Brong Ahafo region
Factors
Requirement
Older settler men
Requirements influencing farmers’ ability to adopt the technology
Target crops (1)
Commercial vegetable production
Cropping patterns (1)
Any1
Inputs
Poultry manure2
Labour availability
Labour for transportation of manure and incorporation
Capital availability
Cash for transportation of manure and additional labour
costs
Cash flow
Cash required prior to planting of vegetables (2 main
seasons at Subriso)
Land type and soil
Any3
fertility
Marketing of
No additional requirements4
produce
Tenure conditions
Any
5
Farmers’ knowledge
Some
6
Other beliefs
Some
7
Farm management
Some
Factors that influence the effectiveness of a technology
Marketing issues
None
Capital returns
Reduction in costs8
Changes in labour
Small increase
Target crops (2)
Vegetables
Cropping patterns (2)
Any
1
Ability of different groups of farmers to satisfy requirements
Older settler women
Younger settler men
Younger settler women
+
-
-
-
+
+
-
+
+
-
+
+
+
+
+
+
+
+
+
+
+
+
+
-
-
-
A second crop may benefit from residual effects but the influence on the vegetable crop is more likely to persuade farmers to adopt the technology.
There is one intensive poultry farm in the district but it is at a distance of over 40km from Subriso.
3
As fertiliser is used with benefits on all soils the situation with poultry manure is likely to be similar.
4
Increases in yield are not expected by replacing inorganic fertiliser with poultry manure.
5
Time for manure to decompose, rate and method of application.
6
Manure is considered to be dirty and using it is considered an old-fashioned practice.
7
Some organisation is necessary to transport the manure prior to the time of cropping. Commercial vegetable farming, particularly tomato already has high management requirements and so this
not likely to be a problem for current producers.
8
Capital requirements for transportation of manure are less than for fertiliser.
2
This technology has a relatively simple specification, and is already targeted fairly narrowly to commercial
vegetable producers. Therefore the target group and the factors that will influence uptake are fairly clear.
Commercial vegetable producers are predominantly men – with more young men than older men engaged in
production.
The main constraint to adoption of the technology is that poultry manure is not available near Subriso. If
poultry manure, or a suitable alternative were availab le then additional considerations would have to be
made.
Some additional organisation and labour would be required on the part of farmers to obtain manure, allow
time for decomposition prior to use and for application. Farmers are more likely to undertake these if use of
the manure is effective in reducing capital costs for the purchase of fertiliser. This is likely to depend on the
costs involved in obtaining the manure. Some knowledge of how to use poultry manure is also required
although the technology is relatively simple. Awareness raising would be required to demonstrate its
relevance and to help overcome traditional prejudices against the use of animal manure.
Example 2: Clearing without burning
Technology: clearing fallow land without burning.
There are two options for this technology. For the first option (1) land is cleared manually and crops are planted through the trash. For the second option (2) herbicide is used and crops are again
planted through the trash.
Target group: farmers within the peri-urban area of Kumasi
Factors
Requirement
Ability of different groups of farmers to satisfy requirements
Older men
Older women
Younger men
Younger women
Requirements influencing farmers’ ability to adopt the technology
Target crops (1)
1: any
2: any
Cropping patterns (1)
1: any
9
2: any
Inputs
1: none
+
+
+
+
10
2: herbicide
+
+
+
+
Labour availability
1: none
+
+
+
+
2: labour for spraying of herbicide during land preparation
+
+
Capital availability
1: none
+
+
+
+
2: capital for herbicide and spraying equipment
+
+
Cash flow
1: none
+
+
+
+
2: cash required during land preparation
+
+
+
+
Land type and soil
1: secondary forest fallows without persistent weeds
11
fertility
2: fallows dominated by grasses or Chromolaena odorata
+
+
+
+
Marketing of
1: none
produce
2: none
Tenure conditions
1: none
2: none
Farmers’ knowledge
1: some
12
2: some
+
+
Other beliefs
1: none
2: none
9
Mulching may provide more effective results in the dry season due to conservation of soil moisture.
Herbicide can be purchased in the central market in Kumasi.
11
If land is not burnt and no herbicide is applied land with persistent weeds such as Panicum maximum and Chromolaena odorata will become very weedy during cropping thus increasing
weeding requirements. Herbicide use is suitable for shorter fallows with more persistent weeds such as Panicum maximum or Chromolaena odorata so that (a) the quantity of vegetation does not
impede farm work and (b) the cost of herbicide is likely to be less than the cost of repeated manual weeding.
12
Farmers know mulching and the decomposition of plant matter increases the fertility of the soil and that burning has both positive and negative effects on the farm including aiding the
sprouting of cocoyam. They consider mulching instead of burning to be suitable for plantain, which is not damaged by movement around the a farm littered with tree branches and other debris,
unlike crops such as maize. Farmers believe herbicide also acts like fertiliser. They need to know the rate and method and timing of application of herbicide. This is taught by extension agents
and therefore, in the first instance, is more likely to be known by men than women.
10
Farm management
1: none
2: timing of clearing and application of herbicide
Factors that influence the effectiveness of a technology
Marketing issues
1: none
2: none
Capital returns
1: variable
13
2: potential increase
Changes in labour
1: variable
14
2: potential decrease
Target crops (2)
1: plantain
2: commercial vegetable, maize and rice production
Cropping patterns (2)
1: sole cropping
2: any
+
+
+
+
+
+
+
+
+
+
+
-
+
+
+
-
This technology has two variations and two target groups:
1. Without herbicide: weeds are likely to be a significant problem if herbicide is not used, particularly on shorter fallows. On longer fallows, which have lesser weeding requirements and
in conjunction with the mulching of vegetation debris, plantain and other perennial crops can be grown that are not damaged by the tree branches and other debris left on the farm.
However long fallows are very rarely found in the peri- urban Kumasi area and plantain does not thrive on shorter fallows in this area. Therefore this is not an option for farmers.
2. With herbicide: after short fallows where smaller amounts of biomass have been produced any crops can be grown and access to the farm is not impeded. However cash crops can better
justify purchase of the herbicide. Where use of herbicide is effective in weed control, weeding or expenditure on weeding may be reduced. These circumstances are most applicable to
vegetable, rice and green maize farmers where there is intense pressure on lowlands and valley bottoms. Cash returns with use on lower value cash crops such as upland maize would
need to be calculated to suggest further suitability.
13
1: Where fallows are long and weeds are few yields may remain the same or increase, but if further expenditure is incurred on weeding requirements returns are likely to decrease.
2: Effective herbicide use may reduce cash required for weeding. With low sales of farm produce herbicide is likely to reduce cash returns. It is therefore more likely to be used for commercial
vegetable, maize and rice production.
14
See previous footnote.
METHOD 2: TARGET GROUP TO TECHNOLOGY
1. Identify the target group of farmers.
2. Consider how the following issues offer opportunities and constraints to the target group.
Factors that influence farmers’ ability to adopt a technology
Crops and cropping patterns
• Which crops are grown by farmers?
• How would farmers benefit by improving soil fertility for these crops? (E.g. in terms of increased
cash income, food security, or better cash flow).
• What cropping patterns are followed?
Inputs
• What inputs (organic or inorganic) are available for your chosen farmers?
Labour availability
• What labour sources are available to these farmers (own labour, family, hired, shared etc.)?
• When is labour most available and least available?
Capital availability
• What level of capital do farmers have available to invest in soil fertility management?
Cash flow
• When is cash flow good, and when is it poor?
• When do farmers need to improve cash flow?
Land type and soil fertility
• What type of land or soil is available to farmers? What is not available?
Marketing of produce
• What are farmers’ marketing opportunities in terms of different commodities and the time of year?
What are the marketing constraints?
Tenure conditions
• What are farmers’ terms of access for different types of land or different crops? How long do farmers
have secure tenure for? Are there any restrictions on how they can cultivate land? Do they feel that
land may be taken away from them if they make some visible improvements to soil fertility?
Farmers’ knowledge
• What are farmers’ sources of knowledge?
• What do farmers already know about soil fertility management – about particular technologies or
principles behind soil fertility management in general?
Other beliefs
• Do farmers hold any beliefs that would influence their readiness to accept a new technology e.g. the
belief that animal manure is dirty?
Farm management
• What level of management are farmers able to provide for individual farms? Are they able to visit the
farm frequently to monitor crop development? Are they able to carry out management actions such as
weeding, at precise times? Are they able to provide adequate supervision of hired labour?
3. Fill in the following table using your responses to the questions above.
A suitable technology specification is one that uses stated opportunities but does not aggravate
constraints.
Sometimes constraints which pose problems in terms of farmer uptake of a technology can be
res olved by offering additional technologies e.g. the provision of credit facilities may enable farmers
to invest in a technology that they would not otherwise be able to. These are potential interventions
where a more coordinated approach to technology development or dissemination is necessary.
Factors
Target crops
Cropping
patterns
Inputs
Labour
availability
Capital
availability
Cash flow
Land type and
soil fertility
Marketing of
produce
Tenure
conditions
Farmers’
knowledge
Other beliefs
Farm
management
Opportunities
Constraints
Example 3: Soil fertility management technologies for young men at Oda in the Wassa Amenfi district
Target group : young male Wassa farmers at Oda in the Wassa Amenfi district
Factors
Target crops
Cropping
patterns
Inputs
Labour
availability
Capital
availability
Cash flow
Land type and
soil fertility
Marketing of
produce
Tenure
conditions
Farmers’
knowledge
Other beliefs
Farm
management
Opportunities
Cocoa and oil palm – especially young trees
Short term cash crops (maize, cowpea, cassava)
Plantain, cocoyam, vegetables for home consumption
Mixed cropping during the establishment of cocoa with plantain, cocoyam, cassava,
maize and vegetables
Maize/cowpea rotation
Maize/cassava intercrop
Sole cropping of cassava, maize
Formal agroforestry – food crops with oil palm or kola nut and timber trees
Inorganic fertiliser
Small quantities of sheep and goat manure
Sources: own and wife
Most hired labour available: April and June
High availability: August to December
Land with a short fallow and some swampy areas
Gari processing from cassava
Cowpea
Secure tenure on inherited land
Agroforestry project land: trees must be planted
There are many resource persons available in the village
Very young under-employed farmers have ample time for good farm management.
Constraints
Large quantities of manure
Sources: not able to purchase labour or mobilise other family labour
Least hired labour available: November to December
Limited
Low availability: January to July
Least available: May to July
Not able to obtain large areas of land with a long fallow
Poor market links for sale of vegetables
Infrequent visits from extension agent
Manure is perceived as dirty
Farmers who are a little older with a larger number of parcels and who
also do agricultural wage labour are busier.