1
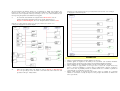
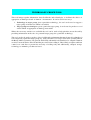
LIVELIHOOD AND LAND USE DIAGRAMS
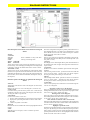
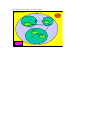
Livelihood and land use diagrams synthesise information about income generating activities and the use
of land and other resources by different groups of people within a community. They are intended to be
used as part of a Participatory Rural Appraisal exercise.
Participatory Rural Appraisal is a valuable tool that is used both to obtain information and to empower
individuals and communities through involving local people in the process of problem definition, data
collection, decision making and implementation. However the focus of this tool is less on empowerment,
and more on collecting and organising data, and ensuring that the data collected represents the different
social groups in the community.
PRA exercises are frequently time consuming and often resource intensive where locations are remote.
They result in large amounts of information, which require an equal effort to analyse. Researchers can
embark on PRAs without a sufficiently well defined problem or set of q uestions and many PRAs do not
address issues of social relations, the exclusion of particular social groups and gender (Slocum et al.,
1998)1.
It is therefore the intention to provide a tool which:
• Helps researchers maximise the use of existing information, whether it is contained in reports and
other documents or is the personal knowledge of local researchers and therefore makes information
gathering more cost effective
• Helps to bring greater definition to problems and questions for PRA exercises to answer. It helps
researchers to organise existing information. This leads to the identification of gaps in existing
knowledge that need to be filled through further targeted research
• Focuses on the analysis of information according to gender and other social classes so that different
social groups are not excluded.
The focus of the diagrams is land use by both individuals and households. The following factors are
relevant to the natural resource based livelihood strategies of individuals:
• land use
• access to land
• labour
• other income generating activities.
However the information represented can be tailored to the purpose for which the diagram is being drawn.
For example research with an agricultural remit will concentrate more on cropping patterns whereas
research on the use of forest resources would concentrate more on forest land use. Current definitions of
livelihoods are acknowledged (Carney, 19982 ) and the diagrams are flexible enough to include other
capabilities, assets and activities relevant to the livelihoods of individuals or households. The diagrams
represent best, land use and income generating activities of individuals and other ways of representing
e.g. relationships between different social groups with the community or capturing the dynamic nature of
livelihoods, can be used alongside them.
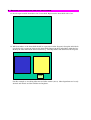
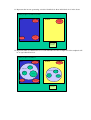
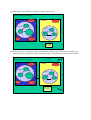
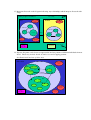
The instructions for drawing the diagrams now follow. As you go through the instructions you should
make a list of the information that you do not have or that you are unsure of. In this way you will be able
to target any further research to fill in missing the data.
1
Slocum R., Wichhart Lori., Rocheleau D., and Thomas-Slayter B. (1998) Power, process and participation – tools for change.
Intermediate Technology Publications. London, UK.
2
Carney D., (1998) Implementing the sustainable rural livelihoods approach in D. Carney (ed.) Sustainable Rural Livelihoods:
What contribution can we make? Pp 3 – 26. Department of International Development, London, UK.