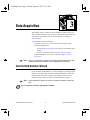
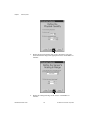
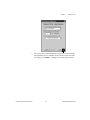
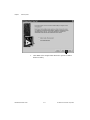
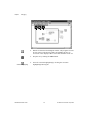
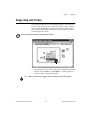
1
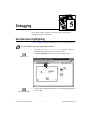
LabVIEW®
QuickStart Guide
LabVIEW QuickStart Guide
May 1997 Edition
Part Number 321527A-01
© Copyright 1997 National Instruments Corporation. All rights reserved.
Conventions Used in This Manual
The following conventions are used in this manual:
bold
Bold text denotes a menu name, palette name, menu item, or dialog box button or
option. Bold text also denotes a tip.
italic
Italic text denotes a glossary term or a cross reference.
bold italic
Bold italic text denotes a note.
monospace Text in this font denotes text or characters that you should literally enter from the
keyboard. This font also is used for the proper names of disk drives, paths,
directories, programs, filenames, and extensions.
Copyright
Under the copyright laws, this publication may not be reproduced or transmitted
in any form, electronic or mechanical, including photocopying, recording, storing
in an information retrieval system, or translating, in whole or in part, without the
prior written consent of National Instruments Corporation.
Trademarks
®
®
LabVIEW , NI-DAQ , National Instruments™, and natinst.com™ are trademarks
of National Instruments Corporation.
Product and company names listed are trademarks or trade names of their
respective companies
Internet
E-mail: [email protected]
FTP Site: ftp.natinst.com
Web Address: http://www.natinst.com
International
Australia 02 9874 4100, Austria 0662 45 79 90 0, Belgium 02 757 00 20,
Canada (Ontario) 905 785 0085, Canada (Québec) 514 694 8521, Denmark 45 76 26 00,
Finland 09 527 2321, France 01 48 14 24 24, Germany 089 741 31 30, Hong Kong 2645 3186,
Israel 03 5734815, Italy 06 5729961, Japan 03 5472 2970, Korea 02 596 7456,
Mexico 5 520 2635, Netherlands 31 348 43 34 66, Norway 32 84 84 00, Singapore 2265886,
Spain 91 640 0085, Sweden 08 730 49 70, Switzerland 056 200 51 51, Taiwan 02 377 1200,
U.K. 01635 523545
National Instruments Corporate Headquarters
6504 Bridge Point Parkway Austin, TX 78730-5039 Tel: (512) 794-0100 Fax: (512) 794-8411
Contents
Chapter 1
Introduction to LabVIEW
What Is LabVIEW? .........................................................................................................1-1
Why Should I Use LabVIEW? ........................................................................................1-3
How Does LabVIEW Work? ...........................................................................................1-4
Front Panel.........................................................................................................1-4
Block Diagram...................................................................................................1-5
Palettes...............................................................................................................1-6
Tools Palette........................................................................................1-6
Controls Palette ...................................................................................1-6
Functions Palette .................................................................................1-7
Data Flow ..........................................................................................................1-7
Where Do I Start? ............................................................................................................1-8
Online Tutorial ..................................................................................................1-8
Chapter 2
Virtual Instruments
Search for Examples ........................................................................................................2-1
Build a Virtual Instrument ...............................................................................................2-4
Create a User Interface ......................................................................................2-4
Build the Block Diagram...................................................................................2-8
Wire and Run Your VI ......................................................................................2-10
Add Timing to Your VI.....................................................................................2-12
Add Analysis and File I/O to Your VI ..............................................................2-14
Chapter 3
Data Acquisition
Use the DAQ Solution Wizard ........................................................................................3-1
Configure Your Analog Input Channel .............................................................3-2
Generate a Solution from the Common Solutions Gallery................................3-9
Add Analog Input to Your VI..........................................................................................3-14
© National Instruments Corporation
iii
LabVIEW QuickStart Guide
Contents
Chapter 4
Instrumentation
Instrument I/0 .................................................................................................................. 4-1
Use an Instrument Driver ................................................................................................ 4-2
Run the Demo Scope VI.................................................................................................. 4-6
Chapter 5
Debugging
Use Execution Highlighting ............................................................................................ 5-1
Single-Step with Probes .................................................................................................. 5-3
Chapter 6
Where To Go From Here
Online Help ..................................................................................................................... 6-1
Show Help......................................................................................................... 6-2
National Instruments’ Commitment to You .................................................................... 6-3
Customer Education .......................................................................................... 6-3
Alliance Program .............................................................................................. 6-3
Technical Support ............................................................................................. 6-3
Appendix
Installation Instructions
Required System Configuration ...................................................................................... A-1
Installation Procedures .................................................................................................... A-1
Glossary
LabVIEW QuickStart Guide
iv
© National Instruments Corporation
Chapter
Introduction to LabVIEW
1
This chapter provides an overview of the LabVIEW development
environment.
For information about system configuration requirements, or
installation instructions, see the appendix, Installation Instructions.
What Is LabVIEW?
Italicized text denotes
a glossary term.
LabVIEW (Laboratory Virtual Instrument Engineering Workbench) is a
development environment based on the graphical programming
language G. LabVIEW is fully integrated for communication with
hardware such as GPIB, VXI, RS-232, RS-485, and plug-in data
acquisition boards. LabVIEW also has built-in libraries for using
software standards such as TCP/IP Networking and OLE Automation.
Using LabVIEW, you can create 32-bit compiled programs that give
you the fast execution speeds needed for custom data acquisition, test,
and measurement solutions. You also can create stand-alone
executables because LabVIEW is a true 32-bit compiler.
You can use LabVIEW with little programming experience. LabVIEW
uses terminology, icons, and ideas familiar to technicians, scientists,
and engineers, and relies on graphical symbols rather than textual
language to describe programming actions.
© National Instruments Corporation
1-1
LabVIEW QuickStart Guide
Chapter 1
Introduction to LabVIEW
Programs in LabVIEW for real-world applications can vary from the
simple to the powerful, as illustrated in the following graphic.
LabVIEW contains comprehensive libraries for data collection,
analysis, presentation, and storage. LabVIEW also includes traditional
program development tools. You can set breakpoints, animate program
execution to see how the program executes, and single-step through the
program to make debugging and program development easier.
LabVIEW also provides numerous mechanisms for connecting to
external code or software through DLLs, shared libraries, OLE
Automation, and more. In addition, numerous add-on toolkits are
available for a variety of application needs.
LabVIEW QuickStart Guide
1-2
© National Instruments Corporation
Chapter 1
Introduction to LabVIEW
Why Should I Use LabVIEW?
LabVIEW empowers you to build your own solutions for scientific and
engineering systems. LabVIEW gives you the flexibility and
performance of a powerful programming language without the
associated difficulty and complexity.
LabVIEW has given thousands of successful users a faster way to
program instrumentation and data acquisition systems. By using
LabVIEW to prototype, design, test, and implement your instrument
systems, you can reduce system development time and increase
productivity by a factor of 4 to 10.
LabVIEW also gives you the benefits of a large installed user base,
years of product feedback, and powerful add-on tools. Finally,
National Instruments support services and user network ensure the
successful development of your solutions.
© National Instruments Corporation
1-3
LabVIEW QuickStart Guide
Chapter 1
Introduction to LabVIEW
How Does LabVIEW Work?
All LabVIEW programs, or virtual instruments (VIs), have a front
panel and a block diagram. The palettes in LabVIEW contain the
options you use to create and modify your VI. This section overviews
the LabVIEW front panel, block diagram, and palettes. It also explains
the dataflow model for program execution that LabVIEW follows.
Front Panel
The front panel is the graphical user interface of your LabVIEW VI.
This interface collects user input and displays program output. The
front panel can contain knobs, push buttons, graphs, and more.
1
2
1.
LabVIEW QuickStart Guide
A control (input).
1-4
2. An indicator (output).
© National Instruments Corporation
Chapter 1
Introduction to LabVIEW
Block Diagram
The block diagram contains the graphical source code of your VI. In the
block diagram, you program your VI to control and perform functions
on the inputs and outputs you created on the front panel.
The block diagram can include functions and structures from the
built-in LabVIEW VI libraries. It also can include terminals that are
associated with controls and indicators created on the front panel.
1
3
3
2
1.
A function.
3.
Terminals from the front panel.
© National Instruments Corporation
2.
1-5
A structure.
LabVIEW QuickStart Guide
Chapter 1
Introduction to LabVIEW
Palettes
LabVIEW palettes give you the options you need to create and edit your
front panel and block diagram.
Tools Palette
You use the Tools palette in both the front panel and the block diagram.
The Tools palette contains the tools you use to edit and debug front
panel and block diagram objects.
Controls Palette
You use the Controls palette in the front panel. The Controls palette
contains the front panel controls and indicators you use to create the
user interface.
LabVIEW QuickStart Guide
1-6
© National Instruments Corporation
Chapter 1
Introduction to LabVIEW
Functions Palette
You use the Functions palette in the block diagram. The Functions
palette contains the objects you use to program your VI, such as
arithmetic, instrument I/O, file I/O, and data acquisition operations.
Data Flow
LabVIEW VIs follow a dataflow model for program execution. The
block diagram consists of nodes such as VIs, structures, and terminals
from the front panel. These nodes are connected by wires, which define
the flow of data through the program. The execution of a node occurs
when all its inputs are available. When a node finishes executing, it
releases all its outputs to the next node in the dataflow path.
1
2
3
© National Instruments Corporation
1-7
LabVIEW QuickStart Guide
Chapter 1
Introduction to LabVIEW
Where Do I Start?
If you are new to LabVIEW, the LabVIEW Online Tutorial and the
LabVIEW QuickStart Guide help you get started quickly. The LabVIEW
Online Tutorial introduces you to the LabVIEW environment. The
QuickStart Guide teaches you how to build VIs for data acquisition and
instrument control and how to debug these VIs. It also teaches you how
to use the Search Examples feature and the DAQ Solution Wizard.
12
9
3
You can complete the activities in this book in approximately 90 minutes.
6
Online Tutorial
To learn about the LabVIEW environment, first launch the LabVIEW
Online Tutorial from the LabVIEW dialog box.
12
9
3
You can complete the online tutorial in approximately 15 minutes.
6
After you finish the Online Tutorial, continue with the activities in the
QuickStart Guide to learn how to build LabVIEW programs for data
acquisition and instrument control.
You should complete the activities in this book in the order in which
they appear, because subsequent activities build upon the sample
programs you will create. Approximate completion times are given for
each activity and each section within an activity.
LabVIEW QuickStart Guide
1-8
© National Instruments Corporation
Chapter
2
Virtual Instruments
This chapter teaches you step-by-step how to create an application in
LabVIEW. It also guides you through the Search Examples feature to
help you find examples in LabVIEW.
You will learn to do the following:
•
Use the Search Examples feature to find and run an example
•
Create a new program in LabVIEW
–
The VI you build generates data, analyzes it, then writes it to a
file.
Search for Examples
After viewing the Online Tutorial, you are ready to run some examples
in LabVIEW.
12
9
3
You can complete this activity in approximately 5 minutes.
6
1
1.
© National Instruments Corporation
Click Search Examples to see a listing of LabVIEW examples.
2-1
LabVIEW QuickStart Guide
Chapter 2
Virtual Instruments
2
2.
Click Analysis in the Demonstrations category.
3
3.
LabVIEW QuickStart Guide
Click Temperature System Demo to open this demonstration VI.
2-2
© National Instruments Corporation
Chapter 2
Virtual Instruments
4
6
4.
Click the Run button on the front panel toolbar to see the how a
LabVIEW VI runs.
5.
Click the sliders, knobs, and other controls to see how they affect
the data.
6.
Stop the program by clicking the Acquisition switch to the off
position.
Run
© National Instruments Corporation
2-3
LabVIEW QuickStart Guide
Chapter 2
Virtual Instruments
Build a Virtual Instrument
This activity demonstrates how simple it is to chart, analyze, and save
data in LabVIEW.
12
9
3
You can complete this activity in approximately 30 minutes.
6
Create a User Interface
You can create a graphical user interface on the front panel using
controls and indicators from the Controls palette.
12
9
3
You can complete this section in approximately 5 minutes.
6
1
1.
LabVIEW QuickStart Guide
Create a new VI by selecting New VI in the LabVIEW dialog box.
2-4
© National Instruments Corporation
Chapter 2
Virtual Instruments
2
2.
Tips
On the new front panel, choose Edit»Select Palette Set»basic.
The » symbol leads you through nested menu and palette items to a final
action. The sequence Edit»Select Palette Set»basic directs you to open the
Edit menu, click Select Palette Set, and finally choose basic as your
palette.
The basic palette you select for this activity is a small subset of the
LabVIEW libraries. You can select the default palette to view the entire
functionality of LabVIEW.
© National Instruments Corporation
2-5
LabVIEW QuickStart Guide
Chapter 2
Virtual Instruments
5
4
3
Tip
3.
Select Vertical Toggle Switch from the Controls»Boolean
subpalette. Select icons from the palette in the same way you select
items from a menu.
4.
Move your pointer into the front panel and click to place the toggle
switch on the front panel.
5.
Type Power into the label for the toggle switch. If the label
disappears, choose Show Label from the pop-up menu on the toggle
switch. To access the pop-up menu, right-click on the toggle switch
(on the Macintosh, command-click on the toggle switch).
To rearrange or resize objects and wires, use the Positioning tool from the
Tools palette.
Positioning tool
LabVIEW QuickStart Guide
2-6
© National Instruments Corporation
Chapter 2
Virtual Instruments
8
7
6
6.
Create a waveform chart by selecting Controls»Graph»
Waveform Chart. This chart plots data one point at a time.
7.
Place the chart on the front panel and label it Random Plot.
8.
To change the scale of the waveform chart, select the Operating
tool from the Tools palette. If the Tools palette is not visible, select
Windows»Show Tools Palette. Double-click 10.0 on the Y axis of
the Random Plot indicator and enter 1.0.
Operating tool
© National Instruments Corporation
2-7
LabVIEW QuickStart Guide
Chapter 2
Virtual Instruments
Build the Block Diagram
Now you can create the source code in the block diagram of your VI.
12
9
3
You can complete this section in approximately 5 minutes.
6
1.
Go to the block diagram by choosing Show Diagram from the
Windows menu or clicking in the block diagram window. The two
terminals on the block diagram correspond to the Power toggle
switch and the Random Plot waveform chart on the front panel.
3
2
LabVIEW QuickStart Guide
2.
Select Random Number (0-1) from the Functions»Numeric
subpalette. If the Functions palette is not visible, select
Windows»Show Functions Palette. For this activity, you use a
random number generator to generate input data for your VI.
3.
Place the Random Number function on the block diagram. This VI
generates a random number ranging from zero to one.
2-8
© National Instruments Corporation
Chapter 2
Virtual Instruments
4
5
4.
Select While Loop from the Functions»Structures subpalette. The
While Loop runs all code within its boundaries while the value on
its conditional terminal remains TRUE. When the value changes to
FALSE, the While Loop exits.
5.
Place your pointer in the position on the block diagram where you
want to anchor the top left corner of the loop. Drag the loop
diagonally to enclose the Random Number function, the Power
toggle switch, and the Random Plot chart.
conditional terminal
Tip
If your While Loop did not enclose all of the code, right-click on the
border of the loop to access the pop-up menu (on the Macintosh,
command-click on the border of the loop). Choose Remove While Loop
from this pop-up menu. Then repeat steps four and five to re-create the
loop so it encloses all the code.
© National Instruments Corporation
2-9
LabVIEW QuickStart Guide
Chapter 2
Virtual Instruments
Wire and Run Your VI
You need to add wiring to define the data flow in your VI. After your
VI is complete, you can run it from the front panel to see the data plot
to your chart.
12
9
3
You can complete this section in approximately 5 minutes.
6
1.
Wiring tool
Select the Wiring tool from the Tools palette. If the Tools palette is
not visible, select Windows»Show Tools Palette.
2
3
2.
Tips
Wire the Random Number function to the Random Plot chart
terminal. To create a wire, click on the Random Number function,
move to the Random Plot chart, and click again to terminate the
wire.
When you position the Wiring tool over a terminal, the terminal blinks
and a tip strip appears that labels the terminal. When the correct
terminal blinks, click to wire to or from that terminal.
If you see black dashed wires, select Remove Bad Wires from the Edit
menu.
3.
conditional terminal
LabVIEW QuickStart Guide
Wire the Power toggle switch terminal to the conditional terminal
on the While Loop.
2-10
© National Instruments Corporation
Chapter 2
Virtual Instruments
5
4
4.
Go to the front panel and select the Operating tool. Click the
Power toggle switch to turn it to the TRUE position.
5.
Click the Run button on the toolbar to run the VI.
6.
To stop running the VI, click the Power toggle switch again to turn
it to the FALSE position. Because the While Loop executes only as
long as its conditional terminal remains TRUE, changing the value
of the toggle switch to FALSE stops the loop.
Operating tool
Run
© National Instruments Corporation
2-11
LabVIEW QuickStart Guide
Chapter 2
Virtual Instruments
Add Timing to Your VI
You can add a timing delay to your VI to plot the points more slowly on
the waveform chart.
12
9
3
You can complete this section in approximately 5 minutes.
6
2
1
1.
Go to the block diagram. Select Wait Until Next ms Multiple from
the Functions»Time & Dialog subpalette.
2.
Place the Wait Until Next ms Multiple function within the
While Loop.
3
3.
LabVIEW QuickStart Guide
From the pop-up menu on the left side of the
Wait Until Next ms Multiple function, choose Create Constant.
When you access the pop-up menu of the function, make sure you
position the pointer over the left side of the function. Otherwise, the
constant you create is not wired to the function.
2-12
© National Instruments Corporation
Chapter 2
Tip
Virtual Instruments
To access the pop-up menu of a LabVIEW object, right-click on the
object. On the Macintosh, use command-click.
4
4.
Type 250 in the millisecond multiple control to create a 250 ms
delay between the generation of points to plot for the chart.
5.
Go to the front panel, click the Power toggle switch to the TRUE
position, and run the VI to see the delay effect. Click the Power
toggle switch to the FALSE position to stop the VI. Save this
program as Random Number Example.vi in the
LabVIEW\vi.lib\tutorial.llb directory.
Run
Note
Paths in this manual are denoted using backslashes (\) to separate drive
names, directories, and files.
© National Instruments Corporation
2-13
LabVIEW QuickStart Guide
Chapter 2
Virtual Instruments
Add Analysis and File I/O to Your VI
You can average the random data points you collected and save your
data to a spreadsheet file.
12
9
3
You can complete this section in approximately 10 minutes.
6
1.
Go to the block diagram window of the Random Number Example
VI you created. If your VI is not open already, choose
Random Number Example.vi from the
LabVIEW\vi.lib\tutorial.llb directory.
3
2
2.
Tip
Select Mean.vi from the Functions»Analysis»
Probability and Statistics subpalette.
If you do not see the Functions palette, select Windows»
Show Functions Palette.
3.
LabVIEW QuickStart Guide
Place the Mean VI in the block diagram outside the While Loop.
2-14
© National Instruments Corporation
Chapter 2
Virtual Instruments
4
4.
From the pop-up menu on the upper-right corner of the Mean VI,
choose Create Indicator. This creates a front panel numeric
indicator to display the mean of the random data.
6
5
5.
Select Write To Spreadsheet File.vi from the Functions»File I/O
subpalette.
6.
Place the Write To Spreadsheet File VI in the block diagram
outside the While Loop.
© National Instruments Corporation
2-15
LabVIEW QuickStart Guide
Chapter 2
Virtual Instruments
7
8
7.
Wiring tool
Tips
Using the Wiring tool, wire the Random Number function to the
X input terminal of the Mean VI. Create this wire branch by wiring
from the existing wire segment.
The wire segment blinks when the Wiring tool is positioned correctly to
fasten a new wire from the existing segment.
The Wiring tool allows you to see tip strip labels for terminals on nodes
in the block diagram.
8.
Create another wire branch from the branch created in the previous
step. Wire this new branch to the 1D data input of the
Write to Spreadsheet File VI. You use the 1D data input because
the While Loop creates a one-dimensional row of data from the
generated random numbers.
9
9.
LabVIEW QuickStart Guide
The black tunnel on the While Loop is a data exit terminal on the
loop. From the pop-up menu on the black tunnel, choose
Enable Indexing. The dashed wires change to solid orange wires.
Enable Indexing allows the While Loop to collect the data and pass
it to the Mean VI as a data set when the loop terminates.
2-16
© National Instruments Corporation
Chapter 2
Operating tool
Virtual Instruments
10. Go to the front panel. Using the Operating tool, click the Power
toggle switch to the TRUE position and run the VI.
11
11. When you turn off the power, you see the mean of your data and a
file dialog box that prompts you for the name of the random number
file. Type data.txt and click Save.
Tip
The mean does not appear until the data is collected when the power is
turned off.
12. Use any text editor to open data.txt and view the data.
Note
You can find the solution to this activity in LabVIEW\vi.lib\
tutorial.llb\Random Number Example Solution.VI.
© National Instruments Corporation
2-17
LabVIEW QuickStart Guide
06Chap03.fm Page 1 Friday, April 18, 1997 2:51 PM
Chapter
3
Data Acquisition
This chapter teaches you how to use LabVIEW to acquire data from
data acquisition hardware. If you only use standalone instruments and
control them with GPIB, VXI, or serial standards, see Chapter 4,
Instrumentation.
You will learn to do the following:
•
•
Note
Use the DAQ Solution Wizard to generate solutions for data
acquisition applications
–
Use the DAQ Channel Wizard to configure your analog input
channel
–
Generate a solution from the Common Solutions Gallery
Add analog input to the VI you created in Chapter 2, Virtual
Instruments
Refer to your hardware manual or the NI-DAQ online Help file for data
acquisition hardware installation and configuration instructions.
Use the DAQ Solution Wizard
If you are using DAQ hardware, you must configure your analog input
channels. You can launch the DAQ Channel Wizard from within the
DAQ Solution Wizard to configure your channels. Then you can
generate a DAQ solution from the Common Solutions Gallery.
Note
12
9
3
The DAQ Solution Wizard currently is available on Windows platforms
only.
You can complete this activity in approximately 15 minutes.
6
© National Instruments Corporation
3-1
LabVIEW QuickStart Guide
Chapter 3
Data Acquisition
Configure Your Analog Input Channel
The DAQ Solution Wizard guides you through naming and configuring
your analog input channels.
12
9
3
You can complete this section in approximately 5 minutes.
6
1
1.
LabVIEW QuickStart Guide
To get started with analog input quickly and easily, select
DAQ Solution Wizard in the LabVIEW dialog box. To access the
LabVIEW dialog box, either launch LabVIEW or close all open VIs
if you already are running LabVIEW.
3-2
© National Instruments Corporation
Chapter 3
Data Acquisition
2
2.
© National Instruments Corporation
When the Welcome to the DAQ Solution Wizard! dialog box
opens, click Go to DAQ Channel Wizard.
3-3
LabVIEW QuickStart Guide
Chapter 3
Data Acquisition
Note
If you are using the evaluation version of LabVIEW and you do not have
hardware, the DAQ Channel Wizard will be disabled. However, you will see
a list of channels that you can use to generate solutions.
3
3.
LabVIEW QuickStart Guide
Click New... in the DAQ Channel Wizard dialog box to configure a
new channel. The DAQ Channel Wizard helps you configure
analog input channels by name so you can use those names in your
program. The DAQ Channel Wizard also conditions those channels
so that signal conditioning such as scaling factors and cold-junction
compensation are performed transparently to you.
3-4
© National Instruments Corporation
Chapter 3
Data Acquisition
4
4.
Tip
Type your channel name and description in the appropriate text
boxes. You can select the type of sensor in the drop-down list box.
Select the checkbox to mark the channel as a temperature
measurement. Click Next>> to continue.
If you are not taking a temperature reading, use parameters in the
DAQ Channel Wizard appropriate for your measurement.
© National Instruments Corporation
3-5
LabVIEW QuickStart Guide
Chapter 3
Data Acquisition
5
5.
Define the physical quantity that you are measuring. Select the
units and enter the range in the appropriate boxes. Click Next>> to
continue.
6
6.
LabVIEW QuickStart Guide
Define the scaling and range of the sensor. Click Next>> to
continue.
3-6
© National Instruments Corporation
Chapter 3
Data Acquisition
7
7.
© National Instruments Corporation
Select your data acquisition hardware settings. If you have multiple
DAQ hardware devices installed, choose the device that will read
this signal. Click Finish to configure your analog input channel.
3-7
LabVIEW QuickStart Guide
Chapter 3
Data Acquisition
8
8.
LabVIEW QuickStart Guide
Notice that your new configuration appears in the table. You have
finished configuring an analog input channel named Temperature
for your DAQ hardware. This channel measures temperature from
zero to 100 degrees Fahrenheit, mapped from the zero to one volt
range of the sensor. Click Exit and save changes.
3-8
© National Instruments Corporation
Chapter 3
Data Acquisition
Generate a Solution from the Common Solutions Gallery
Once you have configured your channel, you can generate a solution
from the Common Solutions Gallery.
12
9
3
You can complete this section in approximately 10 minutes.
6
1
1.
© National Instruments Corporation
Click Next> when you return to the DAQ Solution Wizard.
3-9
LabVIEW QuickStart Guide
Chapter 3
Data Acquisition
2
2.
LabVIEW QuickStart Guide
Click Next> in the DAQ Solution Wizard to open the Common
Solutions Gallery.
3-10
© National Instruments Corporation
Chapter 3
Data Acquisition
4
3
5
3.
Choose a solution to generate for your analog input channel. For
this example, select Data Logging in the Gallery Categories list.
4.
Select Simple Data Logger in the Common Solutions list.
5.
Click Next> to continue.
© National Instruments Corporation
3-11
LabVIEW QuickStart Guide
Chapter 3
Data Acquisition
6 4
7
LabVIEW QuickStart Guide
6.
Select Temperature as the input channel to use for the solution.
7.
Click Open Solution to generate the solution.
3-12
© National Instruments Corporation
Chapter 3
Data Acquisition
8
9
8.
Click the Run button to take data from your configured analog
input channel and log the data to a file. A file dialog box prompts
you for a file name. Type temp.txt and click Save.
9.
Click the STOP button at the lower right corner of the front panel
to stop the VI. Use any text editor to view temp.txt.
Run
Tip
You can customize the front panel and block diagram of the VI and save
your customized solution to disk.
10. Close this VI and save any changes you want to keep.
11. Go to the DAQ Solution Wizard window and click < Back to
browse other gallery categories and common solution VIs.
12. Click Quit Wizard to exit.
© National Instruments Corporation
3-13
LabVIEW QuickStart Guide
Chapter 3
Data Acquisition
Add Analog Input to Your VI
You have created a Random Number Example VI that generates random
numbers and plots them to a strip chart. Now you can replace the
random number generator with an analog input VI to acquire data from
your DAQ board, plot it to a strip chart, analyze it, and write it to a file.
12
9
3
You can complete this activity in approximately 5 minutes.
6
Note
If you have not built the Random Number Example VI, you can find the
solution VI in LabVIEW\vi.lib\tutorial.llb\
Random Number Example Solution.vi.
1.
Open the Random Number Example VI from the
LabVIEW\vi.lib\tutorial.llb directory.
2
2.
LabVIEW QuickStart Guide
Go to the block diagram. From the pop-up menu on the Random
Number function, choose Replace»Data Acquisition»
Analog Input»AI Sample Channel.vi.
3-14
© National Instruments Corporation
Chapter 3
Tip
Data Acquisition
Be sure that you select AI Sample Channel.vi and not
AI Sample Channels.vi.
3.
Wiring tool
Select the Wiring tool from the Tools palette. The Wiring tool
allows you to see the tip strip labels for terminals on nodes in the
block diagram.
4
4.
Move your pointer over the channel (0) terminal of the AI Sample
Channel VI. A tip strip that labels the terminal appears.
5
5.
© National Instruments Corporation
From the pop-up menu on the highlighted channel (0) terminal,
choose Create Constant. To access the pop-up menu, right-click on
the terminal (on the Macintosh, command-click on the terminal).
3-15
LabVIEW QuickStart Guide
Chapter 3
Data Acquisition
6
6.
Type Temperature or the name of the channel you configured in
the DAQ Solution Wizard.
7
7.
LabVIEW QuickStart Guide
Go to the front panel. From the pop-up menu on the graph, choose
Y Scale»AutoScale Y.
3-16
© National Instruments Corporation
Chapter 3
Data Acquisition
10
8
9
8.
Using the Labeling tool, highlight the chart label and change the
label to Temperature Chart.
9.
Using the Operating tool, click the Power toggle switch to the
TRUE position.
Labeling tool
Operating tool
10. Click the Run button to see the data chart.
Run
11. Click the Power toggle switch to stop the VI.
12. In the file dialog box, enter a name such as data.txt and click
Save. This saves your temperature data to a spreadsheet file.
13. Save this VI as Acquire Temperature.vi in the
LabVIEW\vi.lib\tutorial.llb directory.
For multiple point acquisition, waveform generation, digital I/O, or
counter timer applications, see the LabVIEW Data Acquisition Basics
Manual.
Use the Search Examples feature found in both the LabVIEW dialog
box and the Help menu for examples and information. Search Examples
guides you to DAQ examples for reference.
Use the DAQ Solution Wizard found in both the LabVIEW dialog box
and the File menu to automatically generate DAQ applications that you
can customize.
© National Instruments Corporation
3-17
LabVIEW QuickStart Guide
Chapter
4
Instrumentation
This chapter teaches you how to use LabVIEW to acquire data from
standalone instruments controlled by GPIB, VXI, RS-232, and other
hardware standards.
You will learn to do the following:
•
Use an instrument driver to communicate with your instrument
•
Run the Demo Scope VI if you do not have instrument I/O hardware
installed
Instrument I/0
LabVIEW communicates with most instruments through instrument
drivers, which are libraries of VIs that control programmable
instruments. LabVIEW instrument drivers simplify instrument control
and reduce test development time by eliminating the need to learn the
low-level programming protocol for each instrument.
Instruments obey a command set to respond to remote control and
requests for data. When you use LabVIEW instrument drivers, you run
intuitive, high-level command VIs, such as the Read DC Voltage VI for
a digital multimeter, or the Configure Time Axis VI for a digital
oscilloscope. The called instrument driver VI automatically sends the
appropriate instrument-specific command strings to the instrument.
The foundation for LabVIEW instrument drivers is the VISA (Virtual
Instrument Software Architecture) VI library, a single interface library
for controlling GPIB, VXI, RS-232, and other types of instruments.
Instrument drivers using VISA are scalable across instrument I/O
interfaces.
© National Instruments Corporation
4-1
LabVIEW QuickStart Guide
Chapter 4
Instrumentation
Use an Instrument Driver
In this activity, you use an instrument driver to communicate with your
instrument.
12
9
3
You can complete this activity in approximately 5 minutes.
6
Tip
If you do not have instrument I/O hardware installed, see the
Run the Demo Scope VI activity in this chapter.
1.
Create a new VI and go to the block diagram.
3
2
2.
LabVIEW QuickStart Guide
Select Functions»Instrument Drivers»HP34401A»VIs»
Application Example VIs»HP34401A Getting Started.vi, or select
your instrument name and its Getting Started VI.
4-2
© National Instruments Corporation
Chapter 4
Tip
Instrumentation
If you cannot find your instrument here, check your LabVIEW CD or
the National Instruments Instrument Driver Library CD and install the
driver for your instrument into the instr.lib folder in the LabVIEW
root directory.
If you have a web browser installed, you can select
Internet Links»Instrument Driver Network... from the Help menu to link
automatically to the National Instruments Instrument Driver Network.
In this web page, you can search for your instrument among over 600
instrument drivers available with free source code. You then can
download the instrument driver you need.
3.
Place the VI on the block diagram.
4.
Double-click this HP34401A Getting Started VI to see the front
panel and block diagram. This VI controls the HP34401A Digital
Multimeter. The Getting Started VI is an example of a higher-level
program that calls the instrument driver subVIs to control the
instrument. You see these subVIs in the palette of the instrument
driver.
© National Instruments Corporation
4-3
LabVIEW QuickStart Guide
Chapter 4
Instrumentation
6
5
7
5.
On the front panel, verify the GPIB address of the HP34401A
Getting Started VI. The default address is 4.
6.
Run the VI to measure DC voltage.
7.
Using the Operating tool, change the Function input and run the
VI again to see other measurements.
Run
Operating tool
LabVIEW QuickStart Guide
4-4
© National Instruments Corporation
Chapter 4
8.
Tip
Instrumentation
Examine the block diagram. The HP34401A Initialize subVI is
called first, followed by a subVI to control the instrument, and
ending with the HP 34401A Close subVI.
You can find the instrument driver subVIs under Functions»
Instrument Drivers»Your Instrument. When you write your own program
with an instrument driver, remember to call Initialize first, followed by
the series of subVIs you want to use to control the instrument, and finally
the Close subVI to close the instrument session.
© National Instruments Corporation
4-5
LabVIEW QuickStart Guide
Chapter 4
Instrumentation
Run the Demo Scope VI
If you do not have instrument I/O hardware installed, you can run the
Demo Scope VI to see an instrument I/O example. The Demo Scope VI
is the demonstration equivalent of a Getting Started VI for an actual
instrument driver.
12
9
3
You can complete this activity in approximately 5 minutes.
6
1.
Open the Demo Scope VI instrument driver in
LabVIEW\vi.lib\tutorial.llb.
2
3
2.
Run the program to acquire data from one or two channels on your
oscilloscope. Change timebase and volts per division settings to see
the effect.
3.
Click the square STOP [F4] button to stop the VI.
Run
LabVIEW QuickStart Guide
4-6
© National Instruments Corporation
Chapter 4
4.
© National Instruments Corporation
Instrumentation
Go to the block diagram. Notice that Initialize is called first,
followed by the commands to send to the instrument in the
Application Example VI. The Close VI then closes out
communication with the instrument. When you program with
LabVIEW instrument drivers, follow this model of initializing the
instrument, then calling the functions to control the instrument, and
finally closing the instrument for communication.
4-7
LabVIEW QuickStart Guide
Chapter
5
Debugging
This chapter teaches you how to use some of the comprehensive
debugging utilities in LabVIEW.
Use Execution Highlighting
Execution highlighting traces the data flow of a VI during execution.
12
9
3
You can complete this activity in approximately 5 minutes.
6
1.
From the LabVIEW\vi.lib\tutorial.llb directory, open the
Random Number Example VI you created earlier.
2.
Using the Operating tool, turn on the Power toggle switch.
Operating tool
3
3.
execution highlighting
© National Instruments Corporation
Go to the block diagram and click the execution highlighting button
on the toolbar.
5-1
LabVIEW QuickStart Guide
Chapter 5
Debugging
4
5
6
4.
Run the VI from the block diagram window. The program executes
in slow motion with moving bubbles to highlight the flow of
execution. It also displays data as it becomes available in the VI.
5.
Stop the VI by clicking the Abort button.
6.
Turn off execution highlighting by clicking the execution
highlighting button again.
Run
Abort
execution highlighting
LabVIEW QuickStart Guide
5-2
© National Instruments Corporation
Chapter 5
Debugging
Single-Step with Probes
You can set breakpoints in a VI and single-step into, out of, and over
sections of the block diagram. You also can insert probes to examine
data values in detail during program execution. This example shows
how to single-step through a VI and how to insert probes to monitor
your data while the VI runs.
12
9
3
You can complete this activity in approximately 5 minutes.
6
1
1.
Tip
From the pop-up menu on the output wire of the Random Number
function, choose Probe. A small number: ... window appears to
show the value of the data at that point.
Make sure the Power toggle switch is turned on in the front panel.
© National Instruments Corporation
5-3
LabVIEW QuickStart Guide
Chapter 5
Debugging
2
2.
Click the Step Into button on the toolbar. The While Loop now
flashes, indicating that the program is executing in single step
mode.
3.
Click the Step Into button again. The Random Number function
now flashes.
Step Into
4
4.
Step Over
LabVIEW QuickStart Guide
Click the Step Over button to step over the Random Number
function. The random number function executes, so the output now
appears in the probe.
5-4
© National Instruments Corporation
Chapter 5
5.
Debugging
Using Step Into and Step Over buttons, single step a few more
times through the loop to view each random number as it is
generated in the VI.
6
6.
To run your VI in normal mode, deselect the Pause button.
7.
Go to the front panel and turn off the Power toggle switch to stop
the VI. Save the collected data to data.txt.
Pause
© National Instruments Corporation
5-5
LabVIEW QuickStart Guide
Chapter
Where To Go From Here
6
This chapter teaches you how to use Online Help in LabVIEW. It also
outlines National Instruments’ commitment to your success and the
additional resources available to you. To learn more about LabVIEW
programming techniques, consult the LabVIEW Tutorial Manual and the
LabVIEW User Manual, available with the LabVIEW development
system.
Online Help
All built-in LabVIEW VIs come with a complete online reference.
When you find an unfamiliar VI, place it on your block diagram and
choose Online Help from the pop-up menu on the VI. Online Help gives
you a complete description of the VI functionality and parameters.
© National Instruments Corporation
6-1
LabVIEW QuickStart Guide
Chapter 6
Where To Go From Here
Show Help
If you need a quick reference to remind you about VI functionality or
input and output parameters, select Help»Show Help.
Unlocked
Locked
LabVIEW QuickStart Guide
The Help window is context-sensitive, so when you need information
about a VI, place your pointer over the VI icon. Click the lock button at
the bottom of the Help window to lock the current contents of the Help
window.
6-2
© National Instruments Corporation
Chapter 6
Where To Go From Here
National Instruments’ Commitment to You
LabVIEW represents a long-standing commitment by National
Instruments to provide tools that simplify the development of
instrumentation systems. When you choose LabVIEW as your
development environment, you join thousands of scientists and
engineers who are taking advantage of the power of graphical
programming.
Customer Education
For additional training, National Instruments offers interactive CDs,
videos, books, and hands-on LabVIEW courses to help you master
LabVIEW quickly and develop successful applications.
National Instruments’ comprehensive training courses on LabVIEW
can help you learn to build applications quickly. The three-day Basics
course and two-day Advanced course give you concentrated instruction,
as well as design tips, on the LabVIEW development environment from
our applications engineers. These courses take place monthly at our
corporate headquarters in Austin, Texas, and also at our branches
around the world. In addition, we offer two-day courses on GPIB, DAQ,
VXI, and other topics to help you develop your entire system.
Alliance Program
The Alliance program is a network of third-party developers and
consultants who are experts in LabVIEW and other National
Instruments products. The National Instruments Solutions directory
lists additional libraries and utilities developed by our Alliance
members to help you use LabVIEW. In addition, the Solutions directory
lists expert LabVIEW consultants who can help you develop custom
applications.
Technical Support
National Instruments offers you complete technical support. You can
use our Internet sites (Web and FTP), BBS, or fax-on-demand systems
to download valuable information and product examples,
question-and-answer documents, and technical development tips. A
technical forum for LabVIEW is available on the Internet where you
can discuss issues with other LabVIEW users. In addition, National
Instruments has experienced Applications Engineers located
throughout the world to assist you.
© National Instruments Corporation
6-3
LabVIEW QuickStart Guide
Appendix
A
Installation Instructions
This appendix describes the system requirements and installation
procedures for LabVIEW.
Required System Configuration
LabVIEW has the following system configuration requirements for
Windows platforms:
•
Windows 3.1
–
•
Windows 95
–
•
LabVIEW runs in 386 enhanced mode with a minimum of 8
MB of RAM. LabVIEW runs optimally on a computer with an
80486 CPU, but LabVIEW can run on an 80386-based PC.
LabVIEW for Windows requires a coprocessor.
LabVIEW runs under any system that supports Windows 95,
with 8 to 12 MB of RAM for effective operation.
Windows NT
–
LabVIEW requires Windows NT version 3.5.1 or greater, with
a minimum of 12 to 16 MB of RAM for effective operation.
LabVIEW for Windows NT only runs under Windows NT
80x86 computers.
Installation Procedures
•
LabVIEW Development System
–
•
For instructions on how to install LabVIEW, see the
LabVIEW Release Notes.
Evaluation Software
–
If you are installing from the Software Showcase CD, run
Showcase.exe. Go to the LabVIEW section in
Virtual Instrumentation Tools and click demo.
–
© National Instruments Corporation
If you are installing from the LabVIEW Evaluation Version CD,
see the readme.txt file for installation instructions.
A-1
LabVIEW QuickStart Guide
Glossary
B
block diagram
A pictorial description or representation of a program or algorithm.
In LabVIEW, the block diagram, which consists of executable
icons called nodes and wires that carry data between the nodes, is
the source code for the VI. The block diagram resides in the
Diagram window of the VI.
C
Common Solutions Gallery
Option within the DAQ Solution Wizard in which you can select
from numerous categories of common DAQ applications.
conditional terminal
The terminal of a While Loop that contains a Boolean value that
determines whether the VI performs another iteration.
control
Front panel object for entering data to a VI interactively or to a
subVI programmatically.
Controls palette
Palette containing front panel controls and indicators.
D
data flow
Programming system consisting of executable nodes in which
nodes execute only when they have received all the required input
data and produce output automatically when they have executed.
LabVIEW is a dataflow system.
DAQ Channel Wizard
Utility that guides you through naming and configuring your DAQ
analog input channels.
DAQ Solution Wizard
Utility that guides you through specifying your DAQ application,
from which it provides a custom DAQ solution.
© National Instruments Corporation
G-1
LabVIEW QuickStart Guide
Glossary
E
Enable Indexing
Option that allows you to build a set of data to be released at the
termination of a While Loop. With indexing disabled, a While Loop
releases only the final data point generated within the loop.
execution highlighting
Feature that animates VI execution to illustrate the data flow in
a VI.
F
front panel
The interactive user interface of a VI. Modeled from the front panel
of physical instruments, it is composed of switches, slides, meters,
graphs, charts, gauges, LEDs, and other controls and indicators.
function
Built-in execution element, comparable to an operator, function, or
statement in a conventional language.
Functions palette
Palette containing block diagram structures, constants,
communication features, and VIs.
G
G
The graphical programming language used to develop LabVIEW
applications.
GPIB
General Purpose Interface Bus is the common name for the
communications interface system defined in ANSI/IEEE
Standard 488.1-1987 and ANSI/IEEE Standard 488.2-1987.
Hewlett-Packard, the inventor of the bus, calls it the HP-IB.
I
indicator
Front panel object that displays output.
L
Labeling tool
Tool used to create labels and enter text into windows.
LabVIEW
Laboratory Virtual Instrument Engineering Workbench.
LabVIEW QuickStart Guide
G-2
© National Instruments Corporation
Glossary
N
nodes
Execution elements of a block diagram consisting of functions,
structures, and subVIs. See also data flow, wire.
O
Operating tool
Tool used to enter data into controls as well as operate them.
P
Palette
A display of pictures that represent possible options. See also
Controls palette, Functions palette, subpalette, Tools palette.
Positioning tool
Tool used to move, select, and resize objects.
probe
Debugging feature for checking intermediate values in a VI.
R
RS-232
Recommended Standard 232, a serial interface bus standard.
RS-485
Recommended Standard 485, a serial interface bus standard.
S
structure
Program control element, such as a While Loop.
subpalette
A palette contained in an icon of another palette.
subVI
VI used in the block diagram of another VI; comparable to a
subroutine.
T
terminal
Object or region on a node through which data passes.
tip strip
A text banner that displays the name of an object, control, or
terminal.
© National Instruments Corporation
G-3
LabVIEW QuickStart Guide
Glossary
Tools palette
Palette containing the tools you can use to edit and debug front
panel and block diagram objects.
tunnel
Data entry or exit terminal on a structure.
V
VI
See virtual instrument.
virtual instrument
A program in the graphical programming language G that models
the appearance and function of a physical instrument.
VISA
Virtual Instrument Software Architecture. A single interface
library for controlling GPIB, VXI, RS-232, and other types of
instruments.
VXI
VME eXtensions for Instrumentation (bus).
W
waveform chart
An indicator that plots data points at a certain rate.
While Loop
Loop structure that repeats a section of code until a condition is
met. Comparable to a Do loop or a Repeat-Until loop in
conventional programming languages.
wire
Data path between nodes. See also data flow.
wire branch
A section of wire that contains all the wire segments from one
junction to another, from a terminal to the next junction, or from
one terminal to another if there are no junctions in between.
wire junction
The point where three or more wire segments join.
wire segment
A single, horizontal or vertical piece of wire.
Wiring tool
Tool used to define data paths between terminals. Resembles a
spool of wire.
LabVIEW QuickStart Guide
G-4
© National Instruments Corporation