1
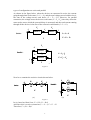
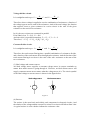
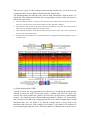
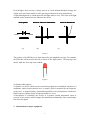
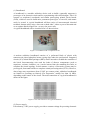
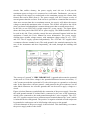
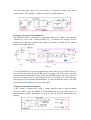
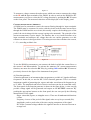
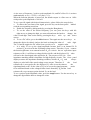
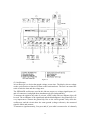
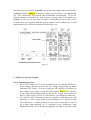
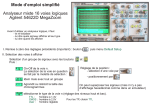
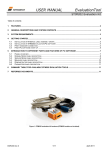
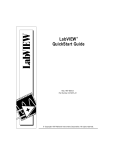
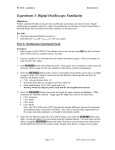
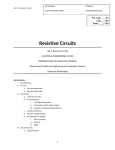
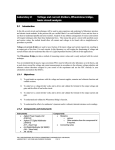
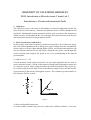
UNIVERSITY OF CALIFORNIA, BERKELEY
EE40: Introduction to Microelectronic Circuits Lab 1
Introduction to Circuits and Instruments Guide
1. Objectives
The electronic circuit is the basis for all branches of electrical engineering. In this lab,
basic electronic circuit theory, electronic and photonic devices will be introduced and
employed. Fundamental testing equipment will be used to measure and characterize
simple circuitry. In the hands-on lab, you will apply these basic theories to the devices
and components provided to design simple circuits.
2. Basic circuit theory and devices
In this section, some basic circuit theory will be presented first. You will need to apply
this to the following hands-on lab to design your circuit. Simple electronic and photonic
devices such as resistors, light emitting diodes (LEDs) and speakers/microphones will
also be discussed and used in the lab. Before doing the lab, please read through this
section carefully and complete the prelab to test your understanding of the material
presented here.
(1) Ohm’s Law: V = IR
Current (denoted I) and voltage (denoted V) are two major quantities that are used to
study electronic circuits. Current is the amount of charge passing through a certain area
in a unit time period, while voltage describes the electrical potential drop across any
two nodes in a given circuit. Ohm’s Law states that the voltage V across an ideal resistor
is proportional to the current I through the resistor. The constant of proportionality is
the resistance R of the resistor.
I
V
+
R
V
Slope = R
I
Figure 1
(2) Series and parallel connections
A circuit usually contains many devices connected in different fashions. Two basic
V = IR
1
types of configuration are series and parallel.
As shown in the figure below, when the devices are connected in series, the current
going through them is the same (I = I1 = I2), and the total voltage across both devices is
the sum of the voltage across each device (V = V1 + V2). However, for parallel
connection, the voltage across the devices is the same (V = V1 = V2) since they share the
same nodes across which the potential drop is measured, and the total current running
through all the devices is the sum of the current in each branch (I = I1 + I2).
V1
I1
V2
I2
Device 1
I
Device 2
I = I1 = I 2
Series :
V
+
V = V1 + V2
_
V1
I1
Device 1
Parallel :
I = I 1 + I2
V2
I2
Device 2
V = V1 = V2
I
V
+
_
Figure 2
Now let us examine the resistive circuits shown below.
I1
Series :
V1
I2
V2
V1
I1
I
R1
Parallel :
R2
R1
I2
V
I
V2
R2
V
(a)
(b)
Figure 3
In (a), based on Ohm’s law, V1 = R1I1, V2 = R2I2
And since this is a series connection, I1 = I2 = I, V = V1 + V2
Therefore, V = (R1 + R2) I
2
Voltage-divider circuit:
It is straightforward to get V1 =
R2
R1
V.
V and V2 =
R1 + R2
R1 + R2
Therefore, when a voltage is applied to a series combination of resistances, a fraction of
the voltage appears across each of the resistances. And of the total voltage, the fraction
that appears across a given resistance in a series circuit is the ratio of the given
resistance to the total series resistance.
In (b), the two resistors are connected in parallel.
From Ohm’s law, V1 = R1I1, V2 = R2I2
And since this is a parallel connection, V1 = V2 = V, I = I1 + I2
Therefore, I = V / R1 + V / R2 = R1R2V / (R1 + R2)
Current-divider circuit:
It is straightforward to get I1 =
R1
R2
I
I and I 2 =
R1 + R2
R1 + R2
Therefore, the total current flowing into a parallel combination of resistances divides,
and a fraction of the total current flows through each resistance. And the fraction of the
total current flowing in a resistor is the ratio of the other resistance to the sum of the
two resistances.
(3) Ideal voltage and current sources
An ideal voltage source supplies a constant voltage across its output terminals no
matter how much current is going through it. Likewise, an ideal current source will
supply constant current out no matter what the voltage across it is. The circuit symbol
of the ideal voltage or current source is shown in the figure below.
ideal voltage source
V
ideal current source
+
_
I
Figure 4
(4) Resistor
The resistor is the most basic and widely used component in electronic circuits. And
the relation of the voltage and the current of a resistor in a circuit will follow Ohm’s law.
A typical resistor is color coded to indicate the resistance value.
3
There are two types of color coding, 4-band-code and 5-band-code. As can be seen, the
5-band-code has one more digit resolution than the 4-band-code.
The following chart provides the color code for both 4-band and 5-band resistors. To
decode the color bands and calculate the corresponding resistance value, one needs to
follow the steps below.
a.
Find the tolerance band. It is located at one end of the resistor and far away from the rest of the color
bands. It gives the accuracy of the actual resistance to the value that is labeled.
b.
Start from the other end and use the color code map to identify the color band. This will be the first
digit (the most significant digit) of the resistance value.
c.
Then similarly decode the second and the third band (for 5-band resistor only). Write down all the
digits in order (from left to right).
d.
The last band is the multiplier. Use the decoded digits to multiply the decoded multiplier to get the
resistance value.
(5) Light emitting diode (LED)
A diode is a basic but very important device that has two terminals, the anode and the
cathode. Current can ONLY flow from anode to cathode, and NOT the other way
around. The circuit symbol for a diode is shown in the (a) figure below, indicating the
polarity. The simple piecewise-linear model approximates a diode’s I-V characteristic
and is shown in (b). When the voltage applied across the diode is higher than a certain
threshold value VTH, the diode is on, and the voltage across it stays fixed at the
threshold value. However, if the voltage is lower than VTH, the diode is off, and there is
no current going through the device. The actual diode I-V characteristic is shown in (c).
4
Even though it does not have a sharp turn-on at a well defined threshold voltage, the
simple piecewise-linear model is still a good approximation in most applications.
A light emitting diode is a diode that will emit light when it is on. The color of the light
depends on the material used to fabricate the device.
circuit symbol
Piecewise -linear I -V characteristic
Real I -V characteristic
I
Anode +
I
- Cathode
VTH
I
(a)
(b)
V
V
(c)
Figure 5
The polarity of an LED device is often denoted by the length the two legs. For example,
the LED that will be used in this lab is shown in the figure below. The long leg is the
anode, while the short leg is the cathode.
Figure 6
(6) Speaker/Microphone
A speaker is a device which converts an electrical signal into mechanical vibration of a
membrane, which creates sound waves. A sound’s pitch is measured by the frequency
of the wave. A single frequency sinusoidal signal (Sine wave) will generate a monotone.
High frequency signals results in high pitch and vice versa.
A microphone is essentially the reverse of a speaker. Sound information exists as
patterns of air pressure which changes the membrane mechanically, thus transferring it
into electrical signal.
3. Introduction to major equipment
5
(1) Breadboard
A breadboard is a reusable solderless device used to build a (generally temporary)
prototype of an electronic circuit and for experimenting with circuit designs. This is in
contrast to stripboard (veroboard) and similar prototyping printed circuit boards
(PCB), which are used to build more permanent prototypes or one-offs, and cannot
easily be reused. A typical breadboard will have strips of interconnected electrical
terminals, known as bus strips, down one or both sides—either as part of the main unit
or as separate blocks clipped on—to carry the power rails.
A typical breadboard with a circuit built on it is shown below.
Figure 7. A breadboard with a completed circuit
A modern solderless breadboard consists of a perforated block of plastic with
numerous tin plated phosphor bronze spring clips under the perforations. Integrated
circuits (ICs) in dual inline packages (DIPs) can be inserted to straddle the centerline of
the block. Interconnecting wires and the leads of discrete components (such as
capacitors, resistors, inductors, etc.) can be inserted into the remaining free holes to
complete the circuit topology. In this manner, a variety of electronic systems may be
prototyped, from small circuits to complete central processing units (CPUs). However,
due to large stray capacitance (from 2-25pF per contact point), solderless breadboards
are limited to operating at relatively low frequencies, usually less than 10 MHz,
depending on the nature of the circuit. The node connection of a typical breadboard is
shown in the figure.
Figure 8. The node connection of a typical breadboard
(2) Power supply
Like a battery, a DC power supply provides a constant voltage for powering electronic
6
circuits. But, unlike a battery, the power supply won’t die out. It will provide
continuous power as long as it is connected to a wall outlet. Furthermore, you can set
the voltage of the supply as needed and set the maximum current (the current limit
feature) that can be drawn from it. The power supply will NOT output a value of
current greater than the set limit. If the circuit is operated in a situation that it needs to
draw more current than the set maximum current, the supply will adjust the output
voltage to match this maximum value of current. This feature will protect the circuit
when you know beforehand that it cannot tolerate more than a certain current level.
In this lab, we use HP E3631A triple output DC power supply. The figure below
shows the front panel of the HP E3631A power supply. The shaded switches will not
be used in this lab. These switches control the more advanced features built into the
equipment. Consult the User's Manual for more information. The power supply
contains three variable voltage sources, with maximum voltage values of +6V, +25V,
and -25V. The 6V supply operates independently. The +25V and –25V supplies share
a common reference terminal (com). The earth ground is the terminal connected to the
case of the instrument and more importantly, the earth, through the building wall
socket.
Figure 9
The concept of “ground” is VERY IMPORTANT. A ground node means the potential
at that node is 0 volts. Since voltage is the potential difference between two nodes, “5
volts” means one node has a potential of 5 volts with respect to a ground (or a reference)
node. In the figure above, the true ground – earth ground is the green connector, but all
other black connectors are reference grounds that can be used to apply voltage to a
circuit.
Figure (a) below illustrates symbolically the connection of the power supply. Note that
the earth ground terminal is isolated and is connected to the case of the instrument,
which is also connected to the earth ground through the 3-wire receptacle. The +25V
and -25V supplies outputs have a common output terminal (denoted by "com") which
is isolated from the earth ground. The positive or negative terminals of each output can
be grounded or each output can be left floating with respect to the ground.
A circuit schematic of the power supply is shown below. This should help you connect
the power supply nodes to the circuit.
7
(a)
(b)
Figure 10
Please use the following steps to set a voltage output on the power supply:
a.
Make sure the power supply is disconnected from a circuit first and then turn it on.
b.
Make sure that the supply’s output is off. This can be toggled by hitting the Output
On/Off
c.
key. The display will display OUTPUT OFF when it is off.
Select which source you would like to set, the +25V, the –25V or the +6V by
pressing the
corresponding key on the supply. The supply you have selected will be
displayed along the bottom of the display screen.
d.
To set either the voltage or the current limit, press the Display Limit key. LMT will
be shown at the bottom of the display indicating the limit will be changed. Use the
knob on the right to set the value of the voltage needed.
f.
Select to set the voltage value or the current limit by pressing the Voltage/Current
key below the knob on the right. The one that is blinking is the one that is being
modified. Then the value of the limit can be changed by rotating the knob on the top
right corner. To change the digit that you want to edit, use the left or right arrow
keys.
g.
When done setting the limits, press the Display Limit key again to return to
displaying the actual output voltage set before.
h.
Turn the output on once the supply is connected to the circuit.
The output signal will be delivered to the circuit through cables with either banana type
of connectors of alligator clip type of connectors. The color convention is: red for
positive signal and black for negative signal. Please follow this convention when you
perform any measurement in the lab.
(3) Digital multimeter (DMM)
Currents and voltages are the basic circuit variables of interest. In this lab we are mainly
concerned with accurately measuring resistance, DC voltage and currents using a digital
multimeter (DMM). We will use the HP34401A digital multimeter which is a high
performance instrument capable of measuring resistance, DC and AC voltage and
current, as well as frequency. The HP34401A has a built-in microprocessor, memory
and other electronics components that give it numerous features.
8
The following figure shows the circuit setup for resistance, voltage and current
measurements. The principle of each measurement is explained below.
Figure 11
Resistance measurement (Ohmmeter)
The DMM measures a resistance by applying a known DC voltage over unknown
resistance in series with a small resistance Rm. It measures the voltage over the
resistance Rm and then calculates the unknown resistance R based on the formula
shown in the figure (a) below.
(a)
(b)
Figure 12
To use the DMM for resistance measurements, connect the two legs of the resistor to
the terminals labeled HI (V a) and LO on the top right of the front panel, select the
resistance measurement function by pushing the [Ω 2W] button (one of the function
keys) on the front panel as shown below in the above figure (b). Notice that the
selection keys are annotated in black and blue. To select the function in blue, you must
first select the blue Shift key on the bottom right.
Voltage measurement (Voltmeter)
A DC voltage is measured by using a voltage amplifier and an analog-to-digital
converter (ADC) inside the DMM as schematically shown in the figure below. A
microprocessor further manipulates the data to give an accurate measurement for
display.
9
Figure 13
To measure a voltage, connect the nodes across which one wants to measure the voltage
to the HI and LO input terminals of the DMM. In order to activate the DMM for DC
measurements you have to select the DC voltage function by pushing the DC V button
on the front panel. The measured value then will be displayed on the display panel.
Current measurement (Ammeter)
A DMM used as an ammeter senses the current flowing through its input terminals.
The DMM must be connected in series with the circuit such the same current flows
through the DMM and the test circuit (this usually requires the breaking open of the
path of the circuit along with the current is going to be measured). The principle of the
current measurement is quite simple. The ammeter has a very small resistance at its
input terminals and measures the voltage that the test current generates over this
resistance as shown in the figure below. The microprocessor then calculates the current,
I = V/ri, according to Ohm's law.
Figure 14
To use the DMM as an ammeter, one connects the leads in which the current flows to
the current I and LO terminals. To activate the ammeter (DC current measurement)
function, one must also select the DC I key by pushing Shift and then DC V button as
previously shown in the figure of the instrument front panel.
(4) Function generator
A function generator is an instrument that can generate a periodic AC signal at different
frequencies. In this lab, we use the HP 33120A function generator. This is a versatile
instrument capable of generating sine, square, and other waveforms with frequencies up
to 15 MHz. The amplitude and offset of these waveforms can also be controlled easily.
The front panel of the function generator is shown in the figure below. A time-varying
periodic voltage signal will be generated and output at the OUTPUT connector. By
pushing the appropriate buttons on the front panel, the user can specify the following
characteristics of the signal:
Shape: sinusoidal, square, or triangular waves. These are all mathematical functions
of time.
Frequency: inverse of the period of the signal; units are cycles per second (Hz).
Amplitude: peak to peak value of the time-varying component of the signal.
DC Offset: constant voltage added to the signal to increase or decrease its mean or
average level.
10
A sine wave of frequency f, peak to peak amplitude VPP, and DC offset VDC is written
mathematically as v(t) = (VPP/2) × sin (2πf t) + VDC
When the function generator is turned on, the default output is a Sine wave at 1 kHz
with peak to peak amplitude of 100 mV.
To set a specific signal with desired characteristics, please follow the steps below.
a. To choose the waveform of the signal, press the key on the front panel labeled
with the corresponding waveform
b. Enable the frequency editing mode by pressing the Freq button.
c. To set the value of the desired frequency you can press the keys with left
right arrows to change the digit you want edit and turn the knob to change the
value of each digit. Then set the unit by pressing the keys with up and down
arrows.
d. To set a DC offset, press the Offset button. Then again use the arrow keys to
change the digit to be edited. And use the knob to change the value of
each digit.
The +/- button toggles the DC offset from a positive to a
negative value.
e. It is tricky to set up the signal amplitude because there is an internal 50 Ω
resistor RS in series with the oscillating voltage source. Therefore, if you connect
the function generator to an external resistor RL (or a circuit has an equivalent input
resistance of RL), it will form a voltage divider with RS, and the displayed Vpp value
will not be the actual signal value applied to RL. The purpose of RS is to have
impedance matching which is important for high frequency circuits. The front panel
display assumes the impedance matching condition, which is RS = RL and
always
displays a value half of the actual voltage source output. Therefore, if
the
load
resistance RL is not equal to RS, the displayed Vpp value is not the same as
the
signal amplitude on RL. So the value of Vpp to be set on the signal generator
needs
to be calculated based on the voltage divider circuit formed by RS and the load
resistance RL to get an appropriate desired Vpp on the load.
To set a peak-to-peak amplitude value, press the Ampl button. Use the arrow key to
change the digit and the knob to change the value.
11
Figure 15
(5) Oscilloscope
An oscilloscope is a device that graphs voltage versus time. The display shows voltage
on the vertical axis as a function of time on the horizontal axis. The user can control the
scale of both the time and the voltage axes.
The HP54645D oscilloscope used in this lab can accept two voltage-signal inputs (A1
and A2 connectors) and graph them simultaneously but independently.
To measure the signal at any node of a circuit, a BNC cable with two alligator clips will
be used. The red alligator is the signal hook and the black alligator is the ground clip. It is
very important to connect the ground clip first to the circuit ground. Only when the
oscilloscope and the circuit share the same ground (voltage reference), the measured
signal is stable and accurate.
To measure a signal accurately, first press A1 (if your cable is connected to A1 channel),
12
and then press the key below the probe menu on the bottom right of the screen until the
highlighted number is Auto 1. To display a voltage pattern properly, press Auto-scale
key. The oscilloscope will perform the measurement automatically. To get the
measured number, for example, the peak-to-peak or average value of the signal, press
Voltage on the top left and select the proper measurement shown on the screen.
Ground (zero) level together with the channel number will be indicated by a small
ground sign on left of the screen when the oscilloscope is on.
Auto-scale
Figure 16
4. Hands-on experiment guide
Part I: Instrument practice
a. Set up a DC voltage of 2.5 V with current limit of 0.5 A using the HP E3631A
power supply and then measure this DC voltage output using the digital
multimeter HP 34401A. Use the oscilloscope HP 54645D to measure the
same voltage (don’t forget to setup the probe menu to Auto 1 first). Use Vavg
in the voltage measurement function to get the DC voltage value. Make sure
the DC power supply OUTPUT OFF whenever you change the connection.
b. Use the HP 33120A function generator to generate a sinusoidal wave with
frequency of 1 kHz, output peak-to-peak amplitude of 2 V and the average
value centered at 1 V. Display this wave form on the oscilloscope. In order to
get a signal with amplitude of 2 V displayed on the oscilloscope, what
amplitude should be set on the function generator? In order to have the average
13
value centered at 1 V (signal amplitude minimum is 0 V), what offset value
should be set on the function generator? (Hint: If you have no clue how to get
this signal, start with amp Vpp of 2 V and offset 1 V and see what you observe
on the scope. Then you can adjust the function generator according to what
you see on the scope to get the desired signal waveform.)
c. Use the cursors to measure peak-to-peak voltage and the period of the wave
form. Calculate the frequency. Now take the same measurements using the
oscilloscope’s built-in peak-to-peak voltage, period and frequency
measurement functions. Record the results.
d. Read the color code to get the resistance values of all the resistors that are
provided. Measure the resistance using the digital multimeter Ohmmeter
function to verify your reading. Are they within the tolerance?
Part II Circuit design and measurement
a. Connect a 1 kΩ resistor with the power supply. Try to apply 1 V, 2 V, 3 V and 4
V to the resistor and use the multimeter to measure the current going through the
resistor in each case. Graph current vs. voltage. What does the slope represent?
Does it obey Ohm’s law?
b. Now connect the power supply with an LED (pick a color you like). Apply DC
voltage from 0 V to 3 V, with 0.1 V step size, and monitor the current going
through the LED. Do you see a threshold behavior? What is the threshold voltage
of the LED? Try to look at the LED from the top while you are changing the
voltage from 0 V to 3 V, how does the brightness change? Can you tell the
threshold from watching the light? (Hint: use your hand as a shield to cover the
LED so that you can see better with the room lights on.) Now reverse the
polarity of the power supply by switching the wires. What happens now when
you vary the voltage from 0V to 3 V?
Note: The current limit on the DC power supply should be set to 20 mA to
avoid damaging of the LED.
Optional: try different color LEDs and see if there is any difference on the
threshold voltage.
c. Apply 5 V ideal voltage source to a 1-kΩ resistor and an LED in series and see if
the LED lights up. Then put in one more 1-kΩ resistor in series with the other two
components and see if the LED is brighter or darker? And why? Now connect the
other two 1-kΩ resistors in parallel and then in series with another LED, is the
LED brighter or darker in this case compare to the previous two cases? Why?
d. Keep one resistor in series with an LED from the previous step (step c) and switch
the power supply to the function generator to build a blinking LED. Set a
sinusoidal signal with 0 V offset, 5 V Vpp and 5 Hz frequency on the function
generator. Human eye can detect signal rate < 40 Hz. Try to change the frequency
of the signal on the function generator to measure the upper limit of the frequency
that your eyes can detect.
e. Set the function generator to give 1-Hz sinusoidal signal output (the rest of the
setup is the same as previous step). Modify the circuit in the previous step (d) by
14
adding in one more LED (same color) so that two LEDs blinking in phase (on/off at
the same time). Can you make two LEDs blinking out of phase (on/off
alternatively)?
f. Set up the function generator with 5 V Vpp and 500 Hz sinusoidal signal, and then
hook it up to the speaker/buzzer. Change the signal frequency and listen to the
sound the speaker generated. Give a frequency range that your ears feel
comfortable with the sound. Keep the frequency at which the sound is loud and
enjoyable, and then change the signal pattern from Sin to Square, to Triangle to
Sawtooth and finally Noise. How are they different from each other?
Note: Don’t try to find the upper limit of your ears. Stop if you don’t feel
the sound is pleasant. Sound with too high frequency may damage your
hearing.
g. Now hook up the speaker/buzzer directly to the oscilloscope and use it as a
microphone. Try to speak, sing, whistle or breathe to the buzzer and look at the
signal pattern you generated on the oscilloscope. You may need to press the
Auto-scale button while you are performing to get a proper signal displayed on
the screen.
Appendix I
Component and equipment list
Component
Resistor
1 kΩ
4
Resistor
2.2 k Ω
1
Resistor
4.7 k Ω
1
LED
red/yellow/green
2
Speaker/Buzzer
1
Equipment
Power Supply HP E3631A
Digital Multimeter HP 34401A
Function Generator HP 33120A
Oscilloscope HP 54645D
Breadboard
15