1
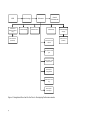
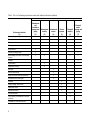
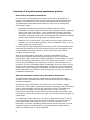
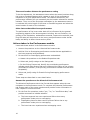
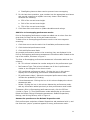
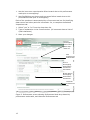
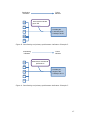
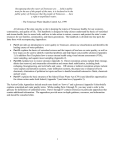
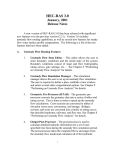
USACE Levee Screening Tool application guide and user’s manual: Performance module overview Chapter 3 Performance module overview 2 Contents Performance module overview ................................................................ 6 Purpose of the Performance module ...................................................... 6 Overview of the performance assessment process .................................. 9 Actions taken in the Performance module ............................................ 10 3 Tables Table 1. Performance modes and related performance indicators ................. 8 4 Figures Figure 1. Navigational flow chart for the Prior to Overtopping Performance modes ................................................................................... 7 Figure 2. Performance screen showing Performance Mode drop-down list, performance mode table, and Historical Performance tab ............ 12 Figure 3. The Performance Mode information table located above the Historical Performance tab has five columns. A performance mode is added to the table when the user selects a mode from the drop-down list. Click the CPI icon (circled) to work on the corresponding performance mode assessment. .......................... 13 Figure 4. After adding a performance mode to a screening, the Related Inspections, Ratings, and Driving Factors tabs display on the screen.................................................................................. 13 Figure 5. The Ratings tab contains drop-down boxes for selecting ratings and Justification text boxes for providing supporting information. .......................................................................... 14 Figure 6. Decision flow for assigning ratings to performance indicators ....... 15 Figure 7. Contributing and primary performance indicators: Example 1 ....... 16 Figure 8. Contributing and primary performance indicators: Example 2 ....... 17 Figure 9. Contributing and primary performance indicators: Example 3....... 17 Figure 10. Contributing and primary performance indicators: Example 4 ..... 18 Figure 11. On the Driving Factors tab, the user identifies which contributing performance indicators most influenced the rating given to the primary performance indicator. .............................. 19 5 Performance module overview Purpose of the Performance module Information about a levee segment’s performance is entered into the Performance module of the LST. The Performance module is organized into the Historical Performance tab, six Prior to Overtopping performance modes, and the Breach During Overtopping performance mode. The Closure systems performance mode is further divided into six subsections. Each levee segment is evaluated on up to six of the prior to overtopping performance modes, depending on the features that are present in the segment. All levee segments include the breach during overtopping performance mode. The prior to overtopping performance modes are: • Embankment and foundation seepage and piping • Embankment stability • Embankment erosion • Closure systems • Floodwall stability • Floodwall underseepage and piping The navigational pathway among the various performance modes is shown in Figure 1. Each of these performance modes has its own chapter in this application guide. For each of the prior to overtopping performance modes, there are multiple contributing factors, called performance indicators, that need to be rated with respect to performance under a full range of loading. For each performance mode, one of these performance indicators has been identified as the primary indicator. The primary indicator carries the highest weight among the indicators for a given performance mode. For example, to evaluate embankment erosion, the assessment team looks at three contributing indicators—sod cover, riprap revetments/bank protection, and revetments other than riprap, and the primary performance indicator— erosion/bank caving. The prior to overtopping performance modes and their respective performance indicators are shown in Table 1. The same three tabs—Related Inspections, Ratings, and Driving Factors—are used to assess the performance indicators for each Prior to Overtopping performance mode. However, the text appearing on the tabs changes depending on which performance mode is being assessed. To reach the Performance module from the Home page: 1. Click the Levee Screenings tab at the top of the page. 2. Click the edit icon for the desired levee segment. 3. Click the edit icon of the desired screening (or start a new screening). 4. Click Performance in the LST module navigation bar. 6 HOME Embankment & foundation seepage & piping Culvert assessment (embankment) Levee Screenings Embankment stability Performance Embankment erosion Historical Performance tab Floodwall stability Closure systems -‐ post and panel Closure systems -‐ culvert gate Closure systems -‐ soil pile and plastic sheet Closure systems -‐ stoplog/bulkhead Closure systems -‐ sand bag Closure systems -‐ moveable gate Figure 1. Navigational flow chart for the Prior to Overtopping Performance modes Floodwall underseepage and piping Culvert assessment (floodwall) 7 Table 1. Prior to Overtopping performance modes and related performance indicators Performance mode Embankment and foundation seepage and piping (2) Embankment stability (3) Unwanted vegetation growth x Encroachments Floodwall stability (6) Floodwall underseepage and piping (7) x x x x x x x Settlement x x Cracking x x Animal control x Culverts/ discharge pipes x Underseepage relief wells / toe drainage systems x Seepage x Performance indicator (1) Embankment erosion (4) Closure systems (5) x x x x Slope stability x Depressions/ rutting x Sod cover x Erosion/ bank caving x Riprap revetments and bank protection x Revetments other than riprap x Condition x Supply, storage, and security x Operational history x Miscellaneous items x Concrete surfaces x Tilting, sliding, or settlement of concrete structures x Foundation of concrete structures x 8 x Overview of the performance assessment process Goal of the performance assessment For each Prior to Overtopping performance mode that is applicable to a segment, the assessment team evaluates each performance indicator with respect to the likelihood of the indicator contributing to a potential failure. The assessment team takes these actions for each Prior to Overtopping performance mode: • Rates each contributing performance indicator and the primary performance indicator using information from inspection reports, historical events, and other information. Some contributing indicators should be rated with a “N/A” when they do not exist for the levee segment being evaluated. Examples would be the underseepage relief wells/toe drainage systems and culverts/discharge pipes contributing factors. • Identifies the “driving factors” of the rating for the primary performance indicator if it was evaluated as Highly Likely or Moderately Likely to occur under loading up to top of levee. For the Breach During Overtopping performance mode, the assessment team evaluates the likelihood of the levee breaching during an overtopping event using available information related to levee construction and existing condition of any armoring. After all the performance information has been entered and all the performance indicator ratings have been selected, the LST computes a performance index, which is the relative probability of levee breach, for each Prior to Overtopping performance mode. This performance index, is, in turn, used in the computation of the screening risk index—the end result of the screening. For more information about computation of the risk index, see the chapter Levee Screening Tool methodology. The Breach During Overtopping performance mode is qualitative information used by the decision makers to better understand risk related to levee overtopping, but does not impact the quantitative assessment. Data and information used in the performance assessment The assessment team develops the assessment ratings after all readily available project information has been reviewed and the routine inspection has been completed. Supporting project information can include, but is not limited to, design documents, as-built plans, construction records and photos, past performance history, instrumentation records, and flood fight reports. The assessment team should coordinate with the local sponsor(s) to ensure that the performance assessment ratings reflect the best available information; this information is often held by those who work on the flood protection project on a daily basis. The assessment team should not rely solely on past performance or lack of physical evidence when rating the primary indicator if the project has not been hydraulically loaded near the top in its current condition. This is particularly true when considering situations that worsen with time, such as vegetation growth and deterioration of culverts/discharge pipes that are within the embankment or under floodwalls. 9 The worst location dictates the performance rating To do the assessment, the assessment team selects the worst locations along the levee or floodwall segment with respect to each of the performance indicators for a given performance mode. The location selected for one performance indicator will not necessarily be the location selected for another indicator. Thus, one of the first steps undertaken by the assessment team is to evaluate the entire length of the levee or floodwall segment and select the worst location for each of the indicators. Other factors that affect levee performance The performance of the levee under load will be influenced by the general engineering aspects of the levee segment including, but not limited to, the geology of the foundation, embankment material, construction methods, how long the water will be present on the levee, past performance under similar loads, and ability to detect issues as they arise. Actions taken in the Performance module Users take these actions in the Performance module: 1. Answer the questions on the Historical Performance tab. 2. Add the Prior to Overtopping performance modes that are applicable to the levee segment being assessed. 3. For each Prior to Overtopping performance mode added: a. Answer the questions on the Related Inspections tab. b. Select and justify ratings on the Ratings tab. c. On the Driving Factors tab, identify the contributing performance indicators and other factors that most influenced the rating of the primary performance indicator (if the primary performance indicator was less than acceptable). 4. Select and justify rating for Breach During Overtopping performance mode. These steps are described in more detail below. Answer the questions on the Historical Performance tab The Historical Performance tab is the first tab that appears when the user navigates to the Performance mode. To complete the Historical Performance tab, answer each of the seven questions and provide further information in their respective Comments fields. 1. For the first four questions, select “yes,” “no,” or “insufficient data,” and provide comments to indicate whether: a. The levee segment has ever experienced failure due to any performance mode prior to overtopping. b. Floodfighting has ever been used to prevent failure due to any performance mode prior to overtopping. c. The levee has ever experienced an overtopping event. 10 d. Floodfighting has ever been used to prevent levee overtopping. 2. For the last three questions, type numbers into the appropriate text boxes and provide comments to explain how many times a flood loading exceeded the following: a. 25% of the current levee height. a. 50% of the current levee height. b. 75% of the current levee height. 3. Click Save after each action to update calculations and ratings. Add Prior to Overtopping performance modes Prior to Overtopping Performance modes are added one at a time from the drop-down list near the top of the performance screen. To add a Prior to Overtopping performance mode to the levee segment screening: 1. Click the arrow to see the entire list of available performance modes. 2. Click the desired performance mode. 3. Click Add Performance Mode. As you add performance modes to the screening, they are displayed in the Prior to Overtopping performance assessment information table located at the top of the module, as shown in Figure 2. The Prior to Overtopping performance assessment information table has five columns: • ID: This column indicates the number assigned to the performance type. • Performance Type: This column indicates one of the six performance modes or six subtypes of the closure mode. • CPI (conditional performance index): Clicking the icon in this column displays the corresponding performance mode assessment tabs. • PI (performance index): Shows the computed performance index, which includes the probability of loading. • Culvert Assessment: Clicking the icon in this column displays the culvert assessment tabs. • Delete: Clicking the icon in this column deletes the performance mode, and any information added previously to that performance mode’s tabs. To assess a Prior to Overtopping performance mode, click the CPI icon (circled in Figure 3). Three performance mode tabs display on the screen below the Breach During Overtopping assessment: Related Inspections, Ratings, and Driving Factors, seen in Figure 4. Answer the questions on the Related Inspections tab Each performance mode has a Related Inspections tab associated with it, and the same two “yes/no” questions appear for every performance mode: 11 1. Has the levee ever experienced a failure breach due to this performance mode prior to overtopping? 2. Has floodfighting ever been used to prevent failure breach due to this performance mode prior to overtopping? Each of the questions is accompanied by a Comments text box for identifying data sources and other pertinent information. So, to complete the Related Inspections tab: 1. Select “yes” or “no” from the drop-down list. 2. Type an explanation in the Comments box. (All comments have a limit of 4,000 characters.) 3. Save your changes. Prior to Overtopping Performance Mode dropdown list Add Performance Mode button Prior to Overtopping Performance assessment information table Breach During Overtopping Performance assessment Historical Performance tab Figure 2. Performance screen showing Performance Mode drop-down list, performance mode table, and Historical Performance tab 12 Figure 3. The Performance Mode information table located above the Historical Performance tab has five columns. A performance mode is added to the table when the user selects a mode from the drop-down list. Click the CPI icon (circled) to work on the corresponding performance mode assessment. Figure 4. After adding a performance mode to a screening, the Related Inspections, Ratings, and Driving Factors tabs display on the screen. Select and justify ratings on the Ratings tab The Ratings tab displays drop-down boxes and text boxes for each performance indicator that applies to the performance mode being assessed, as shown in Figure 5. It asks for two ratings: • Inspection rating: The inspection rating must be entered manually; it comes from the latest inspection report. • Assessment rating: The assessment rating is the rating the assessment team assigns to the performance indicators. Three possible assessment ratings: LL, ML, or HL There are three possible ratings to choose from for the assessment rating: 13 • Low Likelihood - LL: The assessor believes that it is unlikely that the indicator being rated will contribute to a failure for the performance mode being evaluated. An LL rating for the primary indicator in particular means that the assessor has a high level of confidence that the performance mode being evaluated will not occur under the full range of loading and duration of the flood event. • Moderate Likelihood – ML: A large amount of uncertainty exists about the potential performance of the levee under significant loads for the performance mode being assessed. The assessor believes that the indicator being rated may contribute to a failure for the performance mode being evaluated, but compelling evidence (e.g. existing studies or past performance) does not exist that supports a rating of highly likelihood of poor performance or low likelihood of poor performance. • High Likelihood - HL: The assessor believes there is a high likelihood that the indicator being rated could contribute to a failure for the performance mode being evaluated. A rating of HL for a primary indicator in particular means that the assessor believes the performance mode being evaluated will likely occur over the full range of loading and duration of the flood event. Figure 5. The Ratings tab contains drop-down boxes for selecting ratings and Justification text boxes for providing supporting information. To complete the information for each performance indicator shown on the Ratings tab: 14 1. Select a rating (A, M, or U) from the Inspection Rating drop-down list. 2. Select a rating (LL, ML, or HL) from the Assessment Rating drop-down list. 3. Type an explanation in the Justification text box. 4. Save your changes. Guidelines for selecting the proper rating 1. Rate each performance indicator in the context of the expected performance over the full range of loading, which includes the toe of the levee/wall to the top of the levee/wall. The most critical load case for most performance modes will be full hydrostatic loading, but there may situations where the worst load case is something less than water to the top of the levee. 2. Consider ratings for the contributing indicators before rating the primary indicator. For example, if one or more of the contributing factors receives an ML or an HL, the primary indicator will generally not receive an LL. If you decide an LL rating is appropriate in this situation, careful and thorough justification is required. 3. When determining which rating to apply to each contributing indicator, first see if an HL rating is appropriate. If a HL rating is not appropriate, next see if an LL rating is appropriate. If neither HL nor LL applies, select the ML rating. This process is summarized in Figure 6. 4. See the guidance in the individual chapters of this guide about how to rate each performance mode. Examine all available data and information about this performance indicator with respect to this performance Merits a HL rating? Yes Enter HL andjustify. Yes Enter LL and justify. No Merits an LL rating? No Enter ML and justify. Figure 6. Decision flow for assigning ratings to performance indicators 15 Link primary indicator ratings to contributing indicators’ ratings Although there are no hard and fast rules about linking the contributing performance indicators to the primary performance indicator, the rating for the primary indicator must be consistent with and reflective of the ratings for the contributing indicators. Some contributing indicators will carry more weight than others, and thus will have more influence on your selection of the primary indicator’s rating. In most cases, a HL rating for any of the contributing performance indicators will lead to an HL or an ML rating for the primary indicator. You will find that many of the reasons for rating a contributing indicator with a HL will also call for a HL for the primary indicator. In other words, it would be highly unusual to rate the primary performance indicator with an LL if a HL rating was given to any of the contributing performance indicators. Any exception to this generalization requires careful explanation of why the contributing indicator rated HL would not cause failure under a full hydrostatic load. When giving a HL rating for the primary indicator, justify the rating carefully and completely: what are the potential causes of failure under full hydrostatic loading, how is that failure likely to happen, and why. Similarly for an ML rating for the primary indicator, explain why, given an HL rating for one or more contributing indicators, the team believes, nevertheless, that the levee may perform satisfactorily in terms of the primary indicator. If you give an ML to one or more contributing indicators, you may decide to give the primary indicator an LL or an ML—in either case, a thorough justification is required. Figure 7 through Figure 10 illustrate how different combinations of contributing indicator ratings, combined with other performance factors that you may have information about, may influence the primary performance indicator’s rating. Contributing indicators LL Primar indicator y Other factors indicate good / OK performance LL LL -- Probably LL -- Might be ML -- Unlikely to be HL LL LL Figure 7. Contributing and primary performance indicators: Example 1 16 Contributing indicators LL Primar indicator y Other factors indicate good / OK performance ML -- Probably ML -- Less likely to be -- Unlikely to be HL LL LL ML LL Figure 8. Contributing and primary performance indicators: Example 2 Contributing indicators LL Primar indicator y Other factors indicate OK performance ML HL -- Probably HL -- Might be ML -- Unlikely to be LL ML LL Figure 9. Contributing and primary performance indicators: Example 3 17 Contributing indicators HL Primar indicator y Other factors indicate unsatisfactory performance ML HL -- Almost certaintly HL -- Highly unlikely to be ML -- Not LL ML LL Figure 10. Contributing and primary performance indicators: Example 4 Identify the “driving factors” for the primary performance indicator If the primary performance indicator was given an HL or an ML rating, check the box next to every contributing performance indicator that contributed significantly to the rating assigned to the primary indicator. If everything was rated LL, select “None” on the driving factors tab. For example, if you give an assessment rating of HL to seepage, which is the primary performance indicator under the Embankment and Foundation Seeping and Piping performance mode, because of a deteriorating underseepage relief well system, harmful encroachment, and extensive muskrat burrows, then you would check the boxes next to “animal control”, “encroachments”, and “underseepage relief wells/toe/drainage systems.” Figure 11 shows what the Driving Factors tab looks like with three items selected. 18 Figure 11. On the Driving Factors tab, the user identifies which contributing performance indicators most influenced the rating given to the primary performance indicator. 19