1
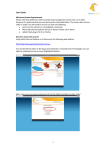
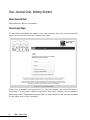
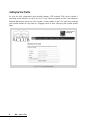
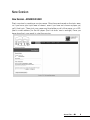
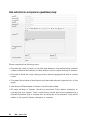
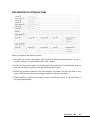
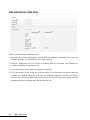
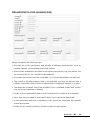
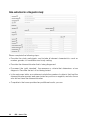
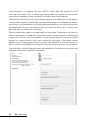
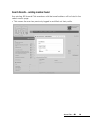
User Manual
The Journal Club
TABLE OF CONTENTS
Table of Contents........................1
Your Journal Club: Getting
Started........................................2
Search Results – existing member
found...................................................21
Search Results – no existing Journal
Club users found..............................21
About Journal Club.....................4
Invite Clicked......................................22
Home/Login Page........................4
Member Account Activation.....23
JBI Journal Club access denied page.5
User has clicked on “Activate my
account” from their email invite.....23
Forgot your Password?.....................5
Setting Up Your Profile.......................6
Session Selection.....................25
My Contacts................................6
Journal Club Session Members.......25
New Session...............................7
New Session - ADVANCED USER.............7
New Session – Journal Article
Report...................................................7
Data extraction for Intervention
studies................................................11
Data extraction for an Experience
(qualitative) study.............................12
Journal Club Session – Starting the
Discussion...........................................25
User has clicked Post Comment
button.................................................26
Appendix I: Understanding the
appraisal questions..................26
Prognostic Studies...........................26
Risk Studies.........................................27
Data extraction for a Prognosis
study...................................................13
Intervention Study............................28
Data extraction for a Risk study....14
Experience Study................................32
Data extraction for a Cost
(economic) study................................15
Diagnostic study................................33
Cost Study..........................................29
Systematic Review..............................35
Data extraction for a Diagnostic
study...................................................16
Data extraction for a Systematic
Review..................................................17
Inviting Members to join a JBI
Journal Club Session................20
Journal Club – JBI
1
Your Journal Club: Getting Started
About Journal Club
Welcome and “about” information
Home/Login Page
To save time bookmark this page in your web browser then you can conveniently
return to the Journal Club log in page at any time.
Enter your username and password, or use the retrieve password functions if
necessary. If your using a shared computer in the public domain, we recommend
you do not select “Remember me next time” or your password will become available
for any other user of that computer.
2
JBI – Journal Club
JBI Journal Club access denied page
In the unlikely event that you see the “Access Denied” page, it does not mean there
is a problem with your log in, it may just mean you need to email us to confirm your
authentication. Please DO contact JBI by clicking the link <Contact Us> illustrated
in the image below if you see this screen.
Forgot your Password?
It happens to us all occasionally! Just return to the home (log in) screen and use the
forgotten password function.
Journal Club – JBI
3
Setting Up Your Profile
As you do with computers and mobile phones, JBI Journal Club works better if
you take a few minutes to set it up first. It only takes a minute or two, and requires
minimal data input from you; the system is then ready to go! You can also change
your profile details at any time by logging back in and choosing the profile menu
item.
4
JBI – Journal Club
New Session
New Session - ADVANCED USER
Start a session by creating a session name. Often these are based on the topic area,
so if you know your topic area of interest, even if you have not chosen a paper yet,
call it that topic. Then pick your paper and load either a pdf of the paper, or a URL
(that’s a web address) for the full paper (Don’t do both, one is enough). Once you
have done that, your ready to start the session.
Journal Club – JBI
5
New Session – Journal Article Report
You have started a new session, given it a session name, and selected an article for
discussion. JBI Journal Club is designed to facilitate your assessment of the quality
of a paper and provide a framework for the extraction of data on relevant clinical
outcomes. The next few steps describe how to do this, and as you do, the Journal
Club software will prepare and format the report that supports and informs your
Journal Club discussion for you.
Firstly, extract the “Citation” details. This means the authors, the title of the paper,
the year it was published, the name of the journal, and where available, the Volume,
Issue and page number (this is the first page of the article). Not all journals report an
issue number in the article, so you can leave this field blank. The ‘Study Design’ drop
down is important! Read the paper, confirm what type of study it is, then select from
the drop down list. The table of study designs listed below will help with choosing a
study design. There is a brief operational definition for study designs in Appendix I
that may also be helpful.
6
JBI – Journal Club
Table 1: Study designs in JBI Journal Club
Intervention
These are studies on the effects or effectiveness
of health care practices or technologies on patient
outcomes. The data is always numeric.
Randomised Controlled
Trials, with or without
blinding
Qualitative research
Phenomenology, Grounded
Theory, Ethnography,
Participatory Action
Research, Feminist Inquiry,
Historical Research,
Philosophical Research,
and Critical Social Theory
These are studies on experiences, perceptions,
culture, or understandings. The data of interest is
always textual descriptions, not numbers.
Economic
These are studies on costs, or cost associated
measures of quality
Cost Benefit, Cost Utility,
Cost Minimisation, Cost
Effectiveness
Prognosis
These are studies that attempt to determine the
effect of prognostic (risk) factors on the outcome
of disease or injury
Cohort, Case Control
Risk
These are studies that examine the cause or origin
of a disease. They answer the question about risk
of exposure to a particular disease.
Cohort, Case Control
Diagnosis
These are studies that examine the accuracy and
reliability of diagnostic tests.
Systematic Review/Meta analysis
Cohort, Case Control
Quantitative Systematic
Review of Randomised
Controlled Trials (with or
without Meta analysis)
Choosing the study design ends step 1. The study design forms a heading in
subsequent steps to further clarify the choice of study type. The very next step is
based on your choice of study type here, so take the time to confirm your choice!
Journal Club – JBI
7
With the study design selected, it is now time to evaluate the quality (Internal
Validity) of your chosen paper. Tool tips are available for many of the fields in the
appraise and extract steps. Appendix I to this Quick Reference Guide also contains
a comprehensive description of each appraisal question for each study design, it
might be helpful to print those pages out as you go through this step in JBI Journal
Club. Not every paper will be a ‘yes’ or ‘no’ response, sometimes its better to put
‘unclear’, or if you think a question has less relevance, choose ‘N/A’. Once this is
complete, use the drop down menu to choose whether the paper is of good quality,
poor quality, or could be used with caution.
8
JBI – Journal Club
Data extraction for Intervention studies
Please complete the following steps:
• Describe the type of study eg. RCT, pseudo RCT etc.
• Describe the total number of study participants and include all relevant
characteristics such as number, gender, co-morbidities and study setting.
• Describe the interventions being compared; up to three interventions can be
documented. A range of outcomes can be detailed.
• In the box titled ‘dichotomous data’, details of outcomes where an event rate is
provided should be documented; that is, there is a number that had the outcome
present/number that received the specific intervention. For example if 30 patients
received intervention 1, and 5 had the outcome of infection, then 5/30 would be
documented in the box for the first outcome and intervention 1.
• For continuous data a mean and standard deviation are required with the number
receiving that intervention in brackets. Document p values for each outcome
measure.
Journal Club – JBI
9
Data extraction for an Experience (qualitative) study
Please complete the following steps:
• Describe the study in terms of the following elements: the methodology, method
of data collection and method of data analysis used to derive findings or themes.
• Describe in detail the study setting and any relevant geographical and/or cultural
issues.
• Document the number of participants and describe relevant characteristics of the
group.
• Interventions/Phenomena of interest should be described.
• All major findings of themes should be described. Each theme, metaphor or
concept that you “extract” (that is write down) should also be accompanied by a
relevant illustration (that is a quote from a participant in the research study which
relates to the specific theme, metaphor or concept.
10
JBI – Journal Club
Data extraction for a Prognosis study
Please complete the following steps:
• Describe the study participants and include all relevant characteristics such as
number, gender, co-morbidities and study setting.
• Detail the disease/condition of interest and the outcomes to be predicted. If more
than one disease/condition use the additional text boxes.
• Name the disease/condition and the relevant outcome. Include the time to the
event if relevant and the percentage of patients with the outcome.
• State the 95% confidence interval if known. Indicate for each of the outcomes if
they are independent.
Journal Club – JBI
11
Data extraction for a Risk study
Please complete the following steps:
• Describe the study participants and include all relevant characteristics, such as
number, gender, co-morbidities and study setting.
• Detail in ‘exposure’ the risk factor of interest and in ‘outcome’ the disease or
condition relating to the exposure.
• In the outcomes box name the disease/condition.
• Fill in the results of the study as far as possible. As a minimum you must have the
number of subjects exposed that had the disease/condition present and those
who did not and those that were not exposed to the risk factor and again had the
disease/condition present and those who did not.
12
JBI – Journal Club
Data extraction for a Cost (economic) study
Please complete the following steps:
• Describe the study participants and include all relevant characteristics such as
number, gender, co-morbidities and study setting.
• All economic evaluations are taken from a given perspective, e.g. the patient, the
service provider etc; this should be documented.
• Document the currency and the study date. Up to three interventions can be listed.
• The source of the effectiveness data is documented, and may be derived from a
primary concurrent study or even a meta-analysis combing a number of studies.
• The measure of benefit should be included if this is available (lower level studies
may not have a measure of benefit).
• Details of the clinical effectiveness of the intervention/s should be documented.
• Items that were included in direct and indirect costs should be described.
• In the outcomes table the comparative costs should be listed and the benefits
where appropriate.
• Details of cost benefit synthesis should be given as appropriate.
Journal Club – JBI
13
Data extraction for a Diagnostic study
Please complete the following steps:
• Describe the study participants, and include all relevant characteristics such as
number, gender, co-morbidities and study setting.
• Describe the disease/disorder that is being diagnosed.
• Document the ‘gold standard’, the measure or criteria that determines a true
diagnosis. Describe the test of tool being tested.
• In the outcomes table, as a minimum include the number of subjects that had the
disease/disorder present and were tested as positive or negative, and also those
who did not have the disease/disorder.
• Complete in the boxes provided any additional results you can.
14
JBI – Journal Club
Data extraction for a Systematic Review
Please complete the following steps:
• Enter the type of study that has been used in the systematic review e.g.
Randomised controlled trial, or quasi-experimental design.
• Describe the study setting in detail (institution, city, country).
• Describe the intervention and the control or placebo being compared.
• Only enter outcomes that are relevant to your interest. For example, if your interest
is in the effectiveness of propofol versus midazolam in maintaining sedation in adult
ventilated patients in the intensive care unit. Only include outcomes specifically
about sedation.
• For each relevant outcome, enter one or more outcome measures. For the above
example, an outcome measure might be the Ramsey sedation scale. There are
two different categories into which data can be entered; dichotomous, the sort of
data that is either one or the other, i.e. yes/no, or continuous, the sort that uses a
scale for its outcome, such as weight, blood pressure, pulse.
• For dichotomous data enter the number that had the outcome present/number that
received the specific intervention. For example if 30 patients received intervention
1 and 5 had the outcome of infection then 5/30 would be documented in the
box for the first outcome and under Intervention. The same needs to be done for
Control/Placebo. Extract further data from the systematic review (if it is present).
Enter the Peto Odds Ratio, Confidence Interval (CI-%), Chi Square (degrees of
Freedom), and the P value.
• For continuous data, enter the Weighted Mean Difference (WMD), Confidence
Interval (CI-%), Chi Square (degrees of Freedom), and the P value.
Journal Club – JBI
15
Once extraction is complete click the <NEXT> button and JBI Journal Club will
load the final screen. This is where you, having read the papers discussion and
conclusions summarise what the author concludes about their findings.
There are also fields for you to describe the strengths and weaknesses of the papers
internal validity (quality). Additionally, you may either support or challenge the authors
conclusions or interpretations as being either appropriate for the study design and
implementation, or you can indicate that you think the author got it wrong, and
describe why you think that is the case.
The last three fields relate to the applicability of the paper. There are no set rules on
what to document, consider how these fields relate to your purpose in initiating the
journal club session, who the members of your journal club session are and what
aspects of practice and/or policy are covered by the paper. If the paper seems
relevant from a learning perspective, but has low relevance to clinical practice or
policy, state this and make it a focal point of the discussion sessions on the paper.
Free text fields (without character limit) are available for the author conclusions and
appraiser conclusions relating to the paper.
16
JBI – Journal Club
Once all steps are completed the Generate option is available.
The generated report is viewable in PDF and can be viewed (and printed) by all
members of the journal club from the PDF.
Members of a Journal Club are now able to log in, read the paper, your Journal Club
Report on the paper and start the discussion. These two documents form the basis
of the discussion. Many Journal Clubs meet face to face, or you can use the online
discussion forum built in to the JBI Journal Club process, and have an on-going
record of each session archived for you. The discussion can not start until you have
‘Invited’ members to participate! The following section of this user guide provides
the detail on how to invite members, or if you are familiar with this already, you can
skip this section.
Journal Club – JBI
17
Inviting Members to join a JBI Journal Club Session
Invites are only sent by the Journal Club Session Chair. Members can either remove
themselves, or be removed from a session by an advanced user who is the Journal
Club Session Chair.
• Members who are removed from a specific Journal Club Session will remain part
of any other sessions that belong to the Journal Club
Members of any permission level can remove themselves from a session
• Except if they are the Chair of that Session.
To set up your session membership, click the <Invite Members> link on your
session and enter a valid email.
• Must enter a valid email address and then click “Search”
18
JBI – Journal Club
Search Results – existing member found
Any existing JBI Journal Club members with that email address will be listed in the
search results page.
• This means the user has previously logged in and filled out their profile.
Journal Club – JBI
19
Search Results – no existing Journal Club users found
• If there are no results, the person you invited has not previously created a profile in
JBI Journal Club. There is an option to email an invitation to ‘new’ members.
• To send an invite to the Journal Club click “Invite [email] to this Journal Club”
• Members (both existing and non existing) who have already been sent an invite
for another session in the same Journal Club will be highlighted as “Invitation
already sent”.
20
JBI – Journal Club
Invite Clicked
There is a default template for inviting members. The template will add your name
(based on your profile) as the sender
• Existing Journal Club members will simply be asked to login to the Journal Club
• Non existing members will be sent an activation link containing extra instructions
• All invited Members will appear under “My Contacts” as “pending”
– Users will be pending until they log in/activate their account
Journal Club – JBI
21
Member Account Activation
Members must activate or confirm their account before they can participate in a
Journal Club Session. This may be via the email invitation, and if from an existing JBI
COnNECT+ member, the log in username and password are the same as your JBI
membership username and password.
User has clicked on “Activate my account” from their email invite
VERY IMPORTANT:
Existing JBI COnNECT+ members must login rather than go through
account activation.
Account activation should only be used by non-members.
Existing JBI COnNECT+ members who have been invited via email
will be linked to the invites (as long as they enter the same email
address that the invite was sent to.) They simply need to login at the
main screen and fill out their profile.
Completing the activation form as illustrated in the following graphic does the
following:
1. C
reates a Profile in the Journal Club with the First Name, Last Name, Email,
Location details
2. S
ets the “Pending User” as Account Activated (see below)
3. A
utomatically adds the user to each journal club they have been invited to
4. A
utomatically adds the user to each “Current” (non archived) Session in each
Journal club they have been invited to
5. A
utomatically logs the user into the Journal Club using their newly created
username/password
6. Takes the user to the Home screen
22
JBI – Journal Club
Journal Club – JBI
23
Session Selection
Journal Club Session Members
Members are people who have been invited via email to Join a JBI Journal Club
Session, have responded to the email and created a profile are now ready to join the
session. This is done by clicking on the title of the session from their list of available
sessions. Selecting from the left hand column of sessions will load the selected
session and the <Post Comments> button that activates the discussion.
• Only “Discussion Started” sessions are available to Journal Club Members
24
JBI – Journal Club
Journal Club Session – Starting the Discussion
When an invited Journal Club Session Member has clicked “Start Discussion” on an
existing Session.
• They are automatically added to the members
• The Session Chair can no longer edit the session
– Sessions can be “Closed” (archived) at any time
User has clicked Post Comment button
This is also a timely opportunity to commence the discussion section. You may need
to be the initiator, and make the first post.
• Comments can be deleted if:
– Comment was made by the person who is logged in OR
– The person who is logged in is the Chair of the session
Journal Club – JBI
25
Appendix I: Understanding the appraisal questions
Prognostic Studies
As Mak and Kum (2005) in the World Journal of Surgery described them, prognostic
studies include specific characteristics and have a particular purpose that helps in
identifying whether the study you are reading is a prognostic study or not.
Prognostic studies are studies that examine selected predictive variables or risk
factors and assess their influence on the outcome of a disease. They allow clinicians
to understand better the natural history of a disease, guide clinical decision-making
by facilitating the selection of appropriate treatment options, and allow more
accurate prediction of disease outcomes. Appraising prognostic studies involves
determining the internal validity of the study design and evaluating the influence of
systemic errors or bias. In studies examining multiple prognostic variables, care must
be taken to minimize the confounding influence each variable would have on the
other parameters. Evaluating the results of appropriate statistical analysis enables
conclusions to be made that may influence clinical practice. Care must be taken
to ensure that the conditions under which the prognostic study were conducted
resemble circumstances in the local institution so as to allow the conclusions to be
applied to local practices.
The choice of study method is appropriate
Indicators: usual types of studies include cohort/survival studies.
The population studied is appropriate
Indicators: the population is sufficiently broad in representation. Relevant variables
include age, sex, ethnicity, culture, and socio-economic status.
The comparison group used was appropriate
Indicators: if a comparison group is receiving an alternative therapy, this group is
otherwise sufficiently similar so as to act as a control for the comparison. A type 1
and/or type 2 error and risk of bias has been considered.
All possible effect explanations are acknowledged
Indicators: the study addresses any additional factors that may impact on the
outcomes. Do events unfold similarly for both control and intervention group
throughout the study – i.e. were there any uncontrolled factors that influenced one
group differently to the other group?
26
JBI – Journal Club
The outcomes are objectively measured
Indicators: where possible, those measuring the outcome(s) were blinded to
the subject’s clinical characteristics or treatment group. An even more rigorous
approach is ‘double-blinding’, when both subject and investigator do not know to
which treatment group the subject is allocated.
The duration of follow-up was adequate
Indicator: the follow-up was for a period that would allow the outcomes to occur.
The effect was sufficiently long term
Indicator: the effect or outcome measures are not inconsequential.
The dropout rate was not significant.
Indicator: generally a drop out rate of 5% or less is considered insignificant. A drop
out rate of 20% or greater is considered to significantly impact on the validity of the
study.
The rate of patient follow up was adequate.
Indicator: at least 80% of patients were followed up.
Risk Studies
Studies of risk examine the cause or origin of a disease in relation to an exposure
The choice of study method is appropriate
Indicators: usual types of studies include cohort or case control.
The population studied is appropriate
Indicators: the population was sufficiently broad in representation.
The control group used was appropriate
Indicators: the comparison group was determined to be sufficiently similar at
baseline.
All possible effect explanations are acknowledged
Indicators: the study addresses any additional factors that may have impacted on
the outcomes.
The outcomes are objectively measured
Indicators: those measuring the outcome were, where possible, blinded to the
patient’s clinical characteristics.
Journal Club – JBI
27
The duration of follow-up was adequate
Indicators: the follow-up was for a period that would allow the outcomes to occur.
The effect was sufficiently long term
Indicators: the effect or outcome measures were not inconsequential.
The dropout rate was not significant
Indicators: Generally a drop out rate of 5% or less is considered insignificant. Arate
of 20% or greater is considered to significantly impact on the validity of the study.
The rate of patient follow up was adequate
Indicators: At least 80% of patients were followed up.
Intervention Study
An intervention study is a randomised controlled trial that tests the effects of an
intervention against a specific clinical outcome. As Sibbald and Roland (1998) in a
BMJ publication indicated, properly designed randomised controlled trials are the
most rigorous way of determining whether a cause-effect relation exists between
treatment and outcome and for assessing the cost effectiveness of a treatment.
Sibbald and Rolland (1998) go on to describe the key features and benefits.
Random allocation ensures no systematic differences between intervention groups
in factors, known and unknown, that may affect outcome. Double blinding ensures
that the preconceived views of subjects and clinicians cannot systematically bias
the assessment of outcomes. Intention to treat analysis maintains the advantages of
random allocation, which may be lost if subjects are excluded from analysis through,
for example, withdrawal or failure to comply.
The patients were randomised to study groups
Indicator: the method of patient allocation is detailed sufficiently to demonstrate
that it was without bias. Note that in some cases, full randomisation might be either
unfeasible or inappropriate for the intervention of interest.
Allocation to treatment groups was concealed from the allocator
Indicators: the person allocating each participant to treatment groups was unaware
of which participant was allocated to which group, in an attempt to eliminate
selection bias.
Other than for the intervention/s of interest, participants were treated the same
Indicators: there were no additional treatments given to one group in comparison to
another, apart from that treatment being tested.
28
JBI – Journal Club
The groups were comparable at entry
Indicators: there were no measurable differences in the characteristics of the different
treatment groups. For example, in the examination of a new wound dressing, it is not
appropriate to have a treatment group of young, healthy participants, and a control
group of elderly participants with peripheral vascular disease.
The outcomes were measured in the same manner for all participants
Indicators: There was no difference in the way participant outcomes were measured.
Participants cannot be compared if outcomes are measured differently between the
groups.
Those assessing outcomes were blinded to the treatment allocation
Indicators: those assessing participant outcomes were unaware of the treatment
group that the participants were allocated to. Concealing allocation from the
assessors further reduces the chances of bias. In certain situations it may be
impossible to blind the assessor to the treatment allocation.
The outcomes were measured in a reliable manner
Indicators: a recognised, validated tool was used for measuring the outcomes. For
example, when measuring a patient’s level of consciousness, the Glasgow Coma
Scale is a widely recognised tool.
The statistical analysis used was appropriate for the data presented
Indicators: there are a variety of statistical analyses available; the one(s) chosen were
appropriate to the data being presented.
The dropout rate was not significant
Indicators: generally a drop out rate of 5% or less is considered insignificant. Arate of
20% or greater is considered to significantly impact on the validity of the study.
The rate of patient follow up was adequate
Indicators: at least 80% of patients were followed up.
Cost Study
Cost studies may investigate methods to reduce or minimise costs (cost minimisation
studies). They may also investigate what the direct costs of an intervention are (cost
utility), or measure the comparative costs of two interventions to see which is cheaper
and/or better (cost benefit). Comprehensive analyses of costs are more complex
in their reporting of the balance between costs and outcomes as determined by
Quality Adjusted Life Years (cost effectiveness).
Journal Club – JBI
29
The question is well defined
Indicators: is it clear what interventions/programs and outcomes will be examined in
terms of cost effectiveness? Many economic studies are conducted in conjunction
with clinical trials. The economic evaluation may relate to all or only part of the trial
conducted. The research question stated in the paper often relates to the primary
clinical trial and not the economic evaluation.
There is a comprehensive description of alternatives
Indicators: all interventions subject to the economic evaluation must be
comprehensively described. Some interventions can be administered in a variety
of ways that will impact on cost. Consider issues of duration and frequency of the
intervention and mode of delivery, including level and type of practitioner. Consider if
a ‘do nothing’ alternative is appropriate.
All important and relevant costs and outcomes for each alternative are
identified
Indicators: in delivering even a single simple intervention there are a variety of direct
and/or indirect costs incurred. An intervention may also result in benefit that reduces
cost. An example of an ‘avoided’ cost is an intervention that reduces the rate of
infection and subsequently reduces the cost of managing the infection. Consider
costs to the health provider, the individual receiving the intervention and potentially
the individual’s family also.
Clinical effectiveness has been established
Indicators: any measure of clinical effectiveness used in the economic evaluation
of clinical effectiveness. It may be that one alternative clinical intervention is more
effective than another or that both are equally effective. Either way, examine the
evidence to support this position. If this evidence is based on a concurrently run
clinical trial then the report should provide enough information to appraise the quality
of the trial. If the evidence is derived from a systematic review, then make a judgment
about the quality of the review if possible.
Costs and outcomes are measured accurately
Indicators: a description is given of how costs were derived. Any items included
in the costing should have the ‘price’ or cost per unit reported separately from
quantities used. This will assist in making judgments about the accuracy of measures.
Consider the appropriateness of the physical units costed. Were they actual costs or
estimates based on modeling? If costs were estimated, is the method logical?
30
JBI – Journal Club
Costs and outcomes are valued credibly
Indicators: the value of a cost or an outcome may vary depending on the perspective
used to derive the value. In considering the outcome of pain, for example, this may
be valued in terms of the cost of analgesia (provider’s perspective). For the patient
the emphasis is more likely to relate to the physical and emotional impact of pain.
Costs and outcomes are adjusted for differential timing
Indicators: some interventions are ongoing and can incur costs into the future.
Costs may be expected to change over time and therefore must be adjusted or
‘discounted’ to their value at the time of the intervention.
There is an incremental analysis of costs and consequences
Indicators: in some cases it is appropriate to use the average cost of an intervention,
and in other cases the marginal (additional) cost of providing the intervention is
more appropriate. The incremental cost is determined by establishing the difference
between the marginal costs and consequences of the alternative interventions. If
this approach is taken it must be justified.
Sensitivity analyses were conducted to investigate uncertainty in estimates
of cost or consequences
Indicators: in some economic evaluations, certain costs and consequences are
estimated on values that may vary over a range or have some degree of uncertainty.
These elements in the evaluation are estimated using various assumptions. A
sensitivity analysis is conducted to test the robustness of the result of the evaluation
by varying these underlying assumptions.
Study results include all issues of concern to users
Indicators: this issue in part relates to perspective, and the interests of all stakeholders
must be considered. There may be important ethical and cultural considerations.
The results are generalisable to the setting of interest in the review
Indicators: economic evaluations are conducted within a given context, taking into
account a given population, healthcare setting, time and other elements that can
impact on the generalisability of the results. In considering the clinical question that
prompted the review of the economic evaluation, these elements must be considered
in determining how widely the results can be used.
Journal Club – JBI
31
Experience Study
These are qualitative studies. Qualitative studies are approaches to research that
seek to inform or extend our understanding of how people experience. Greenhalgh
(1997) in a very helpful paper published in BMJ outlined the following characteristics
attributable to qualitative research: it aims to “study things in their natural setting, to
make sense of, or interpret, phenomena in terms of the meanings people bring to
them,” and uses “a holistic perspective that seeks to preserve the complexities of
human behaviour.”
There is congruity between the stated philosophical perspective and the
research methodology
Indicators: the report clearly states the philosophical or theoretical premise on which
the study is based. The report clearly states the methodological approach adopted
on which the study is based. There is congruence between the two.
There is congruity between the research methodology and the research
question or objectives
Indicators: the study methodology is appropriate for addressing the research
question. For all studies there will be one methodology that is most appropriate to
answer the research question being posed.
There is congruity between the research methodology and the methods used
to collect data
Indicators: studies that fall in the interpretive paradigm cover a variety of approaches
and methods of data collection. The methods of data collection are appropriate to
the study methodology.
There is congruity between the research methodology and the representation
and analysis of data
Indicators: the data is analysed and represented in ways that are congruent with the
stated methodological position.
There is congruity between the research methodology and the interpretation
of results
Indicators: the research methodology is consistent with the methods used to
interpret the data. For example, if the research methodology of phenomenology
is used, the interpretation of the results is in line with traditional methods within
phenomenology.
32
JBI – Journal Club
There is a statement locating the researcher culturally or theoretically
Indicators: the researcher’s cultural or theoretical background is clearly stated if it
may have an influence on the study.
The influence of the researcher on the research, and vice versa, is addressed
Indicators: does the researcher have an effect on the results of the research? A
statement on their position must be made.
Participants and their voices are adequately represented
Indicators: the authors use direct quotes of the participants to validate points that
have been made.
The research is ethical according to current criteria or, for recent studies,
there is evidence of ethical approval by an appropriate body
Indicators: there is a statement regarding the attainment of ethical approval.
Conclusions drawn in the research do appear to flow from the analysis, or
interpretation of the data
Indicators: what is being concluded from the research is consistent with the data
presented.
Diagnostic study
Diagnostic studies can be challenging to identify. One useful definition for diagnostic
studies is that they are studies that assess how accurately a test distinguishes
humans (or animals) having a condition or disease, from those who do not. Typically,
the test under evaluation is called the index test and its results are compared to
the results of the best available standard test (reference standard), which defines
the condition or disease. (accessed online 26/09/2011; http://www.cochrane.org/
news/blog/embase-introduces-diagnostic-test-accuracy-study-indexing-term).
The choice of study method is appropriate
Indicators: in a diagnosis study the test results from a group of subjects affected by
a clinical condition are compared to the test results from a normal group of subjects.
The aim of a diagnosis study is to determine how readily the test results confirm the
presence of the condition.
The population is appropriate
Indicators: the population is sufficiently broad in representation.
Journal Club – JBI
33
The control group used was appropriate
Indicators: if a comparison group is receiving an alternative therapy, this group is
otherwise sufficiently similar. The most important feature of the control group is that
they are free from the condition. The control group must be matched to the affected
group in terms of known risk factors predisposing them to the condition.
A type 1 and/or type 2 error and bias has been acknowledged
Indicators: any Type 1 error is acknowledged and justified. Due consideration is
given to the selection of the Type 1 error. A power analysis was conducted, using
sample sizes large enough to detect differences that actually occur between the
control and affected group.
All possible effect explanations are acknowledged
Indicators: the study addresses any additional factors that may impact on the
outcomes. For example, in studies where a cut-off in a diagnostic value is used,
is the calculation of the cut-off value objectively or subjectively assigned? Also,
consideration must be given as to how each population was derived. If the affected
population consists of people that are severely affected by the disease, the findings
may not be applicable over a wide range of patients.
The outcomes are objectively measured
Indicators: Those measuring the outcome are where possible blinded to the patient’s
clinical characteristics. Both study groups undergo the same treatment; i.e. both
receive the diagnostic test and the reference standard evaluation. The diagnostic
test is conducted and interpreted in ignorance of the results of reference standard
and vice versa, i.e. the comparison is ‘blinded’.
The duration of follow-up was adequate
Indicators: the follow-up was for a period that would allow the outcomes to occur.
The effect was sufficiently long term
Indicators: the effect or outcome measures were not inconsequential.
The drop out rate was not significant
Indicators: generally a drop out rate of 5% or less is considered insignificant. A rate
of 20% or greater is considered to significantly impact on the validity of the study.
The rate of patient follow-up was adequate
Indicators: at least 80% of patients were followed up.
34
JBI – Journal Club
Systematic Review
Its useful to start with an operational definition, although most people are probably
comfortable with what a systematic review is.Helpfully, Trish Greenhalgh has
written about this also. She stated in a 1997 BMJ publication that a systematic
review is an overview of primary studies which contains an explicit statement of
objectives, materials, and methods and has been conducted according to explicit
and reproducible methodology.
Question
Well formulated
Indicators: the question gives a clear understanding of what the review was trying
to achieve.
Clearly documented in the report
Indicators: the question is clearly visible within the review report. This guides the
review, and must be evident.
Search Strategy
Two-phase search strategy is described
Indicators: a two-phase search strategy is the minimum requirement, and includes
an initial search to establish appropriate search terms and a second search of all
relevant databases.
Phase 1 search terms appropriate
Indicators: the search terms are specific to the topic in review.
Phase 2 was relevant and exhaustive
Indicators: the search strategy covers all aspects of the topic in review.
Accessed a broad number of databases
Indicators: the databases match the area of practice that is of concern, including all
the major (broad) and minor (topic specific) databases.
References and bibliographies were searched
Indicators: this is clearly documented.
Unpublished literature was sourced
Indicators: the strategy for accessing unpublished literature is clearly defined.
There is reference to languages searched
Indicators: if studies using languages other than the reviewer’s first language are
sourced, then they are documented. If not, then this is justified.
Journal Club – JBI
35
Inclusion Criteria
Describes who the target population were
Indicators: this includes relevant demographic, disease/condition and intervention
characteristics.
Describes the intervention/s in detail
Indicators: it is clear what intervention/s were being reviewed, and that they are
appropriate for the patient group.
Describes the outcomes in detail
Indicators: all outcomes are stated and relevant to the interventions reviewed.
States the study design/s
Indicators: it is clearly stated what study designs were to be included and what level
of study was considered as unacceptable.
Describes the exclusion in detail
Indicators: the decisions about the inclusion criteria are justified in terms of the
objectives of the review and any exclusions are also justified.
Critical Appraisal
Method was appropriate
Indicators: the criteria used are specific to the design of the included studies.
Method clearly reported
Indicators: the methods used in the report are stated.
Any checklists or tools used are reported
Indicators: all tools used are documented; this is often in the appendices.
Determined by two independent reviewers
Indicators: two independent reviewers have performed the critical appraisal process
in an attempt to maintain consistency and eliminate bias.
Data Extraction
Methods were used to minimise errors
Indicators: a recognised and agreed upon data extraction tool is used in an attempt
to minimise errors, often in the appendices.
Methods were clearly reported
Indicators: all tools used are documented; this is often in the appendices.
36
JBI – Journal Club
Double data entry by two independent reviewers
Indicators: two independent reviewers have performed the data extraction process
in an attempt to maintain consistency and eliminate bias.
Data Synthesis
Results from individual studies are reported in a narrative, tabular or statistical
summary
Indicators: if studies could not be pooled statistically, the results are clearly
reported.
The review question has been answered
Indicators: the results of studies provide evidence that directly informs the review
question.
If meta-analysis was undertaken
It was appropriate to combine studies
Indicators: if studies were combined the study samples, interventions and outcomes
are very similar (clinical homogeneity).
The methods were appropriate
Indicators: there are a variety of statistical methods available; their use is logical and
appropriate.
The methods were reported
Indicators: the above methods used in meta-analysis are reported.
Studies were tested for heterogeneity
Indicators: this determines that the studies combined were sufficiently statistically
similar.
For All Studies
Summarises major findings of review
Indicators: any major findings of the review are summarised and included in the
report.
All issues of importance are addressed
Indicators: the report includes all issues that are seen to be of importance.
Limitations are acknowledged
Indicators: the review includes a list of what are seen to be the limitations of the
study. This then acknowledges what is lacking in the study, and makes the reader
aware of these areas.
Journal Club – JBI
37
All issues arising from review addressed
Indicators: everything that was discovered from the review is included. If there are
particular issues, it could disclose the need for further work.
Implications for Practice
Implications for practice identified
Indicators: any recommendations for practice that have resulted from the review
have been included
Recommendations are clear and unambiguous
Indicators: any recommendations that have resulted from the review are stated in a
manner that is easy to understand, with little room for misinterpretation.
Recommendations are supported by findings
Indicators: the recommendations that have resulted from the review are clearly
congruent with the findings presented.
No major areas omitted
Indicators: no area of the findings was left out of the recommendations for
practice.
Implications for Research
Recommendations are clear and unambiguous
Indicators: any suggestion for further research as a result of the review is clearly and
explicitly stated.
No major areas omitted
Indicators: no area of the review was left out of the implications for further
research.
38
JBI – Journal Club


![AISER [USER MANUAL OF AISER] - Internet Banking](http://vs1.manualzilla.com/store/data/005712358_1-d8e4e34a51ac40b22276b6e3d3c9bbc0-150x150.png)