1
alileo
The Galileo Company
23 A Durham Drive
Amherst, NY 14228
(716) 636 7865
Galileo System Manual:
System Overview and Program Descriptions
1
GALILEO
Copyright 1990-1998
2
3
GALILEO
Rah Press
www.rahpress.com
Copyright, 1990
All Rights Reserved. No part of this publication may be reproduced or
transmitted in any form or by any means, electronic or mechanical, including
photocopy, recording or and other information storage and retrieval system,
without prior written permission by the publisher.
4
GALILEO COPYRIGHT 1990 BY JOSEPH WOELFEL
ALL RIGHTS RESERVED
NO PART OF THIS PUBLICATION MAY BE REPRODUCED OR
TRANSMITTED
IN
ANY
FORM
OR
BY
ANY
MEANS,
ELECTRONIC OR MECHANICAL, INCLUDING PHOTOCOPY,
RECORDING
OR
ANY
INFORMATION
STORAGE
AND
RETRIEVAL SYSTEM, WITHOUT PERMISSION IN WRITING
FROM THE GALILEO COMPANY.
CATPAC, GALILEO, and ORESME are trademarks of The Galileo Company. All
other brand and product names are trademarks or registered trademarks of
their respective companies.
Version 3.0
Copyright 1990
The Galileo Company
All Rights Reserved
5
GALILEO
IMPORTANT!
PLEASE READ CAREFULLY BEFORE USING THE SOFTWARE.
NOTIFICATION OF COPYRIGHT
THIS SOFTWARE IS A PROPRIETARY PRODUCT OF THE GALILEO COMPANY AND
IS PROTECTED BY COPYRIGHT LAWS AND INTERNATIONAL TREATY. YOU MAY
MAKE A REASONABLE NUMBER OF COPIES OF THIS PROGRAM FOR BACKUP
PURPOSES, AND YOU MAY COPY THE SOFTWARE TO THE HARD DISK OF A
SINGLE COMPUTING PLATFORM OF THE TYPE SPECIFIED IN YOUR LICENSE.
YOU ARE PROHIBITED FROM MAKING ANY OTHER COPIES OF THE SOFTWARE
FOR ANY OTHER PURPOSE BY COPYRIGHT LAWS. YOU MAY MAKE ONE COPY
OF
THE
WRITTEN
MATERIALS
ACCOMPANYING
THIS
SOFTWARE
FOR
ARCHIVAL PURPOSES.
THE GALILEO COMPANY
PLEASE READ THIS LICENSE AGREEMENT BEFORE USING THE SOFTWARE.
THIS AGREEMENT IS A LEGAL CONTRACT BETWEEN YOU AND THE GALILEO
COMPANY GOVERNING YOUR USE OF THIS SOFTWARE.
USING THIS
SOFTWARE INDICATES YOUR ACCEPTANCE OF THIS AGREEMENT. IF YOU DO
NOT WISH TO ACCEPT THE TERMS OF THIS AGREEMENT, PLEASE RETURN THE
UNOPENED SOFTWARE PROMPTLY TO THE GALILEO COMPANY. IF YOU HAVE
ANY QUESTIONS ABOUT THIS AGREEMENT, PLEASE CONTACT THE GALILEO
COMPANY.
6
TERMS OF LICENSE
THIS IS AN EXPERIMENTAL PROGRAM.
WHILE THE GALILEO COMPANY
CERTIFIES THAT THE HIGHEST STANDARDS OF DILIGENCE AND SCIENTIFIC
INTEGRITY HAVE BEEN APPLIED TO THE DEVELOPMENT OF THIS SOFTWARE,
BY ACCEPTING THIS LICENSE YOU AGREE THAT THIS IS EXPERIMENTAL
SOFTWARE AT THE CUTTING EDGE OF SCIENTIFIC PROGRESS.
NOT AS MUCH IS KNOWN ABOUT THE PERFORMANCE OF NEURAL NETWORK
TECHNOLOGY AS IS KNOWN ABOUT TRADITIONAL COMPUTER SOFTWARE.
YOU AS THE END USER AGREE THAT REASONABLE AND PRUDENT CAUTION
ABOUT
THE
APPLICATION
OF
RESULTS
FROM
THIS
SOFTWARE
IS
APPROPRIATE, AND THE GALILEO COMPANY AGREES TO SHARE WITH YOU
(THE LICENSEE) RELIABLE ESTIMATES OF THE OPERATING PARAMETERS OF
THE SOFTWARE INSOFAR AS THEY ARE KNOWN BY THE GALILEO COMPANY.
THE GALILEO COMPANY GRANTS YOU THE RIGHT TO USE ONE COPY OF THE
SOFTWARE ON A SINGLE-USER COMPUTER.
EACH WORKSTATION OR
TERMINAL ON A MULTI-USER COMPUTER SYSTEM OR LOCAL AREA NETWORK
MUST BE LICENSED SEPARATELY THE GALILEO COMPANY.
YOU MAY NOT SUBLICENSE, RENT OR LEASE THE SOFTWARE TO ANY OTHER
PARTY.
YOU MAY MAKE REASONABLE BACKUP OR ARCHIVAL COPIES IF THE
SOFTWARE, BUT YOU MAY NOT DISASSEMBLE, DECOMPILE, COPY, TRANSFER,
REVERSE ENGINEER OR OTHERWISE USE THE SOFTWARE EXCEPT AS STATED
IN THIS AGREEMENT.
7
GALILEO
LIMITED WARRANTY
The Galileo Company will replace defective diskettes that are returned within
90 days of the original purchase date without charge.
The Galileo Company
warrants that the software will perform substantially as stated in the
accompanying written materials. If you should discover any significant defect
and report it to The Galileo Company within 90 days of purchase, and Galileo is
unable to correct it within 90 days of receipt of your report of the defect, you may
return the software and Galileo will refund the price of purchase.
SUCH WARRANTIES ARE IN LIEU OF OTHER WARRANTIES, EXPRESSED OR
IMPLIED, INCLUDING, BUT NOT LIMITED TO, THE IMPLIED WARRANTIES OF
MERCHANTABILITY
AND
FITNESS
FOR
A
PARTICULAR
PURPOSE
WITH
RESPECT TO THE SOFTWARE AND THE ACCOMPANYING WRITTEN MATERIALS.
IN NO EVENT WILL THE GALILEO COMPANY BE LIABLE TO YOU FOR DAMAGES,
INCLUDING ANY LOSS OF PROFITS, LOST SAVINGS, OR OTHER INCIDENTAL
OR CONSEQUENTIAL DAMAGES ARISING OUT OF YOUR USE OF OR INABILITY
TO USE THE PROGRAM, EVEN IF THE GALILEO COMPANY OR AN AUTHORIZED
GALILEO COMPANY REPRESENTATIVE HAS BEEN ADVISED OF THE POSSIBILITY
OF SUCH DAMAGES. THE GALILEO COMPANY WILL NOT BE LIABLE FOR ANY
SUCH CLAIM BY ANY OTHER PARTY.
This limited warranty gives you specific legal rights. Some states provide other
rights, and some states do not allow limiting implied warranties or limiting
liability for incidental or consequential damages. For this reason, the above
limitations and/or exclusions may not apply to you.
If any provision of this
agreement shall be unlawful, void or for any reason unenforceable, then that
provision shall be deemed separable from this agreement and shall not affect
the validity and enforceability of the remaining provisions of this agreement.
8
This agreement is governed by the laws of the State of New York.
U. S. Government Restricted Rights
The software and accompanying materials are provided with Restricted Rights.
Use, duplication, or disclosure by the government is subject to restrictions as
set forth in subparagraph (b)(3)(ii) of the Rights in Technical Data and Computer
Software clause at 252.277=7013. Contractor/manufacturer is The Galileo
Company, 23A Durham Drive, Amherst, NY 14228.
9
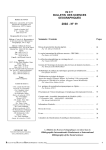
GALILEO
TABLE OF CONTENTS
The Galileo System
..............................................................................................12
Installing Galileo
..................................................................................................18
Setting your path: ......................................................................................19
Running the Software ................................................................................19
Setting your Expectations..........................................................................19
The Software ..........................................................................................................21
Option 1: Set up a new Project: Galileo*ELQM
......................................22
Option 2: Write a questionnaire: Galileo*AQM
.....................................23
Option 3: Enter data: Galileo*SPED
.......................................................23
Option 4: Make splits: Galileo*ALLSPLIT
..............................................24
Option 5: Run CATPAC: Galileo*CATPAC
...............................................24
Option 6: Make coordinates: Galileo*GALNET
......................................25
Option 7: Make a Galileo: Galileo*MICROGAL
......................................26
Option 8: Compute Strategies: Galileo*ASG
..........................................27
Option 9: Make tables: Galileo*TABLES
................................................28
Option 10: Count votes: Galileo*BALLOT
..............................................28
Option 11: Make a Runstream:
...............................................................30
Option 12: Run Version 5.5: Galileo*V5.5
...............................................31
Statistics
32
Normal Coordinates 33
Automatic Message Generator (A.M.G.)
34
Comparison of Spaces
37
Free Concepts
41
Using Galileo*V5.5 43
Statistics
44
A.M.G. 44
Comparison of Spaces
44
Conversion of Coordinates 45
Running Galileo*V5.5
46
Option 13: Screen Plot: Galileo*PLOT
....................................................46
Option 14: Run Oresme: Galileo*ORESME
............................................49
Option 15: Input Network Data: Galileo*NETIN
.....................................49
Option 16: Forecast Trends: Galileo*FORECAST
...................................50
Option 17: Review a study: Galileo*READ
.............................................50
10
Option 18: Modify exclude file: Galileo*EXCLUDE
...............................51
Option 19: Go to DOS
...............................................................................51
Option 20: Quit
.........................................................................................51
Appendix 1: Tools
.................................................................................................52
11
GALILEO
The Galileo System
Galileotm is a set of procedures which model thought processes.
Although it is widely used by the scientific community, by far the most common
use of the Galileo system is modeling the beliefs and attitudes of markets and
market segments toward products and services. For nearly two decades, Galileo
has been available to the scientific community via special license on
mainframe computers, and to leading corporations worldwide on a consulting
basis. Now, for the first time, this powerful set of procedures is available for the
personal computer.
Technically, Galileo may be considered as a fuzzy logic artificial neural
network.
A natural neural network (like the brain) consi sts of neurons, each of
which may be connected to many other neurons. (In a human brain, there are
about 100 billion neurons, each of which is connected, on the average, to about
a thousand other neurons.) When a neuron is stimulated, it becomes "active",
and sends signals to all the other neurons to which it is connected.
12
Galileo
Neural networks store information as patterns in the same way that a
TV screen or theater marquee or electronic scoreboard does: By activating some
of the dots or light bulbs and leaving others off, any pattern can be displayed.
But because the neurons in a neural network are connected to each other, the
neural network can do more than simply display patterns of information: it can
store and retrieve those patterns, and recognize patterns it has stored even if
they are distorted or incomplete.
Although the actual functioning of a neural network like the human
brain can be so complicated as to be beyond comprehension, in principle the
way a neural network works is very simple and easy to understand. A neural
network learns by connecting together the neurons which represent any
particular pattern. Since they are connected together, when some of them are
activated, they spread their activation to the others connected to them, which turns on
the rest of the pattern. Thus, when a network sees part of a pattern, it can recall
the rest of the pattern, even in spite of incomplete or erroneous information, as
long as enough of the pattern is there to activate the rest.
Galileo is an artificial neural network in which products, attributes and
people are represented as neurons.
Each of these products, attributes and
people may be more or less tightly connected to each other. Products that are
similar may be tightly connected, so that activating "Coke" in the network will
probably activate "Pepsi" as well.
Products will be tightly connected to their
attributes as well, so that activating "sweet", "brown", "carbonated" will probably
activate Pepsi and Coke. Attributes can also be connected to each other, so that
activating attributes like "sweet", "satisfying", "filling" and the like may well
also activate other attributes like "delicious" or "fattening."
13
Galileo
Galileo also represents people as neurons. People can be connected to
both attributes and products; they are tightly connected to attributes that make
a difference to them, and they are more tightly connected to products and
services that they buy and use than to those that they don't buy or use. All
product development, advertising and marketing strategies can be seen as
efforts to connect a product or service more tightly to people.
Galileo doesn't represent neurons as simply "connected" or "not
connected" to each other, but instead measures the precise degree of each
This means that Galileo includes not only information about
connection.
whether a car, for example, is smooth riding, but also represents precisely how
smooth riding it is. Galileo does not simply say a product, service or object
belongs to a category, but instead says to what degree it belongs to that category.
A system which quantifies the degree to which objects belong to categories is
called a "fuzzy logic."
In a natural
neural
network,
neurons
that
are
tightly
connected
are typically located
close
to
one
another.
Galileo
provides
diagrams
based
on
principle
form
give
in
of
which
this
"maps,"
can
an
picture
structure
the
help
intuitive
of
of
the
the
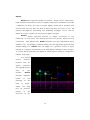
Figure 1 Dessert Preferences
14
Galileo
network. Figure 1 shows a map of Dessert Preferences for Tom and Becky. It
shows that "Ice Cream" is closer to cold than "Cherry Pie", which is closer to
"Hot." Both are about the same distance from "Sweet."
Tom prefers a hot dessert, and the map shows him closer to "Hot" than
"Cold." Becky prefers a cold dessert, and is closer to "Cold" in the map. She's
also closer to "Ice Cream" than Tom, who is closer to "Cherry Pie" than Becky.
We should expect Tom to choose Cherry Pie more often than Becky, while Becky
would be expected to choose Ice Cream more often than Tom. We'd also expect
Tom to choose Cherry Pie more often than Ice Cream, and Becky to choose Ice
Cream more often than Cherry Pie.
While the map is useful for getting an intuitive feel for the structure of
the network, more precise information is always available. Galileo can write
out any distances desired in a
simple
format,
as
Table
1
MEAN GALILEO DISTANCES
shows.
One
of
the
Tom and Becky's Desert Preferences
major
CHERRY PIE
reasons Galileo has been so
Attribute
widely used in advertising and
market research is its ability
2.
to
optimum
2.
strategies for strengthening
2.
and weakening connections
2.
between the neurons.
2.
calculate
Galileo's
strategic
Using
16.50
COLD
76.50
SWEET
32.00
TOM
24.00
BECKY
56.00
N
ICE CREAM
HOT
2.
strategies
will
2.
strengthen the connection of
2.
a product or service with its
2.
potential customers.
HOT
planning
abilities, it's possible to find
which
Distance
COLD
98.50
8.50
SWEET
41.00
TOM
55.00
BECKY
19.00
2.
Table 1: Tom and Becky's Dessert Preferences
15
Galileo
In order to design an effective strategy for repositioning a product or
service in the customers' minds, it is only necessary to specify what position in
the market the product or service is meant to fill.
Galileo software will
automatically calculate what
connections
need
to
strengthened
and
weakened
achieve
to
be
which
ICE CREAM
ASSOCIATED WITH
-----------------------------13.667 PERCENT = HOT
-15.667 PERCENT = SWEET
70.667 PERCENT
= CHERRY
the
desired positioning.
Table 2 gives several
examples
of
developed
strategies
Galileo
by
PIE
VALUE OF MINIMUM =
to
reposition Ice Cream closer to
Tom.
ICE CREAM
ASSOCIATED WITH
-----------------------------32.333 PERCENT = HOT
31.583 PERCENT
= CHERRY
The first strategy
Galileo suggests tightens the
connection
between
Ice
1.060
PIE
Cream and both "Hot" and
36.083 PERCENT
"Cherry Pie", while weakening
VALUE OF MINIMUM =
= BECKY
14.395
the connection between Ice
Cream
and
second
"Sweet."
strategy
tightening
the
ICE CREAM
ASSOCIATED WITH
------------------------------21.167 PERCENT = SWEET
73.917 PERCENT
= CHERRY
The
suggests
connections
between Ice Cream and "Hot,"
PIE
4.917 PERCENT
"Cherry Pie", and Becky. The
third suggests weakening the
connection
between
Ice
Cream
"Sweet",
while
and
VALUE OF MINIMUM =
= BECKY
13.664
Table 2: Strategies to Reposition
Ice Cream Closer to Tom
tightening the connections to
"Cherry Pie" and Becky.
There are as many ways of strengthening and weakening connections
as human imagination can devise, but the most common are advertising and
16
Galileo
actually changing the product or service. However one proceeds to implement
the strategies, Galileo provides a convenient way to track the progress of the
repositioning.
17
Galileo
Installing Galileo
-
Place the diskette in the A: or B: drive.
-
Type INSTALL <diskette drive> <target drive> and press Enter.
For example to install the system on your C: drive with the
diskette in the A: drive you would type:
INSTALL A: C:
That's it. The install program will take care of everything.
The following directories will be created:
\GALILEO\RUNNER
Contains the executable programs
\GALILEO\HELP
Contains the help files
\GALILEO\DOC
Contains
all
available
Galileo
Documentation in WordPerfect 5.0 format
\GALILEO\DATA
Contains sample data sets
\GALILEO\TOOLS
Contains a text editor and several utility
programs
You will need an IBM PC or compatible computer with a 486DX chip, or a 486SX,
386 or equivalent with a co-processor. The Galileo System will take up about 5
megabytes on your hard drive. The Galileo system assumes your hard drive is
called "C", or that you have a section of the hard drive named "C". If this is not
18
Galileo
so, please call The Galileo Company for assistance.
Setting your path:
All your GALILEO software resides on a directory called C:\galileo\runner. Your
life will be greatly simplified if you insert this directory into your path. Please
consult your DOS manual for instructions on inserting the GALILEO directory
into your path. If you don't set your path to c:\galileo\runner, you will only be
able to run your Galileo software after setting C:\galileo\runner as your default
directory.
Running the Software:
All Galileo programs are designed to be run interactively, and have context
sensitive help online. The best strategy for learning the system is simply to
type "GALILEO" and ask questions as needed.
At first this may seem
bewildering, but after a short time, the online help will serve as an interactive
training course.
Setting your Expectations:
Galileo Software is very easy to run -- you only need to select a number from the
menu on the screen and press the [ENTER] key. But, at the same time, the
technology that's controlled by this software is quite advanced, and not every
analyst, even very advanced analysts, can be expected to know what Galileo can
do.
If you have no background in Galileo technology, you'd probably be well
advised to spend at least a day or more training with a qualified consultant from
The Galileo Company.
There is also a very extensive scientific literature
concerning Galileo techniques.
For more information about special training
and for bibliographic advice, contact your Galileo Company Representative.
19
Galileo
Good Luck!
20
Galileo
The Software
After you've typed GALILEO, the Galileo Menu will appear on the screen.
The menu has 20 options from which to choose. To select any option, type its
corresponding number and then press the [ENTER] key.
Eighteen of these
options will execute one of the 18 programs in the Galileo System. Option 19
suspends the Galileo system and returns to DOS, while option 20 terminates
the Galileo session. (Expert users will want to know that the GALILEO program
shell is not needed to run the programs -- each of the 18 Galileo programs can
be run independently just by entering its name.)
We'll see wh at program each option calls up, and let each program
describe itself and its uses:
21
Galileo
Option 1: Set up a new Project: Galileo*ELQM
I'm ELQM (Electronic Questionnaire Maker), and I'm the program that
can let you build a CATI system especially designed to work with Galileo
software. I'll ask you a series of questions, and then build a filing system, write
an electronic questionnaire, and coordinate the other programs in the system.
I need only know the name of a directory on which you want the study to reside.
If you are going to have several different versions of a questionnaire, then a
separate directory will be required for each questionnaire. (You might find it
useful in such cases to create a master directory for the study as a whole, with
a sub directory for each questionnaire version.)I can make four kinds of
question (which is all there are, I think.)
First, I can make a complete
Galileo(tm) type magnitude estimation paired comparisons instrument. I can
also make magnitude estimation scales, category scales (like male=0,
female=1) and Likert-type scales,and open-ended or in-depth questions. Once
I've made your electronic questionnaire, you or your agents run SPED (the
Simplified Process for Entering Data), and SPED will prompt you with the
questions. When you (or your respondent)answers, the answers will be directed
automatically to the correct files. I always create 3 files on the study directory:
study.dat, study.lbl, and galileo.dat.
Study.dat is the master control file, and
contains all the information about the study, including the exact wording of
every question and the file handling information. Study.lbl contains a list of the
concept labels for the Galileo questionnaire, which are needed for subsequent
processes.
Galileo.dat
contains
all
numerical
data,
including
the
paired-comparison responses and responses to all quantitative and categorical
questions.
The Galileo paired comparison data and the other questions are
interspersed in this file in an obvious way; the exact format of these files is
stored in study.dat.
Study.dat is read by a program called Read. Just run Read and name the
study directory; Read will write out the information there,including all relevant
22
Galileo
formats. In addition to these files, I will create a file for each open-ended or
qualitative question, named after the ordinal position of the question. If the
third question were, for example,
3.) Discuss your summer vacation. Be brief.
I would create a file called quest003.dat, and I would tell SPED to append all
responses to that question to quest003.dat.
Option 2: Write a questionnaire: Galileo*AQM
ELQM (the Electronic Questionnaire Maker) makes an electronic
questionnaire that can be administered online or by phone through a skilled
interviewer who enters data live onto the computer using SPED (The Simplified
Process for Entering Data).
But every now and then, as in mailed
questionnaires, mall intercepts and the like, there comes the need for that
primitive technology, the paper and pencil questionnaire.
I make these.
(Actually, I only make the Galileo paired comparison parts of it, along with a few
standard questions scientists at The Galileo Company always use.) That's
because paired comparison questionnaires are very difficult to make using a
word processor. The rest of the questionnaire is easier to make using a word
processor like Microsoft Word or WordPerfect, so I don't do that. I'll write out the
Galileo questionnaire on a file you choose. You can edit it as you like and print
the questionnaires then.
Option 3: Enter data: Galileo*SPED
I'm the chief data entry program in Galileo*CATS. All I need to know
from you is the name of the directory on which the study resides (the "study
directory").
After that, I'll prompt you for all the questions and automatically
23
Galileo
post the responses to the correct files.
Option 4: Make splits: Galileo*ALLSPLIT
I'm a general purpose splitting utility.
You can just tell me what
columns you want to split on, and where you want the split files, and I'll do it. I
can split on values or ranges. I can read the study.dat file made by ELQM, and
so I know where your variables are and can help you during the split run. I can
write out a list of the variables, and I can split by variable name as well as by
column. I can write out all of a case or any subset of it; you tell me what you
want written out.
(Some Galileo processors don't want to see anything but
paired comparison data in their files; you can get rid of all the other data using
this option.)It may take a while to master me, but it's well worth it. I'm very
versatile.
Option 5: Run CATPAC: Galileo*CATPAC
I'm a self-organizing neural network optimized to read and understand
text.
I can read any ASCII text and determine its underlying conceptual
structure. Technically this means that I can learn the patterns of association
among the various words in the text, and perform a diameter method
hierarchical cluster analysis of these relations. I also write out the matrix of
interrelations in a file with the appendix .win (weight input network).
This
square matrix represents the pattern of interrelationships among the top N
words in the text (you have to tell me what N you desire). You can input this
matrix to other programs (such as your favorite statistics package), or to other
neural networks, particularly ORESME.
I also make .CRD files which contain Galileo coordinates. These can
then be plotted by PLOT. Perceptual maps from text is a Galileo exclusive! (You
not only saw it here first, you can't see it anywhere else!)
24
Galileo
Option 6: Make coordinates: Galileo*GALNET
I make metric coordinates for generalized input data. I will read either
a square matrix of
dissimilarities, similarities, covariances, correlations,
connections among neurons or other user supplied input, and project the
concepts or variables corresponding to the rows of that matrix onto coordinates
which retain the metric of the input matrix.
Alternately, you may input a
rectangular objects by attributes matrix in which each row represents some
object and each column represents some attribute. Cell entries represent the
numerical value of the attribute for the corresponding object. In this second
case, the labels file must contain the names of the endpoints of the attributes
following the names of the objects scaled.
In the following example, several
people and a cat are rated according to their height, weight and age:
SALLY
BOB
JOE
ROSS
GEORGE
RALPH
FELIX
LEON
SHORT
TALL
LIGHT
HEAVY
YOUNG
OLD
The data matrix for this example is as follows:
(8f10.0)
64.
68.
55.
65.
67.
65.
21.
112.
148.
90.
135.
120.
110.
12.
26.
44.
12.
18.
17.
17.
2.
25
Galileo
66.
145.
23.
Each of the people (and the cat) are rated according to their height in
inches, their weight in pounds, and their age in years. These labels can be
found in \galileo\data\us.lbl and the data can be found in \galileo\data\us.dat.
I am also useful for taking .WIN matrices made by CATPAC or ORESME and
converting them into Galileo-type coordinates which can then be displayed
using PLOT, or may serve as inputs into ASG. To use me to convert ORESME
outputs into a form that can be read by PLOT and ASG, simply run me (GALNET),
and name the .WIN file made by CATPAC or ORESME when I ask where your
data are.
When I ask if this is a real Galileo, say "yes", and when I ask if this
is a CENTROID SCALAR PRODUCTS MATRIX, say 'yes.'
Option 7: Make a Galileo: Galileo*MICROGAL
I am the PC version of the mainframe Ga lileo computer program.
expect to read raw data in standard Galileo paired comparison
I
format. This is
the format which SPED writes. For a detailed description of standard Galileo
formats, consult Woelfel and Fink, (1980) The
Measurement of Communication
Processes: Galileo Theory and Method, New York, Academic Press. (An example
of complete paired comparison data is provided on your \galileo\data directory
in the file AUTOS.DAT.
file AUTOS.LBL.)
The corresponding labels file for these data are in the
I calculate the coordinates of the concepts in Galileo space.
These coordinates may be plotted to produce a graphic picture of the data, or
they may serve as input to other Galileo programs,
such as Strategy and
Compare.
I also calculate the standard error for each of the
points.
These
standard errors can serve as an estimate of the uncertainty around the location
of the points. In graphic representations, the standard error or some multiple
usually serves as the diameter of the circle or sphere which represents the
26
Galileo
concept in Galileo space. If all standard sampling distribution assumptions are
correct (which, of course, they never are) there will be about a 67% likelihood
that the concept is actually located within plus or minus one standard error of
the location given by its Galileo coordinates.
I ask for the number of concepts, the maximum value above which it
will ignore data, the location of the labels file (the file were the names of the
concepts are kept), the name (and complete path) of the file where the data are
kept.
I will also ask whether a
logarithmic transformation of the data are
desired, and what you want to name the output file and the coordinates file.
The output file is the place where an output file suitable for printing is written,
and the coordinates file is where coordinates for plotting or input into other
Galileo programs are stored. You should supply the complete path for each of
these files, otherwise I will write them into your current directory.
Option 8: Compute Strategies: Galileo*ASG
I'm the Automated Strategy Generator (ASG).
I can read Galileo
Coordinates made by Microgal, V55, or Galnet, and calculate the likely effects of
every possible strategy for repositioning any concept in the Galileo space. In
doing this, I follow the theory of Woelfel and Fink, The Measurement of
Communication Processes:Galileo Theory and Method, Academic Press, New York,
1980. Unlike the model in V55, I provide weighted strategies; that is,I can tell
you my best guess as to how much to emphasize each element of a strategy. I
can even consider negative strategies(such as "I am not a crook") and mixed
strategies, such as"Luxurious, but not expensive."
To be candid, however, the practical differences between weighted
strategies and unweighted strategies is fairly small relative to today's (1991)
ability to measure. Improved measurement precision (sure to come) will make
these differences crucial, however, so it's not OK to put the question out of
mind. I can only make strategies if I know what your goals are, though, and I'll
27
Galileo
ask you a series of questions to find out what you want to accomplish. If you
don't know what to do at any point, just enter a '?'.
Option 9: Make tables: Galileo*TABLES
I make tables out of pair comparison data. Most brand managers (and
most social scientists, for that matter) follow Aristotle in dividing up their
experience into objects and attributes. In this model, objects are defined by
their attributes,so that a ball might be round, yellow and soft, or a car might be
economical, reliable and stylish. In more advanced models, objects may have
differential amounts of each attribute (every quality exists in some quantity).
In paired comparison dissimilarities data typical of Galileo data, objects
are arrayed at various distances from various attributes, so that an economical
car can be close to the attribute "economical", but a more economical car can be
even closer, and so forth. I'll ask you for Galileo data in standard format (that is,
the paired comparison format described above in the description of Microgal),
and I'll ask you to tell me which of your concepts are objects and which are
attributes. Then I'll make tables which give the mean distances between each
object and each attribute. I'll also make tables of Z for each pair of objects,
which shows how they differ in their scores on each attribute. The difference is
given in standard units (z-scores), and a mark ('S') is made if the differences are
significant at the 80% level.
Option 10: Count votes: Galileo*BALLOT
I am a variation of TABLES. I'm particularly useful when the topic you
are studying involves discrete choices.
choices,
Elections are examples of discrete
since voters may either vote for a candidate or not.
Expensive
products such as automobiles usually may be considered discrete choices as
well, but inexpensive products typically are not, since you can buy variable
28
Galileo
quantities of them.
My main function, curiously, is to "ruin" perfectly good data.
Professional market or election researchers, for example, may make very
precise measurements about how much respondents like or prefer a specific
candidate or product. But elections don't let you express a degree of preference;
you can either vote for or against a candidate 1. The same is true for most big
ticket products; customers don't tell dealers, for example, how much they like a
car; they either buy it or they don't. My job is to make good quality numerical
scales into simple dichotomous choices.
I read complete paired comparison datasets, in which each product,
candidate and attribute is compared to each other product, candidate and
attribute
on
a
numerical
scale,
which
is
probably
measurement format known to the market researcher.
inquiries as TABLES: I ask how
the
most
precise
I make the same
many concepts there are, on what file the
concept names or labels are to be found, whether or not you want a logarithmic
transformation of the data, what the name
of your data segment is (this
becomes the title of your table), where your data (in standard GALILEO raw data
format) may be found, and on what file you'd like the output written. I also ask
you to identify two or more "candidates" or products and a "self-concept", which
represents a self-point or ideal point.
I then divide up the cases into several piles: the first pile contains those
cases closer to the first candidate or product; the second contains those closer
1
This is an interesting point of public policy. Whenever a political poll fails to predict an election outcome accurately, we routinely say
the poll was inaccurate. It's much more likely, however, that the election is inaccurate as a gauge of the public's actual opinions. After all,
in an election the sampling is non-random, the polling method is cumbersome and incredibly expensive, biases are known to be extreme,
and the scaling method is simply dichotomous choice. If any young market researcher were asked to design a survey to measure people's
opinions toward a set of issues, and recommended that polling stations be established, the public be invited to come to them and fill out a
questionnaire consisting of 2 point scales, he or she would be fired. And rightfully so. But the election process was established by the
constitution before scientific polling was invented, and is "accurate" by legal definition, not by scientific merit.
29
Galileo
to the second candidate or product; the third contains those closest to the third
candidate or product, and so on for n piles for n candidates of products.
The
second last pile contains those equidistant from all candidates or products (the
"undecided"), and the last contains those for which the crucial data are missing.
The results are displayed on the screen and written to the file you named in a
standard ASCII format ready to print. The result is my best guess as to how the
share of vote or share of market would come out, assuming respondents were
only allowed to make dichotomous choices.
Option 11: Make a Runstream: Galileo*INTERGAL
Galileo Version 5.5 (V55) is the current version of the original
mainframe Galileo program.
Designed in the 1970's, V55's architecture is
antiquated, but, like the dinosaurs it resembles, it's still quite powerful and can
do several things that have not yet been ported to the PC platform. For that
reason, it remains alive and is still supported. I write a runstream that makes
V55 work. I'll ask you a series of questions, then write a command file that
executes a V55 run. Crude, but effective.
AUTOS.PRT
AUTOSR.CRD
RUN NAME
A TEST OF V55 FORMATS
N-CONCEPTS
18
N-DATASETS
2
CRITERION PAIR I DON'T RECALL
CONLABELS
SPORTY LOOKING
FUN TO DRIVE
FAMILY CAR
GOOD VALUE
PRACTICAL
AFFORDABLE
EXCITING
APPEALS TO OLDER PEO
LUXURIOUS
RELIABLE
30
Galileo
HONDA ACCORD
MAZDA 626
FORD TEMPO
TOYOTA CAMRY
NISSAN STANZA
CHRYSLER LEBARON GTS
PONTIAC GRAND AM
YOURSELF
COMPARISONS
OPERATIONS
SPECIFICATIONS
MAXVAL
999
MAINSPACE
1
FCONS
18
END OF SPECIFICATIONS
OPTIONS
1,23,24,22,18,8,9,12,13,14,15,16
READ DATA
AUTOS1.DAT
AUTOS2.DAT
V55 is very versatile, and I can't design every possible job V55 might do.
Often more advanced work with V55 will require me to make a run stream like
this one which you will then edit with an ASCII editor. If you don't already have
a favorite of your own, you can use EDWIN supplied with the Galileo System.
Option 12: Run Version 5.5: Galileo*V5.5
I'm a PC version of the original Galileo mainframe computer program.
I'm a general purpose program that can do a huge variety of things. Learning
what I can do is beyond the scope of this manual, and I should really only be
used by advanced analysts. A good introduction to what I can do, along with a
manual illustrating how to get me to do a wide variety of things is The
Measurement of Communication Processes: Galileo Theory and Method, by Joseph
Woelfel and Edward L. Fink (Academic Press, NY, 1980). If you have trouble
finding this volume, please contact The Galileo Company.
Galileo Version 5.5 (V55 on the Galileo Menu) is a powerful and
sophisticated program for the advanced user. While a complete mastery of V5.5
31
Galileo
requires advanced understanding of Galileo technology, the typical advanced
user will use it for three primary functions: to provide comprehensive statistical
analysis of the raw data, to generate unweighted message strategies, and to
compare multiple Galileo spaces.
Statistics
Galileo Version 5.5 provides a much more extensive statistical analysis
of raw paired comparison data than is provided by the more convenient
Microgal. In a normal Galileo analysis, the dissimilarities among all possible
pairs of a set of concepts (typically products and their attributes) are measured
on a ratio-scaled questionnaire. For N objects, this will produce
n(n-1)/2
paired comparisons. For each of these paired comparisons, V5.5 will compute
the mean, standard deviation, standard error, index of skewness, index of
kurtosis, maximum value, minimum value, count and percent relative error.
In addition to these local statistics, V5.5 will also flag values beyond a
user-supplied maximum (EXVAL) and eliminate values beyond another user-set
value (MAXVAL). Cell with the largest value and the smallest values are also
flagged. V5.5 will also search for illegal keypunches in the data and eliminate
them, and will produce warning messages for cells (paired comparisons) with
sample sizes under 30.
(In certain cases, sample sizes under 30 might be
perfectly acceptable, but you should be aware of them in those cases where
statistical inference to a larger population is required.)
A TEST OF V55 FORMATS
DISTANCE GT MAXVAL
CELL ADDRESS ERROR
33100201
33100221
ADDRESS 5
ADDRESS 25
Cell with an N of .LT.30 2 1Count is
Cell with an N of .LT.30 3 1Count is
61 errors detected in data set
1POSITION
4POSITION
Raw data set number
4
3
DISTANCE 1000.
23.
24.
2
Statistics for A TEST OF V55 FORMATS
ROW
1
1
COL
2
3
MEAN
36.913
153.542
STAN. DEV.
52.320
138.178
1
STD ERR
10.909
28.205
Set number
SKEWNESS
1.732
1.461
32
KURTOSIS
2.258
1.543
1
COUNT
23
24
MIN. VAL
.0
.0
MAX. VAL
200.0
541.0
ERROR
29.6
18.4
Galileo
Average observations per cell
22.9804
Count of all non-zero cells
153
Mean of all non-zero cells
83.2763
Cell with maximum distance is 8 1 Distance is
Cell with minimum distance is 6 5 Distance is
173.3636
20.0435
Cells which have no values at all will be estimated by the program,
which will insert the grand mean of all non-zero cells in each empty cell. This
may or may not make sense in your particular case. It is not good practice to
leave any cells unmeasured unless you are very confident on theoretical
grounds that this will not adversely affect the geometry of the neighborhood.
Cell adjustment is provided solely because it is usually better to do something
moderately wrong than to do nothing when circumstances beyond your control
have left you with incomplete data.
Normal Coordinates
In addition to complete statistical information about the original paired
comparison measurements, V55 calculates the complete eigenstructure for the
data. This means that Galileo Version 5.5 calculates all eigenvectors, both real
and
imaginary,
which
dissimilarities exactly.
are
needed
to
represent
the
original
pairwise
If any of the original dissimilarities violate triangle
inequalities constraints, at least some of the eigenvectors will be imaginary,
and their corresponding eigenroots will be negative.
V55 provides all these
eigenvectors and eigenroots, along with a complete analysis of any noneuclidean aspects which the space may incorporate.
A simple summary
measure of the degree to which the space is non euclidean is given by the Warp
Factor, which is the ratio of the sum of positive eigenvalues to the total sum of
eigenvectors.
If this ratio is 1.0, the space is completely euclidean; greater
values indicate greater degrees of warp.
GALILEO Coordinates of 18 Variables in Riemann Space for Data Set
0
1
2
3
SPORTY L
FUN TO D
FAMILY C
1
2
3
81.581
68.880
-62.677
-29.796
-12.055
36.077
15.491
-15.928
12.025
Normal Solution
4
19.250
14.624
22.710
33
1
5
6
7
8
-.307
5.430
-7.156
-12.650
-2.295
-26.582
-5.877
-7.588
-4.296
-14.337
13.274
-6.625
Galileo
4
5
6
7
8
9
10
11
12
13
14
15
16
17
18
GOOD VAL
PRACTICA
AFFORDAB
EXCITING
APPEALS
LUXURIOU
RELIABLE
HONDA AC
MAZDA 62
FORD TEM
TOYOTA C
NISSAN S
CHRYSLER
PONTIAC
YOURSELF
-43.567
-52.675
-55.396
64.175
-65.520
49.476
-17.249
-7.735
-.396
-28.322
-16.502
-1.971
21.734
37.961
28.202
-17.890
-25.301
-33.485
2.628
39.026
67.742
-10.854
-38.072
-10.120
12.332
4.054
-12.472
59.769
9.178
-40.761
17.070
11.887
14.169
.240
-23.459
-30.893
13.669
-33.782
-11.974
5.379
-24.307
-27.404
34.079
42.078
1.659
-18.162
4.492
-17.403
-12.578
-32.140
-18.798
3.357
-9.889
18.225
44.264
11.752
21.618
-2.127
-13.223
-35.973
-2.508
5.881
-3.042
-15.193
-2.567
-6.157
14.772
-24.725
-34.460
-13.210
20.082
37.752
21.041
-15.681
20.051
9.102
1.526
1.443
10.551
11.096
2.260
-15.763
-29.815
10.483
36.389
-19.374
16.084
-8.451
-.444
16.441
Eigenvalues (roots) of eigenvector matrix-38073.530
17846.850
8553.307
7777.015
5516.946
4746.127
Percentage of variance accounted for by individual factors56.617
26.539
12.719
11.565
8.204
7.058
Percentage of variance accounted for by individual factors in their own spaces40.690
19.073
9.141
8.311
5.896
5.072
Sum of Roots
67247.770
********* WARP FACTOR =
1.3914 **********
Number of dimensions in real space 11
Number of dimensions in imaginary space 7
-6.590
13.052
-8.400
-17.789
-2.130
7.804
.706
-14.972
25.005
-20.004
11.885
14.089
-15.387
33.002
-2.512
22.681
.027
-18.929
8.042
-1.990
-14.856
-6.558
-4.805
8.269
-1.400
27.098
-15.640
6.773
-1.950
.925
3698.842
2753.560
5.500
4.095
3.953
2.943
Automatic Message Generator (A.M.G.)
In a typical perceptual map, the positions of objects and their attributes
are determined only within very course limits.
"feel" for the structure of a market
One can get a crude overall
or market segment, but confidence
intervals around the location of each product and attribute are typically as wide
as the entire picture -- or wider.
This means that objects and attributes
location cannot even be guaranteed to be in the correct quadrant using typical
perceptual mapping techniques.
Moreover, since the computation of the
configuration requires that the majority of the values be estimated rather than
measured, the results are highly dependent on (typically unstated) assumptions
about the geometry of the space which spans the market or market segment.
In a Galileo ratio-scaled complete paired comparison design, however,
results are typically much more precise.
Moreover, since all non-redundant
pairwise dissimilarities are measured, Galileo does not need to make as many
strong simplifying assumptions about the geometry of the neighborhood in order
to calculate the coordinates of the objects and attributes.
As a result, it is possible to produce Galileo maps within which the
positions of the objects and attributes is sufficiently precise to allow the
program to calculate the most likely effects of possible message strategies on
relocating objects in the space. In Galileo theory, a message strategy is anything
that can be done to change the relation of an object or product toward the attributes
34
Galileo
in the neighborhood.
(This usually involves either associating the object with
certain
in
attributes
advertising,
or
changing
the
actual
product
in
manufacturing.)
To develop a message strategy, you must first decide where in the
market you wish to reposition the object. Most Galileo users include either an
ideal point or a self point (yourself)in their original concept list, and either of
these can serve as a useful target for repositioning. Ideal points can work well
with low cost products, such as most consumables, (e.g., the ideal dessert) but
don't usually work well with big ticket items like automobiles, because most
consumers consider ideal automobiles to be too expensive for them. The self
point is usually a good choice regardless of product category. Whichever you
choose, V5.5 refers to it as the target. The object you wish to reposition is called
the start concept.
The A.M.G. in V5.5 differs from the algorithm in the Automatic Strategy
Generator (ASG) in several ways. In many ways, ASG is the more sophisticated
tool, since it allows the choice of multiple target points. This can allow you to
reposition an object in the middle of several other objects.
This can be useful
when you wish to attack a particular product by positioning between it and the
self point of its market segment. Or it can be useful if you wish to reposition a
product in the vicinity of several attributes.
ASG also produces weighted
strategies, which can tell you not only what attributes to emphasize in
advertising or remanufacturing, but how much of each to use. ASG also allows
the calculation of negative strategies, that is, attributes which you can claim
your product does not exhibit (e.g., not harsh).
On the other hand, ASG pays a certain price for its sophistication. It can
be slow in computing strategies for a large number of concepts, since it involves
complicated non-linear iterative procedures.
And often, weighted advertising
strategies are beyond the budgeting capabilities of many clients. Moreover, the
understanding of negative strategies is not well developed and probably ought to
be considered experimental. A.M.G. in V5.5, on the other hand, is quite fast,
35
Galileo
provides strategies that are easier to implement, and in general are not very
much less powerful than the best weighted strategies produced by ASG.
A. M. G.
1-PAIR Message Solutions
Start IS 11
THETA
38.6
30.6
0102A. M. G.
A. M. G.
A. M. G.
01-02-09-13
01-02-10-11
CORR.
.663
-57.06
THETA
39.7
5.9
CORR.
.769
.995
TG-CAP
45.42
37.12
Target is 18
TG-CAP
40.34
Target is 18
TG-CAP
54.55
Target is 18
Concepts
% Remaining
TG-CAP
46.55
7.50
Distance Remaining
1
SPORTY LOOKING
FUN TO DRIVE
AFFORDABLE
PONTIAC GRAND AM
1.54
1.12
2
FUN TO DRIVE
PRACTICAL
EXCITING
HONDA ACCORD
2.44
1.78
3
SPORTY LOOKING
GOOD VALUE
APPEALS TO OLDER PEO
2.48
-1.81
4
SPORTY LOOKING
PRACTICAL
EXCITING
NISSAN STANZA
2.73
1.99
5
FUN TO DRIVE
AFFORDABLE
PONTIAC GRAND AM
4.95
-3.60
6
FUN TO DRIVE
PRACTICAL
EXCITING
TOYOTA CAMRY
5.81
-4.23
7
FUN TO DRIVE
AFFORDABLE
EXCITING
PONTIAC GRAND AM
6.77
4.93
8
FUN TO DRIVE
AFFORDABLE
NISSAN STANZA
7.01
5.11
9
SPORTY LOOKING
GOOD VALUE
7.11
-5.18
36
ST-CAP
48.25
Distance to Target is
TG-R
50.01
30.15
And the winners are.....
Message
ST-CAP
60.63
Distance to Target is
TG-R
55.39
ST-R
74.29
43.24
ST-CAP
56.92
62.65
Distance to Target is
TG-R
43.06
ST-R
38.65
4-PAIR Message Solutions
Start IS 11
Distance to Target is
TG-R
54.70
37.39
ST-R
75.70
3-PAIR Message Solutions
Start IS 11
THETA
48.5
i
01-02-0301-02-04-
CORR.
.833
-67.36
Target is 18
ST-R
87.39
67.13
2-PAIR Message Solutions
Start IS 11
THETA
33.6
i
01-0201-04-
CORR.
.782
.860
ST-CAP
56.01
72.44
72.83
PCT
75.10
51.34
72.83
PCT
59.13
72.83
PCT
76.06
72.83
PCT
68.67
41.39
Galileo
RELIABLE
NISSAN STANZA
10
SPORTY LOOKING
FUN TO DRIVE
PRACTICAL
TOYOTA CAMRY
7.62
5.55
Notice that some of the message distances are marked with an "i",
which means that these distances are imaginary. Some analysts believe that
imaginary distances ought to be interpreted in the same way as real distances,
but a more conservative approach would assume that imaginary distances are
not yet well understood among market researchers. In the conservative view,
which we recommend, messages involving imaginary distances ought probably
not be considered for commercial practice until further research clarifies their
applicability.
Notice that V55 calculates all possible message strategies, but prints
only those which actually improve the position, that is, result in the START
concept moving closer to the TARGET.
V55 also rank orders the message
strategies and prints out the ten best strategies.
This can be very helpful,
since the number of possible strategies is equal to the number of combinations
of concepts taken one, two three and four at a time -- a very large number for
large spaces.
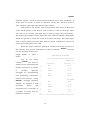
Comparison of Spaces
37
Galileo
Look at
Figure
4.
Figure
4
shows
the
Galileo map of
a sample of all
households in
the
Capital
District of New
York
prior
State
to
the
1988
presidential
election.
Notice
that
the map does
Figure 4: Map of All Voters
not realize we
like to place "liberal" to the left of our political representations and
"conservative" to the right. (There is, of course, no way it could, since this is
simply a popular convention and not a fact of nature.)
38
Galileo
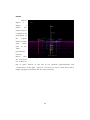
On the
other
hand,
Figure
5
shows
the
decision
the
program made
when
it
examined only
Democrats
the
in
same
region:
Notice
that,
for
the
Democrats,
the
software
"decided"
to
Figure 5: Unrotated Map of Democrats
place "liberal"
to the left of the plot and "conservative" to the right. There is, once again, no
logic to this decision, but it is simply a mathematical artifact of the way the
points lie in space. If you have only one map, this is of no consequence. But if
you have several maps representing several different segments of the
population (as in the present case) or representing the same population over
successive points in time, comparisons can be next to impossible. You should
convince yourself that the map of the Democrats and the map of the total
sample look very different.
These are not real differences.
Although Democratic voters differ from the total population by a certain
amount, they do not differ by as much as these maps seem to show, since the
largest part of the apparent differences are due to the artifactual differences of
39
Galileo
orientation.
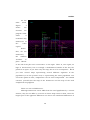
V5.5 is able to do away with artifactual differences due solely to the
orientation of the maps.
Figure
6
shows
map
the
of
voters
all
after
V5.5
has
rotated
it
match
to
the
map
of
Democrats as
closely
possible.
as
It is
important
to
understand
that V5.5 has
Figure 6: Rotated Map of All Voters
changed it in any way whatever.
not
distorted
the
map
or
All the distances or dissimilarities in the
rotated map are identical with those in the unrotated map.
But all artifactual differences of orientation have been removed,
enabling us to see the true differences between the Democrats and the general
population. As examination of Figures 5 and 6 reveal, both Democrats and the
general population agree substantially about where the attributes lie, and they
agree on their perceptions of the candidates. They differ, however, in where
they position themselves, with the Democrats placing themselves more to the
left or liberal side of the map, while the general population lies much closer to
the center.
40
Galileo
Maps of the 1988 election were chosen for this demonstration because
most people are familiar with the structure of the political domain, and you
might have been able to figure out for yourself that the maps were more similar
than they first appeared after some careful study. But in neighborhoods with
which you are unfamiliar it can be virtually impossible to distinguish real
differences from artifacts of orientation, so rotation is always recommended
when different maps are to be compared.
Free Concepts
When V5.5 matches two or more maps, it rotates one of them until the
location of all of the concepts in one map is as close to the location of the same
concept in the target map as possible without changing any distances in either
map.
But sometimes such a complete match is not desirable.
If you have
conducted an experiment, for example, where different groups of respondents
were exposed to alternative message strategies, you may have very good reason
to believe that some of the experimental (treated) concepts have changed their
locations due to your intervention.
If this is so, it is obviously not wise to try to match them from one space
to another.
In that case, Galileo*V5.5 allows you to name the concepts you
believe have moved, and it will try to match only the remaining concepts. In
this way it is possible for you to determine whether, where and how far the
treated concepts have moved.
In essence, when you specify free concepts (FCONS) in a V5.5
comparison of spaces, you are telling the program: "Rotate this map onto the
target map, but do not use the free concepts as part of the criteria by which you
judge how well they fit." Galileo V5.5 will then compare one space to another,
but will only use the stable concepts (SCONS) to determine when the fit is as
close as it can be.
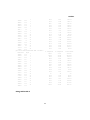
Regardless of the set of options chosen, V55 writes out the complete
eigenstructure of the spaces after rotation. In addition to the coordinates, V55
41
Galileo
also provides extensive information about the differences between pairs of
spaces, including the correlations among the concepts' position (row) vectors,
correlations among the dimensions themselves (column vectors), various
lengths and angles, and distances from each concept in one space to its
counterpart in the other:
The Rotated Coordinates of Space Number 2
9
15
1 SPORSPOR
-14.601
2 FUN FUN
32.831
3 FAMIFAMI
-8.670
4 GOODGOOD
-21.563
5 PRACPRAC
9.828
6 AFFOAFFO
-1.099
7 EXCIEXCI
-4.002
8 APPEAPPE
19.818
9 LUXULUXU
-2.123
10 RELIRELI
9.126
11 HONDHOND
11.499
12 MAZDMAZD
-15.233
13 FORDFORD
-8.321
14 TOYOTOYO
-10.994
15 NISSNISS
9.262
16 CHRYCHRY
-16.386
17 PONTPONT
10.628
18 YOURYOUR
-.293
10
11
12
13
14
16
9.830
9.683
15.203
.090
-15.596
2.487
12.072
-2.232
-12.118
40.077
15.576
-.754
.050
8.071
-2.213
-.112
-4.435
31.874
-.177
6.604
.055
7.058
-.924
-7.290
-6.524
-17.636
10.756
-.812
-11.554
-35.795
-.057
-13.901
-3.721
24.808
.087
14.863
5.673
-2.025
.068
-18.846
-6.786
-.215
-11.272
-15.019
8.555
6.260
-1.072
.065
-6.690
8.230
19.258
-.062
-3.229
-.843
.214
-.457
13.444
28.254
.097
-21.721
-15.114
3.524
-.088
-19.161
-22.745
12.223
-.116
-11.352
2.263
-24.368
9.715
-17.060
.037
1.156
-7.042
-11.429
20.822
-16.415
-.020
-7.359
6.487
18.217
-12.661
-3.788
-.058
5.737
-1.243
-28.000
-18.960
2.891
-.075
-15.489
3.227
1.766
18.192
-11.925
-.084
19.718
2.549
27.086
20.543
1.075
-.122
.188
18.080
-13.368
8.899
2.622
11.835
.065
10.698
6.433
9.643
-14.131
-16.658
-28.102
19.204
13.704
7.847
3.042
3.831
-3.512
.388
-8.495
26.807
-11.615
Distances moved in the interval between time
Concept
Concept
Concept
Concept
Concept
Concept
Concept
Concept
Concept
Concept
Concept
Concept
Concept
Concept
Concept
Concept
Concept
Concept
1
2
3
4
5
6
7
8
9
10
11
12
13
14
15
16
17
18
(SPORTY LOOKING
(FUN TO DRIVE
(FAMILY CAR
(GOOD VALUE
(PRACTICAL
(AFFORDABLE
(EXCITING
(APPEALS TO OLDER PEO
(LUXURIOUS
(RELIABLE
(HONDA ACCORD
(MAZDA 626
(FORD TEMPO
(TOYOTA CAMRY
(NISSAN STANZA
(CHRYSLER LEBARON GTS
(PONTIAC GRAND AM
(YOURSELF
The Mean Distance Between All Points in Space
2Row Vector Correlations Between Time 1 and Time 2
Concept
Correlation
Angle
1
.973300
13.3
)
)
)
)
)
)
)
)
)
)
)
)
)
)
)
)
)
)
moved
moved
moved
moved
moved
moved
moved
moved
moved
moved
moved
moved
moved
moved
moved
moved
moved
moved
1 and time
10.866i
51.601
12.350
10.365
14.886
21.579
3.082i
36.906
25.758
23.303
50.483
31.124
15.741
17.587
15.646
15.377
25.251
71.347
1 and their Counterparts in Space
T 1 Magnitude
85.14
42
T 2 Magnitude
70.86
2
units.
units.
units.
units.
units.
units.
units.
units.
units.
units.
units.
units.
units.
units.
units.
units.
units.
units.
2 is
25.181
Scalar Product
6193.67
Galileo
.666048
.980955
.981652
.964011
.945922
.995577
.858484
.944591
.566235
.977154
3864.74
4
44.27
58.50
2637.38
5
47.25
53.53
2438.37
6
66.24
60.67
3801.35
7
67.63
62.35
4235.35
8
64.55
71.73
3975.06
9
77.70
77.00
5650.95
10
19.78
27.85
311.94
11
55.50
74.53
3043.80
12
49.13
71.68
3291.32
13
64.36
77.48
4948.50
14
50.29
61.55
3004.20
15
62.79
60.22
3662.39
16
67.35
86.31
5874.76
17
66.49
85.90
5580.75
18
50.12
54.60
201.09
18.9
5.4
30.9
19.2
55.5
20.8
.989400
2235.24
61.99
15.4
42.6
.968503
48.57
63.56
11.0
.934637
.970548
69.09
3
11.2
.735754
.992399
2
48.2
7.1
13.9
14.4
8.3
12.3
.073492
85.8
2Col Vector Correlations Between Time 1 and Time 2
Correlation
Angle
1
.928148
21.9
2
.913699
24.0
3
.736367
42.6
4
.868421
29.7
5
.805446
36.3
6
.879610
28.4
7
.828018
34.1
8
.859884
30.7
9
.488869
60.7
10
.368248
68.4
11
.727375
43.3
12
.129603
82.6
13
.777226
39.0
14
.536489
57.6
15
.452336
63.1
16
.563065
55.7
17
.621029
51.6
18
.814261
35.5
T 1 Magnitude
Using Galileo*V5.5
43
T 2 Magnitude
Scalar Product
195.25
175.27
31762.25
133.98
115.83
14178.94
92.49
100.58
6849.51
88.64
86.11
6628.34
74.44
97.46
5843.60
69.01
95.15
5776.27
60.82
92.25
4645.92
52.47
66.77
3012.72
50.09
80.33
1967.02
32.58
60.17
721.85
32.28
62.27
1462.09
.47
.34
.02
13.18
50.13
513.45
43.30
35.71
829.47
49.93
58.71
1326.01
56.61
57.25
1824.82
90.08
81.80
4576.32
102.99
105.26
8827.56
Galileo
Galileo*V5.5 is an advanced product, and requires more skill than most
of the other programs in the Galileo system. After a little practice, however, it
can become quite easy.
V55 runs usually begin by running the program INTERGAL ("Make a
Runstream" on the GALILEO menu).
INTERGAL asks a series of questions
which set up the V5.5 run. INTERGAL has complete online context sensitive
help, and so it's easiest to learn to use it by using it. But some specialized runs
can be tricky.
Statistics
Statistics is a default option in INTERGAL, so you get them automatically
when you use V5.5 to analyze your paired comparisons. Option 18 on the option
control line specifies that statistics are to be calculated.
A.M.G.
To get the Automatic Message Generator to run, it is only necessary to
answer "yes" when INTERGAL asks if you have any specifications. Then say
yes when it asks if you want messages. It will then ask you to specify the start
and target concepts. After that, message strategies will be calculated. V5.5 will
produce every possible strategy using one, two, three and four attributes. It will
also list the ten best strategies.
Remember, though, V5.5 only knows what
strategies will be most effective; it has no way of knowing whether they're true
or not -- that's up to you. (In the 1972 election, A.M.G. found that one of George
McGovern's most effective strategies to win the election was to claim he was
Nixon.)
Comparison of Spaces
44
Galileo
To rotate raw paired comparison data, simply run INTERGAL, answer
"yes" when asked if you have any specifications, and "yes" for comparison of
spaces. You will also need to tell it whether there are any free concepts, and, if
there are, which ones they are. INTERGAL will also ask if this is a time series.
(That means a set of datasets from the same population collected at multiple
points in time.) If you say yes, it will automatically compare each dataset to the
one which immediately preceded it in time, (that is, 2 to 1, 3 to 2, 4 to 3, etc.) If
you say "no", it will ask you for a "MAINSPACE." A MAINSPACE is one space to
which you wish to compare all the others. Typically, you might have a total
sample which has been broken down into subsamples; you might want to
compare each subsample to the main sample. Usually,spaces which have all
been rotate to a single common space can then be compared (visually) to each
other without further rotation.
If you need to rotate coordinates you already made, you must append them
to the runstream file.
V5.5 can't read them directly from their own file. You
must also change the first "1" on the OPTIONS line of the runstream file to "3".
("1" is the option for paired comparison input data; "3" is the option for
coordinates input.) You can make these changes with any ASCII file editor. If
you don't have a favorite ASCII editor, you can use the EDWIN editor provided in
the TOOLS directory. Then 1) change the "1" on the options line to "3"; remove
the file names from the end of the runstream file, and append the coordinates
to the runstream file.
Conversion of Coordinates
Note: V55 cannot read coordinate files made by Microgal, Catpac, or Galnet
without editing.
You will have to use your ASCII editor to delete the concept
labels and standard errors (if any) from the coordinate file before input to V55.
You will also have to edit the format statements on the header line. Galileo V5.5
45
Galileo
expects to see, in columns 10-12,13-14 and 15-16, respectively, the number of
concepts, the number of real dimensions, and the total number of dimensions
in the solution. MICROGAL, CATPAC, and GALNET provide these numbers, but
in columns 10-13, 14-16 and 17-19 respectively.
Similarly, coordinate files made by V55 cannot be read by ASG or
Galileo*PLOT. If you wish to plot coordinate files made by V55, you will have to
append the concept labels to those files using your ASCII editor. If you have also
calculated standard errors using Galileo*MICROGAL, you can append these
errors to the file following the concept labels. You will not, however, have to edit
the header line, since PLOT and ASG can read the V55 formats.
See the
formatting requirements of Galileo*PLOT for more information on plotting
formats.
Running Galileo*V5.5
After you have set up your runstream, you only need to say "V55" or
choose option 12 Run V55 from the Galileo menu) and the program will ask you
where your runstream is. The program will then automatically execute, using
the instructions in the runstream file. There will, of course, be no problems at
all. (If you believe that, you are new to computing!)
V5.5 is an expert's program. You may have some trouble at first, but, if
you take notes on what you are doing (and what has gone wrong) you will soon
find it quite simple. And if you have difficulty, please call The Galileo Company.
Option 13: Screen Plot: Galileo*PLOT
I read coordinates made by Microgal, V55, or Galnet and plot them
46
Galileo
graphically on the screen. Only the first three dimensions are plotted. The
first dimension is the horizontal axis, the second dimension is the vertical axis,
and depth is the third dimension. Each concept is represented as a sphere
whose size is a function of the uncertainty of measure.
The radii of the
spheres representing the concepts is one standard error. (Measurement of the
uncertainty of location of the concepts depends on a complete measurement of
all pairwise distances among the concepts. ) Among the Galileo programs, only
MICROGAL and V55 provide complete pair comparison measures, and only
Microgal computes the standard errors from which these spheres are made.
GALNET allows producing ordinary perceptual maps from object-attribute data.
When standard errors cannot be calculated, radii are defaulted to a convenient
number
which
allows
easy
visualization,
but
may
underestimate
or
overestimate the actual error of measure. (I'll warn you when the errors are
missing and I have to use the default radii.)
I correct for parallel perspective according to distance from the eyepoint,
as does the human eye.
This means that objects close to the viewer will
appear much larger than those far from the viewer, just as they do in real life.
(Put your thumb in front of your eye as you read the screen and you can see how
this happens.)
You can interact with the plot. You can rotate the space up, down, left
and right any arbitrary number of degrees. This is not as easy as it sounds, and
rookies frequently become hopelessly lost after a few rotations. If this happens
to you, just press [F8] (RESET); no harm can be done by experimenting.
I'm also able to help you evaluate potential strategies. You provide me
with a goal (that is, the position you want to take in the market place, or where
you want to go). You also tell me what concept (product, candidate, etc.) you
want to move to that position. Then you can suggest various combinations of
47
Galileo
other concepts, attributes, and the like, that you think might form an effective
strategy for moving the desired concept to the desired position. I will tell you
how far are from that position at the start, how close this strategy is capable of
bringing you, and what percentage of the original distance this would be. (Zero,
of course, would be a perfect strategy which could take you exactly to the
position you wish to occupy.)
While the typical procedure is to move one concept to the position of
another single concept (e.g., to move a product to the point where most people in
the market can be found, or to another ideal point),
I am able to evaluate
strategies of any degree of complexity. You may try to move one concept to the
middle of any number of others; or you may try to move several concepts toward
one other, or several concepts to the center of several others. As with any other
simulator, my accuracy depends on the tested strategy being fully implemented,
and on the fact that outside forces such as competitor's strategies don't change
the situation beyond my existing knowledge. No strategy can ever be perfectly
implemented, and outside circumstances never stand still. A wise analyst will
always assume each strategy will be somewhat less effective than its
simulation. But it is appropriate to compare strategies to each other.
I currently don't support printing, but you can capture the PLOT image
using a screen capture utility, and insert it into word processing documents in
the standard way. The plot can then be printed with the document, using the
print facility of your word processor.
If you currently do not have a screen
capture utility, contact your Galileo representative who can help you select one
that's right for your applications.
I'm a very powerful program, and have my own User Manual and
Tutorial, which is included in the documentation.
Please consult this
document for further information about how to use me effectively.
48
Galileo
Option 14: Run Oresme: Galileo*ORESME
I'm a self-organizing neural network like CATPAC. (we're related).
optimized for conversation, however.
I'm
You can type words to me, and I respond
with the words I associate with those words.
What's more, I'm self-organizing,
which means I can learn from the conversation and change the patterns of
associations by paying attention to our conversations.
I can also read . win
matrices made by CATPAC, MICROGAL, GALNET and V55, so that all the
patterns of association they learned are instantly available to me.
(Don't you
wish you could do that with YOUR relatives?)
This means that I can talk to you about some text CATPAC has read, and
I'll know the things it discovered. You might think of me as a non -hierarchical
clustering system.
I read the word or words you give to me, and I find out what
other words go with them; this set of words can be thought of as a cluster or
category.
But I don't assign each word into only one category, as does a
hierarchical clustering scheme, and a word can belong to many categories for
me, as for you.
(Marketers find this helpful when they are trying to develop a
product that can exist in, and compete in, several segments at once.)
Like Galileo*PLOT and Galileo* CATPAC, I'm a very powerful program
and have my own manual, which you should consult for further information
about how to use me effectively.
Option 15: Input Network Data: Galileo*NETIN
Perhaps the most important mathematical form in all multivariate
analysis is the square matrix. I'm a simple utility that allows you to enter any
arbitrary square matrix and normalize it in one or more useful ways. I'm called
49
Galileo
NETIN because the most general theoretical form that is used to describe such
matrices is network. Each row or column of the network is called a node, and
the cell entries represent the relationships (or connections or weights) among
the nodes. I was created originally to deal with switching data, such as brand
loyalty and the like.
There are two kinds of switching data: loyalty and source of sales.
Loyalty data tells the percentage of users of brand x that switch to brands y, z,
and so forth. Source of sales data tells the percentage of those who switch to
brand x that come from brands y, z and so on. I can make either type for you,
but it's up to you to know which kind you want.
Option 16: Forecast Trends: Galileo*FORECAST
I can project future sales and installed base from loyalty data. By loyalty
data I mean a square products X products matrix whose entries give the
percentage of those who use product x that switch to product y during the period
the matrix represents.
I also need to know the percentage of the entire
installed base that is represented by each of the products in the matrix, the
percentage of each of the products that is traded during the period, and the rate
at which each product (or its users) goes out of service during the period. (A car
which has gone to the junk yard, for example, can't be traded in.)
As you go through the program, I can help you with files, formats and the
like.
Just enter '?' whenever you don't know what to do next.
NETIN is just the ticket for making the loyalty matrix I need.
By the way,
Tell NETIN that
FORECAST sent you!
Option 17: Review a study: Galileo*READ
ELQM (The Electronic Questionnaire Maker) sets up the Galileo*CATS
50
Galileo
system, makes the files, and automatically controls access to data. If you need
to review a particular study after you've set it up with ELQM, you need me. Just
tell me the name of the directory on which the study resides and I'll find the
relevant information and write it out on the screen for you.
(If you have a
favorite file editor, you can read the information file with that.
The file is
always called STUDY.DAT, and it resides on the study directory. Don't modify
this file, however, since SPED depends on it to work properly.
Option 18: Modify exclude file: Galileo*EXCLUDE
Whenever CATPAC reads text, it automatically skips certain words that
most people don't care to examine (such as a, the, if, because, and so on.) You
may have some additional words in your text you'd like to ignore,or, you may
want to remove some words from the exclude list. I help you add or delete words
from the exclude list.
Option 19: Go to DOS
I'm actually not a program at all. When you choose me, I just suspend
the Galileo system and return you to DOS. To return to Galileo Control, simply
enter a blank line.
Option 20: Quit
Choose me and I shut down the Galileo system and relax. Phew!
51
Galileo
Appendix 1: Tools
Your Galileo installation includes a directory called GALILEO\TOOLS.
On this directory The Galileo Company has supplied three helpful DOS tools.
First is a simple read only editor called LOOK.
LOOK is a public-domain
program which allows you to examine the contents of any file interactively. It is
convenient since you can page up and down or scroll up, down, left and right in
the file using the cursor control keys. You can also easily read the 132 column
format files that V55 writes. And, since LOOK is a read only editor, you don't
run the risk of altering important files.
To use LOOK, simply enter the command
LOOK [filename]
at the DOS prompt. To leave LOOK, press [ESC].
Also included is a very powerful ASCII editor, EDWIN . EDWIN is a public
domain program which follows the formats of WORDSTAR, and can be very
helpful in modifying files produced by V55 for use in the other Galileo programs
and vice versa. EDWIN has complete online help, accessed by pressing F2 once
in the program. To start EDWIN, simply enter the command
EDWIN
at the DOS prompt. You can also enter a file directly with EDWIN by entering
the command
EDWIN [filename]
.
If you already have an ASCII editor you favor, you may use that instead
52
Galileo
of EDWIN . For more information on installing and using EDWIN, consult the
documentation provided on the \GALILEO\TOOLS directory.
The last tool provided is called UP . Up lets you climb up your directory
tree in only three keystrokes.
If your default directory, for example, is
GALILEO\DATA, then issuing the command
UP
at the DOS prompt will set your default directory to \GALILEO.
Issuing the
command again will move you to the root directory.
All three of these utilities are public domain software and are neither
warranted nor supported by The Galileo. The are provided at no charge as a
convenience for the user.
Note that authors of public domain software sometimes request
voluntary payments from users for the use of their programs.
No such
payments have been made on your behalf by Galileo or any of their
representatives.
53