1
important
User
If7formation
Solid-state equipment has operational characteristics
differing from those of electromechanical equipment.
“Application Considerations for Solid-State Controls”
(Publication SGI-1.1) describes some important differences
between solid-state equipment and hard wired
electromechanical devices. Because of this difference, and
also because of the wide variety of uses for solid-state
equipment, all persons responsible for applying this
equipment must satisfy themselves that each intended
application of this equipment is acceptable.
In no event will Allen-Bradley Company be responsible or
liable for indirect or consequential damages resulting from
the use or application of this equipment.
The examples and diagrams in this manual are included
solely for illustrative purposes. Because of the many
variables and requirements associated with any particular
installation, Allen-Bradley Company cannot assume
responsibility or liability for actual use based on the
examples and diagrams.
No patent liability is assumed by Allen-Bradley Company
with respect to use of information, circuits, equipment, or
software described in this manual.
Reproduction of the contents of this manual, in whole or in
part, without written permission of the Allen-Bradley
Company is prohibited.
0 1987 Allen-Bradley
Company
rl
Table
of Contents
Chapter
I
Page
Title
Using this Manual
..............................
Chapter Objectives
.....................................
Vocabulary
.....................................
Precautions
................................
Related Products
Summary .......................................
2
Introduction
l-2
l-2
1-4
To The Vision Input Module
Chapterobjectives
._.._......_................_..
_. . . . . . . . . . . . . . . . . . . . . . . . .
What Is A VIM Module?
What Can The VIM Module Do? . . . . . . . . . . . . . . . . . . .
Can The VIM Module Keep Up With
Your Production Lines? . . . . . . . . . . . . . . . . . . . . . . .
CanISetUpAVIMModule?
......................
Is Machine Vision Difficult To Use? . . . . . . . . . . . . . . . .
3
l-l
l-l
2-l
2-l
2-2
2-3
2-3
2-3
Self- Teach Session 1
Chapter Objectives
..............................
Installing And Powering Up A Vision
Input Module
................................
Displaying The Analog Image .....................
Focusing The Camera ............................
Viewing Through A Solid State Camera ............
Configuring
A VIM To Verify The Presence
.......
Of A Workpiece On A Bright Background
Setting Thresholds
..............................
Adjusting The Windows
..........................
Freeze On Reject Operation
......................
Go On Reject Operation
..........................
Workpiece Flaws Which Will Cause
A REJECT Decision ............................
Controlling
The VIM Module From A PLC ..........
3-l
3-3
3-4
3-7
3-8
3-13
3-19
3-20
3-28
3-28
3-29
3-30
Table of Contents
2
Chapter
4
Tit/e
Self- Teach Session 2
..............................
Chapterobjectives
Introduction
To Self-Teach Session 3 ..............
Configuring
A VIM Module To Compensate
.......................
For Workpiece Position
......................
Adapting To Front Lighting
..................
Spatial Filtering Of Line Gauges
.......................
Line Gauge Measurements
Controlling
the Twenty-Two
Line Gauges ..........
5
Page
-
4-l
4-l
4-l
4-l 1
4-l 5
4-17
4-18
Se/f- Teach Session 3
..............................
Chapter Objectives
...............................
Chapter Contents
Brightness Probe Modes .........................
..........
Entering Mode 1 Lighting Compensation
Verifying Arbitrarily
Shaped Regions
...........................
Using Line Gauges
......................
Image-To-Image
Variability
Verifying Arbitrarily
Shaped Regions
Using Windows
..............................
................
Using Through-The-Lens
Windows
Working With Mixed Contrast ....................
Verifying The Presence Of A Blind Hole ............
...........................
Inspection Cycle Time
Summary .......................................
5-1
5-1
5-2
5-5
5-6
5-9
5-l 2
S-14
S-17
S-20
5-24
5-26
-
List
of Figures
FigurelTable
2-1
3-l
3-2
3-3
3-4
3-5
3-6
3-7
3-8
3-9
3-10
3-11
3-12
3-13
3-14
3-15
3-16
3-17
3-18
3-19
3-20
3-21
3-22
3-23
3-24
3-25
3-26
3-27
3-28
3-29
3-30
3-31
3-32
3-33
3-34
Title
Page
Vision Input Module .............................
Vision Module Accessories and Connections .........
The VIM Module Installed in a 1771 I/O Rack .........
The VIM Module Installed in A Standalone Rack. .....
Camera Mounted On Stand .......................
Thresholded Image With Window 1
Shown As A Bright Square .....................
Sequence of Displays Enroute to Directing
Live Image to Monitor .........................
Camera to Workpiece Distance and Width
ofCamera’sFOV ..............................
Spectral Response of the Eye and the
Video Camera ................................
Workpiece Viewed Against Three Sheets
of Metalic Paper ..............................
VIM User Interface is Divided Into Three
Branches .....................................
Structure of Brightness Branch ....................
Structure of Line Branch ..........................
Structure of Window Branch ......................
Display Showing Threshold Image
with Main Menu ..............................
Main Menu Showing Swingarm Triggering
and Freeze On Reject .........................
Brightness Main Menu ...........................
Brightness Probe Move Menu .....................
Brightness Probe Moved to Upper-Left
of Image. ....................................
Brightness Probe HiLo Range Menu ...............
Display After Brightness Probe Limits
AreSet ......................................
Threshold Setting Menu ..........................
Threshold Setting Menu After Floating
Threshold 1 ..................................
Threshold Setting Menu for Threshold 1 ...........
Threshold Setting Menu After Floating
Threshold 2 ..................................
Window Main Menu .............................
Window 1 Is Now Circular Shaped .................
Part 2 Of Window Main Menu ....................
Window Move Menu ............................
Window 1 Has Been Correctly Positioned ..........
Window Size Menu ..............................
Window1 Has Been Positioned And Size ...........
HiLo Range Menu ...............................
Window 1 Range Limits Have Been Set ...........
Window 2 Is Being Adjusted .....................
2-l
3-2
3-3
3-4
3-4
3-5
3-6
3-8
3-9
3-10
3-12
3-l 2
3-l 4
3-14
3-15
3-15
3-16
3-l 6
3-16
3-17
3-17
3-18
3-19
3-19
3-19
3-20
3-21
3-21
3-22
3-22
3-22
3-23
3-23
3-24
3-25
List of Figures
2
Figure/Table
3-35
3-36
3-37
3-38
3-39
3-40
3-41
3-42
3-43
3-44
3-45
3-46
3-47
3-48
3-49
3-50
3-51
4-l
4-2
4-3
4-4
4-5
4-6
4-7
4-8
4-9
4-10
4-11
4-12
4-13
4-14
4-15
4-16
4-17
4-18
4-19
4-20
4-2 1
4-22
Tit/e
Window 2 Has Been Enabled And A
Circular Shape Selected .......................
Part 2 of Window Main Menu ....................
Window 2 Has Been Positioned
...................
Window 2 Has Been Correctly Sized ...............
HiLo Range Menu With Initial Limits ..............
Range Limits For Window 2 Have Been
Correctly Set .................................
Main Menu After Configuring
the VIM ............
Clock Icon Displayed While Storing
“Configuration”
.............................
Display After Storing Of Configuration
.................................
IsComplete
Rejected Image Frozen On Video Monitor
.........
Go On Reject Has Been Selected ..................
Workpiece With Missing Upper-Left Corner
.......
Workpiece With Improperly Punched Hole ........
Workpiece With Oversized Hole ..................
Workpiece With Undersized Hole .................
Command Bits From PLC to VIM Module ...........
Status Bits From VIM Module to PLC ..............
Main Menu When Adjusting X-Gauge .............
X-Gauge Enabled
...............................
Line Main Menu Part 2 ..........................
Line Move Menu ................................
X-Gauge Has Been Positioned
....................
LineSizeMenu
.................................
Z-Gauge Has Been Sized .........................
HiLo Range Menu ...............................
X-Gauge Range .................................
X-Gauge Has Been Adjusted
.....................
Line Main Menu When Adjusting
The Y-Gauge
................................
Line Main Menu Part 2 When Measuring
Trailing Edge Of Lowest Black Blob ............
Y-Gauge Has Been Positioned
....................
Y-Gauge Range Limits Have Been Set .............
Line Main Menu Part 2 After Y-Gauge
Has Been Adjusted
...........................
Window 2 Has Been Floated In X & Y ..............
Window 1 Has Been Floated
.....................
Workpiece Slid Toward Lef On Screen .............
Window 1 AsShifted ByVIM
.....................
Workpiece Slid Up On Screen .....................
Workpiece Slid Off The Y-Gauge
.................
Camera Image Obrained Using Front
Lighting
__...__..._._..__....._...__......_.
Page
-
3-25
3-25
3-26
3-26
3-26
3-27
3-27
3-27
3-28
3-28
3-29
3-29
3-30
3-30
3-30
3-31
3-31
4-2
4-3
4-3
4-3
4-4
4-4
4-4
4-5
4-5
4-5
-
4-6
4-6
4-7
4-7
4-8
4-9
4-9
4-10
4-10
4-10
4-11
4-11
-
list of Figures
-
FigurelTable
4-23
4-24
4-25
4-26
4-27
4-28
4-29
4-30
4-31
4-32
4-33
4-34
4-35
4-36
4-37
4-38
4-39
5-l
5-2
5-3
5-4
5-5
5-6
5-7
5-a
5-9
S-10
5-11
5-12
5-13
5-14
5-15
5-16
5-17
5-18
5-19
3
Title
Page
Threshold 1 Has Been Set ........................
Threshold 3 Has Been Set ........................
Brightness Probe Position and
Reference Value .............................
Window 3 Has Been Adjusted
....................
....................
Window 1 Has Been Adjusted
Filter Selections
.................................
Measurement
Pairs Available with
X-Gauge & Y-Gauge ..........................
Measurement Pair Is Leading Edge of
First White Blob ..............................
Y-Gauge Measures Leading Edge of
First White Blob ..............................
Measurement
Pair Includes Leading
Edge And Width Of The First Blob .............
X-Gauge Measures Leading Edge of
First White Blob ..............................
Coordinate System Used By Line Gauges ...........
Additional
Measurement Pairs Available
With The Twenty-Two
Line Gauges ............
Line Gauge 1 Is Vertical And Uses Image 3 .........
Selected Measurement
Pair For Line
Gauge1 .....................................
Line Gauge 1 Counts Black Blobs ..................
Line Gauge 1 Counts Edges .......................
.......
Approximate
Position Of Sample Workpiece
Sample Workpiece With Window 2 ...............
Teardrop Shaped Opening Used in This Example ...
Line Gauge 1 Is Used To Verify Width ..............
Line Gauge 2 Is Used To Verify Height .............
Line Gauge 3 Is Used To Verify Taper ..............
Typical Decision Results When Range
Limits Are Set Too Tight
......................
Formation Of A Digital Image ....................
Variations In Length Measurements Due
To Finite Spatial Sampling
....................
Window 2 Is Inside The Right Side Of
....................................
Teardrop
Window 3 Is Inside The Left Side Of
....................................
Teardrop
.........
Window 4 Is Inside The Body Of Teardrop
Teardrop Shaped Region Represented
..................................
ByWindow
.................
Window 3 Is “Through-The-Lens”
Workpiece With Additional
White ................
WorkpieceWith
Additional
Black .................
Workpiece Slid Toward Left On Screen ............
Arrangement
Of Metalic Sheets ..................
Threshold 3 Separates Silver Sheet From Gold ......
4-12
4-13
4-13
4-14
4-15
4-16
4-17
4-17
4-18
4-18
4-19
4-19
4-20
4-20
4-2 1
4-21
4-21
5-3
5-3
5-6
5-6
5-7
5-7
5-9
5-9
5-10
5-l1
S-11
5-12
5-12
5-14
5-14
5-14
5-15
5-16
5-17
List of Figures
4
Figure/Table
5-20
5-21
5-22
5-23
5-24
5-25
5-26
5-27
5-28
5-29
5-30
5-31
5-32
Title
Page
Threshold 4 Separates Gold Sheet From Blue .......
.....................
X-Gauge Has Been Adjusted
.....................
Y-Gauge Has Been Adjusted
Line Gauge 1 Has Been Adjusted ..................
Line Gauge 2 Has Been Adjusted ..................
............
Physical Setup For Illustrative Example
.....
Diffuse Lighting Used For Illustrative Example
Camera Image For Illustrative Example ............
Phenomenology
Exploited By Illustrative
Example
....................................
.....................
Y-Gauge Has Been Adjusted
.....................
X-Gauge Has Been Adjusted
Line Gauge 1 Has Been Adjusted ..................
..........
VIM Module Signal Timing-Short Trigger
5-17
5-17
5-18
5-18
5-18
5-19
5-20
5-20
5-21
5-21
5-22
5-22
5-23
-
Chapter
1
Using This Manual
Read this chapter to familiarize yourself with the
remainder
of this manual. It tells you how to use
this manual efficiently.
This manual
describes step-by-step
how to use an
Input Module (VIM) to
Allen-Bradley
2803 Vision
perform simple non-contact inspection tasks.
We assume that you have access to a Vision Input
Module and want to learn how to use it effectively.
No previous knowledge of machine vision is necessary to use a VIM Module successfully.
You do not
need to know how to program Ladder Logic or be familiar with a Programmable Logic Controller
(PLC)
to read and use this manual.
Your VIM Module
must
be installed correctly in
order to perform
the applications contained in
this document. For instructions and clarifications
regarding the correct
installations and setup of
the module, consult the VIM Users Manual, Pub
2803-800 Chap. 5. Installation and integration.
This manual uses
be new to you.
several terms in a
way which may
o BLOB - A contiguous string
of ones or zeros
along a given horizontal or vertical line in
a thresholded image. This is described in
Chapter 4.
o CONFIGURATION - The controlling
parameters
used by the VIM Module
to inspect a workpiece.
The configuration
tells the VIM
Module
what to inspect and, optionally, how
to judge it as acceptable.
o ICON - A pictorial representation
of a command. The VIM user interface
uses icons to
inform you of the choices which are available at a given point
in time. Touching an
icon firmly with the tip of the light pen is
termed
"pickingt' an icon and causes the
associated
command to be executed. This is
discussed in Chapter 2.
o IMAGE - The representation of a scene being
viewed
by
a video
camera
as
a twodimensional array of numbers. A camera views
a scene and transmits
electronic signals to
the Module. The Module turns those signals
into an image. This is discussed in Chap. 5.
o LINE GAUGE - Analyzes a set of horizontally
or vertically aligned pixels. You enable and
specify the orientation, location,
and size
Page
Chapter
l-2
1
Using this manual
of the twenty-two
(22) line gauges on an
individual basis. This is discussed in Chapter 4.
o PIXEL - Literally, "PICture ELement. An elemental portion of an image represented by a
number. The VIM Module measures linsingle
in terms
of the number of
ear dimensions
pixels crossed in going from one location to
the other.
The VIM Module measures areas in
terms of the number of pixels that are contained within
the boundary
of that area.
This
is discussed in Chapter 3 and Chapter
4.
o WINDOW - A user-defined region of the image
are to be
in which white (or black) areas
measured.
The area is measured in square
pixel units
and is commonly
called
the
"pixel countl'. The number can be compared
with a specified acceptance
range as discussed in Chapter 3.
o WORKPIECE
- The
the VIM Module.
object to
be inspected by
Additional definitions
of technical
terms can be
found in Chapter 1 of the VIM User's Manual (Publication 2803-800).
Precautions
You will see two types of precautionary statements
as you read this manual; IMPORTANT and CAUTION.
o IMPORTANT - Used to make you aware of circumstances
which could cause the configuration you are currently
establishing to be
incorrect
in the sense that it will REJECT
all workpieces unconditionally.
o CAUTION
Used to make
instances
where
damage
to
could occur.
Related
Products
Compatible
Chassis
You can install a VIM Module
rack or any system that uses
mable
controllers.
There
ltuniversal I/O" products
1.2).
YOU aware of
your equipment
in any 1771 series I/O
Allen-Bradley programare
more
than
100
(see publication 1771-
o You can put your VIM Module in any module group
of a 1771 Series I/O chassis.
Chapter
0
Related
Publications
What The VIM
Self-Teach
Manual Contains
Using this manual
1
Page
1-3
You can put two or more VIM Modules in the
power is
same chassis as long as sufficient
provided.
User's
Manual
the Vision
Input Module
Consult
(Publication
No. 2803-800)
for reference information. That publication includes a detailed descripas other useful backtion of each icon, as well
ground information.
2HAPTER
TITLE
1
Using
ThisManual
Self-TeachManual'spurpose,
audience,terminology,
contents,
anda listofrelatedpublications
2
Introduction to the
Vision Input
Module
Describesthe functionalityoftbe
module, typical inspection
tasks,
general module set up procedures,
gives an overview of Self-Teach
sessions 1,2, and 3.
Session 1:
Describes VIM module
set-up.
Explainscontrast,confiig
3
Using
the
Brightness
Probe
and Windows
WHAT’S
COVERED
the presence of a hole, how to trigger
the module.
4
Session 2:
Using Line Gauges
Configuring the module
to
compensate for workpiece positioning. Adapting inspection
procedures for surface feature
measurement.
5
Session
3:
Getting
theMost
OutOfYourVIh4
DescribesMode
1lighting
correction,
verifyingarbitraryshapedfeatures,and
areas of mixed contrast.
Example of
a blind
hole, measuring the inspection
module
cycle time.
Page
l-4
Summary
Chapter
1
Using this manual
of your
successful applications
You will produce
Vision Input Module by following the techniques in
begin by giving you an overview
this manual. We'll
of the VIM Module and what you can expect to do
with it.
Chapter
2
Introduction
Chapter Objectives
This chapter
answers some basic questions
about
industrial applications of the Vision Input Module.
Introduction To The
Vision Input Module
Welcome to the world
of practical
machine vision
for your Allen-Bradley Programmable
Logic Controller
(PLC). The Vision
Input Module (VIM) provides
machine vision suitable for any environment where a
1771 I/O Chassis can be used. Moreover since you
will be actively
involved in configuring the VIM
Module to perform inspections
on your production
line, you will be able to easily reconfigure should
the requirements of your plant's production process
change.
What is a VIM
Module ?
First and foremost,
the VIM Module is designed and
built in the Allen-Bradley
tradition of quality.
This is a module which occupies
a double slot in
any 1771 series I/O chassis
and is connected to a
solid-state video camera and a monitor (see Figure
2-l). In production operation, the Module's "TRIGGER" can be a signal line which is set high by the
Ladder Logic of the PLC. Having received a trigger, a second signal line is raised by the VIM Module indicating that it is "BUSYI'.
Fig. 2-l
Vision Input Module (VIM)
Page
2-2
Chapter
2
Introduction
low after the inspection has been
This line goes
is made
completed. The outcome of the inspection
line:
available to the PLC on yet a third signal
line signifies a
DECISION.
Logic high on this
logic
low signifies an
"REJECT"
decision
while
"ACCEPT" decision
(i.e. this particular workpiece
passed
inspection).
same signals
(i.e.,
These
"TRIGGER", "BUSY" and "DECISION") are also directly
accessible via terminals on the swingarm, and allow
the Module
to be used in a "stand-alone" manner.
When necessary, information on why a specific workpiece was rejected
is available to the PLC via a
block
transfer operation. For more information on
ladder logic, consult the appropriate PLC Manual.
What Can The VIM
Module Do?
The VIM Module
can inspect workpieces placed in
front of its video camera for the presence of critical items at known locations on the workpiece. The
images it analyzes are painted with just two colors
- black and white. Hence, the items whose presence
is being verified need to have a certain amount of
contrast
with the surrounding areas
of the workpiece. The Module
can analyze as many as four different levels of contrast simultaneously.
In those
situations
verified
where
the items being
are
always a fixed distance from the edges of the workpiece,
the VIM module can be configured to automatically
in the workpiece
accommodate
variations
positioning in front of the camera.
Representative items which the four (4) windows and
twenty-two (22) line gauges can readily verify are:
the presence of pierced, drilled, or machined holes at known locations on a workpiece
the presence of a light colored item on a
dark workpiece or vice-versa
that the outside dimensions of the workpiece
fall within a user-specified range
that the inside dimensions of an opening or
cutout fall within specified ranges
that the area of a contrasting
within a specified range
region falls
that a contrasting
object is located within
a specified range from the edge of the workpiece in the X and Y directions
that the correct number of certain
present.
items are
Chapter
Can The VIM Module
Keep Up With Your
Production Lines?
2
Introduction
Page
2-3
Industrial production lines run at rates which deof the operapend primarily upon the complexity
Several seconds per worktions being performed.
Several
piece
is typical
on automotive
lines.
workpieces
per second
is typical
on electronic
lines. On bottling lines, 1,200 or more workpieces
Strictly speaking, the rate
per minute is common.
can inspect a workpiece
at which
a VIM Module
depends upon how complex a task it is configured to
line situations, a
do.
However,
for production
good working rule is;
"If the advance of individual workpieces is
controlled by a PLC, then a VIM Module
can
inspect what is in the camera's field-ofline's maximum
view at
your production
rate."
Can I Set Up A VIM
Module?
A light pen and monitor, attached to the VIM
Module, support a simple menu of pictorial symbols
called l'iconslf. Most people quickly feel at ease
with these icons for they depict the choices which
are available as you configure
a Module to meet
needs of your production
the specific inspection
process.
The Module also supports a "stand-alone11
mode which allows you to work with sample workpieces away from the noise
and distractions of the
production
line and then, when you feel ready,
ideas or your
inspection procedure to
apply your
workpieces on the actual production line.
Is Machine Vision
Difficult To Use?
Since machine vision spans a broad range of disciplines, considerable attention to details is often
required.
The goal of this manual is to make machine vision an effective tool in your hands.
Since most people learn more quickly
by doing than
reading, this manual is action-oriented.
The three self-teach
sessions in this manual
will walk
you through actual vision applications. Each succeeding session is intended to be roughly twice as
long as the preceding one. You are encouraged to
extend your experience with the VIM Module between
each of these three sessions.
Session 1 walks you
through
the use of llwindowsl'to perform pass/fail
verification of the presence of a hole in a workpiece.
Many real-world
inspection
tasks can be
done using simple variations of this application.
A user who completes
Session 1 will be able to
successfully apply the VIM Module to some production line inspection tasks.
Session 2 introduces
you to line gauges and walks you through the key
elements
involved
in pass/fail inspection. When
you have completed Session 2, you will be able to
use your VIM Module for most
Page
2-4
Chapter
2
Introduction
production
line inspection tasks. Session 3 introduces you to the finer details of the Module's
operation by walking you through examples of verifying the dimensions of a region of mixed contrast,
and verifying the presence of "blind holes" in a
workpiece. Completion of Session 3 will
allow you
to successfully
use the full capability of the
Module.
As you will see, the concepts
involved in AllenBradley's Vision Input Module are rather simple to
describe in words.
However, the usefulness
of the
VIM
Module in a factory
is far-ranging. It is
our hope that this Self-Teach Manual will serve as
a gateway for you. Ultimately, your real teachers
will be the camera images, the VIM Module itself,
and your own, ongoing, experience in using
it to
improve production processes in your plant.
Chapter
Chapter Objectives
3
Self-Teach
Session
I
is to get you and
of this session
The objective
To this end we will:
your VIM working together.
o describe
module.
how to install
and power up your VIM
o help you become familiar with the VIM module's
capabilities by walking you through using it to
inspect the sample workpiece supplied with this
manual.
Along
the way, we will
words which have technical
of machine vision.
acquaint you with some
meanings in the realm
The first example given - verifying the presence of a hole using backlighting
- illustrates
techniques which have a broad range of applicability. When you have completed this working session,
and familiarized yourself
with Chapter
1 of the
VIM User's
Manual, you will be able to successfully apply a VIM to some of the production line
inspection applications in your plant.
The things
needed for
Self-Teach
0 A 2803 Vision Input Module
o A 1771 Series I/O Rack
or 1771-PSC)
Session I are:
(Cat. # 2803-VIMl)
(such as Cat. # 1771-A2B
o A Rack Power Supply such as (Cat. #1771-P3)
0 A Camera
(Cat. # 2801-YB)
o A Camera Cable
(Cat. # 2801-NC5)
0 A 25 mm C-Mount Lens (Cat. # 2801-NLl)
o A Video Monitor
(Cat. # 2801-N6)
o A Video Monitor
Cable
(Cat. # 2801-NC2)
0 A Light Pen (Cat. # 2801-N7)
0 A VIM Power Supply
(Cat. # 2801-Pl)
o A Reliable Source of Light (such as
Cat # 2801-N17 - Precision Ring Light)
Page
Chapter
3-2
3
Self-Teach
Session
o A VIM Self-Teach Manual (Publication
No. 2803-819) Containing:
- A Sample Workpiece
Shield)
(Metallic Drafting
- Four (4) Different
Sheets of Metallic
o A Camera Stand
(Cat. # 2801-N3)
o A Normally-Open
800A-M2AG)
o A Tape Measure
Paper
Push Button Switch
(Cat. #
(User-Supplied)
o Sufficient Wire To Connect The Power Supply,
VIM Module, Swingarm and Push Button
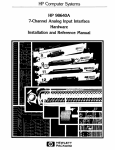
Fig. 3-1.
VIM Module Accessories And Connections
WARNING:
Disconnect
all power
before
assembltng.
\
2803 - VIM1
LIGHT PEN
2801 - N7
MONITOR
CABLE
2801 - NC2 (5M)
2801 _ NC3 (10M)
VIDEO MONITOR
2801- N6
L POWER
CORD
VIDEO
IN
0
VIDEO CAMERA
2801-YE
--t
CABLE
i801 2801 2801 2801 -POWER
CORD
NC4
NC5
NC6
NC7
(2M)
(5M)
(10M)
(25M)
I
3
Chapter
Installing and
Powering Up A
Vision Input Module
Self-Teach
Session
/
Page
3-3
The mechanics of installing and powering up a VIM
Module are straightforward.
Simply power down the
host chassis and insert the Module into any module
group in the 1771 Series I/O Rack.
!
CAUTION: Always turn off power to the systern before inserting
or removing modules.
Failure to do so may damage the equipment.
Figure 3-2 shows a VIM Module installed in a 1771
I/O Rack with a PLC. Alternatively, the VIM Module
can be installed in a standalone
rack (without a
PLC) as shown
in Figure 3-3. Note, be sure the I/O
chassis
configuration
plug
is
set properly
(see Vim Users Manual). An improper
setting will
cause the CPU FAULT and CONFIG FAULT LEDs to light.
Fig. 3-2.
The VIM Module Installed In A 1771 I/O Rack
Page
3-4
3
Chapter
Self-Teach
Session
I
Fig. 3-3.
The VIM Module Installed In A Standalone
Rack Configuration
Then assemble
the video camera, power supply, lens
adapters,
and 25 mm C-mount
lens. Connect the
camera to the front of the Module using
the cable
provided,
plug the light pen into the front connector and connect up the video monitor. Next, connect the VIM power supply to the swingarm, and connect the normally-open push button switch as shown
in Figure 3-l (also see Figure 5-21, "Single Shot
Pushbutton" in. the User's
Manual). Then power up
the system.
Fig. 3-4.
Camera Mounted
On Stand
At this time, you should mount the camera
on the
stand so that its l/4-20 mounting
bolt is 28" +
l/16" above the table as shown in Figure 3-4. Then
locate the sample workpiece (drafting shield) which
came in the brown envelope with this manual. Place
it directly beneath the camera on the sheet of silver metallic paper also included
with this manual.
This will produce a silhouette. Now set the f-stop
(upper moveable ring) on the camera lens to f-11,
and the focus (lower moveable ring) on the camera
to 0.7 meters.
...
I
L>....‘1
2
inches
As soon as power is applied to the 1771 Series I/O
rack, the VIM Module will power up. This is signified by five of the seven LEDs on the front of the
VIM Module
being turned on in a test pattern. Four
seconds
later, they will all have gone out except
for the uppermost
LED labeled
"PWR" .
At this
point,
a pure
black
and
pure white,
i.e.,
"Thresholded"
image with
a small bright square
superimposed on its center will appear on the video
monitor (see Figure 3-5).
Chapter
Fig. 3-5.
Thresholded Image
With Window No. 1
Shown As A Bright
Square
Displaying The
Analog Image
-
3
Se/f- Teach Session
I
Page
3-5
The orientation of the workpiece on the video monitor should be as shown in Figure 3-5. If this
isn't what you see the most likely cause is that
If the
something didn't get plugged in properly.
LEDs do not come on, then either the I/O rack has
isn't properly
or the Module
no electrical power
seated.
If the LEDs all lit up in sequence, then
turned off leaving the "CONFIG. FAULT and BUSY'ILEDs on don't worry, this situation will get corrected the first time we command the VIM Module to
save a new l~configurationl'. If the LEDs function
as described but nothing appears on the video monthe video monitor is without
itor, then either
electrical
power,
or the video monitor's cable
isn't connected to the front of the Module or the
brightness
on the front of
and contrast controls
the video monitor simply need to be adjusted.
For the purposes of this manual all examples assume
that you are operating in stand-alone mode. If you are
using a PLC, power up in PROG. mode. You may have to
"unlock" the VIM Module at this point, (see Figure
5-14, "PLC Bit Manipulation Menu Used to Force Control
Bits" in Chapter 5 of the User's Manual).
Once the bright square appears on the video monitor, "picktl (i.e., firmly touch with the tip of the
light pen) any bright area on the top half of the
monitor four times.
This selects
the camera image
directly to the video monitor. Your
1st pick will
cause
the VIM Module
sign-on banner
to appear
across the lower portion of the image. On its far
right, this banner
has an icon representing an
open padlock. Your 2nd pick will cause the mainuser-interface menu to appear in place of the sign-on banner and the "BUSY" LED on the front of the
VIM Module to light. Your 3rd pick will
cause the
strip of six icons or the main menu to vanish.
Your 4th pick will cause the video signals from
the camera to be routed directly to the monitor.
This sequence of displays is shown in Figure
3-6.
If the bright square
appears in the center of the
monitor, but there is no analog image, then either
the camera cable
isn't connected, the lens cap is
still on the lens, the VIM power supply
isn't on
or the moveable ring on the lens nearest
to the
camera body ('If-stop'l)needs to be rotated to admit more light. The grey scale image which appears
on the video monitor comes directly from the camera. This llanalogttimage as it is commonly called,
shows exactly
what the camera is viewing.
This
image is indeed
"liveIf. Wave your hand under the
camera while watching the video monitor.
Page
3-6
Chapfer
3
Self-Teach
Session
I
Fig. 3-6.
Sequence of Displays Enroute To
Directing Live Camera Image to Video Monitor
Chapter
3
Self-Teach
Session
I
Page
3-7
If the image is too bright, turn the f-stop on the
camera lens clockwise (i.e., toward larger numbers)
to cut down the overall image brightness. Rotating
the f-stop
from one marking to another, say from
f/8 to f/l1 (the . between the llS1'and 1t1611on the
moveable ring) reduces the light level by exactly a
factor of two. If the analog image is still blurred
after the overall brightness has been set, then the
focus on the camera lens needs to be adjusted.
Focusing
The Camera
Obtaining The
Desired Camera
Field-Of-View
One way to accurately focus the camera on a workpiece is to open the f-stop on the lens as much as
possible (for the 25 mm C-mount lens, this setting
is f/1.4),
turn the room lights down so that the
analog image isn't too bright (i.e., llbloomingll),
then rotate the focus ring on the lens first one
way and then the other until the largest
hole in
the erasure
shield appears
as small as possible.
Then turn the lights back up and close the f-stop
on the camera
lens until
the brightness of the
image is pleasing to your eye.
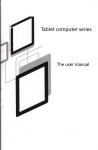
The size of the camera's field-of-view depends upon
the distance between the camera and the workpiece
("stand-off"
distance). The graph
shown in Figure
3-7 gives the width
of the field-of-view for the
standard
25 mm focal length
C-mount
lens for
different
distances
between
the
l/4-20 camera
mounting hole and the workpiece. As a general rule,
doubling the distance between camera and workpiece
doubles the camera's field-of-view. When doing your
own inspection
applications, you may wish to consult the VIM User's Manual, Chapter 4 for guidance
on obtaining
different fields-of-view
at a given
stand-off distance.
Important: This application is set-up using diffuse
room lighting. A ring light around the camera lens
will not provide a usable image.
Page
3-8
Chapter
3
Self-Teach
Session
I
Fig. 3-7.
Camera to Workpiece Distance and Width of
The Camera's Field-Of-View
35.00
30.00
25.00 3
20.00
15.00
10.00
5.00
0.00
1
20
I
25
I
I
I
I
30
35
40
45
I
50
I
55
I
65
1
75
STANDOFF DISTANCE IN INCHES
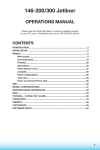
Viewing Through A
Solid-State Camera
Figure
3-8 shows the spectral
response
of the
human
eye and the spectral
response
the video
camera. The dominant wavelengths;
blue, green, and
red that our eyes see as colors are shown. Because
solid-state video cameras have their peak sensitivity in the near
infrared, the camera frequently
does not see the same contrast as a human eye. This
leads us to a rule-of-thumb
for using the VIM
Module.
"Before stating that a VIM Module can verify the
presence
of something,
always
place a sample
workpiece under the camera and view the image on
the Video Monitor.
A significant
difference
between the region of interest and the surrounding areas as viewed
on the Video Monitor is
needed for reliability".
-
Chapter
3
Self-Teach
Session
I
Page
3-9
Fig. 3-8.
Spectral Response of The Eye
And The Video Camera
-VIDEO
IATRAVICLET
REacN
I
VISKU
KfdlQl
I
CAMERA
NARWRAED
PEm
A metal drafting shield mentioned earlier will be
used as the "sample workpiece" throughout these
Self-Teach sessions. At the back of this manual are
four (4) different sheets of metallic paper.
Remove a silver, a gold, and a copper colored sheet
from the back of this manual and place them on the
table in front of you. Now lay the sample workpiece
on top of first one sheet, and then another, and
then the third. At each step note the contrast your
eyes see between
the sample workpiece and each
sheet of metallic paper.
Now,
layer these three metallic sheets of paper
together
under the camera so that portions of all
three can be viewed at once. Notice how the silver
paper appears brightest
to the camera,
the copper
appears
darkest
to
the camera,
and the
paper
brightness of the gold paper lies somewhere between
the other two.
Page
3-10
Chapter
Fig 3-9.
Workpiece Viewed
Against Three
Sheets Of
Metallic Paper
Overview Of The
VIM Module
3
Self-Teach
Session
I
Then place the workpiece so that it lays across the
junction of all three sheets as shown in Figure 39. Note the high contrast the camera sees between
while it sees
and the silver paper,
the workpiece
little or no contrast between the workpiece and the
for the first exercopper paper.
In preparation
remove everything
but the silver paper and
_ place
it so that
it fills the camera's entire
field-of-view. Then place the sample workpiece
on
that sheet so the large round hole is in the upperleft corner.
The VIM Module accepts analog images from the video
images enter
the Module, a
camera.
As analog
threshold is applied to produce
a purely black and
white image which the VIM Module then analyzes. The
VIM Module contains four (4) separate windows. Each
window has its own threshold
parameter. Thus, the
VIM Module
can simultaneously
handle
four
(4)
different
levels of contrast
in the analog images
it receives from the camera. The geometrical shape,
size, and location of each window is selectable. The
Module also measures average brightness and, at the
users option, will scale ("float") any or all of the
threshold levels up and down proportionally.
The
location of the brightness probe in the image is
selectable.
The Module
contains
twenty-two
(22) independent
line gauges which
can be set up to analyze the
white
(black) pixels in either a horizontal row or
a vertical column of one of the thresholded images. The length and location of each line gauge is
selectable.
For a given
line gauge the user can
select
any one of nine measurement pairs. For a
workpiece to pass inspection, each of the selected
window
counts and line gauge
readings must fall
within the selected range.
The VIM Module
also contians two (2) additional
gauges
- the X-gauge and the Y-gauge.
When they
are enabled,
readings
from these
two dedicated
gauges
can be used to compensate, on an image by
_
Chapter
3
Self-Teach Session !
Page
3-11
image basis, for variations in workpiece position.
any or all of the image
option,
At the users
tools (i.e., windows and line gauges)
analysis
can employ this dynamic repositioning.
Overview Of The
User Interface
employed in the Vision Input
interface
The user
Module is organized along the lines of the types of
image processing
operations supported by the VIM
module. As shown in Figure 3-10 the user interface
into three (3)
is organized
below the main menu
primary branches.
The first of these branches
- the "Brightness
Branch" - allows you to specify
the operation of
the Brightness Probe and to set each of the four
(4) thresholds. Figure 3-11 shows the structure of
the Brightness Branch
of the VIM User Interface.
This branch has three (3) sub-menus; The Move Menu,
The HiLo Range Menu and the Threshold Setting Menu.
You will learn to use these later in this chapter.
The second branch - the "Line Branch" - allows you
any of the line gauges and specify which
to enable
thresholded image it is to use. Your inputs are
made with
typically
reference to a live image of
the workpiece.
The orientation,
location,
and
length
as well as the selection of the specific
measurement that gauge should make and the acceptable range of those readings are all input by you.
Figure 3-12 shows the structure of the Line Branch
of the VIM User Interface. The Branch Menu has two
(2) parts. Part 2 of the Line Branch Menu has three
(3) Menus - The Move Menu, the Size Menu,
and the
HiLo Range Menu. You will learn to use these in
Chapter 4 of this manual.
The third branch
- the llWindow Branchllallows you
to enable
any of the four (4) windows.
Window 1
always works with
images obtained using Threshold
1. Window 2 always works with images obtained using Threshold 2, etc. The Window Branch
allows you
to specify for each window whether the measurement
of interest is the number
of white pixels or the
number of black pixels contained
in that window.
This branch also allows you to chose the geometrical shape of each window, its location in the image and its size as well as the acceptable range of
the "readingsll.
Page
3-12
Chapter
3
Self-Teach
Session
I
Fig. 3-10.
VIM User Interface Is Divided
Into Three (3) Primary Branches
THE MAIN MENU
Structure
Fig. 3-11.
Of Brightness
THE BRIGHTNESS MAIN MENU
Branch
Chapter
3
Self-Teach
Session
I
Page
3-13
of the Window
3-13 shows the structure
Figure
Branch of the VIM User Interface. This Branch Menu
also has two (2) parts. Part 2 of the Window Branch
Menu has three (3) Menus - the Move Menu, the Size
learn to
Menu, and the HiLo Range Menu. You will
use these later in this chapter.
and specifying
the image
of enabling
The process
processing operations you wish to have performed on
the image of each workpiece is termed "configuring
When you have completed
that
a VIM Moduletl.
"configuration"
is
automatically
process,
the
into EEPROM.
stored in EEPROM, this
stored
When
if the Module is
information
will be retained
powered down.
Configuring A VIM
Module to Verify The
Presence Of A
Workpiece On A
Bright Background
The sample workpiece currently being viewed by the
camera will be used to introduce you to the process
of "configuringl' a VIM Module. As you work through
this example,
learn to use the userYOU will
interface for tasks such as:
- Selecting swingarm triggering, freezing a window
showing the image of the first workpiece that
generates a REJECT decision.
- Adjusting
the location
of the brightness
probe and selecting thresholds.
- Adjusting the windows by selecting their geometrical shape, location, and size, then setting
the acceptable pixel count "range limits.".
- Understanding what types of workpiece
generate a REJECT decision.
flaws will
Since this may be your first "hands-on" encounter with a
vision system, this manual will walk you through each
step and explain what is being accomplished by each action you take. When you have completed this example you
will be able to configure your Vision Input Module to
inspect workpieces that are accurately positioned in front of the camera.
-
Page
3-14
Chapter
3
Self- Teach
Session
I
Fig. 3-12.
Structure of Line Branch
THE LINE GAUGE MAIN MENU
ETCm*a
THE ETC. LINE GAUGE MAIN MENU4
THE LINE MOVE MENU
Fig. 3-13.
Structure Of Window Branch
THE WINDOW MAIN MENU
~rnmzamrn~~~~rn*~
THE ETC. WINDOW MAIN MENUat
Chapter
3
Self-Teach
Session
I
Page
3-15
Selecting Swingarm
Triggering And
Freeze On Reject
Begin by picking
any bright
region on the video
monitor with the light pen. This action will cause
the Main Menu to appear across the lower portion of
the screen as shown in Figure 3-14.
Fig. 3-14.
Display Showing
Thresholded Image
With Main Menu
o Now
pick
left) to
TRIG").
(the
select
fourth
swingarm
icon from the
triggering
("SWG
o Then pick
c;o
(the fifth icon from the left)
El
to select Freeze On Reject.
Fig. 3-15.
Main Menu Showing
Swingarm Triggering
and Freeze On Reject
o When this has been
successfully performed, the
display on the Video Monitor should
look like
Figure 3-15.
Page
3-16
Chapter
Fig. 3-16.
Brightness Main
Menu
3
Self-Teach
o Now
Session
to
I
go to
the Brightness
Main
3-16. This menu
is
Menu shown in Figure
the one you will use to specify the operation of
Probe and also to set the four
the Brightness
(4) thresholds.
of the
corners
Notice
that the lower right
second, third, and fifth icons in this menu are
that these particular
cutoff. This signifies
icons serve as an entry to a sub-menu.
to go to the Brightness Probe
t+
Ld
3-17. You will use
in Figure
Move Menu shown
this menu to position the Brightness Probe where
you would like it to be on the image.
Fig. 3-17.
Brightness Probe
Move Menu
o Pick
Fig. 3-18.
Brightness Probe
Moved To UpperLeft Of Image
o Next use
and
icons to move the
Brightness Probe (the bright square at the cento the upper-left of the
ter of the screen)
screen. When this is complete, the display on
should look like Figure 3-18.
the Video Monitor
(Make sure that the switch on the front panel of
the Video Monitor
is set to UNDERSCAN. This
allows you to see all the way to the edges of
the picture.)
-
Chapter
Fig. 3-19.
Brightness Probe
HiLo Range Menu
3
Now
Self-Teach
pick
Session
to
I
return
Page
3-17
to the Brightness
Menu which was already shown in Figure 3-16.
HI
to obtain the Brightness
Ll
shown in Figure 3-19. You
Probe HiLo Range Menu
the upper
and lower
use this menu to specify
The initial
limits of acceptable illumination.
0 II (no light), while
the initial
low limit is II
(A 1'25511 is the value the
high limit
is 255.
brightness
probe will
read when the image is
very bright.) The number between the inequality
signs (a ,12331'in our case) is the present reading of the Brightness Probe. Note, your readings
may vary slightly
from this number.
The underline appearing beneath the left-most number (a
zero in this case) signifies
that picking the
and
icons will change
the low
E5l
m
range limit. The number ,11t8
which appears in the
third icon signifies that each pick of the light
pen will increment or decrement that limit by 1.
Then
Fig. 3-20.
Display After
Brightness Probe
Limits Are Set
pick
Now pick
five (5) times to raise the low
m
range limit from 0 to a value of 5. Then pick a
bright place on the number
(112551')appearing on
the extreme right to switch to controlling the
high range
limit. Now pick
the icon
lIi5l
five (5) times to decrease the high range limit
from 255 to 250. After
the range
limits have
been correctly set, the display should look like
Figure
3-20. Should
the camera lose power or
fail, the low limit of 5 on the Brightness Probe
"reading"
will cause the ACQ ERROR LED to be
lighted. Similarly,
if too much light reaches
the camera
and causes
it to bloom, the high
limit of 250 will also light the ACQ ERROR LED.
In the future, you may find it helpful to return
to this menu and use the Brightness Probe to
numerically
examine
the effects
of different
lighting
or
the relative
contrast
between
different
regions on a workpiece.
As you exit
this menu,
the reading of the Brightness Probe
is "latchedtV as the "nominal brightness
value"
for use as a reference.
Page
3-18
Chapter
3
Self- Teach Session
I
IMPORTANT:
When using
lighting compensation,
make
is normal before
sure your illumination
"Floating
leaving.
If you intend to
use
Thresholds", do not exit from the Brightness
Probe HiLo Menu. This
is necessary to enable
the proper compensation for lighting changes.
As you exit from the HiLo Range Menu, the last
"reading" is lllatchedl'to serve as the reference
value
or V1nominal11 brightness
of the image.
Compensations will be made whenever the probe reads
brighter or darker than this reference level.
o Now
pick
to
return
to the Brightness
Branch menu which was shown previously
3-16.
in Figure
Setting Thresholds
As mentioned earlier, the module contains four
(4)
independent
thresholds
so that as many as four
different levels of contrast
in the camera image
can be analyzed
simultaneously.
In the current
example, you will only employ the first two
(2)
thresholds.
Fig. 3-21.
Threshold Setting
Menu
o Pick
icon to obtain the Threshold Setting
menu shown in Figure
3-21. You will use this
menu whenever
you specify
a threshold.
The
numeral 1 appearing in the left-most icon signifies that any selections you make at this time
will be only for Threshold 1.
o Picking
(and holding
the light pen against)
will cause the amount of white
in the
UiEl
image to begin increasing
threshold), while picking
(i.e., it lowers this
(and holding)
will cause the amount of black in the image to
begin increasing.
When the threshold
reaches a
very
low value,
the image will appear totally
white.
Similarly, when the threshold reaches a
very high value, the image will appear totally
black. If the threshold value is already at its
lower
(upper) limit and you try to decrease
(increase) it, the icon will simply flash in and
out of reverse video signifying that no further
change is available in that direction. The operation of selecting
a threshold is one that will
become very familiar to you. It is at this point
that quantitative meaning is given to the phrase
-
Chapter
Fig. 3-22.
Threshold Setting
Menu After Floating
Threshold 1
3
Self-Teach
Session
1
Page
3-19
contrast
between
the region of
"significant
and the surrounding areas of the workinterest
a high conp,iece". The silver paper provides
trast to the sample workpiece. Manipulate these
two icons until
you are satisfied that the left
edge of the workpiece, as well as the round hole
in the upper-left
of the sample workpiece, is
clearly defined.
Now
pick
to specify that this threshold
IEI
is to be adjusted (ttfloated8R) in the same proportion that the readings
from the brightness
probe
increase
or decrease
from the nominal
value. Figure
3-22 shows the Threshold Setting
Menu
after Threshold
1 has been correctly set
and floated.
Fig. 3-23.
Threshold Setting
Menu For
Threshold 2
Now
pick
(left-most
icon) to obtain
UiGl
the Threshold Setting
Menu for Threshold 2 as
II
2 II now
shown
in Figure
3-23. The numeral
appearing in the left-most icon signifies that
any selections
you make
at this time will be
only for Threshold 2.
Again
manipulate
the
and
icons
llal
until you are satisfied that the round hole in
the upper-left of the sample workpiece, as well
as the left edge of the workpiece, are clearly
defined.
Fig. 3-24.
Threshold Setting
Menu After
Floating
Threshold 2
Now
pick
Now
pick
to specify that this threshold
llizl
is to be V1floatedtt.Figure
3-24 shows how the
Threshold Setting Menu will appear after Threshhold 2 has been correctly set and floated.
Main Menu
3-16.
0~
to return
to the Brightness
ml
which was shown previously in Figure
Having completed
the setting of Threshold 1 and
Threshold
2, you now pick
to return to
the Main Menu
Figure 3-10.
as
it
was shown previously
in
Page
3-20
Adjusting
Windows
Chapter
3
The
The VIM Module has four (4) windows. Since Window 1
uses the image obtained
by Threshold
1, while
Window
2 uses the image obtained by Threshold 2,
each window works independently. In our example, we
will only employ the first two (2) windows.
Enabling And
Selecting Window
Fig. X-25.
Window Main Menu
Selecting
Shape
Window
Self-Teach
Session
I
o Pick
1
(third icon from the left on the
El
Main Menu) to obtain the Window Main Menu shown in
Figure 3-25. The numeral "2" which appears in the
left-most icon signifies that any selections you make
at this time will be just for Window 2. The large
slash across the second icon indicates that this
window is disabled.
The other icons on this menu
will not respond to the light pen until the window is
enabled. Pick the window number icon until window 1
appears.
o Pick
to enable Window
1 (note that the
slash mark is now gone).
Several geometrical
shapes are available for the
windows. The bright rectangle
in the center represents the present shape, location and size of Window 1.
This pictorial representation
will always
match
exactly
what the window is analyzing. The
rectangle which presently appears in the third icon
from the left indicates that Window 1 currently has
a rectangular shape.
o Pick
to change Window
1 from a rectangle
to 'a right triangle.
Notice
how the bright
region on the screen also becomes triangular
in
shape.
o Now pick
to change the
orientation
of
to change the orientation
of
the triangle.
o Then
pick
the triangle
again.
Chapter
Fig. 3-26.
Window 1 Is Now
Circular
3
o Then
Self-Teach
Session
I
Page
pick
to change the triangle
Lr
to the last triangular orientation.
3-21
shape
Window 1 from a
to change
ml
shape. This is
right triangle into a circular
signified both by the dark circle appearing in
the icon and by the fact that the bright region
represents the window is
on the screen which
circular. Figure 3-26 shows the Window Main Menu
after a circular
shape has been selected for
Window 1.
o Now
Positioning
Window 1
Fig. 3-27.
Part 2 of Window
Main Menu
pick
The Window
Main Menu actually has two parts. The
second icon from the right (the I'ETC" icon) is used
to toggle back and forth between the two parts of
this menu.
o Now pick
to obtain Part 2 of the Window
pizj
Main Menu as shown in Figure 3-27.
The # symbol that appears against
a white background in the third icon signifies that white areas
are to be counted in Window
1. Picking that icon
will cause the count to toggle to reading the black
area in this window (in which case the # symbol in
this icon will appear
against a black background).
Since the hole we wish to detect mite,
you want
to measure the white areas
in Window 1. The first
icon serves as an entry to the Window Move Menu.
o Pick
+t
to obtain
sa
shown in Figure 3-28.
the
Window
Move Menu
Page
3-22
Chapter
Fig. 3-28.
Window Move Menu
3
Self-Teach
Session
1
Now use the four "arrowl' icons,
Ezl
El
liza
Eil
to move the bright shape representing
Window 1
on the round hole at the
so it is centered
Note : Picking
an
upper-left of the workpiece.
llarrowlVonce moves the window exactly one pixel,
holding the light pen down on an arrow icon will
3-29 shows how
rapidly move the window. Figure
the Window
Move Menu should look after Window 1
has been correctly positioned.
-. .
to return to' Part 2 of the Window
Branch Menu which was shown previously
3-27.
Size Window
Window No. 1
The second icon serves as
Size Menu.
Fig. 3-29.
Window 1 Has
Been Correctly
Positioned
o Pick
in Figure
an entry to the Window
to obtain
the Window Size Menu
00
ml
shown in Figure 3-30. The first and second icons are
used to change the height of the window. The third
and fourth icons are used to change the width of the
window. Since the height of a circle is the same as
its width, in this particular case both sets of icons
behave the same.
o Pick
three
(3) times
to decrease
the
m
radius
of Window
1 so that it is the largest
circular shape which fits inside the hole on the
upper-left of the workpiece.
Note, YOU may find it necessary
to slightly
adjust the location of Window 1. If so, that can
be done as follows:
Fig. 3-30.
Window Size Menu
to transfer
(a)
Window
Move
Figure 3-28.
lb)
Menu
that
directly
was
to the
shown
in
Then use the "arrowl' icons on that menu
to adjust the position of the window.
Chapter
3
Self- Teach
Session
I
Page
3-23
Note that this window has been set up to detect
holes too small or not punched correctly. It will
not detect oversized holes. The next window will
demonstrate how to verify both "too large and to
small" holes.
Fig. 3-31.
Window 1 Has
Been Positioned
And Sized
Size Menu will
Figure 3-31 shows how the Window
appear after Window 1 has been correctly positioned
and sized.
to return to Part 2 of the Window
OK
La
Main Menu as shown in Figure 3-27.
o Pick
Setting HiLo
Range Limits
For Window 1
Fig. 3-32.
HiLo Range Menu
a circular shape for Window 1 and
Having selected
correctly positioned and sized it, we must now set
low and high range
limits. The
the corresponding
fourth icon serves as an entry to the HiLo Range
Menu.
HI
to obtain
the HiLo Range Menu
LO
El
shown
in Figure
3-32. The number appearing on
the extreme right (in our case "75") is the high
range limit. Note, if your high range number is
different
than
"75" , YOU must
return to the
Window
it the proper size.
Size Menu and make
The Module
constrains the high range
limit so
that it
can't
be
larger
than
the
total
area of
. the window or smaller
than the low range limit.
The number
appearing
between
the inequality
signs is the reading for Window 1. In our case,
this should be the same as the high range limit.
The number
appearing
on the left is the low
range limit. An underline appearing
beneath a
range limit signifies
that
it is this limit
which
can be changed.
Picking the third icon
will change from increments of "1" to increments
of "10".
o Pick
Chapter
3
Self-Teach
Session
I
to obtain increments
Pick
of lllOVV.
Now pick
several times to change the low
m
range limit to the value "60".
increments
several
1101
of 1 again.
Now
pick
the
Now
pick
Next
Fig. 3-33.
Window 1 HiLo
Range Limits
Have Been Set
pick
times
to
obtain
icon several
times to
m
change the low range limit from the value 116011
to the value
"65" . Figure
3-33 shows the HiLo
Range Menu when the range limits
for Window 1
have been correctly set. We expect this window
to contain only white pixels. However, we chose
a low range
limit that
is ten below the high
range
limit so that normal variations in the
image or slight mispositioning of the workpiece,
will not result in a REJECT decision.
OK
to return to Part 2 of the
ml
Window Main Menu as was shown in Figure 3-27.
Then pick the IIETC" icon to obtain the Window
Main Menu as shown previously in Figure 3-26.
Window 2 will now be adjusted in a similar manner.
However,
the size of Window
2 will
be chosen so
that both the interior
of the hole
in the sample
workpiece and some of the surrounding
workpiece is
included.
The HiLo
limits
will be
used to verify
that both
the hole and the surrounding workpiece are present.
Enabling and
Selecting
Window 2
o Pick
to change from adjusting
Window 1
mlI
to adjusting Window 2. The Window Main Menu will
now appear as shown in Figure 3-34. The numeral
112t'appearing
in the first
icon signifies that
any selections you make at this time will apply
only to Window 2.
Chapter
Fig. 3-34.
Window Main Menu,
Window 2 Is Being
Adjusted
3
o Pick
Self-Teach
Session
I
Page
3-25
to enable Window 2
(note that the slash mark has now vanished.)
o To change the geometrical shape of Window 2 from
rectangular to circular shaped
pick the third
icon from the left until you see a darkened circular shape. Note that the bright
region on the
screen which represents the window is now circular also. Figure 3-35 shows the Window Main Menu
enabled and a circular
after Window 2 has been
shape has been selected.
o Pick the IIETCUVicon to obtain Part 2
Main Menu as shown in Figure 3-36.
Fig. 3-35.
Window 2 Has Been
Enabled And A
Circular Shape
Selected
of Window
o Pick
++
to obtain the Window Move Menu,
Lil
and use the "arrow" icons to center
the bright
shape representing Window 2 over the round hole
in the upper-left
corner
of the sample workpiece.
After Window
2 has been
correctly
positioned,
the Window
Move Menu should look
like Figure 3-37.
o Pick
OK
to return
to Part 2 of the Window
la
Main Menu as shown previously in Figure 3-36.
Fig. 3-36.
Part 2 of Window
Main Menu
Page
3-26
Chapter
3
Self-Teach
Session
/
-
Size Window
2
If
Fig. 3-37.
Window 2 Has
Been Positioned
,;Y
to obtain the Window Size Menu.
o Now pick
necessary,
pick
either
the
El
shaped
or the
window
icon so that the circular
m
is slightly
in the worklarger than the hole
piece.
Figure 3-38 shows the Window Size Menu
after Window 2 has been correctly sized.
o Pick
to return to Part 2 of the Window
OK
I
Main Menu
as in Figure 3-36.
Having
selected a circular shape for Window 2 and
correctly positioned and sized it, we must now set
the low and high range limits.
-
Fig. 3-38.
Window 2 Has
Been Correctly
Sized
o Pick
to obtain the
HiLo Range Menu as
shown in Figure 3-39. Note that
since the size
of Window 2 was chosen
to be larger than the
hole
in the workpiece,
the actual number of
white pixels ("114") contained in this window is
somewhat less than the maximum possible (in our
case "165").
o Pick
Then
to
111
pick
change
to
increments
of 10.
the
icon several times to
El
obtain a low range limit of 100. Now pick the
number appearing
on the far right
of the menu
(in our case
"165") to move
the underline
beneath
it so the high range
limit can be
adjusted.
Then pick the
icon several
times to obtain high range limit of "125" .
Fig. 3-39.
HiLo Range Menu
With Initial
Limits
o Pick
ml
increments
o Now pick
several
times
to
change back to
of 1.
the
Eil
limit of "124" pixels.
to
obtain
a
high
range
Chapter
Fig. 3-40.
Range Limits For
Window 2 Have
Been Correctly set
3
Self-Teach
Session
i
Page
3-27
o Next pick the number "100" to move the underline
beneath the low range limit. Now pick the
m
a low range limit
icon several times to obtain
of 111041tpixels. After the range limits for Winset, the HiLo Range
dow 2 have been correctly
Menu will appear as shown in Figure 3-40.
o Pick
OK
to return to Part 2 of the Window
La
Main Menu as shown in Figure 3-36.
o Now pick the llETCtticon to return to the
Main Menu as shown in Figure 3-35.
Window
,/(
L
icon to return to
the
Main Menu as shown in Figure 3-41.
Fig. 3-41.
Main Menu After
Configuring The
VIM Module
Having selected
swingarm triggering,
adjusted the
Brightness
Probe,
set Thresholds
1 and 2, and
adjusted Window 1 and Window 2, we would
like the
Module
to retain this information
in the event it
is powered down.
0
Pick
OH
on the Main Menu
to command the
la
VIM Module to store
its present "configuration"
in EEPROM. Note that a ttclockl'icon (see Figure
3-42) is displayed while
the configuration
is
being stored. This storing operation takes about
four (4) seconds.
After the configuration has been
stored, the menu
strip will vanish from the Video Monitor
(see Figure 3-43) and the
"BUSY" LED will go off. The
Module is now ready to go to work.
Fig. 3-42.
Clock Icon
Displayed While
Storing "Configuration"
Page
3-28
Chapter
Inspecting The
Sample Workpiece
Fig. 3-43.
Display After
Storing Of Configuration Is Complete
3
Self-Teach
Session
I
To command the Module to inspect the sample workpiece, press the push button switch
connected to
the swingarm.
Pressing this button causes both the
"TRIG" LED and the "BUSY" LED to turn on. Both of
these
LEDs will go off as soon as the push button
is released. Each time the push button is pressed,
a single picture from the camera is processed and
the corresponding
ACCEPT
or REJECT
decision is
made. This is called an "Inspection Cycle".
Freeze On Reject
Operation
Place your hand carefully
in front of the camera
above the sample workpiece so that
it shadows the
hole
in the upper-left
corner without interfering
with the Brightness
Probe.
Now press
the push
button
switch.
The "TRIG" and "BUSY" LEDs will
behave exactly as before. However, when the button
is released,
the "DECISION" LED will light: i.e.,
based upon what the camera saw, this particular
workpiece should be rejected.
Fig. 3-44.
Rejected Image
Frozed On Video
Monitor
Removing
your hand and then pressing
the push
button
again will
result
in the "DECISION" LED
being
turned off; i.e., this time the inspection
decision
is to ACCEPT
the workpiece. The Module
will
inspect the workpiece
afresh each time the
push button is pressed. However, because we selected the Freeze On Reject
Mode, when a REJECT decision gets generated,
the display
on the Video
Monitor is frozen (see Figure 3-44).
Manual intervention is required to restore the video monitor to a live image. Pick the screen anywhere to return to "live".
o Then pick the screen
twice to go to the Main
Menu. (Note that the "BUSY" LED is now on since
the VIM module is not able to respond to TRIGGER
commands.) If we wanted to continue in the Freeze On Reject mode, we would pick the
"OK" icon
which would resave the configuration
and turn
out the "BUSY" LED.
Go On Reject
Operation
At this point: however,
On Reject mode.
it is best to change to
Go
Chapter
Fig. 3-45.
"Go On Reject"
Has Been Selected
3
Self- Teach Session
o Pick
and
then
I
Page
3-29
pick the
3-45 shows the Main Menu after selecting
Figure
the "Go On Reject" Mode.
o Now pick
to save the new configuration.
The clock
icon reappears
indicating that the
When this
configuration
is
being
stored.
operation is completed, the clock icon vanishes
and the "BUSY " LED goes off.
g= co =
-
Workpiece Flaws
Which Will Cause
A "Reject"
Decision
Fig. 3-46.
Workpiece With
Missing UpperLeft Corner
Now press the push button to inspect the workpiece.
The "TRIG" and "BUSY" LEDs will behave exactly as
they did in the previous
mode. Again, place your
hand between
the camera
and the sample workpiece
and press the button. The "DECISION" LED will come
on; i.e., based upon this image,
a REJECT decision
was generated.
This state of the "DECISION" signal
from each inspection
is retained until
the Module
completes
another
inspection.
Removing your hand
from the camera's view and pressing the button will
generate
an
ACCEPT
decision
and cause the
"DECISION" LED to go off.
A small piece of white
paper placed on top of the
sample workpiece can be used to simulate various
types of flaws. Placing white paper over the upperleft corner of the sample workpiece will make it
appear that the corner of the workpiece is missing
(see Figure 3-46). Pressing the button while the
paper is in place will result in the "DECISION" LED
being
lit
(i.e., a REJECT
decision). After the
paper is removed, pressing the button will result
in the "DECISION"
LED going
off (i.e., an ACCEPT
decision).
Placing a thin strip of black paper over the upper-left
corner of the sample workpiece will make it appear that
the hole in the sample workpiece was improperly punched
(see Figure 3-47). Images like this will also cause a
REJECT decision.
Placing a round-shaped piece of white paper that is
slightly
larger than the hole directly over the
hole will make it appear
that the hole was punched
oversize (see Figure
3-48). Images like this will
also cause a REJECT decision.
Removing the round-shaped piece of white paper and
blackening all but a center region then placing the
paper directly
over the hole will make it appear
that the hole was punched undersized (see Figure 349). Images
like this will also cause a REJECT
decision.
Page
3-30
Chapter
3
Self-Teach
Session
I
Fig. 3-47.
Workpiece With
Improperly
Punched Hole
Now remove the white paper
so that an ACCEPT decision is generated when the push button is pressed.
Controlling The
VIM Module From
A PLC
Fig. 3-48.
Workpeice with
Oversized Hole
Up to this point, you have always commanded the VIM
Module
from the light pen or from the swingarm
pushbutton.
To the PLC, the VIM Module is simply
a module to which
the PLC's Ladder
Logic can
command
any of eight (8) discrete bits,
or from
which
the Ladder Logic can read any of eight (8)
discrete bits.
Figure 3-50 shows the functions of the discete bits
output
from the PLC to a VIM Module. In this
session
two of these discrete
output
bits are
of interest
to us: UNLOCK (discrete bit 10) and
TRIGGER (discrete bit 15).
IMPORTANT: To allow configuration of a VIM
module when a PLC is in the 1771 I/O
Rack, the UNLOCK
bit must be set to 1.
Failure to set the UNLOCK bit will prevent you from using the light pen to configure the Module.
Fig. 3-49.
Workpiece With
Undersized Hole
Figure
3-51 shows the functions of the discrete
bits to the PLC from a VIM Module. Input Bit
Address 12 will be a 1 when the VIM Module is busy.
This will occur when either the VIM Module is being
configured or the VIM Module is still processing an
image in response to TRIGGER command. After the PLC
outputs a TRIGGER
command to the VIM Module, BUSY
should be examined
for a 0. When BUSY becomes
0,
the inspection decision is available.
Chapter
3
Self-Teach
Session
1
Page
Fig. 3-50.
Command Bits Output From PLC To VIM Module
OUTPUT BIT
ADDRESS
10
11
12
13
14
15
16
17
FUNCTION
Unlock (0 = Lock the Module/Disable
Progrmg.,
1 = UnlockfEnable Progrmg.)
Reserved for Future Expansion
Reserved for Future Expansion
Reserved for Future Expansion
Reserved for Future Expansion
Trigger (0 = Stand By, 1 = initiate an Inspection Cycle)
Binary/BCD results (0 = Standard Binary Number Format,
1 = BCD Format)
1 = Configure
Save configuration data (0 = Temporary Storage (Fast Mode),
Permanently)
Fig. 3-51.
Status Bits Input From VIM Module to PLC
INPUT BIT
ADDRESS
FUNCTION
10
11
12
13
14
15
16
17
Module Fault (0 = Running OK, 1 = Fault)
Configuration fault (0 = Configuration OK, 1 = EEPROM/CONFIG. invalid)
ModuleBusy (0 = Ready, 1 = Busy)
Master range alarm (0 = Accept,
1 = Decision Reject)
Probe Error (0 = OK, Normal Operation,
1 = Error, Probe Out of Range)
x/Y float Error (0 = OK, Normal Operation,
1 = Error, Out of Range)
Reserved for Future Expansion
Reserved for Future Expansion
3-31
Page
3-32
Chapfer
3
Self-Teach
Session
I
The sequence of operations used to place the Module
under the control of the PLC are:
(a) Unlock VIM (set Command Bit 10)
(b) Configure VIM
(using the light pen)
(cl Select PLC Triggering
(d) Save the configuration
W
Lock the VIM
in EEPROM
(reset Command Bit 10)
(f) Proceed with Normal Production
Summary
Operation.
In Self-Teach
Session
1, you have installed and
powered up your VIM Module. You then used the VIM
Module
to direct
analog
images
from the camera
directly
to the Video
Monitor. After reading an
overview of the image processing operations
performed by the Module, and an overview
of the User
Interface, you '1configured8'your Module to use Windows 1 and 2 to detect the presence of a hole in a
sample workpiece. Finally, you used "TRIGGER"
signals
from a push button
to explore
the types of
flaws this configuration will REJECT.
Chapter
4
Self-Teach
Session
II
Chapter Objectives
learn how to use the XIn this chapter you will
Y-gauge
and
the
twenty-two
(22) line gauges.
gave,
After you have completed Self-Teach Session 2, you
will be able to configure a VIM Module to successfully perform many of the vision applications which
are encountered on production lines.
Introduction
Self-Teach
Session 2
The inspection of workpieces on a production line
should be tolerant
of minor
mispositioning and
given the large
modest changes
in lighting. Also,
numbers of workpieces which pass by during a shift,
it is important that the inspection process continue to work well in the face ofttinsignificant" variations in workpiece
appearance and dimensions. The
Module allows you to readily generalize the inspection it performs to these needs of your production
line.
To
In this Self-Teach
Session you will:
- configure your VIM Module so that it compensates
for mispositioning of the workpiece
in X and Y
directions
- be told how to use representative sample workpieces
to select the low and high range limits
for a particular "reading"
-learn about "configuration
Configuring A VIM
Module To Compensate For Workpiece
Position
blocks"
In Session
1 we walked
through
the Brightness
Branch and the Window Branch of the VIM User Interface. The remaining branch - the Line Branch gives
tools designed to automatically
YOU access to the
compensate for mispositioning of a workpiece. The
X-gauge and the Y-gauge are dedicated
to providing
"readingsI' which can, at your
option, be used to
adjust the location in the image where any or all
of the other
image processing
tools are applied.
Building
upon the example
used
in Self-Teach
Session
1, we will walk through configuring for
position compensation.
You will
then explore how
well position compensation works.
You should begin this working session with your
Module configured
exactly as you left it at the
close of Self-Teach Session 1. Namely,
Beginning
Configuration
Paqe
4-2
Chapter
4
Self-Teach
Session
II
Main Menu showing:
- Swingarm Triggering ("SWG TRIG")
- Go On Reject as in Figure 3-45.
Brightness
Branch showing:
- Brightness probe in the upper-left
image as in Figure 3-18.
corner of the
- A Low Range Limit of 5 and a High Range Limit of
250 as in Figure 3-20.
Fiq. 4-l.
Line Main Menu
When Adjusting
X-Gauge
Window Branch Showing:
Window 1 as a circular shape that is centered on
in the
and slightly smaller than the round hole
upper-left of the workpiece.
A Low Range Limit of "65" and a High Range Limit
of "75" as shown in Figure 3-33.
Window 2 as a circular shape that is centered on
larger than the round hole in the
and slightly
upper-left of the workpiece.
Limit of "104" and a High Range
A Low Range
Limit of "124" as shown in Figure 3-40.
The sample workpiece should
generate an
decision
when the button is pressed.
Adjusting The
X-Gauge And
Y-Gauge
"ACCEPT"
Bring up the Main Menu. (Note: If you were using a
branch menu or sub-menu,
pick the "OK" icon as
many times as needed to return to the Main Menu.
If you were currently inspecting the sample workpiece, just pick any bright region once to obtain
the sign-on banner and then pick again to obtain
the Main Menu.)
o Pick
(second
icon
from
the left) to
obtain the Line Main Menu as shown in Figure 41. The short bright
horizontal
line in the
middle of the screen represents the X-gauge. The
fifth icon from the left contains
the numeral
II
1" . This indicates that the X-gauge is working
with the image obtained using Threshold 1. Until
the X-gauge
is "enabled",
none of the other
icons on this menu will respond.
Enabling The
X-Gauge
o Pick
to enable the X-gauge.
Chapter
Fig. 4-2.
X-Gauge Enabled
4
Self-Teach
Session
I/
Page
4-3
Figure 4-2 shows the Line Main Menu after the Xgauge has been enabled.
Like the Window Main Menu, the Line Main Menu
has two (2) parts. When you are in either part
of this menu, picking the 'lETCIUicon will obtain
the other part.
Pick
to obtain part 2 of the
pq
Menu as shown in Figure 4-3.
Selecting X-Gauge
Measurement
Fig. 4-3.
Line Main Menu,
Part 2
Line Main
The X-gauge
can work with either
white pixels or
black pixels.
The fourth
icon indicates that XGauge will analyze white
blobs. Since
our sample
workpiece appears as a black silhouette on a white
background,
you want the X-gauge to analyze black
blobs.
o Pick
so that the X-gauge will toggle to
analyzing black blobs. Note how the background
of this icon switched from white to black.
o Now pick
-Km g
-0
++
to obtain
Lil
shown in Figure 4-4.
the Line Move Menu as
o Then use the four (4) "arrow" icons to move the
X-gauge up and to the left so that its right end
touches
the edge of the sample workpiece as
shown in Figure 4-5.
o Pick
to
go to
shown in Figure 4-6.
Fig. 4-4.
Line Move Menu
the Line
Size Menu
as
Page
4-4
Chapter
Fig. 4-5.
X-Gauge Has Been
Positioned
4
Self-Teach
Session
o Pick the
II
icon and hold it until the X-Gauge
extends approximately as far into the workpiece
as it extends beyond the workpiece on the left.
Note, as you make a horizontal gauge
longer or
shorter, its left end remains
fixed. Figure 4-7
shows the Line Move Menu
after the X-gauge has
been correctly sized.
o Pick
OH
ssl
Main Menu.
to
return to
part 2
of the Line
The size of the X-gauge determines the amount of
position variation along the X-axis which can be
accommodated. So long as the left edge of the
sample workpiece falls somewhere along the Xline gauge, the X-gauge will be able to perform
the compensation.
Fig. 4-6.
Line Size Menu
Having positioned the X-gauge on the left edge of
the sample workpiece and sized the X-gauge, we now
need to set its high and low range limits.
o Pick
HI
to get to the HiLo Range Menu as
El
shown in Figure 4-8.
(Look to be sure that the
fourth
icon in this menu
appears as shown in
this figure.
If it isn't, return to part 2 of
the Line Main Menu and make it look like Figure
4-3.) Note that the low range limit and the high
range limit are identical. In our case, to find
out what the allowable extremes
are, you must
decrease the low range limit to its minimum value.
Fig. 4-7.
X-Gauge Has
Been Sized
o Place the
tip of the light pen firmly against
and hold it until that icon begins to
El
blink.
The number
displayed
is the minimum
value.
Increase it by one to verify
that the
blob edge is truly detected.
o Pick the number
that appears
at the extreme
right of the screen (in our case an 11851')so
that the underline
moves beneath it signifying
that the "arrowV1 icons now control the high
range limit.
Chapter
Fig. 4-8.
HiLo Range Menu
4
Self-Teach
and
o Now place
against
the
Session
hold
II
Page
4-5
the tip of the light pen
until that icon begins to
I33
blink.
Then pick the left-most number to move
4-9 shows the
the underline
beneath it. Figure
range limits
after the X-gauge
HiLo Range Menu
have been correctly set. The number which appears between the inequality signs is the "reading"
As we have set things up, this
of the X-gauge.
value is simply the location of the left edge of
the workpiece. In our case, the left edge of the
workpiece is "63" on a horizontal scale which is
"0" at the left border of the image and "255" at
the right border.
Fig. 4-9.
X-Gauge Range
the most
As you exit from the HiLo Range Menu,
recent
"reading" is "latched" to serve as the
of the
reference value
or "nominal X-position"
workpiece.
Compensation
will
be made whenever
the readings are to the left or right of this
reference position.
When using
X-Y Position
IMPORTANT:
sure
that
the
Compensation,
make
workpiece
is in its "normal" position
before exiting the HiLo Range Menu. This
is
necessary
to
enable
the proper
compensation for positional variances.
Fig. 4-10.
X-Gauge Has
Been Adjusted
Note that you may also set the HI/LO range
limits for the blob width measurement.
Even when
one of the measurements
is not used both are
always performed.
o Pick
to return to part 2 of the Line
Main Menu.
Then pick the "ETC" icon to return
to the Line Main Menu.
Figure 4-10 shows the
Line Main Menu after the X-gauge
has been
correctly adjusted.
Pase
4-6
Adjusting
Y-Gauge
Self-Teach
Session
II
Chapter
4
The
and established the
enabled, moved, sized,
Having
for the X-gauge so that its "readnominal value
ings" correspond to the left edge of the sample
workpiece, we wish to adjust the Y-gauge so that it
will behave similarly.
(the leftmost icon) to obtain the
BEi
Line Main Menu for the Y-Gauge. The short bright
at the center of the
line appearing
vertical
The numeral "1" which
screen
is the Y-gauge.
appears in the fourth icon from the left, signifies that the Y-gauge will be working with the
1. (Note, if we
image obtained using Threshold
wanted this gauge to work with Threshold 2, we
would simply pick that icon and the numeral "2"
would replace this "1").
o Pick
Fig. 4-11.
Line Main Menu
When Adjusting
The Y-Gauge
to enable the
o Pick
Y-gauge as shown in
Ed
Figure 4-11.
None of the other icons on the menu will respond
until the gauge is enabled.
o Pick
Menu.
m
to obtain part 2 of the
Line Main
icon to toggle the Y-gauge
#
II
from analyzing white blobs to black blobs.
o Pick
Fig. 4-12.
Line Main Menu,
When Measuring
"Trailing Edge Of
Lowest Black Blob"
the
o Now pick the third icon from the left (this icon
) several times.
appears as
I-.
initially
El
Each time you pick this location, the icon will
change
such that the small arrowhead in the
upper-half will appear in a new location. As you
(7) different
pick this
icon repeatedly, seven
Figure 4-12 shows how
patterns are displayed.
Part 2 of the Line Main Menu will appear after
the "trailing edge of the lowest black blob" has
been selected
as the Upper Measurement.
Chapter
Fig. 4-13.
Y-Gauge Has Been
Positioned
Self-Teach
4
Session
II
Page
4-7
to obtain the Line Move Menu.
o Now pick
Use the four (4) "arrowl' icons to move the Ygauge down so that its bottom end just touches
the lower edge of the workpiece as in Figure 413.
o Now
pick
mo
to transfer
directly to the
ml
Line Size Menu.
o Pick and hold
until the Y-Gauge extends
approximately as far below the sample workpieces
a veras it extends into it. Note, as you make
tical line gauge longer or shorter its upper end
remains fixed.
Fig. 4-14.
Y-Gauge HiLo
Limits Have
Been Set
o Pick the V'OKV' icon to return
to Part 2 of the
Line Main Menu as was previously shown in Figure
4-12.
Having positioned the Y-gauge
on the lower edge of
the sample workpiece and sized the Y-gauge so that
it extends
equally on and off the workpiece, you
now need to set its working range limits.
HI
icon to get the HiLo Range
L#
El
Menu. To insure that both the high and low range
limits
are at their
extreme values, pick and
hold the
icon until it starts blinkE5l
ing. Now pick the upper range limit to move the
underline
beneath
it. Then pick and hold the
[m
icon until it starts blinking and then
o Pick
I
11
the
I
decrease it by one.
The number between the
inequality signs is the "reading" of the Y-gauge. As
we have set things up, this value is simply the
location of the lower edge (trailing edge of the
lowest black blob) of the workpiece. In our case,
that edge is at “178” on a vertical scale which is
"0" at the top border of the image and "252" at the
bottom border of the image. Figure 4-14 shows the
HiLo Range Menu after the Y-gauge range limits have
been correctly set.
The values you get may be
slightly different.
As you exit from the HiLo Range Menu, the most recent
reading is "latched" to serve as the "nominal
Y-position" of the workpiece.
Page
4-8
Chapter
4
Self-Teach
Session
11
X-Y position
When using
INFORMATION:
sure that the workcompensation, make
piece
is in "normal"
position before
exiting
the Y-gauge
HiLo Range Menu.
is necessary
to latch the proper
This
reference value and enable position compensation.
-
Fig. 4-15.
Line Main Menu
Part 2, After
Y-Gauge Has
Been Adjusted
to
return to
Part 2
of the Line
Main Menu. Figure 4-15 shows Line Main Menu part
2 after the Y-gauge has been correctly adjusted.
pick
Now
Menu.
Now pick
Menu.
mj
to
return
the "OKI' icon to
to the Line Main
return to
the Main
Floating The
Windows In
X and Y
Now that you have enabled the X-gauge and Y-gauge
and adjusted them to determine the horizontal and
vertical location of the workpiece, you can tlfloatlt
the locations
of Windows
1 and 2. When this is
done, the VIM Module will compute the "reading" of
the X-gauge and Y-gauge on eachimage, then translate any tools that you have t'floatedtUso that the
workpiece appears
in its "nominal positiont'. The
choice of whether something t'floatsl'or is llanchored" is made by you. Any or all of the windows and
any or all of the twenty-two line gauges
can be
t'floatedl'
. However,
for a given configuration,
everything
that is floated is based upon the same
X-gauge, Y-gauge
or X and Y gauge tlreadings*'.The
Brightness Probe is always anchored: i.e., it does
not float in the X and Y directions.
Floating The
Windows
Pick the
icon to obtain the
Window Branch
Menu. Note that a numeral appears inside the first
icon. This signifies what window we are controlling. Pick this icon to select window 2. The anchor
symbol which
currently appears in the right side
of the fourth icon signifies that this window
is
"anchored".
Chapter
Fig. 4-16.
Window 2 Has
.Been Floated
In X and Y
Floating Window
Fig. 4-17.
Window 1 Has
Been Floated
1
4
Self-Teach
Session
II
Page
4-9
0
icon to ttfloat" Window 2. Figure
$j
I
appear
4-16 shows how the Window Main Menu will
when Window 2 has been floated in X and Y.
0
times to obtain a
Pick the first icon several
Window
Main Menu which
has the numeral ltlt'
appearing inside the first icon.
0
Then pick
Pick the
to float Window 1. Figure 4-17
I$
shows how the Window Main Menu should look now.
Pick the "OK" icon to return to the Main Menu.
You have now finished enabling the X-gauge and
Y-gauge and t'floatedV'Window 1 and 2.
Pick the "OK" icon to store the configuration.
As soon as the "clock" vanishes, you are ready
to test position compensation.
Testing The
Position
Compensation
Setup
Press the button
to inspect
the workpiece. An
will be generated. Now draw a
ACCEPT decision
faint pencil line along either the top or bottom
edge of the sample workpiece
to aid you in
retaining the workpiece's vertical position. Now
carefully
slide the workpiece
about half the
width
of the hole towards
the left on the
screen. Figure 4-18 shows how the video monitor
will appear when this has been done.
Page
4-10
Chapter
Fig. 4-18.
Workpiece Slid
Toward Left
On Screen
Fig. 4-19.
Window 1 As
Shifted By
Module
Fig. 4-20.
Workpiece Slid
Up On Screen
4
Self-Teach
Session
II
Note how the
Press and hold the push button down.
representation of Window 1 shifts to the
displayed
left on the screen so the sample workpiece appears
as shown
in Figure 4-19.
in its nominal position
This shifting is based upon the "reading" from the
X-gauge. In effect, the X-position of Windows 1 and
2 have been tied to the left edge of the workpiece.
Releasing the button causes an ACCEPT decision to
be generated. Also, the representation of Window 1
then reverts to
displayed
on the video monitor
normal as shown in Figure 4-18.
to its original locaReturn
the sample workpiece
tion.
(Use the pencil line as a guide in the vertical direction
and slide the workpiece
horizontally until Window 1 is centered in the hole.
For the sake of illustration,
slide the sample
workpiece about half the width of the hole towards
the top of the screen as shown in Figure 4-20. When
the button is now pushed,
variations in the workpiece position along the Y-axis are compensated for
based upon the Y-gauge and variations along the Xaxis are compensated for based upon the X-gauge.
Now move the workpiece
close to the top of the
image as shown in Figure 4-21. Since the lower edge
of the sample workpiece
no longer falls along the
Y-gauge,
the workpiece
position along the Y-axis
will cause an "ACQ ERROR" to be generated as well
as a "REJECT" decision. Both LEDs will come on. Now
return
the workpiece
to its original
position
again.
Chapter
Chosing Range
Limits Based Upon
An Ensemble Of
Workpieces
Fig. 4-21.
Workpiece Slid
Off The Y-Gauge
4
Self-Teach
Session
I/
Page
4-11
Given the large numbers of workpieces which pass
it is
through a production line on a daily basis,
done perform well
important
that the inspection
variations
in workpiece
"insignificant"
across
The choice of low an
and dimensions.
appearance
high range limits may, ultimately, have to be made
with reference to a representative ensemble of production samples.
to perform a vision
Before
configuring
a Module
line, gather
application
for your own production
several workpieces which you consider to be repreworkpieces; i.e.,
sentative examples of acceptable
"known good" and also several more workpieces which
provide representative examples
of flaws which you
want the Module to REJECT (i.e., "known bad").
your Module using a
It is all right to configure
single
"ideal" workpiece, provided
that after you
have done so, you test using the ensemble of "known
good" and "known bad" workpieces. The procedure is
all the
as follows. Use the VIM Module to inspect
"known good" workpieces. Where necessary,
go back
and slightly loosen
(widen) the HiLo Range Limits
on Windows and line gauges until all of the workpieces generate
ACCEPT decisions. Now inspect all
Where
workpieces.
necessary,
the
"known bad"
Limits on Windows and
tighten (narrow) the Range
line gauges until all of these workpieces
generate
REJECT decisions. The Range Limits which will perform best lie somewhere between these two extremes.
Adapting To
Frontlighting
Fig. 4-22.
Camera Image
Obtained Using
Front Lighting
You may
encounter production line vision applications where
to install backit is not feasible
lighting or a light background. The same techniques
which we applied to a backlighted workpiece can be
where the lighting is on the
adapted to situations
same side as the camera.
Pick a bright area on the top half of the screen
the camera image to the
four (4) times to select
Video Monitor.
Now relocate
the workpiece so that the region containing
the round hole we have been verifying
extends
beyond
the edge of your worktable. Then
open up the f-stop on the lens to f/8 and move the
is within
the camera's
stand until
the workpiece
field-of-view as shown in Figure 4-22. Note how an
object, (in this case a coin) which has approximately the same reflectance as the workpiece has
been placed
at the same stand-off distance. The
sample workpiece now appears bright compared to its
background. This will usually
be the case whenever
the workpiece is in sharp
focus while
the back-
Page
4-12
Chapter
4
Self-Teach
Session
I/
ground is further enough away to be out of focus.
In some situations, however, you may still need to
build a light shield beneath or behind the workpiece to eliminate stray light.
The changes required
to adapt the techniques used
previously to the situation where the background is
dark are largely due to the fact that the workpiece
Since you just finished working
is now bright.
this section will describe
through
one example,
to do. Illustrations of
what you want the Module
A new concept
the Video Monitor
will be given.
spatial filtering - will also be covered.
Adaptations Made
Using The
Brightness Branch
Since the level of contrast
between the region of
interest and the surrounding
background has been
with the Brightchanged, we begin our adaptation
ness Branch.
Setting Thresholds
o Go to the Brightness Main Menu.
Fig. 4-23.
Threshold 1 Has
Been Set
- Select
the Threshold
Setting
Menu and adjust
Threshold 1 to produce a sharply defined "whitel'
in Figure
silhouette of the workpiece as shown
4-23.*
- In order to have an easy way to re-establish the
previous example,
leave Threshold
2 unchanged.
(In a moment, we will be disabling Window 2).
- Select and float Threshold 3 then adjust Threshhold 3 to produce a sharply defined silhouette
of the sample workpiece as shown in Figure 4-24.
Adjusting The
Brightness Probe
Now return to the Brightness
Main Menu.
- Move the brightness probe so that it is located on
a bright region which is illuminated by the same
light as the workpiece (in our case the coin).
*For the sake of clarity, the photographs used in this section were produced using a black paper backdrop. You may wish to do the same.
Chapter
4
Self-Teach
Session
/I
Page
4-13
Fig. 4-24.
Threshold 3 Has
Been Set
- Enter the HiLo Range Menu to *'latch" the nominal
Figure 4-25
value.
or ttreferencel' brightness
shows how the HiLo Range Menu should apear.
Adaptations Made
Using The Window
Branch
Having selected
new values for Threshold
1 and 3,
we will now use the Window Branch
to adjust the
corresponding Windows.
Obtain the Window Main Menu. Since Threshold 3 was
one we most recently adjusted, the Window Main Menu
comes up with Window 3 displayed.
Fig. 4-25
Brightness Probe
Position And
Reference Value
Page
4-14
Adjusting
Chapter
4
Window
o Use the Window Branch Menu to:
3
Self-Teach
Session
II
- Enable Window 3.
- Float Window 3 in the X and Y directions.
- Select a circular window.
o Use Part 2 of the Window Branch Menu to:
- Specify that Window 3 measure
black areas.
- Move Window 3 so that it is centered over the
round hole at the upper left of the workpiece.
- Size Window
3 so that
it is only slightly
larger than the round hole in the workpiece.
- Enter the HiLo Range Menu and adjust the low
and high range limits as shown in Figure 4-26.
Fig. 4-26.
Window 3 Has
Adjusting
Window
1
In the previous example, Window 1 was sized to fit
completely
within
the round hole
in the sample
workpiece.
Since the camera
stand-off
distance
hasn't
changed, there should be no need to change
the size of Window 1.
o Obtain the Window Branch Menu in a form that
controls Window 1.
o Use Part 2 of the Window Branch to:
- Specify that Window
1 count black pixels
- Move Window 1 so that it is
round hole in the workpiece.
centered
in the
Chapter
4
Self-Teach
Session
I/
Page
4-15
Fig. 4-27.
Window 1 Has
Been Adjusted
the low
- Enter the HiLo Range Menu and adjust
and high range limits as shown in Figure 4-27.
Disabling
o Select Window 2.
Window
- Disable Window 2. (Notice that the X Y float
icon reverts
to t'anchored'Vwhenever
a window
is disabled.)
- Now return to the Main Menu.
Adaptations Made
Using The Line
Branch
In addition to relocating
the X-gauge and Y-gauge
and specifying that they analyze white "blobsI' YOU
must
also select
the spatial
filtering
to be
employed and the appropriate nmeasurement pair".
Spatial Filtering
Of Line Gauges
When you work with thresholded images, some of the
pixels along the edges of the workpiece may flicker
from white to black and back again from image to
image. The X-gauge and Y-gauge support spatial filtering to compensate for this effect. Filter selection is done using the sixth icon in Line Main Menu
Part 2. As shown in Figure 4-28, three filtering
options
are available. These
same spatial filters
are also available on the twenty-two line gauges.
Page
Chapter
4-16
4
Se/f-Teach
Session
I/
Fig. 4-28.
Filter Selections
THE
ICON
SPATIAL
FILTER
EMPLOYED
No filtering
Single
pixel
blobs
are
Single
and two pixel
ignored
blobs
are ignored
The level of spatial filtering needed depends primarily
upon the quality of the images with which you are
working. As a general principle, you should use as
little filtering as possible while still obtaining
reliable results. In these examples no filtering is
necessary on the X-gauge and the Y-gauge because of the
high contrast. Images with low contrast may need line
filtering, so we will use it in the next example.
Adjusting
Y-Gauge
The
o Obtain the Line Main Menu.
o Obtain Part 2 of the Line Branch Menu and use it
to:
- specify that
blobs
the Y-gauge
- select
filter selection
are to be ignored.)
Line Gauge
Measurements
is
to analyze white
1 (single pixel blobs
The third icon in Part 2 of the Line Main Menu
selects
the "measurement
pair"
for this line
gauge. The selection
available is shown in Figure 4-29. Each pair is comprised of an upper and
lower measurement.
Both measurements
in this
pair are made on every
inspection cycle.
Chapter
4
Self-Teach
Session
I/
Page
Fig. 4-29.
Measurement Pairs Available
X-Gauge and Y-Gauge
1
ICON
1
4-17
With
SELECTED FEATURE SET
(a) Leading edge 01 largest blob
(b) Width of the largest blob
Ezl
(a)
(b)
Trailing
edge of the
Width of the largest
Ea
(a)
(b)
Center of the largest blob
Width of the largest blob
.
blob
I
(a) Leading edge of the leading blob
(b) Width of the leading blob
I
(a) Center of the leading blob
(b) Width of the leading blob
RI
El
1
b
Y
Fig. 4-30.
Selected Measurement Pair Is
Leading Edge and
Width Of The
First White Blob
largest
blob
(a)
(b)
Trailing
edge of the
Width of the trailing
trailing
blob
blob
- Select
as the measurement
pair the leading
edge and width
of the leading blob for the Ygauge.
Figure 4-30 shows Part 2 of the Line
Main Menu after this has been done.
- Move the Y-gauge such that half
is above the
top edge and half of it is on the workpiece.
- Now enter the HiLo Range Menu to set the high
and low limits
of the Y-gauge. Figure 4-31
shows the HiLo Range Menu after this has been
done properly.
o Pick *'OK1' to return
to the
(This latches the reference
Y-gauge.)
Line Main Menu.
position for the
We wish to use the X-gauge to measure the location
of the left edge of the workpiece. To return to the
X-gauge, you must
first cycle through
the twentytwo line gauges.
o Pick and firmly hold the first
X-gauge icon appears again.
o Go to Part 2 of
to:
icon until the
the Line Main Menu and use
it
Page
4-18
Chapter
Fig. 4-31.
Y-Gauge Measures
Leading Edge Of
First White Blob
4
Self-Teach
Session
II
- specify that the X-gauge analyze white pixels
- select Filter Selection
are ignored).
1 (single pixel blobs
- select the measurement
pair comprised of the
leading
edge and width
of the first blob.
Figure 4-32 shows Part 2 of the Line Main Menu
after this has been done.
such that half is off the
- move the Y-gauge
left edge and half of it is on the wokrpiece.
- now enter the HiLo Range Menu to set the high
of the X-gauge. Figure 4-33
and low limits
shows the HiLo Range Menu after this has been
done properly.
Fig. 4-32.
Measurement Pair
Includes Leading
Edge Of First
White Blob
o Pick "OK" to return to
latches
the reference
gauge) .
(This
the Main Menu.
position
of the X-
- Save the configuration.
You have now completed configuring your Module to
inspect the sample workpiece with front lighting on a
dark background.
Testing
and all of the tests which
were performed on
Any
the previous example can now be performed provided
you use black paper
in place
of white
and viceversa to simulate the flaws.
We will now
line gauges.
Controlling The
Twenty-Two Line
Gauges
turn our
attention
to the twenty-two
All of the Line Gauges are set up using
the Line
Main Menu. However, at a given time, only a single
line gauge can be viewed by this menu. In the previous example, you began by enabling and setting up
the X-gauge, then indexed forward to enable and set
Chapter
Fig. 4-33.
X-Gauge Measures
Leading Edge Of
First White Blob
4
Self-Teach
Session
/I
Page
4-19
up the Y-gauge. Control of the twenty-two (22) Line
Gauges is obtained by using the first icon in the
Line Branch to index beyond the Y-gauge. These Line
Gauges are referred to by number (i.e., Line Gauge
1, Line Gauge 2, .. . Line Gauge 22.) Each of them
independent in the sense that they
is completely
Just as with the X-gauge
are individually enabled.
a given line
and Y-gauge,
you can select whether
gauge is to analyze the image produced by Threshold
1, 2, 3 or 4 and control their location, size and
HiLo Range Limits. In a similar manner, all of the
measurement pairs shown above for the X-gauge and
line
to the twenty-two
Y-gauge
are available
gauges.
When measuring the width
of a blob, a line gauge's
readings are always the number of pixels crossed in
going from the start of the blob to the end of the
blob.
Fig. 4-34.
Coordinate System
Used By Line
G#uges
Differences Between
X-Gauge, Y-Gauge
And The Numbered
Line Gauges
When used to measure the position of the edge of a
blob, a horizontal line gauge's l'reading'l is the
llcolumn number" i.e., the number of pixels crossed
in going from the left border of the image to the
'Iedgel'on the workpiece. Similarly, a vertical line
gauge's
"readingV1 is the "row number" i.e., the
number of pixels crossed in going from the top border of the image to the IIedgell on the workpiece.
Figure 4-34 illustrates this coordinate system.
For each of the twenty-two
line gauges,
you can
select whether or not you wish them to t'floatV'in X
and Y. Each of the twenty-two line gauges is completely general in the sense that you can specify
either a horizontal or a vertical line. The twentytwo line gauges
also support two (2) additional
measurement nairs.
L
Page
4-20
Chapter
4
Se/f-Teach
Session
/I
-
the additional measurement
shows
Figure
4-35
pairs available with the numbered line gauges.
Fig. 4-35.
Additional Measurement Pairs Available
With The Numbered Line Gauges
Counting Blobs
With A Line Gauge
Count the number
of black
Count the number
of blobs
(upper
1
Count the number of edges
(lower
)
o Use the first icon on
index to Line Gauge 1.
pixels
the Line Main Menu to
1, use the third
- After
enabling
Line Gauge
line to a
icon to toggle from a horizontal
vertical
line.
(Note, how the third
icon
changes appropriately.)
Fig. 4-36.
Line Gauge No. 1
Is Vertical And
Uses Image 3
- Use the fifth icon (which currently has the
numeral 1111'
appearing inside it) to select the
image obtained using Threshold
3 for analysis
by this line gauge. Figure 4-36 shows the Line
Main Menu after this has been done.
o Obtain Part 2 of the Line Main Menu.
- Use the Line Move Menu in conjunction with the
Line Size Menu to adjust Line Gauge 1 so that
it cuts across three (3) of the small holes in
the sample workpiece.
- Use the fourth icon to select the analysis of
black blobs.
Chapter
Fig. 4-37.
Selected Measurement
Pair For Line Gauge 1
4
Self-Teach
Session
!I
Page
4-21
Now
to select the
use the
third
icon
measurement pair comprised of count the number
of blobs,
and count the number
of edges.
Figure 4-37 shows part 2 of the Line Main Menu
after this has been done correctly.
Obtain the HiLo Range Menu
as shown in Figure
4-38. The "upper I1measurement (count number of
blobs)
is being displayed. The reading of Ir3tV
is just the number of black blobs
on the Line
gauge.
Use the fourth
icon in the menu
to toggle to
the t'lowerlt measurement
of
(count number
edges) as shown in Figure 4-39. The reading of
11101'is the number of transitions
on the Line
gauge.
Fig. 4-38.
Line Gauge 1
Counts Black
Blobs
Return to part 2 of the Line Main Menu and set up a
Line gauge
1 to count the number of white pixels
along its length or to count the number of black
pixels along its length.
All of these measurement pairs behave like the Line
functions
which you tested
earlier.
The
gauge
exploration
of these
functions
is left for the
interested reader.
Fig. 4-39.
Line Gauge No. 1
Counts Edges
Paqe
4-22
Chapter
Block Transfer Of
The VIM Module
Configuration To
A PLC
4
Self-Teach
Session
//
The information set up in the VIM Module during the
process of configuring it is stored in EEPROM withcan be copied via
in the module. This information
into the PLC for archiving.
block transfers,
Then, at a later date, it may be transferred back
to the Module.
The VIM Module uses three (3) "blocksl' of different lengths to hold its configuration. Configuratilong and contains
on Block 1 is thirty (30) words
all the Main Menu inputs and the four (4) Windows.
Configuration Block 2 is sixty-two (62) words long
and contains the X-gauge, Y-gauge and Line Gauge 1
3 is
through Line Gauge 10. Configuration Block
Sixty-three (63) words long and contains Line Gauges 11 through Line Gauge 22. Since each configuration block has a unique length, the requested
transfer is used to identify
length of a block
which of the three configuration blocks is involvit is recommended that you transfer all
ed. Note,
three (3) configuration blocks as a matched set.
how to
for your PLC describes
The User's Manual
PLC. Specific
perform
Block Transfers
on your
data formats can be
details
concerning VIM Module
found in the VIM User's Manual, Chapter 6.
Summary
In this session you have learned how to use the VIM
Module X-gauge and Y-gauge to compensate for variaYou have also
tions
in workpiece
positioning.
in the previous
employed
adapted
the techniques
session to the situation where the sample workpiece
You have
is viewed
against
a dark background.
is needed
and have
learned why spatial filtering
to use it. We
and Y-gauge
configured
the X-gauge
have also described
the transfer of configuration
Module to a PLC. At this point in
blocks from the
time you should be able to apply the techniques you
have been shown to successfully
apply the VIM
applications
Module
to most
of the inspection
encountered on an industrial environment.
Chapter
Chapter Objectives
5
Self-Teach
Session
Ill
explore each of the VIM
In this chapter you will
tools
in a more detailed
Module
image analysis
manner than was done in previous sessions.
When you have completed
this
session, you will
understand
how to use all of the capabilities of
the VIM Module.
Chapter Contents
In the two previous Self-Teach Sessions you became
familiar with the image analysis tools provided by
for simple vision
the VIM Module by using them
tasks.
In this session
extend your
YOU will
ability to employ the brightness
probe, the four
(4) windows,
the X-gauge,
the Y-gauge, and the
twenty-two line gauges by applying them to more
difficult vision tasks. You will:
set-up
the
brightness
immediately
to
variations
,
probe
to
respond
in illumination
verify
the
presence
of
regions using line gauges.
arbitrarily
shaped
verify
the presence
regions using windows
arbitrarily
shaped
verify the presence
mixed contrast.
of
of a region of interest with
detect and verify the diameter
in a workpiece.
of a "blind holeI'
learn the inspection
cycle
time
Module for specific configurations.
of
the VIM
be told about PLC block transfers to access detailed
VIM Module "results".
While the focus in each section of this chapter is
on using the VIM Module
effectively under particular circumstances,
along the way you will have
the opportunity
to explore
each of the
VIM
Module's image analysis t'tools'tin more depth than
was done in previous sessions.
It is assumed
that you have worked completely
through Session 1 and Session 2. It would be helpful if you already have had an opportunity to try
to configure the VIM Module to inspect workpieces.
You should feel free to concentrate on the topics
which are relevant to the specific vision application you are interested in doing.
Page
5-2
Brightness
Chapter
Probe
5
Self- Teach Session
II!
As mentioned in Session 1, you can specify that
any or all of the four (4) thresholds be "floatedl'
(i.e., automatically raise and lower in the same
from the Brightness
ratio as the "readingstt
Probe.)
is controlled
The 91mode1tof the Brightness Probe
by the first icon in the Brightness Branch Menu.
that icon has always
had the
Up to this point,
in it. This 1121' appears when
numeral "2" showing
the VIM Module is using "Mode 2", Lighting Compensation.
Mode 2 Lighting
Compensation
In "Mode 2" , this ratio is determined by using the
from the preBrightness Probe "reading" obtained
ceding camera
image. Mode 2 - Lighting Compensation is of broad applicability. It compensates for
such as the aging of lamps,
lighting
changes,
which occur gradually over time. In Mode 2 there
on the location of either the
are no restrictions
Brightness Probe or the Windows or Line Gauges.
Mode 1 Lighting
Compensation
a strobe light
There are situations, such as when
substantial
employed,
variations
in
is
where
illumination can occur from image to image. "Mode
1" of the Brightness Probe was designed to compensate for this type of variation. In Mode 1 you can
specify
that any or all of the thresholds be
"floatedl' using the ratio between the Brightness
Probe "readingl' in the image that is being processed and the nominal value of the Brightness Probe.
When Mode 1 is selected, the Brightness Probe must
be located on or above image scan line forty (40).
Since the Brightness Probe always moves in increments of 8 pixels,
this corresponds
to the probe
being in the first, second or third vertical location available.
Mode 1 also requires that no part
of the windows, or the X-gauge, or the Y-gauge, or
line gauges extend above
any of the twenty-two
scan line forty-eight (48). Note: Disabling a Window or a Line gauge which extends above scan line
forty-eight (48) is not sufficient to permit
Mode
1 to be selected. All portions of all of the windows and line gauges (enabled or disabled) must be
below
image scan line fourty-eight (48). Failure
to do so will result in the first icon simply blinking when you try to enter Mode 1.
Starting
Configuration
For This Session
At this time you need to once again place the
silver metallic paper
in the camera's field-ofview and re-establish the configuration similar to
the way it was when you initially
enabled the Xgauge and Y-gauge
in Session 2.
(An easy way to
reposition
the workpiece is to return the f-stop
Chapter
Fig. 5-1.
Approximate
Position Of
Sample Workpiece
5
Self-Teach
Session
II!
Page
5-3
of the lens to f/11, direct the camera image to
the Video Monitor, and place the workpiece on silver paper beneath the camera
so that they appear
as shown
in Figure
5-l. Then select and enable
Window 2. Finally, move the camera left/right or
toward you/away until Window
2 is centered on the
large round hole in the sample workpiece as shown
in Figure 5-2.)
The starting configuration
is:
o Main Menu
- Swingarm Triggering
- Go On Reject (GO)
o Brightness
(SWG TRIG)
Branch
- Brightness Probe
Mode 2 Lighting Compensation
Located at the center-left of the image
Low range limit of 20
High range limit of 250
Fig. 5-2.
Sample Workpiece
With Window 2
- Thresholds
Threshold 1
Floated (Lighting Compensation Enabled)
Adjusted to give good definition of the
sample workpiece.
Threshold 2
Floated (Lighting Compensation Enabled)
Adjusted to give good definition of the
sample workpiece.
o Line Branch
- X-Gauge
Enabled
Measures black blobs
Leading edge of largest "blobtt selected
as the upper measurement.
Filter selection 0
Sized so that it is approximately
32 pixels
in length (one-eighth the screen).
Located such that it is centered over the
left edge of the workpiece.
Low range limit set to maximum attainable +l.
High Range limit set to maximum attainable.
Note, when the object has holes in it the
leading edge of the first blob is a more
reliable measurement than the leading
edge of the largest blob.
Page
5-4
Chapter
5
Self-Teach
Session
III
- Y-Gauge
Enabled
Measures black blobs.
Trailing edge of the bottom black blob
selected as the upper measurement.
Filter selection 0.
Sized so that it is approximately 32 pixels
in length.
Located such that it is half off the bottom
edge and half on the workpiece.
Low range limit set to minimum attainable.
High range limit set to maximum attainable -1.
- All of the twenty-two
3 and 4 disabled.
line gauges and Window
o Window Branch
- Window 1
Circular shaped
Centered on the large round hole in the
workpiece
Sized so that it is just contained with the
image of the hole.
Analyzes white areas.
High range limit set to maximum attainable.
Low range limit set to 5 less than the high
range limit.
Floated in X and Y directions.
- Window 2
Circular shaped
Centered on the large round hole in the
workpiece.
Sized so that it is slightly larger than
the image of that hole.
Analyzes white areas.
High range limit set to actual + rllOIV.
Low range limit set to actual - l‘lO'l.
Floated in X and Y directions.
- Window
3 and 4 disabled.
After you have reestablished and saved this configuration in EEPROM, use the push button trigger to
verify that inspection of the workpiece will generate an ACCEPT decision.
o Go to the Brightness
Main Menu and pick the
first icon. This
icon will blink, indicating
that the conditions required to enter Mode 1 are
not met. (This is because the Brightness Probe
is too low in the image.)
Chapter
5
Self-Teach
Session
Ill
o Now move the Brightness Probe
left corner of the image.
Page
5-5
to the upper-
Now return to the Brightness Branch and pick
the first icon. The numeral "2" appearing in
II
1" . If so,
it should change to the numeral
you have now selected Mode 1 of the Brightness Probe.
- Enter Mode 1.
Probe toward the bottom of
o Move the Brightness
the screen. Note how the arrow icon will blink
when you try to move the probe below scan line
fourty (40).
o Move the Y-gauge to the top of the screen. Note
how the arrow icon will blink in reverse
video
when you try to move this gauge
above scan line
fourty-eight (48).
The reason behind these
restrictions is that the
VIM Module must receive the Brightness Probe reading adjust
the thresholds,
and use them on the
incoming image in Real Time.
Verifying
Arbitrarily
Shaped Regions
Using Line
Gauges
o Now return the Y-gauge centered
on the bottom
edge of the workpiece.
Because this line gauge
was moved you must re-establish the HI/LO
range
limits.
In most of the simplest machine
vision applications,
there
is rarely
any l'rightltapproach to
accomplish the inspection of a workpiece.
There
are often several
approaches or "configurationsl'
which will yield approximately the same ACCEPT or
REJECT decisions.
Each approach will differ from
the others in certain respects such as adaptability to the natural
variation among workpieces,
inspection cycle time or susceptability to noise.
As when trying
to assess
the contrast between a
region of interest and the background,
you will
find it helpful
to use the Module
to explore and
confirm your own judgement
as to which approach
suits your needs best.
The shape of the region to be detected is known.
Since that may be any shape: rectangular, triangular, or round, this section will show you how to
use the line gauges
to verify any shape. In a
following section you will learn how to use Windows to accomplish this same task.
Page
5-6
Chapter
5
Self- leach
Session
III
-
Fig. 5-3.
Teardrop Shaped
Opening Used In
This Example
shield provides
a wide variety of
The drafting
you will work with the
shapes.
In this section
5-3. This
teardrop shaped opening
shown in Figure
teardrop can be characterized by its width, maximum
height and the angle of its top and bottom edges.
Thus, you can verify the presence of an opening of
the right size at the proper location by any combination of line gauges that confirm these.
some tolerance on line
You should generally allow
false REJECT
ttreadingstt
to
avoid
generating
gauge
decisions. This is necessary
because of the finite
sampling of the digital image.
Starting Configuration For This
Example
Begin with the sample workpiece on silver paper and
the VIM Module
configuration as it was at the end
of the previous section.
use
windows.
o Now
the
Window
Branch
to
disable
o Then use the Line Branch to:
Measuring Width Of
The Teardrop
Fig. 5-4.
Line Gauge 1 Is
Used To Verify
Width
- Enable Line Gauge 1
Make it horizontal.
Floating in X and Y directions
Analyze
the image obtained with
Threshold 1.
Analyze white blobs.
Select a measurement pair which includes
width of the largest blob
Filter selection 0.
Locate
Line
Gauge 1 so that it passes
through
the middle
of the teardrop
shaped hole and is sized as shown in
Figure 5-4.
Use the HiLo Range Menu to
(1) Set the high and low limits for the
upper measurement as wide as
possible (this measurement is not
used here.)
(2) Toggle to the lower measurement and
specify width of the largest blob
with the low range limit set to 2
less than the reading and the high
range limit set to 2 more than the
reading.
all
Chapter
Measuring The
Height Of The
Teardrop
Fig. 5-5.
Line Gauge 2 Is
Used To Verify
Height
5
Self-Teach
Session
II!
Page
5-7
- Enable Line Gauge 2
Make it vertical.
Floating in X and Y directions.
Analyze the image obtained using
Threshold 1.
Analyze white blobs.
Select a measurement pair which
includes width of the largest blob.
Filter selection 0.
Position Line Gauge 2 so that it
passes through the teardrop shaped
hole at its greatest height and is
sized as shown in Figure 5-5.
Use the HiLo Range Menu
to
(1) set the high and low limits for
the upper measurement as wide as
possible,
(2) Toggle to the lower measurement
and specify width of the largest
blob, with the low range limit set
to 2 less than the reading and the
high range
limit
set to 2 more
than the reading.
Measuring Angle Of
Top/Bottom Edges
Fig. 5-6.
Line Gauge 3 Is
Used To Verify
Taper Of The
Teardrop
- Enable Line Gauge 3
Make it vertical.
Float Line Gauge 3 in X and Y directions.
Analyze
image
the
obtained
with
Threshold 1.
Analyze white blobs.
Select a measurement pair which includes
width of the largest blob.
Locate
3 so that it
Line Gauge
passes through the teardrop shaped hole
as shown in Figure 5-6.
Use the HiLo Range Menu to specify
width
of the largest
blob with the
low range
limit set to 2 less than
the reading and the high range
limit set to 2 more
than the
reading.
o Pick t10K18 on the
configuration.
Main Menu
to save this
Page
5-8
Chapter
Selecting Range
Limits On Line
Gauges
5
Self-Teach
Session
!/I
Without moving the sample workpiece, press the
times to verify that an
push button
several
ACCEPT decision is always generated.
Now, slide the sample workpiece to the left
and press the push button switch again several
times to verify
that an ACCEPT decision is
always generated.
Repeat this test again while the workpiece has
then
been slid to the right on the screen,
slid down on the
again while
it has been
screen.
Your results
should show that an
cision is generated in all cases.
ACCEPT de-
Now return the
workpiece
to its nominal
location. (Note, when the sample workpiece is
in this location,
the window displayed on the
screen will not shift when the push button is
pressed).
o Use the Line Branch to change the low range
limits on Line Gauges 1, 2 and 3 from 2 less
than their reading
to only 1 less than their
readings and to also change their range limits
to 1 more than their readings.
o Pick IIOKII on
configuration.
the
Main
Menu
to
save
the
Without
moving the workpiece, press the push
button
twenty-five
(25) times in succession
keeping a tally of how many of these
inspections generate an ACCEPT decision and how many
generate a REJECT decision.
Now slide the sample workpiece to the left on
the screen
and press the pushbutton switch
twenty-five (25) times keeping a tally of how
many ACCEPT and how many REJECT decisions are
generated.
Repeat this test again while the
workpiece
has been
slid to the right on the
screen, then again while it has been slid up,
and yet again while it has been
slid down on
the screen.
o Now return
location.
the
workpiece
to
its
nominal
Your results
will be similar
to those shown in
Figure 5-7. This variable ACCEPT/REJECT pattern is
due to image-to-image variability.
Chapter
5
Self-Teach
Session
Ill
Page
5-9
Fig. 5-7.
Typical Decision Results When Range
Limits Are Set Too Tight
(c
Workpiece
I
I
I
I
Nominal
Location
on Screen
Position
Shifted to the Left
I
24
I
1
I
23
I
2
Shifted to the Right
25
0
Shifted
UD
24
1
Shifted
Down
I
22
I
Fig. 5-8
Formation Of A Digital Image
3
I
I
Page
5-10
Chapter
Self-Teach
5
Session
I!!
of as simply a
image can be thought
Every digital
mosaic of numbers where each number (i.e., "pixell')
represents the average brightness of the scene over
illustrates
Figure
5-8
rectangle.
a
small
how this comes about.
Image-To-Image
Variability
Each pixel value in the camera image represents the
area of a small
rectangle which is receiving light.
rectangle is struck by light, that
If the entire
pixel
appears bright. If none of its area is being
struck by light, that pixel appears dark. If 20% of
struck by light, that pixel
its area is being
if 80% of its area is
appears
dark-grey. Whereas
appears lightbeing struck by light, that pixel
thresholded, all
image
is
co-w - When a camera
pixels
whose values are larger than the threshold
are turned into white while all pixels whose values
than the threshold
are turned into
are smaller
represent
the boundary of a
black.
Pixels which
workpiece
will be white (black) as the small rectangular area they represent is (or is not) more
than 50% covered by the workpiece.
The effect of this is that the width of a blob (or
its location
relative
to an edge of the sample
workpiece) can vary by 1 to 2 pixels depending upon
line up with the
how the edges of the workpiece
the image. This
sampled
grid used to digitize
5-9 for three
effect
is illustrated
in Figure
slightly
different locations of the workpiece. In
location
(a) the ends of the workpiece closely
In locations (b)
match the detector grid elements.
and (c) the grid elements marked "T" are partially
When thresholded, the
covered
by the workpiece.
elements
or black
marked "Tl' can turn out white
depending upon whether their brightness happens
to
fall above or below the threshold selected.
Fig. 5-9.
Variations In Length Measurements
Due To Finite Spatial Sampling
(a)
LI’ll1l$J$II
IIll
lbll
(b)
ll
llll
t111ll111llIlIl
II
l
Ill
white
I l
fill
T
(cl
tl
l
IlllIlllll
black
white
llllIll1
T
l
T
ltlllllllI
l
1111
l I I 11
I Il
Detectors inside camera
I I lflllllllI
T
Chapter
5
Self-Teach
Session
Ill
Page
5-11
Verifying
Arbitrarily Shaped
Regions Using
Windows
can be selected to
Any or all of the four Windows
You also
be rectangular,
triangular or circular.
specify their location and size. Verifying regions
with any of those shapes is straightof interest
forward. An excellent way to verify the presence
of a region of interest which has a more complex
shape is to represent that region as a combination
of rectangles, triangles and circles. The teardrop
shaped
opening in the sample workpiece will again
be used as an example.
Verifying Presence
Of A Teardrop
o Disable Line gauges 1, 2 and 3.
o Use the Brightness Branch to adjust Threshhold s
an image like that
2, 3, and 4 to produce
obtained
using Threshhold
1.
(Note, you will
only be using Windows
2, 3 and 4 in this
example.
Fig. 5-10.
Window
2 Is
Inside The Right
Side Of Teardrop
o Use the Window Branch to:
- Enable Window 2
Select a circular shape.
Float Window 2 in X and Y directions.
Analyze white areas.
Locate and size Window 2 and set its
low range limit to the reading -5
as shown in Figure 5-10.
- Enable Window 3
Select a circular shape.
Float Window 3 in X and Y directions.
Analyze white areas.
Locate and size Window 3 and set its
low range limit to the reading -4
as shown in Figure 5-11.
Fig. 5-11.
Window 3 Is
Inside The Left
Side Of Teardrop
- Enable Window 4
Select a rectangular shape
Float Window 4 in X and Y directions.
Analyze white areas.
Locate and size Window 4 and set its
low range
limits to the reading -22
as shown in Figure 5-12.
o Pick "OK" on the Main Menu to
uration.
0 Select
the
Monitor.
live
camera
save this config-
image
on
the
Video
Now take the light pen in your left hand with your
thumb resting on its tip. Depressing the tip once
with your thumb will display Window 1. Press the
tip again to display Window 2 then again and again.
Page
5-12
Chapter
5
Self-Teach
Session
III
Fig. 5-12.
Window 4 Is Inside
The Body Of The
Teardrop
cycle by in order, then all
Note how the windows
four of them are displayed simultaneously. As shown
in Figure 5-13, the interior of the teardrop shaped
by the combination of
region is well represented
Windows 2, 3, and 4.
Verifying Presence
Of An L-Shape
Using multiple
windows, the L-shaped hole which
appears on the screen
in the lower-left of the
workpiece
can be verified by the combination of
inside its
two rectangular
shapes - one located
located inside its
horizontal
arm and the other
vertical arm.
Fig. 5-13.
Teardrop Shaped
Region Represented
By Windows
Verifying Presence
Of A Long Slot
In a similar manner, the long slot near the bottom
of the drafting shield can be verified by a long
rectangular
window
with
additional
disk shaped
windows located at each end.
The advantage of using windows
which are either
rectangular, or triangular, or circular (or a combination thereof) is that these shapes are available for all windows
and, in the event
of power
down, can be reconstructed.
Chapter
5
Self-Teach
Session
Ill
Page
5-13
Using "ThroughThe-Lens'Windows
based upon a
The VIM also supports
a process
a reference
direct comparison
of the image with
image. This approach, referred to as "through-thelens", is useful in situations where the shape of
the region of interest is either very
complex or
comprised of several disjoint areas. The throughthe-lens
windows can only be employed when using
Window 1, Window 2 or Window 3. The shape of the
"through-the-lens"
window
is
defined
at the
instant
you pick the third
icon in the Window
Branch Menu. (i.e., whatever is white in the image
at the instant this third icon is *'picked" becomes
the 'lthrough-the-lenslt window.)
For subsequent
images the "readingl' is the number of pixels that
lie beneath white areas of the mask. A "throughthe-lens" window can also be floated in X and Y.
Physical Setup
For This Example
At this point
darken the background
by extending
the workpiece over the edge of the table on which
you are working, changing the f-stop
on the lens
to f/8, and moving the camera
stand so that the
sample workpiece appears in the camera's field-ofview. If necessary, place a backdrop on the floor
beneath the workpiece to eliminate any spurious
bright spots.
Configuring For
A "ThroughThe-Lens Window
o Use the Brightness
Branch to:
- Select Mode 2 lighting compensation.
- Adjust Threshold 3 to obtain a white silhouette of the sample workpiece.
- Adjust Threshold 4 to also obtain a white
silhouette of the sample workpiece.
- Enter the HiLo Range Menu to latch the
nominal
brightness
value
(Low Limit
= 20, High Limit = 250)
o Use the Line Branch to:
- Adjust the X-gauge
Analyze the image obtained using
Threshold 3.
Measure white blobs.
Select a measurement pair containing
the leading edge of the first blob.
Filter selection 1.
Locate the X-gauge half off and half on
the left edge of the workpiece.
Enter the HiLo Range Menu to latch the
nominal X-gauge value.
Page
5-14
Chapter
Fig. 5-14.
Window 3 Is
llThrough-The-Lenst'
5
Self- Teach Session
Ill
- Adjust the Y-gauge
using
Analyze the image obtained
Threshold 3.
Measure white blobs.
Select a measurement pair containing the
leading edge of the first blob.
Filter selection 1.
the Y-gauge half off and half on the
Locate
top of the workpiece.
Enter the HiLo Range Menu to latch the
nominal Y-gauge value.
o Use the Window Branch to:
Fig. 5-15.
Workpiece With
Additional White
- Disable Window 2 and Window 3.
- Enable Window 4.
Now l'pickltthe third icon with the light pen
several times.Note how this icon goes through
the rectangle shape, the four orientations of
and the disk shape then
a right triangle,
all over again. This is
starts that cycle
"through-the-lens11 is not available
because
on Window
4.
Now disable Window 4.
- Enable Window 3.
icon. Note how this
Pick the third
changes to resemble a random shape.
icon
You have just captured a tlthrough-the-lens" window
for Window 3. Figure 5-14 shows how the display on
the Video Monitor should appear now.
- Float Window 3 in X and Y directions.
Fig. 5-16.
Workpiece With
Additional Black
Main Menu and enter
Go to Part 2 of the Window
the HiLo Range Menu. The high range limit represents the total number
of white
pixels in the
The reading is the
tlthrough-the-lensll window.
number of white pixels in the image which fall
within this mask.
strip of white
paper on the
Now place a small
in Figure 5table near the workpiece as shown
15. Note how the reading remains e%sentially
unchanged. Then place a small strip of blackened
paper on the workpiece as shown in Figure 5-16.
Note how the reading has now decreased.
Chapter
5
Self-Teach
Set the low
450.
II!
range value to the
“0K’l
on
o Pick
configuration.
Testing A "ThroughThe-Lens" Window
Session
the
Main
Menu
Page
5-15
reading:
about
save
this
to
switch to inspect the
o Now use the push button
workpiece
several
times.
(Note,
an ACCEPT
each
decision
should
be
generated
by
inspection.)
o Place the small slip of white paper on the table
near the workpiece.
Now use the push button to
inspect the workpiece several times.
Note that
ACCEPT decisions are still generated.
Fig. 5-17.
Workpiece Slid
Toward Left Of
Screen
Slide the workpiece to the left on the screen as
shown in Figure 5-17. Then use the push button
to inspect the workpiece several
times. (Here
again, an ACCEPT decision should be generated by
each inspection.)
Now place the strip of black paper on the workpiece. Again, press the push button switch. Note
that this time, a REJECT decision is generated.
o Remove
the black
strip of paper and press the
push button. The decision
generated should once
again be ACCEPT.
Now turn off the electrical power to the system.
After a few moments, turn it back on again and
press
the push button.
The red "CONFIG ERR"
light will come on becuase your
l'through-thelens" window
was lost when
the Module
was
powered down. You can correct this CONFIG ERR by
capturing
the "through-the-lens"
window
and
saving the configuration.
o Go To the Main Menu pick
the configuration.
the I~OKl~icon to save
Page
5-16
Chapter
5
Self-Teach
Session
Ill
you have learned that a
Through
this example
for
is well-suited
ttthrough-the-lens" window
region
of a complex
detecting missing portions
of interest.
Working With
Mixed Contrast
situations where the region of
You may encounter
the brightest thing in the
interest
is neither
scene nor the darkest. In this section, you will
use the X-gauge
and Y-gauge together with Line
gauges to verify the presence and width of a strip
of material which is bounded on one side by someand on the other
side by
thing which
is bright
something which is dark.
Physical Setup
For This Example
This example uses three different sheets of paper
contrast. Begin by
to simulate
a region of mixed
layering the silver sheet, the gold sheet and the
blue sheet as shown
in Figure
5-18. Direct the
camera
image to the Video
Monitor ,and adjust the
f-stop of the lens to produce
the best contrast
possible
between
the middle
sheet and the top
sheet.
Configuring VIM
Module For Mixed
Contrast
Use the Window Branch to disable all windows.
Fig. 5-18.
Arrangemnt of
Metallic Sheets
o Use the Line Branch
to disable the X-gauge
and
Y-gauge as well as all Line gauges. You may need
to "anchorl' all enabled tools first.
o Using the Brightness
Branch:
Move the Brightness Probe so that it is located completely
on an exposed portion of the
silver
(bottom) sheet. Then
enter the HiLo
Range Menu
and note the reading from this
region.
Next, move the Brightness
Probe so that it is
located completely on the exposed portion
of
the gold sheet. This is the region of interest
in this example. Enter the HiLo Range Menu and
again note the reading from this region.
Silver
Gold
Blue
Then move the Brightness
Probe so that it is
located
completely on the blue
(top) sheet.
Enter the HiLo Range Menu and again note the
reading.
Note that all three
readings are
different.
Move the Brightness Probe to the upper-left of
the screen and select Lighting Correction Mode
1.
Chapter
5
Self-Teach
Session
Ill
Page
5-17
sheet can not be
the gold
In this example
for
isolated
by simply thresholding,
any
threshold which
will discriminate
the bottom
from the middle sheet
also blends the
sheet
middle and top sheets together. A different
threshold is required for each boundary.
Fig. 5-19.
Threshold 3 Separates
Silver Sheet From Gold
Float Threshold
3 and adjust it to give the
of the silver
best
definition
possible
(bottom) sheet as shown in Figure 5-19.
it to give a
Float Threshold
4 and adjust
clear definition of the left and top edges of
the blue (top) sheet as shown in Figure 5-20.
0
Fig. 5-20.
Threshold Separates
Gold Sheet From Blue
Fig. 5-21.
X-Gauge Has Been
Adjusted
Use the Line Branch to:
- Enable X-gauge
Analyze
the
obtained
using
image
Threshold 3.
Measure white blobs.
Select a measurement pair containing the
trailing edge of the largest blob.
Filter selection 2
Size and locate the X-gauge as shown in
Figure
5-21 and then enter the HiLo
Range Menu to latch it nominal value.
- Enable the Y-gauge
Analyze
the
obtained
image
using
Threshold 3.
Measure white blobs.
Select a measurement pair containing the
trailing edge of the largest blob.
Filter Selection 2.
Size and locate the Y-gauge as shown in
Figure 5-22 and then
enter the HiLo
Range Menu to latch its nominal value.
- Enable Line gauge 1
Float Line gauge 1 in X and Y.
Analyze the image obtained using Threshold
4.
Analyze black blobs.
Select
a measurement
pair
containing the
leading blob.
Filter Selection 1.
Size and locate
Line gauge
1 as shown in
Figure 5-23. Enter
the HiLo Range Menu to
set the low limit to reading -4, and its
high limit to reading +4.
Page
5-18
Chapter
Fig. 5-22.
Y-Gauge Has Been
Adjusted
5
Self-Teach
Session
II!
- Enable Line gauge 2.
Float Line gauge 2 in X-and Y.
Analyze the image obtained using Threshold
4.
Measure black blobs.
Select a measurement pair containing the
Leading Edge of the Leading Blob.
Filter Selection 1.
Line gauge
2 as shown in
Size and locate
5-24 and then enter the HiLo Range
Figure
Menu to set its Low Limit to reading -4,
and it high limit to reading +4.
o Pick rlOK1' on the Main Menu to save this configuration.
Testing Your Mixed
Contrast Configuration
Fig. 5-23.
Line Gauge 1 Has
Been Adjusted
times. (An ACCEPT
Press the push button several
decision should be generated every time.)
Carefully
move the blue
(top) sheet toward the
left on the screen so that the exposed portion
of
the gold (middle) sheet
is narrower on the left.
to inspect the workpiece.
Now use the push button
Note that a REJECT decision is generated.
Now move the copper
sheet back
to its original
(The push
position
in the left-right direction.
button will once again produce ACCEPT decisions.)
Then move the gold sheet toward the bottom
of the
screen so that the exposed portion
of the gold
sheet is wider at the top (as shown in Figure 530) than originally. Again use the push button to
inspect the workpiece. Note that a REJECT decision
is generated.
Fig. 5-24.
Line Gauge 2 Has
.Been Adjusted
Verifying the width (or height) of a region of
interest
contrast involves using
which has mixed
two different
thresholds.
In this example, you
used the X-gauge and Y-gauge
to relate the locations of the line gauges
to edges in an image
obtained using one threshold while
their readings
were based upon edges obtained using
a different
threshold.
Chapter
Verifying The
Presence Of A
Blind Hole
Lighting
5
Self- Teach Session
Ill
Page
5-19
The high contrast
obtainable when a hole goes all
the way through
a workpiece
makes viewing and
measuring the hole easy. In this section you will
learn how to verify the presence of a t'blindl'hole
(i.e., the hole does not extend
all the way
through the workpiece). The way the Module is used
to verify blind holes is similar in many respects
to what
you have
already
done.
The major
difference is in the lighting and contrast between
the blind hole and its surroundings.
We have used a short length of 2" x 4" wood with a
l/2" diameter hole drilled 3/4" deep in the top as
depicted
in Figure
5-25. The 2 x 4 was viewed
against
a wooden table top to obtain a background
with the same
brightness
as the
region of
interest.
You may use a three dimensional object
of any type provided
it (a) has sufficient thickness, and (b) has a hole
in it which is at least
as deep as its diameter.
Fig. 5-25.
Physical Setup For Blind Hole Measurement
As shown in Figure 5-26, the lighting employed for
this example
was overhead fluorescent lighting of
the type typically found in an office building or
laboratory.
Page
5-20
Chapter
Self-Teach
5
Session
l/l
Fig. 5-26.
Diffuse Lighting Used For Blind Hole Measurement
Twin tube fluorescent
light fixtures
with
diffusing covers
Workpiece
A
I
I
I
I
For this work a fluorescent ring light located
just beneath the camera lens will work quite well.
The important
thing
is to have diffuse light
impinging
on the workpiece
from all directions
similar to the way the ground is illuminated when
uniform
layer of clouds
diffuses
the sun's
Tight.
Fig. 5-27.
Camera Image For
Illustrative
Example
r)
Figure 5-27 shows the camera image. Note how the
top of the workpiece and the top of the wooden
table
appear equally bright.
This is because the
wooden workpiece reflects the same amount of light
as the wooden table. The blind
hole in the workpiece
and the regions
around the immediate edges
of the workpiece
appear
slightly darker due to
shadowing.
As shown
in part
(a) of Figure 5-28,
the top of the workpiece and the wooden table top
receive incoming
light from many angles. As shown
in part
(b) of Figure
5-28, the bottom of the
blind hole only receives
light
from directly
above. The walls
of the hole block some
of the
light and make it slightly darker at the bottom of
the hole. The sides of the workpiece also block
some
light,
as shown
in Figure
5-28 (c).
5
Chapter
Self-Teach
Phenomenology
Session
III
Page
Fig. 5-28.
Exploited By Illustrative
(4
Table
I
Example
top
g W
h
Ill-l
LightY
(b)
I
I
Bottom of blind hole
5-21
Table top
I
-
Light
(cl
b
Configuring The
VIM Module To
Verify The Presence
Of A Blind Hole
Table top
The following steps were performed
the VIM Module for this example.
to configure
o Use the Window Branch to:
- Disable all windows.
o Use the Line Branch to:
- Disable all windows.
o Use the Brightness Branch to:
- Select Mode 1 of the Brightness Probe.
- Adjust Threshold 3 to give a clear
definition of the left and bottom edge
of the workpiece.
- Adjust Threshold 4 to give a clear
definition of the blind hole whose presence
in the workpiece is to be verified.
Fig. 5-29.
Y-Gauge Has Been
Adjusted
example, a single threshNote, in this particular
hold will suffice to bring out both the workpiece
since the
However,
edges and the blind hole.
general case requires two different thresholds, we
will use two here.
o Using the Line Branch
- Enable the Y-gauge
icon to select yllPickl' the fourth
followed
by xposition compensation
position compensation.
Analyze the image obtained with Threshold
3.
Measure white blobs..
Select a measurement pair containing the
trailing edge of the largest blob.
Filter Selection 2.
Page
5-22
Chapter
Fig. 5-30.
X-Gauge Has Been
Adjusted
Fig. 5-31.
Line Gauge 1
Has Been Adjusted
5
Self- Teach
Cycle
/II
Locate and size the Y-gauge and enter the
HiLo Menu to latch the nominal value of
the Y-gauge as shown in Figure 5-29.
Enable the X-gauge
Analyze the image obtained with Threshold
3.
Measure white blobs.
Select a measurement pair containing the
leading edge of the largest blob.
Filter Selection 2.
Locate and size the X-gauge and enter the
Range
the
Setting
Sub-Menu
to latch
nominal value
of the X-gauge as shown in
Figure 5-30.
Enable Line gauge 1
Float Line gauge 1 in X and Y.
Analyze the image obtained using Threshold
4.
Measure black blobs.
Select a measurement pair which contains
the width of the largest blob.
Locate
and size Line gauge 1 as shown
in Figure 5-31.
Enter the HiLo Range Menu and select width
of the largest blob, adjust the low range
limit to reading -6, and adjust the high
range limit to reading +6.
o Pick tlOK1'on
uration.
Inspection
Time
Session
the Main Menu to save this config-
"Inspection Cycle Time" is the term used for the
elapsed time from the trigger until the inspection
is complete.
The inspection
cycle time depends
upon the configuration.
At a minimum,
it takes
1/60th of a second to
receive and process a new image from the camera.
The VIM Module typically can capture an image from
the camera and analyze it in less time than it
for the next workpiece
takes
to advance into
position on the production line. This section provides
timing
information
which
may help you in
situations
where
the inspection
cycle time is
critical.
Chapter
5
Self- Teach Session
II!
Page
5-23
Figure 5-32 shows a timing diagram
for the key
by the VIM
control
signals
input and output
Module.
A cycle begins
when
the TRIGGER line
The BUSY line goes high about 0.1 millirises.
seconds
later. When the Module has completed the
image analysis, the DECISION line is set high or
with the inspection results. At
low in accordance
this time, the BUSY line is also set low signifying that the Module is ready for the next trigger.
Note that BUSY will be held high as long as
TRIGGER
is held high.
The DECISION
should be
sampled after the BUSY line drops.
Fig. 5-32.
VIM Module Signal Timing-Short
10
!
Trigger
ms
Trigger input
I
!J
0.1 ms i i
'i
*17...200
1
rnsi
Busy output
Decision output
I
The fastest VIM Module
cycle time
attainable
occurs using TRIGGER
and DECISION signals via the
swingarm. With all four (4) windows enabled (but
not floated
in X and Y) and all Line Gauges
disabled, the VIM Module cycle time is 1/60th of a
second.
Enabling the X-gauge and Y-gauge and floating the
four (4) windows in X and Y will result in a cycle
time of approximately 1/15th
of a second. Employing filtering to eliminate transitions of length 1
pixel
for both the X-gauge
and Y-gauge will not
change this number appreciably
unless there are
many white to black and black to white transitions
along these gauges.
Page
5-24
Chapter
5
Self-Teach
Session
increase as more Line
Inspection cycle times will
gauges are enabled, or as the length used for each
Line gauge is increased.
Having
Y-gauge
gauges
Filter
1/30th
the X-gauge and
all the windows disabled,
and two
(2) 64 pixel long Line
enabled,
enabled and floated in X and Y, and using
in a cycle time of
Selection 1 will result
of a second.
floated and
Increasing
the number
of enabled,
filtered Line gauges from two (2) to eight(8) will
result in a cycle time of approximately 1/15th of
a second.
Enabling,
floating
and
line gauges
will result
1/8th of a second.
filtering all twenty-two
in a cycle time around
case, enabling and floating
In the absolute worst
all four (4) windows, enabling all twenty-two (22)
line gauges as 128 pixels in length, floated in X
Selection 2 will result in
and Y and using Filter
a cycle time on the order of 1/6th-1/4th second.
When you must know precisely
what the VIM Module
configuration,
cycle time is with your particular
the best way to obtain
that information is to
done by
This
may be
measure
it
directly.
connecting
an oscilloscope
to the "TRIGGER" and
Trigger
"BUSY" terminals
on the VIM's swingarm.
the scope scan with the rising edge of the TRIGGER
signal. Make sure that the trigger is a staccato
about 10 ms in duration. Measure the time
pulse,
is the VIM
drops.
This
until
the BUSY signal
Module Inspection Cycle Time. Make sure to measure
of image condition - this can
it under a variety
have an impact on the inspection cycle time.
Ill
Index
Page
Title
...............................................................
Analogimage
..................................................................
BlindHole
Blob
....................................................................
..........................................................
BrightnexxBranch
........................................................
BrightnessProbe
.................................................
Brightness Probe Modes
Brightness Range Limits ......................................................
..............................................................
CameraFocusing
3-4
S-20
l-1,4-15
3-11
3-11,3-16
_ 5-2,5-S
3-17
3-7
Cameralmage
................................................................
3-5
Configuration
................................................................
l-l
.........................................................
ConfigurationBlocks
......................................................................
Contrast
................................................................
Field-Of-View
...............................................................
Filter Selection
..............................................................
FloatinginX&Y
...........................................................
Floating Threshold
.............................................................
FreezeOnReject
................................................................
GoOnReject
Icon ........................................................................
Cycle Time .......................................................
Inspection
Image
4-27
3-8
4-15
4-l 5
4-8
3-19
3-28
3-28
l-l
5-24
l-l
........................................................................
.....................................................................
LightPen
........................................................
Compensation
..................................................................
LineBranch
3-l
5-2
Lighting
...........................................................
LineGauge
Line Gauge Range Limits
...................................................
Measurement
................................................................
Measurement
Pair .......................................................
..............................................................
Mixed Contrast
Range Limits ........................................................
3-11
l-1,4-18,5-6
4-5,5-8
4-16
4-16,4-19
5-17
3-17,3-23,4-S
3-4
Pick ..........................................................................
Pixel .........................................................................
................................................................
SignalTiming
..............................................................
Spatial Filtering
...................................................................
Thresholdimage
Through-The-Lens
.........................................................
...................................................
Window
...............................................................
Userlnterface
Vision Input Module
WindowBranch
Window
......................................................
............................................................
Window
..............................................................
Range Limits
WindowShape
Workpiece
...................................................
..............................................................
...............................................................
WorkpieceFlaws
4-l 5
3-6
............................................................
Stand-OffDistance
Threshold
l-2
5-25
.............................................................
3-18
3-3,5-11
5-14
3-11
2-1,3-l
1
l-1,3-20,5-12
3-11
3-23,3-26
3-20
2-2,3-g
3-30
X-Gauge
................................................................
4-1,4-2”
Y-Gauge
.................................................................
4-l,4-6
(EJc ALLEN-BRADLEY
A ROCKWELL
INTERNATIONAL
Industrial
Milwaukee,
Publication
COMPANY
Control Group
Wlsconsm
2803419
53204
-October,
1987
40062-038-01
(A)