1
'
$
Dynamic Race Detection
in Parallel Programs
Zur Erlangung des akademischen Grades eines
Doktors der Ingenieurwissenschaften
der Fakultät für Informatik
des Karlsruher Instituts für Technologie (KIT)
genehmigte
Dissertation
von
Ali Jannesari Ladani
Dezember 2010
Tag der mündlichen Prüfung: 03. November 2010
Erstgutachter:
Prof. Dr. Walter F. Tichy
Zweitgutachter:
Prof. Dr. Andreas Zeller
(Universität des Saarlandes)
&
KIT - University of the State of Baden-Wuerttemberg and National Research Center of the Helmholtz Association
%
www.kit.edu
II
Abstract
Recent hardware developments have pushed parallel computing out of the niche
of numeric applications into the mainstream. Unfortunately, parallel programs
may contain synchronization defects, a class of defect which is difficult to detect. A significant source of these defects is the phenomenon of data races, i.e.,
unsynchronized accesses to shared data. Since parallel programs are scheduledependent, reproducing data races is often difficult. Programs encountering data
races often do not crash immediately, resulting in mysterious and unpredictable
behavior.
Currently, available tools tend to miss many data races, or to produce an overwhelming number of false alarms, regardless of whether they are based on static
analysis or dynamic analysis. Both types of analysis also have their own specific
problems. Static analysis, due to the state explosion problem, is not applicable
to large programs, or, alternatively, the analysis has to focus on a small subset
of fault types. Dynamic analysis, on the other hand, is limited to finding faults
in the code which is actually executed. Additionally, dynamic analysis is either
very slow or reports numerous false warnings.
In this work, we propose a dynamic approach for race detection based on a
synthesis of lockset and happens-before analyses. The approach provides a lower
rate of both false positives and false negatives (missed races). The basic idea is to
consult the happens-before relation whenever the lockset algorithm indicates a
possible race. The increased precision is due to more detailed state machines and
adjustment of the sensitivity of the detector for different kinds of applications.
Additionally, a technique to correctly handle inter-thread event notifications
further improves the accuracy of the detector.
Furthermore, we present a new method to deal with ad-hoc synchronizations,
i.e., programmer-defined synchronizations in source code. The method is also
able to identify synchronization operations from unknown libraries, resulting in
a universal race detector.
Our race detection approach is automatic, without any user intervention or
reliance on source code annotation, and has been implemented as a tool, which
we named Helgrind+ . Results from several benchmarks demonstrate a significant
reduction in false positive rates and false negative rates compared to existing
race detectors, with a negligible increase in overhead.
III
IV
Kurzfassung
Parallele Programme sind anfällig für Synchronisierungsfehler, die schwierig
aufzuspüren sind. Ursache sind meist sog. Wettlaufsituationen, d.h. unsynchronisierte Zugriffe auf gemeinsam genutzte Daten. Solche Wettlaufsituationen lassen sich nicht zuverlässig reproduzieren, da ihr Auftreten in der Regel
abhängig von einer konkreten Ausführungsreihenfolge ist. Erschwerend kommt
hinzu, dass sie sich oft nicht in unmittelbaren Programmfehlern manifestieren,
sondern zu unvorhersehbarem Programmverhalten führen, dessen Ursache dann
nur noch schwer zurückzuverfolgen ist.
Verfügbare Wettlauferkenner, sowohl statische als auch dynamische, neigen dazu,
Wettläufe zu übersehen, oder eine Flut von Falschmeldungen zu liefern. Hinzu
kommen Probleme, die in der Art der Analyse selbst begründet sind: Die statische Analyse kann häufig nicht auf größere Probleme angewendet werden, da die
Anzahl der zu untersuchenden Programmzustände exponentiell wächst. Dynamische Analyse hingegen kann nur Fehler in solchen Programmteilen finden,
die tatsächlich ausgeführt werden. Auch wird durch dynamische Analyse die
Programmausführung erheblich verlangsamt.
Mit Helgrind+ stellen wir einen neuen, dynamischen Ansatz vor, der Locksetund Geschieht-Vorher-Analyse kombiniert: Die Geschieht-Vorher-Beziehung wird
immer dann herangezogen, wenn der Lockset-Algorithmus einen Wettlauf meldet.
Durch Anpassen der internen Zustandsautomaten – auch unter Berücksichtigung verschiedener Programmklassen – können wir Genauigkeit und Qualität
der Wettlauferkennung deutlich erhöhen. Dazu trägt auch eine neue Technik
bei, die den Signalaustausch zwischen parallelen Fäden korrekt handhabt.
Nicht zuletzt gelingt es uns, benutzerdefinierte Synchronisierung, sogenannte adhoc-Synchronisierung, zu berücksichtigen. Da wir so auch Synchronisierungsprimitive von nicht direkt unterstützen Bibliotheken zu erkennen vermögen, stellt
unser Ansatz den ersten universellen Wettlauferkenner dar.
Für die Analyse sind keine weiteren Benutzereingaben und keine Annotationen
des Quellcodes erforderlich. Anhand von Benchmarks können wir im Vergleich
zu existierenden Wettlauferkennern eine deutliche Reduzierung sowohl der Zahl
der nicht gemeldeten Wettläufe als auch der Zahl der Falschmeldungen nachweisen. Dabei bleibt der zusätzliche Mehraufwand bei Speicherverbrauch und
Ausführungszeit vernachlässigbar.
V
VI
Contents
List of Figures
XI
List of Tables
XV
1. Introduction
1.1. Motivation . . . . . . . . . . . . . . . . . . . . . . . . . . . . . .
1.2. Problem Statement . . . . . . . . . . . . . . . . . . . . . . . . .
1.3. Structure of the Thesis . . . . . . . . . . . . . . . . . . . . . . .
1
1
4
7
2. Objectives and Contributions
2.1. Objectives . . . . . . . . . . . . . . . . . . . . . . . . . . . . . .
2.2. Contribution . . . . . . . . . . . . . . . . . . . . . . . . . . . . .
2.3. Hypotheses . . . . . . . . . . . . . . . . . . . . . . . . . . . . .
9
9
9
10
3. Basic Concepts of Race Detection
3.1. Definitions . . . . . . . . . . . . .
3.2. Data Race Classifications . . . . .
3.3. Synchronization . . . . . . . . . .
3.4. Dynamic Data Race Detection . .
3.4.1. The Lockset Algorithm . .
3.4.2. Happens-Before Relation .
3.4.2.1. Thread Segments
3.4.2.2. Vector Clocks . .
.
.
.
.
.
.
.
.
13
13
15
17
18
18
21
21
22
.
.
.
.
.
.
27
27
28
29
32
33
33
5. Helgrind+ Race Detection
5.1. The Algorithm . . . . . . . . . . . . . . . . . . . . . . . . . . .
35
35
4. Related Work
4.1. Static Analysis . . . . . . . . . .
4.2. Model Checking . . . . . . . . . .
4.3. Dynamic Analysis . . . . . . . . .
4.4. Post-mortem . . . . . . . . . . . .
4.5. Software Transactional Memory .
4.6. Hardware Transactional Memory
.
.
.
.
.
.
.
.
.
.
.
.
.
.
.
.
.
.
.
.
.
.
.
.
.
.
.
.
.
.
.
.
.
.
.
.
.
.
.
.
.
.
.
.
.
.
.
.
.
.
.
.
.
.
.
.
.
.
.
.
.
.
.
.
.
.
.
.
.
.
.
.
.
.
.
.
.
.
.
.
.
.
.
.
.
.
.
.
.
.
.
.
.
.
.
.
.
.
.
.
.
.
.
.
.
.
.
.
.
.
.
.
.
.
.
.
.
.
.
.
.
.
.
.
.
.
.
.
.
.
.
.
.
.
.
.
.
.
.
.
.
.
.
.
.
.
.
.
.
.
.
.
.
.
.
.
.
.
.
.
.
.
.
.
.
.
.
.
.
.
.
.
.
.
.
.
.
.
.
.
.
.
.
.
.
.
.
.
.
.
.
.
.
.
.
.
.
.
.
.
.
.
.
.
.
.
.
.
.
.
.
.
.
.
.
.
.
.
.
.
.
.
.
.
VII
Contents
5.1.1. Lock Operations . . . . . . . . . . . . . . . . . . . . .
5.1.2. Happens-Before Analysis . . . . . . . . . . . . . . . . .
5.2. Memory State Machines . . . . . . . . . . . . . . . . . . . . .
5.2.1. Memory State Machine for Long-running Applications
5.2.2. Principles of MSM-long . . . . . . . . . . . . . . . . . .
5.2.3. States of MSM-long . . . . . . . . . . . . . . . . . . . .
5.2.4. Memory State Machine for Short-running Applications
5.2.5. Principles of MSM-short . . . . . . . . . . . . . . . . .
5.2.6. States of MSM-short . . . . . . . . . . . . . . . . . . .
5.2.7. Discussion and Comparison of Memory State Machines
5.3. Limitations . . . . . . . . . . . . . . . . . . . . . . . . . . . .
5.3.1. Imprecise Happens-Before Detection . . . . . . . . . .
.
.
.
.
.
.
.
.
.
.
.
.
36
37
38
38
40
41
48
50
50
55
56
57
.
.
.
.
.
.
.
.
.
.
.
.
59
60
61
62
63
64
66
67
70
70
71
72
76
.
.
.
.
.
.
.
.
.
79
80
80
82
83
84
86
89
90
91
8. Implementation of Helgrind+
8.1. Valgrind Framework . . . . . . . . . . . . . . . . . . . . . . . .
8.2. Machine Code and Intermediate Representation (IR) . . . . . .
8.3. Shadow Memory . . . . . . . . . . . . . . . . . . . . . . . . . .
93
93
95
99
6. Detecting Inter-thread Event Notifications
6.1. Motivating Example . . . . . . . . . . . . .
6.2. Spurious Wake ups . . . . . . . . . . . . . .
6.3. Detecting Lost Signals . . . . . . . . . . . .
6.3.1. Source Code Annotation . . . . . . .
6.3.2. Binary Instrumentation . . . . . . .
6.4. Data Dependency . . . . . . . . . . . . . . .
6.4.1. WR-Relation . . . . . . . . . . . . .
6.5. Summing-up . . . . . . . . . . . . . . . . . .
6.5.1. Pre-instrumentation Phase . . . . . .
6.5.2. Instrumentation phase . . . . . . . .
6.5.3. Runtime phase . . . . . . . . . . . .
6.6. Limitations . . . . . . . . . . . . . . . . . .
.
.
.
.
.
.
.
.
.
.
.
.
.
.
.
.
.
.
.
.
.
.
.
.
.
.
.
.
.
.
.
.
.
.
.
.
.
.
.
.
.
.
.
.
.
.
.
.
7. Identifying Ad-hoc Synchronization
7.1. Synchronization Operations . . . . . . . . . . . . .
7.1.1. True and False Data Races . . . . . . . . . .
7.2. Ad-hoc Synchronizations . . . . . . . . . . . . . . .
7.2.1. Common Pattern in Ad-hoc Synchronization
7.2.2. Detecting Spinning Read Loops . . . . . . .
7.2.3. The Algorithm . . . . . . . . . . . . . . . .
7.2.4. Limitations . . . . . . . . . . . . . . . . . .
7.3. Universal Race Detector . . . . . . . . . . . . . . .
7.3.1. Detecting Synchronization Primitives . . . .
VIII
.
.
.
.
.
.
.
.
.
.
.
.
.
.
.
.
.
.
.
.
.
.
.
.
.
.
.
.
.
.
.
.
.
.
.
.
.
.
.
.
.
.
.
.
.
.
.
.
.
.
.
.
.
.
.
.
.
.
.
.
.
.
.
.
.
.
.
.
.
.
.
.
.
.
.
.
.
.
.
.
.
.
.
.
.
.
.
.
.
.
.
.
.
.
.
.
.
.
.
.
.
.
.
.
.
.
.
.
.
.
.
.
.
.
.
.
.
.
.
.
.
.
.
.
.
.
Contents
.
.
.
.
.
.
.
.
.
.
100
101
102
102
103
106
107
109
111
112
9. Experiments and Evaluation
9.1. Experimental Setup . . . . . . . . . . . . . . . . . . . . . . . . .
9.2. Results . . . . . . . . . . . . . . . . . . . . . . . . . . . . . . . .
9.2.1. Unit Test Suite . . . . . . . . . . . . . . . . . . . . . . .
9.2.1.1. Evaluation of MSMs and Inter-thread Event Notifications . . . . . . . . . . . . . . . . . . . . .
9.2.1.2. Evaluation of Ad-hoc Synchronizations . . . . .
9.2.1.3. Comparing with Other Race Detectors . . . . .
9.2.2. PARSEC Benchmark Suite . . . . . . . . . . . . . . . . .
9.2.2.1. Programs without Using Condition Variables .
9.2.2.2. Programs Using Condition Variables . . . . . .
9.2.2.3. Ad-hoc Synchronization and Unknown Synchronization Operations . . . . . . . . . . . . . . .
9.2.2.4. Comparison to other Dynamic Race Detectors .
9.3. Performance Evaluation . . . . . . . . . . . . . . . . . . . . . .
9.3.1. Memory Consumption . . . . . . . . . . . . . . . . . . .
9.3.2. Runtime Overhead . . . . . . . . . . . . . . . . . . . . .
115
115
116
116
10.Conclusion
10.1. Conclusion . . . . . . . . . . . . . . . . . . . . . . . . . . . . . .
10.2. Discussion . . . . . . . . . . . . . . . . . . . . . . . . . . . . . .
10.3. Future Research . . . . . . . . . . . . . . . . . . . . . . . . . . .
135
135
136
137
8.4.
8.5.
8.6.
8.7.
8.3.1. Shadow memory for MSM-long
8.3.2. Shadow memory for MSM-short
Control Flow Analysis . . . . . . . . .
8.4.1. Branch Analysis . . . . . . . . .
Instrumenting Loops in IR . . . . . . .
8.5.1. Look Ahead Instrumentation .
8.5.2. Identifying Function Calls in IR
8.5.2.1. Function Pointers . . .
Data Dependency Analysis . . . . . . .
Limitations . . . . . . . . . . . . . . .
.
.
.
.
.
.
.
.
.
.
.
.
.
.
.
.
.
.
.
.
.
.
.
.
.
.
.
.
.
.
.
.
.
.
.
.
.
.
.
.
.
.
.
.
.
.
.
.
.
.
.
.
.
.
.
.
.
.
.
.
.
.
.
.
.
.
.
.
.
.
.
.
.
.
.
.
.
.
.
.
.
.
.
.
.
.
.
.
.
.
.
.
.
.
.
.
.
.
.
.
.
.
.
.
.
.
.
.
.
.
.
.
.
.
.
.
.
.
.
.
.
.
.
.
.
.
.
.
.
.
Bibliography
A. Helgrind+ User Manual
A.1. Choosing a Memory State Machine . . . .
A.2. Handling Inter-thread Event Notifications
A.2.1. Example . . . . . . . . . . . . . . .
A.3. Spinning Read Loop Detetcion . . . . . . .
A.3.1. Example . . . . . . . . . . . . . . .
116
117
119
120
122
124
127
129
130
130
132
XVII
.
.
.
.
.
.
.
.
.
.
.
.
.
.
.
.
.
.
.
.
.
.
.
.
.
.
.
.
.
.
.
.
.
.
.
.
.
.
.
.
.
.
.
.
.
.
.
.
.
.
.
.
.
.
.
XXIII
. XXIII
. XXIV
. XXIV
. XXIV
. XXV
IX
Contents
A.3.2. Control flow graph . . . . . . . . . . . . . . . . . . . . . XXV
A.4. Miscellaneous Commands . . . . . . . . . . . . . . . . . . . . . XXV
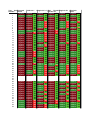
B. Experiment Results on Unit Test Suite
XXVII
B.1. Results Based on MSM-short . . . . . . . . . . . . . . . . . . . XXVII
B.2. Result Based on MSM-long . . . . . . . . . . . . . . . . . . . . XXXII
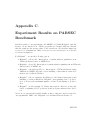
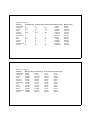
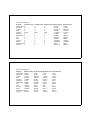
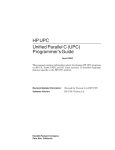
C. Experiment Results on PARSEC Benchmark
X
XXXVII
List of Figures
1.1.
1.2.
1.3.
1.4.
1.5.
1.6.
Data race example. . . . . . . . . . . . . . . . . . . . . . . . . .
First interleaving increments X once. . . . . . . . . . . . . . . .
Second interleaving increments X twice. . . . . . . . . . . . . .
Elimination of data race by lock protection. . . . . . . . . . . .
False positive generated by the lockset algorithm. . . . . . . . .
Simple example causes a false negative in pure happens-before
detectors. . . . . . . . . . . . . . . . . . . . . . . . . . . . . . .
1.7. Inter-thread event notifications using synchronization primitives
signal() and wait(). . . . . . . . . . . . . . . . . . . . . . .
1.8. Simple ad-hoc synchronization using a FLAG. . . . . . . . . . .
3.1. Atomicity violation causes a data race. . . . . . . . . . . . . . .
3.2. Avoiding an atomicity violation by protecting the critical section
with locks. . . . . . . . . . . . . . . . . . . . . . . . . . . . . . .
3.3. Atomicity violation within the critical section. But it does not
effect a data race. . . . . . . . . . . . . . . . . . . . . . . . . . .
3.4. Order violation results in a data race on DATA. . . . . . . . . .
3.5. Classification of data races. . . . . . . . . . . . . . . . . . . . .
3.6. Possible states for a memory location in the basic lockset algorithm.
3.7. Detecting a data race on the shared variable GLOB by lockset
algorithm. . . . . . . . . . . . . . . . . . . . . . . . . . . . . . .
3.8. A simple example causes false negative in Eraser-based race detectors. . . . . . . . . . . . . . . . . . . . . . . . . . . . . . . . .
3.9. A thread consists of thread segments separated by synchronization operations. . . . . . . . . . . . . . . . . . . . . . . . . . . .
3.10. Happens-before relations caused by fork/join operations. . . . .
3.11. Detecting a data race on the shared variable GLOB by happensbefore analysis. . . . . . . . . . . . . . . . . . . . . . . . . . . .
3.12. Happens-before relations caused by signal/wait operations. . . .
5.1. Memory state machine for long-running applications. . . . . . .
5.2. A data race occurs on the shared variable GLOB after two unsynchronized accesses - overall nine accesses. . . . . . . . . . . . . .
1
2
2
3
5
5
6
6
14
14
15
16
17
20
20
21
22
23
25
25
39
42
XI
List of Figures
5.3. Preventing a false positive on the shared variable GLOB by MSMlong. . . . . . . . . . . . . . . . . . . . . . . . . . . . . . . . . .
5.4. Memory state machine for short-running applications. . . . . . .
5.5. A data race occurs on the shared variable GLOB after only one
unsynchronized access - overall seven accesses. . . . . . . . . . .
5.6. Example for a false negative due to the limitation of MSMs. . .
6.1. Lost signal when using synchronization primitives signal()
and wait(). . . . . . . . . . . . . . . . . . . . . . . . . . . . .
6.2. Depending on the interleaving during execution, different parts
of the code are responsible for constructing the synchronization.
6.3. Several signaling and waiting threads using the same condition
variable CV. . . . . . . . . . . . . . . . . . . . . . . . . . . . . .
6.4. Annotated while loop when using condition variable. . . . . . .
6.5. While-loops in machine code. . . . . . . . . . . . . . . . . . . .
6.6. Happens-before graphs generated by different methods to variables X and Y. . . . . . . . . . . . . . . . . . . . . . . . . . . .
6.7. Using condition variables not following the standard pattern. . .
6.8. hb-relation constructed from lock operations by a pure happensbefore race detector. . . . . . . . . . . . . . . . . . . . . . . . .
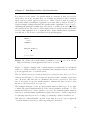
7.1. Using the synchronization primitive barrier wait() from an unsupported library causes apparent data races on DATA. . . . . .
7.2. Ad-hoc synchronization causes an apparent data race on DATA
and a synchronization data race on FLAG. . . . . . . . . . . . .
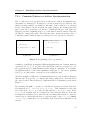
7.3. Implementation of synchronization primitive barrier wait() causes
synchronization races on counter. . . . . . . . . . . . . . . . .
7.4. Spinning read loop pattern. . . . . . . . . . . . . . . . . . . . .
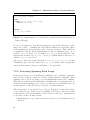
7.5. Implementation of lock/unlock operations in various libraries (e.g.
Pthread library). . . . . . . . . . . . . . . . . . . . . . . . . . .
7.6. An example for spinning read loop. . . . . . . . . . . . . . . . .
7.7. Machine code of spinning read loop depicted in Figure 7.6. . . .
7.8. An example for non-spinning read loop. . . . . . . . . . . . . . .
7.9. Machine code of non-spinning read loop depicted in Figure 7.8. .
7.10. Obscure implementation of a spinning read loop. . . . . . . . . .
8.1.
8.2.
8.3.
8.4.
8.5.
XII
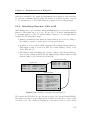
Instrumentation process in Valgrind. . . . . . . .
Example for machine code generated for x86. . . .
Example of intermediate representation (IR-code).
Instrumented IR code. . . . . . . . . . . . . . . .
Structure of 64-bit word shadow value and state
MSM-long . . . . . . . . . . . . . . . . . . . . . .
48
49
51
57
60
61
61
64
65
68
76
77
81
82
82
83
84
88
89
89
89
90
. . . . . . . . 94
. . . . . . . . 96
. . . . . . . . 97
. . . . . . . . 99
encoding for
. . . . . . . . 100
List of Figures
8.6. Structure of 64-bit word shadow value and state encoding for
MSM-short . . . . . . . . . . . . . . . . . . . . . . . . . . . . .
8.7. A conditional branch in IR. . . . . . . . . . . . . . . . . . . . .
8.8. IR branches: left side direct branch and and right side inverted
branch. . . . . . . . . . . . . . . . . . . . . . . . . . . . . . . . .
8.9. Example of spinning read loop. . . . . . . . . . . . . . . . . . .
8.10. Calling a dynamic library function. . . . . . . . . . . . . . . . .
8.11. Function call of pthread cond wait() in IR. . . . . . . . . . . . . .
8.12. Example of call to function pointer. . . . . . . . . . . . . . . . .
8.13. Example of call to function pointer - IR code. . . . . . . . . . .
8.14. IR code and the corresponding computation tree. . . . . . . . .
101
103
104
105
107
108
109
110
112
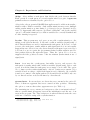
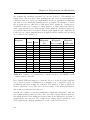
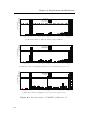
9.1. Memory consumption on PARSEC by different tools. . . . . . . 131
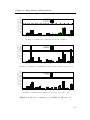
9.2. Execution time on PARSEC by different tools. . . . . . . . . . . 134
10.1. A race free program, but detectors report a false data race on DATA.137
10.2. A program demonstrates an order violation. Even if each function
is protected by a lock/unlock pair, the problem still remains. . . 138
XIII
List of Figures
XIV
List of Tables
3.1. Catching a data race on the shared variable GLOB by lockset algorithm (depicted in Figure 3.7). . . . . . . . . . . . . . . . . . .
3.2. Catching a data race on the shared variable GLOB by happensbefore analysis (depicted in Figure 3.11). . . . . . . . . . . . . .
21
24
5.1. Catching a data race on variable GLOB after two unsynchronized
accesses by MSM-long (depicted in Figure 5.2). . . . . . . . . . .
5.2. MSM-long does not report the false positive on variable GLOB
depicted in Figure 5.3. . . . . . . . . . . . . . . . . . . . . . . .
5.3. Catching a data race on variable GLOB after one unsynchronized
access by MSM-short (depicted in Figure 5.5). . . . . . . . . . .
52
6.1. Instrumentation commands for the reliable handling of interthread event notifications (condition variables). . . . . . . . . .
71
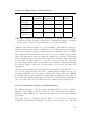
9.1. Results on the test suite data-race-test. FP and FN denote False
Positives and False Negatives, respectively. lib means interception of Pthread library and cv enables correct interception of
condition variables. . . . . . . . . . . . . . . . . . . . . . . . . .
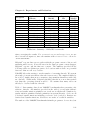
9.2. Results on the test suite data-race-test. lib means interception of
PThreads library; spin stands for spinning read detection with
the given number of basic blocks as a parameter. . . . . . . . .
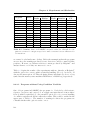
9.3. Results of Helgrind+ and other dynamic race detectors on the
test suite data-race-test. . . . . . . . . . . . . . . . . . . . . . .
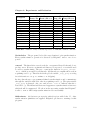
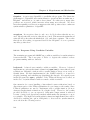
9.4. Summary of PARSEC benchmarks. . . . . . . . . . . . . . . . .
9.5. Runtime data on PARSEC executed with two threads for input
set simsmall except swaptions and streamcluster that
are for simmedium. . . . . . . . . . . . . . . . . . . . . . . . .
9.6. Number of racy contexts reported on PARSEC with two threads.
9.7. Number of racy contexts reported on PARSEC benchmarks with
four threads. . . . . . . . . . . . . . . . . . . . . . . . . . . . .
9.8. Number of potential racy contexts reported on PARSEC benchmarks with two threads. . . . . . . . . . . . . . . . . . . . . . .
43
49
117
118
119
121
122
123
127
128
XV
List of Tables
9.9. Comparing the number of potential racy contexts reported on
PARSEC benchmarks for different race detectors. All programs
are executed with two threads. . . . . . . . . . . . . . . . . . . . 129
XVI
Chapter 1.
Introduction
1.1. Motivation
In the past years, software was able to benefit from the increased CPU clock
rate. Nowadays, because of some limitations such as heat dissipation problems,
processing power is increased by integrating multiple processors into one chip,
introducing multi-core and many-core chips. Programs cannot benefit from
additional cores unless the program tasks are executed in parallel to utilize
them. But writing correct parallel programs is a difficult task. Due to the nondeterministic behavior of parallel programs, new types of defects occur that are
not easy to detect. More prevalent among them are data races that lead to
inconsistent data. A data race occurs in a multi-threaded program when two
threads access the same memory location with no ordering constraints enforced
between the accesses, and at least one of the accesses is a write [34].
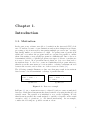
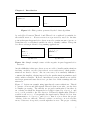
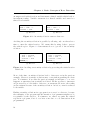
The following example illustrates a data race that may result in inconsistent
data because of non-deterministic orderings of parallel threads.
TEMP1 = X
TEMP1 = TEMP1 + 1
X = TEMP1
TEMP2 = X
TEMP2 = TEMP2 + 1
X = TEMP2
(a) Thread 1
(b) Thread 2
Figure 1.1.: Data race example.
In Figure 1.1, two concurrent accesses to a shared location X cause an undesired
data race. Each thread increments the shared variable X by using its thread local
variable TEMP. The variable X is initialized to zero at the beginning. If both
threads run in parallel, the result assigned to variable X depends on the actual
execution order of operations, i.e. the thread interleaving. As an example,
consider the following two possible execution orders:
1
Chapter 1. Introduction
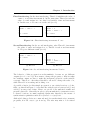
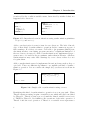
First Interleaving: In the first interleaving, Thread 1 initializes the value of
TEMP to X and then increments it. At the same time, Thread 2 reads the
value of X and assigns it to its other local variable TEMP and increments
it. In this case, X becomes one at the end (X==1).
1
2
TEMP1 = X
TEMP1 = TEMP1 + 1
3
2
3
4
5
1
TEMP2 = X
TEMP2 = TEMP2 + 1
4
X = TEMP1
5
(a) Thread 1
X = TEMP2
(b) Thread 2
Figure 1.2.: First interleaving increments X once.
Second Interleaving: In the second interleaving, after Thread 1 increments
the value of TEMP and assigns it to X, Thread 2 reads X and increments
it: We get a different result (X==2).
1
2
3
4
5
6
TEMP1 = X
TEMP1 = TEMP1 + 1
X = TEMP1
.
.
.
(a) Thread 1
1
2
3
4
5
6
.
.
.
TEMP2 = X
TEMP2 = TEMP2 + 1
X = TEMP2
(b) Thread 2
Figure 1.3.: Second interleaving increments X twice.
The behavior of this program is non-deterministic, because we get different
outputs (X==1 or X==2). If we want to change the program, so that it results
in consistent output, we have to make the increment operation on the variable
X atomic. That is, no other thread should be allowed to change the value of X,
while Thread 1 is executing and working on X.
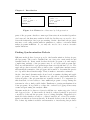
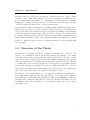
A possible solution for this simple program is to use critical sections or locks.
Only one thread in Figure 1.4 can enter the critical section between lock(l) and
unlock(l) at any point of time. Hence, we get rid of the undesired results and
prevent a data race. Generally, in order to prevent undesired concurrent accesses
to shared locations, we must explicitly synchronize threads by the means of
synchronization primitives such as lock/unlock or signal/wait.
Although locking policies are commonly used for synchronization in concurrent
programs, it is also easy to get it wrong. The user may miss to lock critical
2
Chapter 1. Introduction
l o c k (l)
TEMP = X
TEMP = TEMP + 1
X = TEMP
unlock(l)
l o c k (l)
TEMP = X
TEMP = TEMP + 1
X = TEMP
unlock(l)
(a) Thread 1
(b) Thread 2
Figure 1.4.: Elimination of data race by lock protection.
parts of the program. Another common problem arises from circular dependencies between locks that may result in deadlocks. In this case, we need tools to
detect the fault and produce a proper warning. On the other hand, the programmer may overdo using synchronization primitives to achieve correctness which
makes programs inefficient. So, we may also need tools to remove excessive
synchronizations.
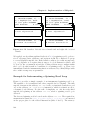
Finding Synchronization Defects
Different methods have been proposed to find synchronization defects in parallel programs. They can be classified into two categories: static methods and
dynamic methods. Static methods that check the program code and employ
compile-time analysis of the program source do not scale with program size.
They are still infeasible for programs larger than a few 10,000 lines of code. The
approach produces excessive false positives, since compile-time analysis cannot
understand the semantics of the program, and is unable to determine the precise
set of possible thread interleavings. Thus, it makes conservative estimates.
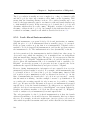
On the other hand, dynamic methods are based on runtime checking and applicable to programs of any size. But they are only able to find synchronization
defects in parts of the program that are actually executed. To compensate for
this drawback, it is necessary to have sufficient program coverage during the
test runs in order to find possible faults. Furthermore, tracing mechanisms slow
down programs. It is possible to reduce the overhead by logging all necessary
events and performing the analysis offline.
Dynamic methods for data race detection fall into two main categories: lockset
and happens-before. Lockset methods check if a shared variable is protected
correctly by locks and the program obeys a locking discipline. Happens-before
methods verify whether accesses to a shared variable are ordered by synchronization notifications between threads. Both methods have some shortcomings:
The lockset algorithm is scalable and insensitive to interleaving but produces
3
Chapter 1. Introduction
lots of false positives. This is because it considers only the lock primitives.
Comparatively, happens-before methods are sensitive to interleavings and not
scalable but produce fewer false positives.
A practical dynamic race detector must have good scalability and performance,
combined with a low false alarm rate. It should not be sensitive to thread
interleaving. Our goal in this work is to provide a practical race detector that
combines the two methods so as to get the strengths of both. We present
a new race detection approach that detects potential races, not just races that
actually occur in executions. Since modern parallel software is getting extremely
complex, a practical race detector is important and quite useful.
1.2. Problem Statement
A dynamic race detector detects synchronizations based on explicit calls of synchronization primitives in a program. The race detector examines if synchronizations are consistently used and reports any inconsistent use of synchronization or
missing synchronization as a data race. Race detection is done automatically by
instrumenting the code to intercept the synchronization primitives. Therefore,
the debugging process is simple and applicable without any change in program
code by the user. But there are many different situations where a detector is
not able to detect the correct semantics of synchronizations between threads or
may miss synchronizations. This causes detectors to produce false alarms or
miss true data races.
Currently, dynamic race detectors produce many false warnings. The user has
to examine all warnings reported by a tool in order to find the true data races.
Examining all warnings is a very time-consuming and difficult task. Most of
the time, there are only few true races in a program. Thus, the benefit of
using an automatic race detector that reduces the number of false warnings
is outweighed by manually analyzing the results. For instance, the Eraserstyle detectors based on the lockset algorithm overwhelm users with many false
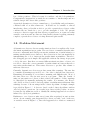
warnings because of shortcomings in the lockset algorithm. A simple example
is provided in Figure 1.5. A detector based on the lockset algorithm considers
only lock/unlock operations. As a result, it produces a false positive on DATA,
because the algorithm is not able to identify the existing happens-before relation
induced by signal/wait primitives.
Furthermore, race detectors miss races (cause false negatives) in various situations. As an example, pure happens-before detectors easily overlook the race
on variable DATA in Figure 1.6, since the happens-before relation constructed
4
Chapter 1. Introduction
wait(CV)
.
.
.
DATA--
DATA++
s i g n a l (CV)
.
.
.
(a) Thread 1
(b) Thread 2
Figure 1.5.: False positive generated by the lockset algorithm.
by unlock/lock between Thread 1 and Thread 2 is considered by mistake for
the variable DATA too. However DATA is not protected by any lock. Another
point is that pure happens-before detectors need a certain amount of access ordering history for each shared variable in order to identify conflicts. This point
becomes a serious problem for long-running applications.
DATA++
l o c k (l)
V = V + 1
unlock(l)
(a) Thread 1
l o c k (l)
V = V + 1
unlock(l)
DATA-(b) Thread 2
Figure 1.6.: Simple example causes a false negative in pure happens-before
detectors.
Another difficulty is that race detectors are not able to handle synchronizations
involving condition variables (inter-thread event notifications). Such synchronizations are hard to detect. Also in some cases, it is extremely difficult to
construct the implicit ordering imposed by the synchronization primitives used
with condition variables. However, inter-thread event notifications are widely
used in programs and cause detectors to produce lots of false warnings and even
miss races.
Figure 1.7 depicts an example using inter-thread event notifications. Thread
1 operates on DATA and then signals Thread 2 that it can take over the data
for further processing. The threads are properly synchronized, but there is
an ordering in which the happens-before relation caused by signal() and
wait() is not visible to the race detector. If Thread 1 finishes first, Thread 2
would not call wait(). Consequently, the signal sent by Thread 1 is lost. Any
instrumentation of signal() and wait() thus does not detect the proper
ordering of the two threads. Thread 2 carries on and as soon as it accesses
DATA, a data race is reported, even though there is none. The proper ordering
5
Chapter 1. Introduction
is enforced by the condition variable COND, but noticed by neither lockset nor
happens-before detectors.
DATA++
l o c k (l)
COND = 1
s i g n a l (CV)
unlock(l)
l o c k (l)
while(COND != 1)
wait(CV)
unlock(l)
DATA--
(a) Thread 1
(b) Thread 2
Figure 1.7.: Inter-thread event notifications using synchronization primitives
signal() and wait().
Ad-hoc synchronization is a major issue for race detectors. The lack of knowledge of these kind of synchronization operations leads to numerous reports of
false warnings. If a detector is aware of all ad-hoc (programmer-defined) synchronizations that occur during program execution, a significant limitation of
the race detector is removed. Ad-hoc synchronizations are implemented in program source code itself by the programmer rather than in libraries. All these
synchronizations may cause false warnings by a race detector that does not
recognize them.
Ad-hoc synchronization may be implemented in various forms, such as flags or
spin-locks. There are different algorithms to accomplish each kind of synchronization operation. Let us consider the simple flag synchronization shown in
Figure 1.8.
DATA++
.
.
.
FLAG = TRUE
(a) Thread 1
while(FLAG != TRUE){
/* do_nothing */
}
DATA-(b) Thread 2
Figure 1.8.: Simple ad-hoc synchronization using a FLAG.
Identifying this kind of synchronization operation is not an easy task. When
Thread 2 starts executing, it spins on variable FLAG, which will only be modified
by Thread 1. Thread 2 cannot proceed, until the shared variable FLAG is set
to TRUE by Thread 1. By definition, the executions of the write operation of
Thread 1 and the read operation of Thread 2 on variable FLAG represents a
6
Chapter 1. Introduction
dynamic data race. However, the purpose of this data race is only to ensure
execution order. Thus, this benign race does not constitute a concurrency bug,
if it is intentionally programmed to implement a synchronization construct.
Furthermore, a false warning is reported on the shared variable DATA, in spite
of the fact that both threads are correctly synchronized.
Finally, synchronization primitives from different unknown libraries that are not
supported by the detector cause problems. Since knowledge of all synchronization operations in a program is crucial for race detection, missing some primitives
means inaccuracy in reports and additional false positives. It is unreasonable
to assume that the detector directly supports synchronization primitives from
many different libraries. Thus, removing this limitation necessitates a general
method to make the detector aware of all synchronization operations happening
in a program.
1.3. Structure of the Thesis
This thesis is organized as follows: Chapter 2 explains the objectives. We
specify our contribution and set up the hypotheses. In Chapter 3, we define
some important terms and present theoretical background. We give a short
overview about the lockset based detection algorithm , happens-before detection
and some hybrid methods. Chapter 4 discusses past and related work. Chapter
5 contains the new race detection approach. We present our algorithm and the
new features used in our dynamic race detector. Different methods to overcome
the problems dealing with synchronization by inter-thread event notifications
and ad-hoc synchronizations are described in Chapter 6 and 7.
In Chapter 8, the implementation of our approach is discussed. Furthermore,
some important details are depicted. In Chapter 9 our approach is examined
with different benchmarks and applications, and the preliminary results are
evaluated and compared with other race detectors. In the last Chapter, we give
a summary with a short discussion of our results and the focus of our ongoing
and future work.
7
Chapter 1. Introduction
8
Chapter 2.
Objectives and Contributions
2.1. Objectives
The primary goal of this work is to present a practical and efficient race detection approach to reduce the number of false positives and false negatives
(missed races). The approach lessens the number of false alarms so that it pays
to analyze the reports. If the number of false warnings in the examined program
is small, it is feasible for developers to analyze all of them. However, the approach should not mask races. It should be automatic, easy to use and should
not require any manual source code annotations or formal specifications of the
program. The races in the program have to be reported with enough contextual
information. Providing additional information and guidelines on the suspicious
contexts along with the reported warnings makes analyzing the results easier.
2.2. Contribution
The major contribution of my work consists of three parts. The first part
is the new race detection algorithm which is adaptable to long-running and
short-running applications. We observed limitations in previous race detection methods and developed a new algorithm to overcome these limitations.
Our algorithm has been implemented as part of our new tool1 , which is called
Helgrind+ [23, 21]. The user can select the sensitivity depending on her/his
preference, or choose different levels of happens-before analysis. We examined
our method using substantial benchmark suites. We analyzed the results and
compared them with the results of other race detectors.
1
Helgrind+ is an open source tool and can be downloaded at the following address:
http://svn.ipd.uni-karlsruhe.de/trac/helgrindplus
9
Chapter 2. Objectives and Contributions
In the second part, we developed a new method for correctly handling synchronization with inter-thread event notifications automatically, without relying on
source code annotation. The method accurately establishes happens-before relations implied by condition variables, and thus eliminates almost all cases of false
alarms and missed races caused by inter-thread event notifications. We verify
our method by implementing it and evaluating it with several benchmarks.
The third part of this work presents a method to detect ad-hoc synchronizations. Identifying the synchronization operations implemented in the program
source code itself, and not as synchronization primitives in the libraries, is not
trivial. We propose a dynamic software technique that identifies these kinds
of synchronization patterns automatically. Such synchronization patterns may
happen via flag synchronization or more complex constructs such as barrier
synchronizations or spin locks. The proposed method is general and extensible
to detect synchronization primitives from unknown libraries that are not supported by the detector. We implement the method in Helgrind+ and confirm
that our dynamic technique is able to correctly find ad-hoc synchronizations,
and removes false positives without introducing additional false negatives.
2.3. Hypotheses
The ideal dynamic race detector detects all explicit and implicit synchronization
operations in order to notify the programmer of incorrect or missing synchronizations in a program. It is aware of all synchronization calls in programs and
intercepts them to provide precise reports on unsynchronized accesses which
may be a source of bugs. The following requirements are necessary to have a
precise and efficient race detection which is able to detect all different kinds of
synchronization operations in parallel programs:
1. The whole synchronization process has to take place within the synchronization operation: At the end of calling the synchronization operation, it
has to be clear to the detector whether the synchronization operation is
successfully finished or not.
2. The detector has to detect all synchronization primitive calls in a program
and must be aware of their semantics.
3. Any ad-hoc or implicit synchronization operations along with their semantics must be identified by the detector.
The first requirement relates to inter-thread event notifications: They use condition variables as a part of their synchronization. Condition variables are
10
Chapter 2. Objectives and Contributions
implemented in programmer code itself and not in the library. Consequently,
inter-thread event notifications build complex synchronization constructs that
use a part with synchronization primitives e.g. signal/wait-operations for their
event notification and another part for some kind of ad-hoc synchronization.
By intercepting synchronization primitives from libraries only, the semantics of
other part of synchronization in programmer code is missing and hidden to the
detector. So, after intercepting the synchronization primitive calls (signal/wait),
the detector does not know if the synchronization between threads has successfully terminated or not. The need of additional information about the part
in programmer code is essential for correct establishment of a happens-before
relation.
Our first hypothesis states that a detector has to be aware of the meaning of
different synchronization primitives. It has to be able to deal with all of them
by a proper algorithm to provide good results.
Hypothesis 1 By combining the lockset and happens-before analyses, it is possible to correctly handle synchronization primitives, and reduce the number
of false positives and false negatives, compared to existing race detectors.
Thus, we need to explicitly define the semantics of different synchronization
primitives for the race detector. Furthermore, we have to provide an efficient
race detection algorithm to correctly handle each specific synchronization primitive in order to have a precise race detection.
The second point deals with synchronization primitives that could be specified
within a particular library. If the functionality of all synchronization primitives
provided in the library is known to the detector, the intention and the exact
semantics of the synchronization primitive call are available.
What if synchronization primitives are unknown to the detector or come from
unsupported libraries? Then the detector is not able to intercept them. That
is, either the program is allowed to call only known synchronization primitives
provided in the supported libraries, or the detector must be able to identify
unknown primitives from unsupported libraries. Any unknown synchronization
primitives used from unsupported libraries have to be identified by a practical
race detector. Otherwise, as soon as synchronization primitives are not used
and instead of them ad-hoc or unknown synchronizations are used, the detector
misses the synchronization and produces false warnings. We set up our second
hypothesis based on the above points:
Hypothesis 2 It is possible to build a universal race detector, that is, a race
detector which is not limited to a specific set of libraries, and is able to
detect synchronization operations.
11
Chapter 2. Objectives and Contributions
We require a universal race detector to identify all synchronization operations in
the program which is crucial for a practical race detector to reduce the number
of false positives and false negatives.
12
Chapter 3.
Basic Concepts of Race
Detection
In this chapter, we first define some of the terms used later on. Then, we
describe basic algorithms used in dynamic race detection followed by a short
discussion of their limitations.
3.1. Definitions
Data Races
Data races are synchronization defects in parallel programs. A data race occurs,
when two or more threads access a shared memory location which is not protected by a proper synchronization construct (e.g., a lock/unlock), and at least
one of them writes the memory location. They are not necessarily considered
defects, since they could be intentional. Data races tend to manifest themselves
randomly and are troublesome to reproduce and remove.
Data races are caused by atomicity violations or order violations [27, 24]. We
explain them in detail in the sections below.
Atomicity Violation
An atomicity violation happens if a critical section 1 is interrupted and accessed
by more than one thread simultaneously. Atomicity violation could lead to an
inconsistent and faulty behavior of a program, which is hard to detect. An
example of an atomicity violation is provided in Figure 3.1. Two threads enter
1
A critical section is an atomic section that has to be executed only by one thread at a time.
13
Chapter 3. Basic Concepts of Race Detection
an unprotected critical section and increment a shared variable which leads to
inconsistent results. Variable COUNTER is a shared variable and TEMP is a
thread local variable.
TEMP = COUNTER
TEMP = TEMP + 1
COUNTER = TEMP
(a) Thread 1
TEMP = COUNTER
TEMP = TEMP + 1
COUNTER = TEMP
(b) Thread 2
Figure 3.1.: Atomicity violation causes a data race.
Avoiding the atomicity violation is possible by allowing only one thread at a
time to enter the critical section. We ensure this by using locks to protect
the critical region. Figure 3.2 demonstrates how to get rid of the atomicity
violation.
l o c k (l)
TEMP = COUNTER
TEMP = TEMP + 1
COUNTER = TEMP
unlock(l)
l o c k (l)
TEMP = COUNTER
TEMP = TEMP + 1
COUNTER = TEMP
unlock(l)
(a) Thread 1
(b) Thread 2
Figure 3.2.: Avoiding an atomicity violation by protecting the critical section
with locks.
Most of the time, atomicity violations lead to data races as in the previous
example. However, atomicity violations may occur without resulting in a data
race. For instance, if we alter the previous example as in Figure 3.3, no race
happens on COUNTER, but atomicity is violated. All the accesses to COUNTER
are protected by a lock with no data race on COUNTER. However, the results
are inconsistent because of the atomicity violation. As before, TEMP is a thread
local variable.
Finding atomicity violations in a program is not easy for a detector, because
the semantics of the program and the intention of programmers might not be
recognizable by the detector. For instance, we cannot recognize the critical
regions in a program, if we do not have some clue or code annotations from
programmers.
14
Chapter 3. Basic Concepts of Race Detection
l o c k (l)
TEMP = COUNTER
unlock(l)
l o c k (l)
TEMP = COUNTER
unlock(l)
TEMP = TEMP + 1
TEMP = TEMP + 1
l o c k (l)
COUNTER = TEMP
unlock(l)
l o c k (l)
COUNTER = TEMP
unlock(l)
(a) Thread 1
(b) Thread 2
Figure 3.3.: Atomicity violation within the critical section. But it does not
effect a data race.
Order Violation
Order violations happen if program blocks are not executed in the order the
programmer expected. Applying a suitable synchronization construct enforces
the correct order of execution between the program blocks. Since the developer’s
intention is not recognizable from the program itself, detecting order violation
automatically is difficult. The only possibility is to detect the resulting data
race caused by order violations.
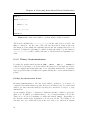
The following program depicts an example of order violation. The main thread
creates two different threads; the first thread for initializing the data and the
second thread for processing the data. The correct interleaving is that the
first thread initializes DATA before any other thread uses it. But in the actual
execution there is no guarantee of the correct interleaving and the second thread
may process DATA before it is initialized, resulting in a data race on DATA.
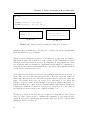
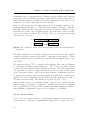
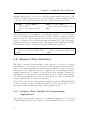
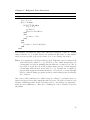
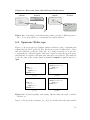
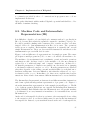
3.2. Data Race Classifications
Race detectors indicate important hints that are quite helpful to locate a large
set of concurrency bugs. We have to distinguish between different categories of
data races, and show only the problematic and harmful data races to developers
to avoid overwhelming them with too many warnings. We categorize data races
as shown in Figure 3.5 and explain them below.
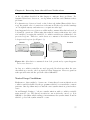
Apparent data races happen, if synchronization is present and the detector
doesn’t recognize it [40, 44]. The result is false warning. Apparent races may
also occur, if the program is switched to a new library and uses synchronization
15
Chapter 3. Basic Concepts of Race Detection
int DATA;
main()
{
c r e a t e (&thread_1, &init_data);
c r e a t e (&thread_2, &process_data);
}
void init_data()
{
DATA = 1;
}
(a) Thread 1
void process_data()
{
assert( DATA == 1 );
do_something(DATA);
}
(b) Thread 2
Figure 3.4.: Order violation results in a data race on DATA.
primitives that are unknown to the detector, or when some ad-hoc synchronizations are defined by a programmer.
When a real race happens, accesses to a given storage location are not synchronized and at least one of them is a write operation. We differentiate between
intentional and non-intentional races. For instance, in some situations a data
race is intentionally programmed to implement synchronization constructs (e.g.
barriers) and introduce nondeterminism into a program. These intentional races
are known as synchronization races.
Non-intentional races are not known to programmers and they are not aware of
them. The true races are non-intentional races. However, there are situations
where true data races do not effect the program behavior and don’t cause any
fault. We classify these races as benign races, since they do not affect the
behavior of the program. As an example, if we want to display the status of a
parallel calculation to a user, it is not an issue whether the displayed values are
completely consistent. Contrary to benign races, harmful races could cause an
inconsistent program behavior and counted as faulty code.
Ideally, race detectors should only report data races that fall into the harmful
category. Since detectors try to estimate the semantics of a program at best,
apparent data races, intentional and benign data races lead to various false
alarms produced by detectors.
16
Chapter 3. Basic Concepts of Race Detection
Figure 3.5.: Classification of data races.
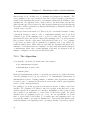
3.3. Synchronization
A program protects accesses to data by synchronization, avoiding inconsistent
program states. The synchronization is guaranteed by providing mutual exclusion or temporal ordering of accesses.
Locks implement the principle of mutual exclusion (mutex ), and assure the
atomicity of critical regions. A lock can be attained by one thread at a time.
If another thread likewise wants to attain this lock, it will be blocked until the
first thread releases the lock.
In this way, locks can protect shared data well, but one should pay attention
that the locking discipline is not violated. This means that the same data has
to be protected by the same lock(s). In Section 3.4.1, we describe the lockset
algorithm that is able to check a program if a reliable locking discipline exists.
Additionally, threads could be synchronized by a partial temporal ordering by
using synchronization operations such as inter-thread event notifications (condition variables), barriers or fork/join. Thus, a thread could be divided into
subsequent segments, called thread segments (see 3.4.2.1). All accesses within a
thread segment happen before, after or parallel to all other accesses of another
thread segment.
A barrier is aimed for a group of threads that have to wait until all threads
in the group arrive at the barrier boundary. Accesses happenning before the
barrier happen before any access after the barrier.
17
Chapter 3. Basic Concepts of Race Detection
When creating a new thread by a fork operation, there is already an implicit
temporal ordering between parent and child thread that allows the parent to
deliver data to the child without any problem. By joining, a thread waits for
the termination of another thread.
By using inter-thread event notifications via condition variables for the synchronization, threads wait for an arbitrary condition to be fulfilled. If the condition
does not come true, the thread will be blocked. As soon as a thread affects the
condition, it wakes up the waiting thread. This could be interpreted as sending
a signal by a thread to the waiting thread. All the accesses happen by signaling thread before sending the signal, are temporally before all the accesses of
waiting thread happen after receiving the signal.
In fact, condition variables cause some influential problems for race detectors –
we will discuss them detailed in Section 6.
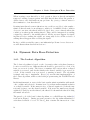
3.4. Dynamic Data Race Detection
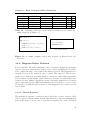
3.4.1. The Lockset Algorithm
The lockset algorithm is based on the observation that each shared memory
location accessed by two different threads should be protected by a lock, if at
least one access is a write. The detector examines all locations where a shared
variable is accessed, and checks whether the shared variable is protected by
a lock. If the variable is not protected, a warning is issued. The algorithm
is simple and easy to implement. Eraser [42] was the first implementation of
the lockset algorithm, which worked with programs using the POSIX-Threads
library.
In this implementation, mutex is the basic synchronization primitive with methods to acquire and release it. A mutex is an object that ensures mutual exclusion
on a shared variable. If the mutex is free, a thread acquires it (locks the mutex) and begins to use the shared variable. If however the mutex was already
acquired (locked) by another thread, the thread blocks until the thread holding
the mutex releases it.
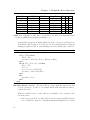
The pseudo code of the basic lockset algorithm or so-called Eraser algorithm [42]
is shown in Figure 1. During program execution, the algorithm maintains for
each shared variable d a set of locks Cd that contains the intersection of the
18
Chapter 3. Basic Concepts of Race Detection
sets of locks that were held during all accesses to variable d. The details of the
algorithm appear in [42].
Let Lt be the set of locks held by thread t.
foreach variable d do
initialize Cd to the set of all locks
end
On each access to d by thread t
set Cd ← Cd ∩ Lt
if Cd = ∅ then
issue warning
end
end
Algorithm 1: Basic lockset algorithm.
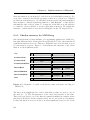
The main drawback of the Eraser algorithm is that it produces too many false
alarms, because it can only process lock operations, and fails when other synchronization primitives or ad-hoc synchronizations are used. For example, numeric algorithms often consist of several steps separated by barriers. If memory
accesses by two separate steps overlap, Eraser would falsely report races, even
though they are prevented by the barriers. An algorithm based on the happensbefore analysis would not report any false positives in this situation.
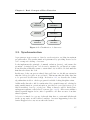
A single write operation followed by read-only accesses is a frequent case which
lockset detectors must handle. Consider a shared variable that is written once
by a main thread and subsequently read by worker threads. It appears that no
lock is needed. However, a pure lockset detector would report a race in this case.
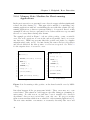
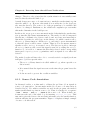
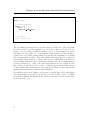
To handle this situation, Eraser uses the state machine in Figure 3.6. The idea
is to defer error reports until a second thread performs a write operation, and
reaches the Shared-Modified state in the diagram. After allocation, the memory
location is in the state New. During the first write, it enters state Exclusive and
leaves this state only if another thread reads or writes the memory location.
An error is reported if the state Shared-Modified is reached and the lockset is
empty.
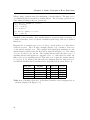
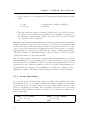
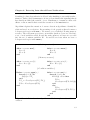
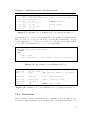
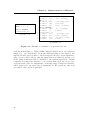
The example provided in Figure 3.7 includes a data race on the shared variable
GLOB. Table 3.1 demonstrates stepwise a possible execution order. It shows how
the data race is caught by the lockset algorithm based on the state machine. The
race is reported in the state Shared-Modified because of the empty lockset.
However, the state machine in Figure 3.6 may mask a race and produce false
negatives. The program listed in Figure 3.8 contains a simple undetected data
race between main and worker threads. The main thread may write the variable
19
Chapter 3. Basic Concepts of Race Detection
R/W, first thread
Exclusive
W, new thread
first access
R, new
thread
New
Shared-Modified
W, any thread
Shared-Read
R, any thread
Figure 3.6.: Possible states for a memory location in the basic lockset
algorithm.
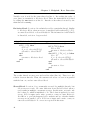
1
int GLOB = 0;
2
3
4
5
int main()
{
c r e a t e (threadid, worker);
12
13
14
15
6
GLOB = 1;
printf(GLOB);
7
8
16
17
11
j o i n (threadid, NULL);
}
return NULL;
18
9
10
void worker()
{
l o c k (l);
GLOB++;
unlock(l);
19
}
(b) worker thread
(a) main thread
Figure 3.7.: Detecting a data race on the shared variable GLOB by lockset
algorithm.
before the worker thread can read it. In this case, the state machine ends
up in state Shared-Read without issuing a warning. With the opposite order
of execution, Eraser would report a race. The basic problem is that there is
no synchronization between main and worker threads. As there is no happensbefore relation between the main and worker threads regarding the read/write
operations, a pure happens-before detector would detect the masked race. This
kind of false negatives also exists in other race detectors based on the Eraser
state diagram [19, 49].
GLOB
We developed an new algorithm and extended the state machine such that
it handles the above and similar cases correctly. More details are given in
Chapter 3.4.
20
Chapter 3. Basic Concepts of Race Detection
Line No.
main(): 1
main(): 7
main(): 8
worker(): 15
worker(): 15
GLOB
Initialization
Write
Read
Read
Write
Old State
New
Exclusive
Exclusive
Shared-Read
New State
New
Exclusive
Exclusive
Shared-Read
Shared-Modified
Lt
{}
{}
{}
{l}
{l}
Cd
{l}
{}
{}
{}
{}
Table 3.1.: Catching a data race on the shared variable GLOB by lockset algorithm (depicted in Figure 3.7).
int GLOB = 0;
int main()
{
c r e a t e (threadid, worker);
GLOB = 1;
j o i n (threadid, NULL);
}
void worker()
{
printf(GLOB);
return NULL;
}
(b) worker thread
(a) main thread
Figure 3.8.: A simple example causes false negative in Eraser-based race
detectors.
3.4.2. Happens-Before Relation
It is very useful to know the actual time order of events in a parallel program during race detection. Many false positives of the lockset algorithm are avoidable,
if we consider the time order between the shared accesses. The happens-before
analysis is based on the temporal order of events. The temporal order in a program can be derived from synchronization operations, and results in happensbefore relation. By the means of this relation, we describe the partial time order
between accesses within a parallel program. Generally, happen-before relation
can be represented by two different techniques: thread segments or vector clocks.
We use the acronym hb-relation instead of the happens-before relation for the
rest of thesis.
3.4.2.1. Thread Segments
The instruction sequence of a thread can be sliced into a series of pieces, called
thread segments. Synchronization with other threads (or thread segments) happens at the start or at the end of each thread segment. Of course, all thread
21
Chapter 3. Basic Concepts of Race Detection
segments belong to a specific thread. Within a thread segment, all operations
are totally ordered. The thread segments of each thread are also totally ordered.
Synchronization defines a partial order of thread segments. If two thread segments are not ordered, they may execute in parallel.
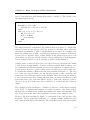
Figure 3.9 shows the thread segment diagram of a potential execution of the
program depicted in Figure 1.7. Thread 1 sends a signal to Thread 2. Thus the
first part of Thread 1 T S1 happens before the second part of Thread 2, T S2 .
Both Thread 1 and 2 are accessing variable DATA. Because of the ordering,
there is a hb-relation between T S1 and T S2 . They are correctly synchronized
and there is no race here.
Thread 1
DATA++
TS1´
TS1
signal
wait
Thread 2
TS2
TS2´
DATA--
Figure 3.9.: A thread consists of thread segments separated by synchronization
operations.
For further discussion, it is useful to define a concise notation for the ordering
hb
of thread segments. Lamport’s hb-relation →expresses exactly this [25]. When
a thread segment T S1 is executed before another thread segment T S2 , we say
hb
T S1 →T S2 .
hb
We define the relation → to be reflexive and transitive. The relation is defined
hb
to be reflexive regarding thread segments, i.e. T S1 → T S1 is possible. This is
because execution within a thread segment is strictly ordered and throughout
our algorithm, we always compare the present point of execution with a past
point of execution which could be in the same segment. Transitivity allows us
to traverse through the thread segment graph and check if two segments are
parallel: Two thread segments T S1 and T S2 are parallel iff there is no path of
hb
→-relations between them. This situation is denoted as T S1 || T S2 .
Based on this relation, a potential race has occurred, if we observe that two
distinct events are parallel. Compared to lockset-based detection, happensbefore analysis has a lower rate of false positives, but causes significant overhead,
and is difficult to implement. Moreover, it is sensitive to scheduling.
3.4.2.2. Vector Clocks
Vector clocks are another method to represent the happens-before relation. It
is easier and more efficient to implement the happens-before relation by vector
22
Chapter 3. Basic Concepts of Race Detection
clocks. They are based on Lamport clock [25], and assign for each event a global
unique time stamp. We used also vector clocks for the implementation of the
hb-relation in Helgrind+ . However for the sake of simplicity, we indicate the
hb-relation by thread segments, when presenting our concept and algorithms.
For each thread a logical local time is defined. The logical time is a counter
which is incremented by each important event (i.e. synchronization events).
The vector clock defines a logical global time and consists of local time of all
threads together. That is, a vector clock V is a complete defined function
V : T hreads → N.
The hb-relation is defined by vector clocks as the following:
hb
V → W :⇔ ∀u ∈ T hreads : V (u) ≤ W (u)
Each Thread t holds its current time vector Vt . Vt (t) gives the logical local time
of the thread, and Vt (u) indicates the most recent local time of thread u which
is known to thread t. At the beginning, each thread has no information about
the local time of other threads, while its own current local time is initialized to
1. For this reason, the function newV C is defined to produce the initial value
of time vectors for thread t:
newV C(t) := u →
1
u=t
0 otherwise
When a synchronization happens, the vector clock of the threads is updated.
Therefore, we define the two basic operations join(V, W ) and tick(V, t) on vector
clocks:
V (t) + 1
u=t
tick(V, t) := u →
V (u)
otherwise
join(V, W ) := u → max(V (u), W (u))
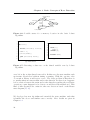
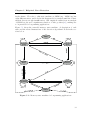
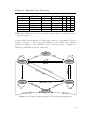
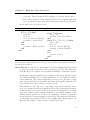
For instance, if fork/join happens as shown in Figure 3.10, when a thread creates
another thread, the created thread inherits the time vector of parent thread.
Figure 3.10.: Happens-before relations caused by fork/join operations.
23
Chapter 3. Basic Concepts of Race Detection
When joining, a thread waits for terminating of another thread. The time vector
of terminating thread is taken by waiting thread. The following operations are
done when executing fork/join operations:
bef ore T hread t c r e a t e (u) executes:
Vu ← newV C(u)
Vu ← join(Vt , Vu )
Vt ← tick(Vt , t)
af ter T hread t j o i n (u) executes:
Vt ← join(Vu , Vt )
Similarly, when executing other synchronization operations such as barriers or
condition variables, vector clocks are calculated by the help of the above defined
functions.
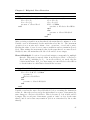
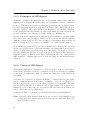
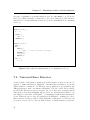
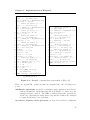
Happens-before analysis uses vector clocks to check if there is a hb-relation
between accesses. The following example (Figure 3.11) contains a data race
on the shared variable GLOB. The example uses signal/wait primitives for the
synchronization which cause the hb-relation depicted in Figure 3.12. The values
of vector clocks are also shown. The waiting thread takes the time vector of
signaling threads and update its own time vector. So, this relation is valid: the
hb
time vector before signaling thread →the time vector after the waiting thread,
i.e. (1, 0) ≤ (1, 1). At the point where the race happens (line 16), time vectors do
not indicate any hb-relation and threads are in parallel (as shown in Table 3.2).
Line No.
main(): 1
main(): 8
worker(): 29
main(): 16
main(): 17
GLOB
Initialization
Write
Write
Write
Read
hb
→
yes
no
no
VT hread1
(1,0)
(2,0)
(2,0)
(2,0)
(2,0)
VT hread2
(0,1)
(0,1)
(1,1)
(1,1)
(1,1)
Table 3.2.: Catching a data race on the shared variable GLOB by happens-before
analysis (depicted in Figure 3.11).
24
Chapter 3. Basic Concepts of Race Detection
1
2
int GLOB = 0;
int COND = 0;
3
4
5
6
int main()
{
c r e a t e (threadid, worker);
21
22
7
23
GLOB = 1;
sleep(2000);
8
9
24
25
10
26
l o c k (l);
COND++;
s i g n a l (cv);
unlock(l);
11
12
13
14
27
void worker()
{
l o c k (l);
while(COND !=1){
wait(cv);
}
unlock(l);
28
GLOB = 2;
29
30
15
return NULL;
31
GLOB = 3;
printf(GLOB);
16
17
32
}
(b) Thread 2
18
j o i n (threadid, NULL);
19
20
}
(a) Thread 1
Figure 3.11.: Detecting a data race on the shared variable GLOB by happensbefore analysis.
Figure 3.12.: Happens-before relations caused by signal/wait operations.
25
Chapter 3. Basic Concepts of Race Detection
26
Chapter 4.
Related Work
In this chapter, we provide an overview about the previous work in the area of
race detection techniques in parallel programs. There is a substantial amount of
prior work regarding detection of potential data races. Proposed solutions can be
roughly classified as static (ahead-of-time) and dynamic (on-the-fly) analyses.
We present and discuss the advantages and disadvantages of these methods.
Finally, we talk about some further techniques for race detection e.g. software
transactional memory.
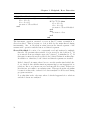
4.1. Static Analysis
Static analysis considers the entire program and warns about possible races
caused by all possible execution orders [14]. The main drawback of this approach is that it produces many false positives, as static analysis conservatively
considers all potential thread interleavings, even those that are not feasible. Another issue is that static analysis does not scale well to large programs due to
state space and path explosion problems [10]. Furthermore, static analysis has
problems with dynamically allocated data, since it has no information about it.
Detecting all feasible data races by static analysis is known to be an NP-hard
problem [34]. For this reasons, most current static race detectors (e.g. [34]) focus
on identifying a subset of data races.
Some static techniques are based on strong type-checking and assume that welltyped programs are guaranteed to be free of data races [16, 5]. They introduce
a new static type system for multi-threaded programs to prevent data races. In
fact, the new type system allows programmers to specify the locking discipline
in their programs in the form of type declarations. They use ownership types
to prevent data races. Ownership types provide a statically enforceable way of
specifying object encapsulation. This method is limited to a specific language
27
Chapter 4. Related Work
and requires type annotations, either inferred by the type systems or manually
annotated by programmers.
Compilers widely use control flow and data flow analyses to optimize programs.
Both of these techniques are also applicable to race detection during static
analysis. Data flow analysis identifies program invariants at each program point
by propagating information along control flow paths. The control flow graph for
parallel programs is the combination of the control flow graphs of the individual
tasks. For parallel programming models with shared memory, every instruction
of an arbitrary task can be a direct successive control flow block for a given
instruction. This could lead to path explosion in the graph; flow analysis would
take a long time [8]. Reducing the number of paths in the parallel control flow
graph is done by identifying synchronization constructs that prevent parallel
execution and remove some infeasible edges between the tasks.
The lockset algorithm is also used in a static tool called RacerX [14]. It uses
flow sensitive, inter-procedural analysis to detect race conditions. It checks
information such as which locks protect which operations, which code contexts
are multi-threaded, and which shared accesses are malicious. RacerX examines
system-specific locking functions by extracting a control-flow graph from the
system, which is used for further analysis to find races. The tool has performance
problems and lacks a reasonable pointer analysis. It has only simple function
pointer resolution.
4.2. Model Checking
Another static analysis method is model checking. Model checking is used to
statically verify program properties specified in temporal logic. The timing
behavior of a concurrent program is expressed in temporal logic to find concurrency bugs. For instance, Java PathFinder (JPF) [20] is able to find violations
of any assertions written in Java, such as race conditions. Generally, model
checking does not scale well, and without appropriate abstractions even JPF is
only applicable to programs smaller than 10000 lines of code (10 KLOC). This
is because of the state-space explosion, as in other static methods.
In addition to the state explosion problem, model checking suffers from high
initial overhead due to the need for annotations. Thus, having an algorithm
that extracts all needed information for analysis directly form the source code
is more desirable.
28
Chapter 4. Related Work
4.3. Dynamic Analysis
Dynamic analysis scales better and reports fewer false positives compared to
static analysis. However, it detects races only in actual executions. Consequently, the program has to be tested with various inputs to cover different
execution paths and interleavings. There are two different methods used by dynamic race detectors: on-the fly and post-mortem. On-the-fly methods record
and analyze information as efficiently as possible during program execution.
Post-mortem methods record events during program execution and analyze them
later. All dynamic methods add overhead at runtime, which must be traded off
against detection accuracy.
Prior dynamic race detectors are based on two different techniques: lockset or
happens-before analysis. Lockset analysis checks whether two threads accessing a shared memory location hold a common lock. If this is not the case, the
concurrent access is considered a potential data race [42, 48, 35]. The technique
is simple and was introduced for the first time in Eraser [42]. The lockset algorithm can be implemented with low overhead and is relatively insensitive to
execution order. The main drawback of a pure lockset-based detector is that
it produces many false alarms due to the fact that it ignores synchronization
primitives other than locks, such as signal/wait, fork/join, and barriers.
Dynamic detectors [48, 35] use escape analysis to determine if variables are used
by only a single thread. They filter out these variables and non data race
statements to reduce the runtime overhead. In addition, they detect data races
at object level instead of at the level of each memory location. Object-oriented
languages such as Java allow users to restrict access to structures at compiletime. They have extended the ownership model of Eraser such that a transfer
of ownership is allowed once for every object. They carry out the expensive
lockset operations only for the shared objects. However, it is difficult to apply
dynamic escape analysis to languages that can access any memory location
through pointers, such as C/C++.
Happens-before detectors [47, 9, 6] are based on Lamport’s happens-before relation [25]. Happens-before analysis uses program statement order and synchronization events to establish a partial temporal ordering of program statements.
A potential race is detected if two threads access a shared memory location and
the accesses are temporally unordered. The happens-before technique can be
applied to all synchronization primitives, including signal/wait, fork/join, barriers, and others. It does not report false positives in the absence of real data
races. However, this approach may miss races, i.e. produce false negatives, as it
is sensitive to the order of execution and depends on whether or not the scheduler generates a harmful schedule. In fact, happens-before detection produces
29
Chapter 4. Related Work
more false negatives than lockset-based detection [36]. Happens-before analysis
is also difficult to implement efficiently and does not scale well.
Combining the happens-before analysis with lockset analysis results in a hybrid
solution with a trade-off between accuracy and runtime overhead. Recent race
detectors [36, 19, 41, 49, 39, 45] have combined happens-before and locksetbased techniques to get the advantages of both approaches. The combination
was originally suggested by Dinning and Schonberg [12]. However, combined
approaches, which are referenced above, still produce many false positives and
miss races. Additionally, they are limited to a particular library and support
only a subset of synchronization primitives.
Hybrid detectors extend the Eraser algorithm by using happens-before analysis. The constructs fork/join and an elementary interception of signal/wait on
condition variables are regarded to establish hb-relations. Unlike our approach,
they use signal/wait directly to establish hb-relations, which is not valid in cases
with lost signals and spurious wake ups for condition variables. In cases of lost
signals, they don’t construct hb-relations and for spurious wake ups, they create
false hb-relations. Visual Thread and Helgrind [19, 45] build hb-relations only
on fork/join operations. They consider memory locations that are limited to
non-overlapping thread segments as exclusive even if they are shared, and not
accessed by a single thread.
A few publications [49, 39] use techniques for adaptive granularity and apply
variable size detection units. Choosing a small detection unit might result in
higher overhead, while choosing a large one might lead to false positives. RaceTrack [49] switches the object to field granularity during race detection. It starts
with object level race detection and automatically refines its algorithm to fieldlevel detection, when a potential race is detected. Generally, object-size granularity has limitations such as performance considerations and it suffers from the
inability to correctly detect object boundaries.
Most of the detectors above use vector clocks for the happens-before analysis
to track the order of events. Using vector clocks to track hb-relations requires
history information. Vector clocks are easier to implement compared to thread
segments. The approaches in [19, 45] use thread segment, and need less memory.
They work for synchronization primitives other than fork/join, too.
Dynamic race detectors differ in how they monitor program execution. Many
detectors [42, 19, 45, 47] use binary instrumentation. They record load/store
instructions, references to shared-memory locations and synchronization primitives from binary files and instrument them. The race detector Helgrind+ implemented in this work falls into this category. Other race detectors [49, 36, 9] work
30
Chapter 4. Related Work
with the bytecodes of object-oriented programming languages, making them independent of programming language and source code. Some race detectors
such as MultiRace [39] modify the source code in order to instrument memory accesses and synchronization instructions. The Intel Thread Checker [41]
instruments either source code or binary code of the program.
Our dynamic detection approach is also based on the lockset algorithm and
happens-before analysis, but the heuristics employed and the combination of
these methods differentiate our detector from other approaches. We propose
two new memory state models that are optimized for short-running and longrunning programs [23, 21]. Compared to the simple memory state models presented in previous papers [49, 39, 36, 45, 41, 19], our models take full advantage
of happens-before analysis and the accurate detection of happens-before relations.
Furthermore, the above mentioned detectors [49, 39, 36, 45, 41, 19] produce a
lot of false warnings and even miss races. This is because the ordering induced
by inter-thread event notifications and ad-hoc synchronizations are not taken
into account. Basically, they suffer from two serious limitations: (a) they are
not able to detect ad-hoc synchronizations implemented in user code; (b) the
detectors are restricted to synchronization primitives of a specific library,– synchronization primitives from other libraries are ignored. Thus, they are not able
to produce accurate reports, and applying these detectors to real applications
overwhelms the user with too many false alarms. Our work removes these limitations by introducing a general approach for detecting ad-hoc synchronizations
and unknown synchronization primitives. We are able to eliminate false positives including benign synchronization races and possible false negatives caused
by missed or incorrect synchronizations.
Tian et al [44] used a dynamic technique to identify synchronization operations.
The technique is able to partially suppress false positives caused by apparent
races and benign synchronization races. It is based on the actual spinning
reads, which may occur at runtime, and sets a threshold value for the number
of spinning reads to identify them during execution. The value of the threshold
is set heuristically (they set the number of spin reads to three). If the spinning
read does not happen, the detector will not construct a hb-relation and miss the
synchronization. This could happen when using condition variables or ad-hoc
synchronization that causes false alarms. Furthermore, the method could, by
mistake, identify ordinary loops in the program as spinning reads and interpret
them as synchronization operations. This may lead to misinterpretation and
creating false synchronizations by the detector causing false negatives (missed
races).
31
Chapter 4. Related Work
By contrast, our dynamic method for spinning read detection is general and
could be used as a complete race detection approach in a race detector. It
exploits the semantics and dynamic information of program code to identify
ad-hoc synchronizations along with different synchronization operations. The
resulting race detector is a universal happens-before race detector. Compared
to other happens-before race detectors such as DRD 3.4.1 [47], this method also
induces happens-before edges when using ad-hoc synchronization or unknown
synchronization primitives, resulting in substantial accuracy.
Recently, FastTrack [15] introduced a technique to implement vector clocks in
a lightweight manner. The technique replaces heavyweight vector clocks with
an adaptive lightweight representation. It requires constant space and supports
constant-time operations for some operations of the target program. The new
representation of vector clocks improves time and space performance during
happens-before analysis. Also, another technique introduced by Goldilocks [13]
tries to make precise the lockset algorithm by defining new lockset update rules.
The new lockset update rules allow a variable’s locksets to grow during the
execution. In fact, the lockset of a variable may be modified even without
the variable being accessed. This technique helps to deal with different cases
such as shared data protected by different locks at different points in time, and
data protected indirectly by locks on container objects. Both of the introduced
techniques can be used by our hybrid race detection algorithm, which could
improve the performance of the happens-before analysis and the precision of
the lockset algorithm.
4.4. Post-mortem
Post-mortem methods log events during program execution and analyze them
after program execution. They are unsuitable for long-running applications,
specially if they interact with their environment extensively. While post-mortem
analyses can affect performance less than dynamic analyses, they suffer from the
same limitation as dynamic techniques, in that they can only find errors along
executed paths. Some Post-mortem techniques combine static and dynamic
techniques. They collect information at compile time and then analyze the
re-execution of the program based on the collected information.
For instance, a system which uses post-mortem techniques for debugging of nondeterministic parallel programs is RecPlay [40]. It records only critical events
and then replays them. That is, it records only synchronization operations, and
checks for data races using happens-before analysis during a replayed execution.
Recplay uses a classical logical vector clock for detecting concurrent accesses.
32
Chapter 4. Related Work
It is more suitable for programming languages with unconstrained life time and
access to shared variables.
Another record/replay tool is Déjà Vu for Java programs, which was presented
by Choi and Srinivasan [7]. It provides deterministic replay of a program’s execution. It introduces the concept of logical thread schedule, that is, a sequence
of intervals of critical events. Each interval corresponds to the critical and
non-critical events executed consecutively in a specific thread. Déjà Vu records
only critical events, namely all synchronization events and the shared variable
accesses, by capturing logical thread schedule intervals. At replay time, Déjà
Vu reads the thread schedule information from a file created at the end of the
recording.
Déjà Vu can only deterministically replay the non-deterministic execution behavior due to thread and related concurrent constructs such as synchronization
primitives. However, other events such as input/outputs, window events, and
system calls have not been taken into account. This is because replaying a
faithful execution requires recording as many non-deterministic events as possible and sometimes may be infeasible and incur intolerable overhead during the
recording phase.
4.5. Software Transactional Memory
Software Transactional memory (STM) has been proposed to simplify parallel
programming by removing the need for explicit locks [20]. The idea is to use
transactions for accessing shared data structures and to use roll backs in case
of conflicts. A transaction is a sequence of operations that either commits
completely or has no effect. In fact, STM provides an alternate concurrency
control mechanism by supporting atomic and isolated execution of programmerspecified tasks. The main limitation with STM is that some operations are not
reversible as in database systems. A software transaction could contain I/Ooperations which are not retreatable. Another problem is the lack of a mature
programming language for STM.
4.6. Hardware Transactional Memory
All of the race detection approaches discussed above are software-based. Usually
data race detection is done entirely in software. Recently, RaceTM [18] presents
a approach to data race detection by hardware transactional memory. There are
33
Chapter 4. Related Work
few hardware-assisted dynamic race detection mechanisms such as HARD [50]
that use lockset-based hardware-assisted race detection and are faster. But
they require also specialized hardware, which is not cost-effective. RaceTM
leverages transactional memory hardware to perform efficient dynamic data race
detection. It demonstrates how the ordinary multicore hardware that supports
code with transactional critical sections can be used for detecting data races in
an entire program, while avoiding the costs of building specialized hardware.
34
Chapter 5.
Helgrind+ Race Detection
The race detection approach in Helgrind+ is a new hybrid approach that exploits the advantages of combining happens-before analysis and the lockset algorithm to get more accurate results. The presented algorithm overcomes the
observed limitations in earlier dynamic tools and proposes two new memory
state models which are optimized for long-running and short-running applications. It takes advantage of more detailed state machines and high accuracy in
detecting happens-before relations. We describe our approach in detail in the
following sections. In the upcoming chapters, we extend our algorithm for the
primitives of inter-thread event notifications(signal/wait). Then, we complete
the algorithm by presenting a method for detecting programmer-defined ad-hoc
synchronizations.
5.1. The Algorithm
Our detection algorithm combines the happens-before analysis and the lockset
algorithm in a novel and efficient way. Basically, both lockset and happensbefore analyses are performed. The lockset algorithm is a reliable method to
detect correct synchronization using critical sections. However, it ignores the hbrelations caused by lock primitives between locking and unlocking of a critical
section. This is similar to previous hybrid race detectors [49, 39, 36]. The
happens-before relations derived from other synchronization primitives are taken
as usual.
The algorithm takes synchronization primitives into account. Compared to
other detectors [49, 39, 36], which consider only a subset of synchronization
primitives, we are able to handle all common synchronization primitives. The
algorithm can be implemented for synchronization primitives provided in any
library. In general, our algorithm considers the points below:
35
Chapter 5. Helgrind+ Race Detection
1. The program to be tested uses the following typical synchronization primitives:
• locks
• signal/wait (condition variables)
• fork/join
• barriers
2. Throughout the program, each shared variable can be protected by different types of the aforementioned primitives. For example, a variable X at
the beginning of the program could be protected by a lock, whereas later
on, a barrier could be employed.
Helgrind+ uses dynamic instrumentation to track program execution. It instruments and monitors every access to memory. To detect races, each variable has
an associated state. This state indicates whether the variable is shared or exclusively accessed and which thread segments access it. Every access to a variable
is instrumented to track the associated state according to a finite state machine.
This state machine is a fundamental part of the race detector. Section 5.2 gives
detailed information on the state machine.
The following subsections describe in detail which synchronization operations
are instrumented for our algorithm, and how the current state of the program
and its threads are maintained. Firstly, we talk about instrumentation of lock
operations for the lockset algorithm. Secondly, we describe instrumentation for
the happens-before analysis of other primitives, and lastly, we complete our algorithm and combine both methods by presenting the memory state machines.
5.1.1. Lock Operations
Lock operations are handled by the lockset algorithm. We explained the lockset
algorithm in Section 3.4.1, which examines if a shared variable is consistently
protected by locks. For this reason, we need to know which locks are being
held by each thread at any time. The locks held by Thread t are stored in the
lockset Lt . When Thread t acquires or releases a lock, we have to update Lt in
the following way:
After t executes lock(l):
Lt ← Lt ∪ {l}
end
36
After t executes unlock(l):
Lt ← Lt \{l}
end
Chapter 5. Helgrind+ Race Detection
By executing the primitives lock(l), l is added to the lockset Lt . Similarly by
executing unlock(l), l is removed from Lt . In this way, we track the lockset of
each thread, and make use of them later on in the algorithm.
5.1.2. Happens-Before Analysis
For the happens-before analysis, the algorithm maintains thread segments and
the hb-relations between them. For convenience, we describe the algorithm
using thread segment identifiers (T St ). A notation similar to T St could be used
for vector clock values. We define the function N ewSegment(T S1 , T S2 , ..., T Sn )
that performs the following actions: It returns a new thread segment T Snew and
hb
adds new hb-relations such that ∀i : T Si → T Snew . At any point in time, each
thread t is in one of the thread segments. The current thread segment of thread
t is called T St . When a thread executes a synchronization primitive, the current
thread segment ends and a new one is created.
f ork() / join() are used for creation and termination of threads. When a thread
t creates a new thread u, everything u does happens after t’s past operations.
Thread u cannot hold any locks at that moment, so Lu is set to empty.
Before t executes fork(u):
Lu ← ∅
T Su ← N ewSegment(T Su , T St )
T St ← N ewSegment(T St )
end
After t executes join (u):
foreach shared variable d do
Sd ← Sd \{u}
if Sd is singleton then
reset d to exclusive state
end
end
T St ← N ewSegment(T St )
end
When thread t calls join(u), it will wait for thread u to terminate. Everything
thread u has done happens before any operation t will do after joining. Additionally, on a join() operation, we scan through all shared variables to see if
some of them are no longer shared. Each shared variable d is accessed by a
set of threads called Sd . If Sd contains a single element after the terminated
thread u was excluded from the set, variable d can be reset to the non-shared
or ”exclusive“ state.
signal() / wait() are the primitives for synchronization with inter-thread event
notifications. A thread t sends a signal while another thread u blocks until a
signal is received. Operations of thread t, before sending the signals, happen
before operations of thread u, after receiving it. The thread segment of the
37
Chapter 5. Helgrind+ Race Detection
signaling thread has to be stored so that the waiting thread can create a hbrelation. As different signals can be sent, depending on which condition variable
cv is used, each condition variable can hold a thread segment called T Scv .
Before t executes signal (cv):
T Scv ← T St
T St ← N ewSegment(T St )
end
After u executes wait(cv):
T Su ← N ewSegment(T Su , T Scv )
end
When using the barrier() primitive, each thread is allowed to leave the barrier
only after all participating threads have reached it. Thus, each thread segment
which is after the barrier happens after all other thread segments before the
barrier. A barrier stores an immediate thread segment T Sb . After all participating threads have reached the barrier, T Sb happens after all thread segments.
By leaving the barrier, each thread segment synchronizes with T Sb .
Before t executes barrier (b):
T Sb ← N ewSegment(T Sb , T St )
end
After t executes barrier (b):
T St ← N ewSegment(T St , T Sb )
end
5.2. Memory State Machines
The effect of a memory state machine on the outcome of a detector is crucial.
With Helgrind+ , one can choose between two different memory state machines.
Based on our empirical studies, the memory state machines are tailored and carefully tuned for two different categories of applications: long-running and shortrunning applications. Compared to the memory state machine of Eraser [42]
and similar tools, our memory state machines are more complex and accurate.
We address the limitations observed in earlier memory states by making the
required refinements for lockset and threadset.
We provide both versions of memory state machines (or shorty MSM) in Helgrind+
to have a complete solution for different applications. The user is able to choose
the memory state machine depending on the application type.
5.2.1. Memory State Machine for Long-running
Applications
The memory state machine tailored to long-running applications [23] is based
on the assumption that a past data race access pattern is likely to be repeated
38
Chapter 5. Helgrind+ Race Detection
in the future. We refer to this state machine as MSM-long. MSM-long has
eight different states, and it defers the happens-before analysis until the lockset
analysis detects enough insufficiencies. Our empirical results from an analysis
of MSM-long showed a significant reduction of false positives[23], making the
tools practical for long-running applications.
Figure 5.1 shows the extended memory state machine. A description of each
state and the related instructions of the detection algorithm follows in the sections below.
Figure 5.1.: Memory state machine for long-running applications.
39
Chapter 5. Helgrind+ Race Detection
A shared state of a variable is defined, when more than one thread access the
variable. An exclusive state means that only one thread accesses the variable, or
there are hb-relations between successive accesses (accesses are synchronized).
In this case, the exclusive ownership of a variable is transferred from one thread
segment to another one.
We used the following notation in the MSM diagrams and also for describing
the algorithm and different states:
d
an arbitrary memory location.
T St
thread segment of the current thread t accessing d.
T Sd
thread segment of the prior thread accessing d.
||
current access and the prior access to d are in parallel.
→
hb
a hb-relation exists between the current and prior access to d.
Lt
current set of locks held by thread t.
Cd
current candidate set of locks protecting variable d.
Sd
current set of threads accessing variable d.
5.2.2. Principles of MSM-long
The general idea is to avoid entering a shared state until the happens-before
analysis shows that there is a concurrent access to a memory location. Lockset
tracking is performed only in shared states; Cd is updated only in Shared-Read,
Shared-Modified1, and Shared-Modified2. No happens-before test is done in the
states Shared-Read and Shared-Modified1. Only state Shared-Modified2 requires
both lockset updates and happens-before analysis (see Figure 5.1). Happensbefore analysis is deferred until the lockset of a location is empty, leading to performance improvement. Updating both locksets and the thread segment graph
for each access during program execution can be quite expensive in both time
and memory consumption. The idea of deferring the computation of happensbefore until necessary was introduced for the first time in [39]. This idea is
implemented here by introducing the state Exclusive-ReadWrite.
Separate Exclusive-Read and Exclusive-Write states are beneficial for several
reasons. As described previously, the Eraser algorithm is vulnerable to scheduling (see the example in Figure 3.8). By introducing these two exclusive states,
40
Chapter 5. Helgrind+ Race Detection
the state machine can distinguish a read after a write and a write after a read,
so the race is detected regardless of schedule, causing an immediate transition
to Race.
In addition, the edge from state New to Exclusive-Read makes the detector work
more precisely, and handle more cases properly. It is often possible for locations
to change from New directly to Exclusive-Read, especially if the application
is reading uninitialized variables, or due to compiler optimizations, where the
compiler loads a word from memory, part of which is uninitialized, and then
does not use the uninitialized part. Another case is when a program has its
own memory management routines that initializes memory with zeros before
allocation. In this situation, the memory will be New but a read from it is quite
legal.
With the edges from Exclusive-Write, Exclusive-Read and Exclusive-ReadWrite
to Race, we capture races that happen only once at initialization time. An
Eraser-style detector is based on the assumption that the program runs for a
long time, and if the race happens many times, it will be caught eventually.
With the additional edges, the extended memory state machine can catch the
race even if it happens at initialization time.
Finally, the idea of introducing a separate state Race is useful, because once
the race is reported, the tool does not spend time on this memory location any
more.
5.2.3. States of MSM-long
For better understanding, we provide a scenario in Figure 5.2 to describe different possible states in the diagram. The variable GLOB is a shared variable which
is initialized to zero and accessed by threads. We trace the algorithm on this
variable during program execution and illustrate state transitions on GLOB as
shown in Table 5.1.
As before for describing the algorithm, thread segment identifiers (T St ) are used
to indicate a hb-relation between two successive accesses to a memory location
(Details about T St are discussed in Section 3.4.2). The function threadof (T St )
returns the thread to which the thread segment T St belongs. We use this
function when updating threadset Sd .
By executing GLOB = 0 at line 1 in the given example (Figure 5.2), initially the
variable GLOB has the state New.
41
Chapter 5. Helgrind+ Race Detection
1
2
int GLOB = 0;
int COND = 0;
3
4
int main(){
25
5
c r e a t e (threadid, worker);
6
void worker(){
26
sleep (2000);
27
7
GLOB = 1;
printf(GLOB);
8
9
28
printf(GLOB);
29
30
10
l o c k (l);
while(COND !=1){
wait(cv);
}
unlock(l);
11
12
13
14
15
l o c k (l);
COND++,
s i g n a l (cv);
unlock(l);
sleep (4000);
31
32
33
34
35
36
16
l o c k (l);
GLOB++;
unlock(l);
17
18
19
GLOB = 4;
printf(GLOB);
37
38
39
return NULL;
40
20
GLOB++;
21
22
j o i n (threadid, NULL);
23
24
41
}
(b) worker thread
}
(a) main thread
Figure 5.2.: A data race occurs on the shared variable GLOB after two unsynchronized accesses - overall nine accesses.
New: Newly allocated location that is not yet accessed. No lockset is needed.
On the first write/read access, we enter state Exclusive-Write/ExclusiveRead.
State New:
When t executes read(d) ∨ write(d):
T Sd ← T St
set state to Exclusive-Read / Exclusive-Write
end
After the first write operation on variable GLOB at line 8, we enter ExclusiveWrite. Only happens-before analysis is performed within this state.
Exclusive-Write: Location d is exclusively written by a particular thread. We
track the thread segments and no lockset is needed in this state. As long
as write accesses occur from the same thread, we stay in this state (the
42
Chapter 5. Helgrind+ Race Detection
Line No.
main(): 1
main(): 8
main(): 9
worker(): 29
main(): 18
main(): 18
main(): 21
main(): 21
worker(): 37
worker(): 38
GLOB
Initialization
Write
Read
Read
Read
Write
Read
Write
Write
Read
Old State
New
Excl-W
Excl-R
Sh-R
Sh-R
Sh-Mod1
Excl-RW
Excl-RW
Race
New State
New
Excl-W
Excl-R
Sh-R
Sh-R
Sh-Mod1
Excl-RW
Excl-RW
Race
Race
hb
→
yes
no
yes
no
-
Lt
{}
{}
{}
{l}
{l}
{}
{}
{}
-
Cd
{}
{l}
{l}
{}
-
Table 5.1.: Catching a data race on variable GLOB after two unsynchronized
accesses by MSM-long (depicted in Figure 5.2).
hb-relation holds within the same thread, so there is no concurrent access). We remain in this state as long as each successive write satisfies
hb
T Sd → T St , since there are no concurrent accesses to d (T Sd is the thread
segment of the prior thread accessed to d). When a write or read occurs
with T Sd || T St , we enter Shared-Modified1. In Shared-Modified1, we do
not track thread segments, so there is no need to store T St by leaving
Exclusive-Write.
State Exclusive-Write:
When t executes Read(d) ∨ Write(d):
hb
if T Sd → T St then
T Sd ← T S t
set state to Exclusive-Read / Exclusive-Write
end
else if T Sd || T St ∧ Lt = ∅ then
C d ← Lt
Sd ← {t, threadof (T Sd )}
set state to Shared-Modified1
end
else
set state to Race
end
end
43
Chapter 5. Helgrind+ Race Detection
Variable GLOB is read by the same thread at line 9. By reading the value of
GLOB, there is a transition to Exclusive-Read. Then, the main thread is blocked
by calling the wait function at line 13. But the worker thread created by the
main thread is running.
Exclusive-Read: Location d is exclusively read by a particular thread. Similar
to Exclusive-Write, when an access occurs that would result in TSd || T St ,
we enter Shared-Read or Shared-Modified1. The information for hb-relation
is discarded, as it is no longer needed.
State Exclusive-Read:
When t executes read(d):
if T Sd || T St then
C d ← Lt
Sd ← {t, threadof (T Sd )}
set state to Shared-Read
end
else
set state to Exclusive-Read
end
end
When t executes write(d):
hb
if T Sd → T St then
T Sd ← T S t
set state to Exclusive-Write
end
else if T Sd || T St ∧ Lt = ∅ then
C d ← Lt
Sd ← {t, threadof (T Sd )}
set state to Shared-Modified1
end
else
set state to Race
end
end
The worker thread accesses GLOB and read its value (line 29). There is no hbrelation between threads. Thus, the current read access on GLOB is in parallel
with the last one, and we enter Shared-Read.
Shared-Read: Location d is concurrently accessed by multiple threads, but
all accesses are reads. We enter this state from Exclusive-Read when a
read results in multiple concurrent accesses. In this state, we track only
the lockset Cd , which is initialized to Lt . The lockset is updated for every
access. If Cd is empty and a write operation occurs, we enter ExclusiveReadWrite to perform happens-before analysis and see whether further
accesses are in parallel or not. If Cd is not empty and a write occurs, we
enter Shared-Modified1. No errors are reported in this state.
44
Chapter 5. Helgrind+ Race Detection
State Shared-Read:
When t executes read(d):
C d ← C d ∩ Lt
Sd ← Sd ∪ {t}
set state to Shared-Read
end
When t executes write(d):
C d ← C d ∩ Lt
Sd ← Sd ∪ {t}
if Cd = ∅ then
set state to Exclusive-ReadWrite
end
else
set state to Shared-Modified1
end
end
After receiving a signal from worker thread, the main thread continues to work.
Variable GLOB is incremented by the main thread at line 18. The increment
operation is not atomic and consists of two operations: a read and a write.
Reading the value of GLOB does not cause a transition and we remain in SharedRead. After writing the incremented value by the same thread, we enter SharedModified1, since the main thread holds a lock and Cd is not empty.
Shared-Modified1: Location d is read and written concurrently by multiple
threads. This state is entered either from Exclusive-Write or ExclusiveRead, with Cd initialized to Lt . As in Shared-Read, we track only the
lockset in this state. If Cd becomes empty, we enter Exclusive-ReadWrite
to check if there is a hb-relation between the accesses.
State Shared-Modified1:
When t executes read(d) ∨ write(d):
Cd ← Cd ∩ Lt if Cd = ∅ then
set state to
Exclusive-ReadWrite
end
else
set state to Shared-Modified1
end
end
Variable GLOB has the state Shared-Modified1 before executing the instruction
at line 21. After the read access by the main thread as a part of increment, the
state changes to Exclusive-ReadWrite. This is because no lock is held and Cd
is empty. The second part of increment operation “write” is done by the same
thread, and doesn’t cause any transition (if it is not interfered by the worker
thread).
45
Chapter 5. Helgrind+ Race Detection
Exclusive-ReadWrite: Location d is accessed by multiple threads and the
lockset discipline alone is not sufficient. We track the thread segment identifier corresponding to the most recent access to d. Similar to ExclusiveRead or Exclusive-Write, we remain in this state as long as there is a
hb-relation between successive accesses. When there is a write operation
and T Sd || T St , we enter Shared-Modified2. When a read operation happens and there is a hb-relation, we return to Shared-Read.
State Exclusive-ReadWrite:
When t executes Write(d):
When t executes Read(d):
hb
if T Sd || T St then
if T Sd → T St then
C d ← Lt
T Sd ← T St
Sd ← {t, threadof (T Sd )}
set state to Exclusive-ReadWrite
set state to
end
Shared-Modified2
else if T Sd || T St ∧ Lt = ∅ then
T Sd ← T St
end
C
else
d ← Lt
set state to Shared-Read
Sd ← {t, threadof (T Sd )}
end
set state to Shared-Modified2
end
end
else
set state to Race
end
end
If the increment operation (line 21) is interfered by the write/read operation
of the worker thread (lines 37,38) while being in Exclusive-ReadWrite, we enter
Race, because no hb-relation exists between threads and parallel write accesses
happen. If there was some kind of synchronization such as lock/unlock between
accesses by threads, we would enter Shared-Modified2.
Shared-Modified2: Location d is concurrently read and written by multiple
threads. When entering this state, the lockset Cd is initialized to Lt .
Both lockset and thread segments are tracked. If the lockset is empty
and d is concurrently accessed, generate an error and enter state Race.
This is the only state where both the happens-before relation and the
lockset is analyzed. But whenever a happens-before relation exists between
successive accesses, return to Exclusive-ReadWrite. This speeds up the
algorithm because it reduces the overhead for locksets, especially in longrunning programs.
46
Chapter 5. Helgrind+ Race Detection
State Shared-Modified2:
When t executes read(d) ∨ write(d):
C d ← C d ∩ Lt
if Cd = ∅ then
hb
if T Sd → T St then
T Sd ← T S t
set state to
Exclusive-ReadWrite
end
else
set state to Race
end
end
else
set state to Shared-Modified2
end
end
The variable GLOB has the state Race after the execution of line 21 of main
thread and line 37 of worker thread. It remains in this state by any further
write/read access (the read access at line 38 does not change the state).
Race: A potential race is detected and reported. This state can be reached from
Shared-Modified2 when Cd = {} and T Sd || T St , which means that d is
concurrently accessed by multiple threads without a common lock. Also it
is possible to reach Race from all exclusive states, in case a write happens
concurrently with another access and Lt = {}. Transitions on empty Lt
prevent false negatives in many situations. Lt is the set of locks currently
held by a thread during program execution, and tracking it involves hardly
any overhead.
One can see that entering Race while being in a shared or exclusive state requires at least two successive unsynchronized accesses. We will see in the second
variant of MSM presented in the following section, only having one unsynchronized access is sufficient to enter Race resulting in a more sensitive detection
algorithm.
47
Chapter 5. Helgrind+ Race Detection
5.2.4. Memory State Machine for Short-running
Applications
In the previous section, we presented a race detection approach that significantly
reduces the false alarms [23]. This approach is suitable for analyzing longrunning applications without overwhelming the user with false alarms. In longrunning applications, a data race pattern is likely to be repeated. Based on this
assumption, the race detector presented before defers certain race reports until
the race reoccurs, thus reducing false alarms.
The example provided in Figure 5.3 shows a false positive occurs on variable
GLOB. The read operations on GLOB at the end are in parallel, but do not create
any data race. MSM-long prevents this false positive and waits for a further
unsynchronized write access. By introducing the states Exclusive-ReadWrite
and Shared-Modified1 the false positive on GLOB is not reported. See Table 5.2
for the stepwise trace of accesses to GLOB.
1
int GLOB = 0;
2
3
17
int main(){
4
sleep (2000);
19
c r e a t e (threadid, worker);
5
6
20
l o c k (l);
GLOB++;
unlock(l);
21
l o c k (l);
GLOB = 1;
unlock(l);
7
8
9
10
22
23
24
sleep (4000);
25
sleep (2000);
11
12
26
printf(GLOB);
27
printf(GLOB);
13
14
28
return NULL;
29
j o i n (threadid, NULL);
15
16
void worker(){
18
30
}
}
(b) worker thread
(a) main thread
Figure 5.3.: Preventing a false positive on the shared variable GLOB by MSMlong.
But what happens if the program runs briefly? Then, races may not occur
several times. This situation could happen especially during programming by
unit testing. For this reason, we introduce a more sensitive race detection
algorithm to discover races even if they occur only once. We propose another
memory state machine which is more suitable for short-running applications[21].
The new state machine concentrates on accurately detecting data races and
48
Chapter 5. Helgrind+ Race Detection
Line No.
main(): 1
main(): 8
worker(): 22
worker(): 22
main(): 13
worker(): 27
GLOB
Initialization
Write
Read
Write
Read
Read
Old State
New
Excl-W
Sh-M1
Sh-M1
Excl-RW
New State
New
Excl-W
Sh-M1
Sh-M1
Excl-RW
Sh-M2
hb
→
no
Lt
{}
{l}
{l}
{}
{}
Cd
{l}
{l}
{}
-
Table 5.2.: MSM-long does not report the false positive on variable GLOB depicted in Figure 5.3.
prevents false negatives while avoiding false positives as demonstrated by the
results in Section 9. The new state machine is called MSM-short which is
depicted in Figure 5.4 and explained in the following section. Compared to
MSM-long, MSM-short has two states less.
Figure 5.4.: Memory state machine for short-running applications.
49
Chapter 5. Helgrind+ Race Detection
5.2.5. Principles of MSM-short
As Figure 5.4 depicts, the main idea is to avoid entering a shared state until the
happens-before analysis shows that there are concurrent accesses to a memory
location. Threadset and lockset tracking are performed only in shared states.
No thread segment tracking is performed in Shared-Read. Only state SharedModified requires both lockset updates and happens-before analysis. Tracking
both lockset and thread segments for each access during program execution can
be quite expensive in both time and space (memory consumption).
For this reason, the happens-before analysis in Shared-Modified is deferred until
the lockset of a location is empty. That is, we do not track the thread segments
until the lockset would report a race, leading to performance improvement. If
there is a happens-before relation, we return to one of the exclusive states.
As in MSM-long, separate Exclusive-Read and Exclusive-Write states are beneficial for several reasons. The state machine can distinguish a read after a
write or a write after a read. We have more information about the accesses in
the past, making the detector work more precisely. In addition, this distinction
helps the detector to handle races that could happen only once during initialization time[23]. Missing such races is a shortcoming in current Eraser-style
detectors.
5.2.6. States of MSM-short
As in MSM-long, thread segments (e.g. T St ) are used to indicate a hb-relation
between two successive accesses to a memory location. Some states are similar
to the states in MSM-long. Here we discuss the differences to the MSM-long
algorithm.
A scenario for a data race is depicted in Figure 5.5 which is used for the explanation of different states. The scenario is similar to previous one (Figure 5.5),
but it is shorter and a race on the shared variable GLOB happens only after
few accesses by threads. Note that the race in this scenario is not detected by
MSM-long, as it occurs only once. It would be detected if repeated. But we are
able to detect the race by MSM-short.
As shown in Table 5.3, variable GLOB has the state New after initialization.
New: Newly allocated memory that is not yet accessed. As in MSM-long, no
lockset is needed. On the first write/read access, we enter state ExclusiveWrite/Exclusive-Read..
50
Chapter 5. Helgrind+ Race Detection
1
2
int GLOB = 0;
int COND = 0;
3
4
21
int main(){
5
sleep (2000);
23
c r e a t e (threadid, worker);
6
7
24
printf(GLOB);
25
GLOB = 1;
printf(GLOB);
8
9
10
26
l o c k (l);
COND++,
s i g n a l (cv);
unlock(l);
sleep (4000);
27
28
l o c k (l);
while(COND !=1){
wait(cv);
}
unlock(l);
11
12
13
14
15
16
29
30
31
32
printf(GLOB);
33
34
GLOB++;
17
18
return NULL;
35
36
}
j o i n (threadid, NULL);
19
20
void worker(){
22
(b) worker thread
}
(a) main thread
Figure 5.5.: A data race occurs on the shared variable GLOB after only one
unsynchronized access - overall seven accesses.
State New:
When t executes read(d) ∨ write(d):
T S d ← T St
set state to Exclusive-Read / Exclusive-Write
end
After the first write and read accesses by the main thread (lines 8, 9), GLOB has
Exclusive-Write and Exclusive-Read respectively.
Exclusive-Write: Location d is synchronized with hb-relations and the last
access was a write by a particular thread segment. No lockset is needed.
We remain in exclusive state as long as successive accesses are ordered by
hb-relation, since there are no concurrent accesses to d. When a write or
read occurs which is parallel to previous access, we enter Shared-Modified.
Otherwise, we switch to Exclusive-Write or Exclusive-Read corresponding
to the type of current operation.
It is possible to reach Race from exclusive states, in case an access happens
concurrently with another access and Lt = ∅ (i.e. an unsynchronized
access happens). Transitions from exclusive states to race if Lt is empty
51
Chapter 5. Helgrind+ Race Detection
Line No.
main(): 1
main(): 8
main(): 9
worker(): 25
main(): 17
main(): 17
worker(): 33
GLOB
Initialization
Write
Read
Read
Read
Write
Read
Old State
New
Excl-W
Excl-R
Sh-R
Sh-R
Sh-Mod
New State
New
Excl-W
Excl-R
Sh-R
Sh-R
Sh-Mod
Race
hb
→
yes
no
no
no
Lt
{}
{}
{}
{}
{}
{}
Cd
{}
{}
{}
{}
Table 5.3.: Catching a data race on variable GLOB after one unsynchronized
access by MSM-short (depicted in Figure 5.5).
prevent false negatives in many situations. If Lt = ∅ were not checked, we
would have false negatives. Lt is the set of locks currently held by a thread
during program execution, and tracking it involves hardly any overhead.
State Exclusive-Write:
When t executes read(d) ∨ write(d):
hb
if T Sd → T St then
T Sd ← T S t
set state to Exclusive-Read / Exclusive-Write
end
else if T Sd || T St ∧ Lt = ∅ then
T Sd ← T S t
C d ← Lt
Sd ← {t, threadof (T Sd )}
set state to Shared-Modified
end
else
set state to Race
end
end
Exclusive-Read: Similar to Exclusive-Write, except that the last access was
a read operation. Location d is synchronized with hb-relations and no
lockset is needed.
When a parallel access occurs, this is potentially a race except in the
following cases:
• On a read operation, we enter Shared-Read, because parallel reads are
not considered a data race. At this moment the happens-before chain
52
Chapter 5. Helgrind+ Race Detection
is broken. Thread segment T Sd is kept to be used in Shared-Read.
• On a write operation, if the thread holds a lock, we assume that from
now on, variable d is protected by locks and we enter Shared-Modified.
In all other cases, we report a race.
State Exclusive-Read:
When t executes write(d):
When t executes read(d):
hb
if T Sd || T St then
if T Sd → T St then
keep T Sd
T Sd ← T S t
C d ← Lt
set state to Exclusive-Write
end
Sd ← {t, threadof (T Sd )}
else if T Sd || T St ∧ Lt = ∅ then
set state to Shared-Read
end
T Sd ← T S t
else
C d ← Lt
set state to Exclusive-Read
Sd ← {t, threadof (T Sd )}
end
set state to Shared-Modified
end
end
else
set state to Race
end
end
By execution of the parallel read access to GLOB by the worker thread at line 25,
we enter Shared-Read.
Shared-Read: Location d is concurrently accessed by multiple threads, but all
accesses are reads. Shared-Read allows parallel reads. We enter this state
from Exclusive-Read when a read results in multiple concurrent accesses.
In this state, thread segments are not updated. We track only the lockset
Cd , which is initialized to Lt and the threadset to see if a variable is shared
between threads. The lockset is updated for every access. If a write occurs,
enter Shared-Modified, except when this write is in parallel with the T Sd
stored in Exclusive-Read, and no lock protects it.
This situation is the only case of reporting a race in Shared-Read. Since
we do not update the thread segment in Shared-Read, the thread segment
in Exclusive-Read is stored at the point where the happens-before chain
is broken. When a write causes a transition, the thread segment of the
writing thread and the stored T Sd are examined. If there are parallel
accesses and the lockset is empty, we enter Race. This increases the chance
of detecting races raised in Shared-Read, unlike many Eraser-style tools
that lack the ability to detect races for shared-read data.
53
Chapter 5. Helgrind+ Race Detection
State Shared-Read:
When t executes read(d):
C d ← C d ∩ Lt
Sd ← Sd ∪ {t}
set state to Shared-Read
end
When t executes write(d):
hb
if T Sd → T St then
C d ← C d ∩ Lt
Sd ← Sd ∪ {t}
set state to Shared-Modified
end
else
set state to Race
end
end
The increment operation executed on GLOB at line 17 causes a transition to
Shared-modified. This is because no lock is held by the main thread during
incrementing. Also, no hb-relation exists between the thread segment of the
current write operation and the last stored thread segment.
Shared-Modified: Location d is concurrently read and written by multiple
threads. We presume that variable d is protected by the locks in Cd . If
it is entered from an exclusive state, the lockset Cd is initialized to Lt . If
this state is entered from Shared-Read, the lockset is taken from this state.
In addition to threadset, both lockset and thread segments are tracked.
If the lockset Cd is empty, then d is not correctly synchronized with locks.
So we check if other synchronization patterns impose any happens-before
relations. If not, we generate an error and enter the Race state. If there are
hb-relations, we return to an exclusive state. This speeds up the algorithm
because it reduces the overhead for lockset analysis for all accesses during
program execution.
Note that this is the only state where both the happens-before relations
and the locksets are analyzed.
54
Chapter 5. Helgrind+ Race Detection
State Shared-Modified:
When t executes read(d) ∨ write(d):
C d ← C d ∩ Lt
if Cd = ∅ then
hb
if T Sd → T St then
T Sd ← T S t
set state to Exclusive-Read / Exclusive-Write
end
else
set state to Race
end
end
else
set state to Shared-Modified
end
end
The last read access done by the worker thread (line 33) causes a data race.
This is caught by MSM-short and we enter Race.
Race: A potential race is detected and reported. Introducing this separate
state is useful, because once the race is reported, the tool does not spend
time on this memory location any more.
The detected race on GLOB is not detected by MSM-long, since no race is reported
in Shared-modified1 by MSM-long. The race would be reported by MSM-long,
if it repeated or further unsynchronized read/write accesses happen.
5.2.7. Discussion and Comparison of Memory State
Machines
MSM-long has two different Shared-Modified states, whereas MSM-short has
only one; therefore, it is more sensitive [21]. The two distinct states in MSMlong were introduced to defer race warnings. It is assumed that in long-running
applications, races on a memory location happen several times. So, on first
occurrence of a potential race, MSM-long waits until it is repeated to be sure of
reporting real races.
In contrast, MSM-short will warn about races immediately after the first indication of incorrect synchronization. That is, there is a difference in the way the
empty lockset is handled. In Shared-Modified1 in MSM-long, a transition to
Race on an empty lockset would lead to numerous false positives (as shown in
55
Chapter 5. Helgrind+ Race Detection
the example provided in Figure 5.3). On the other hand, if the alarm produced
in the single Shared-Modified in MSM-short is a true positive, it could be caught
immediately avoiding a possible false negative.
We examined both versions on various benchmarks and chose the best solution.
Based on our experimental results, the distinction between Shared-Modified1
and Shared-Modified2 is beneficial for long-running applications. If an empty
lockset in Shared-modifed1 is indeed a true positive, it is mostly followed by
another parallel read/write leading to the Race state. MSM-short is also suitable
for unit testing and during development when a race pattern may occur only
once, and MSM-long is better suited for integration testing.
The distinction between Shared-Modified1 and Shared Modified2 in MSM-long
is also justified by performance reasons. In Shared-Modified1, only the lockset
is maintained, whereas in Shared-Modified2 both lockset and thread segments
(happens-before analysis) are tracked. This optimization makes the detector
practical for real-world applications.
5.3. Limitations
Our memory state models are a compromise between detecting all races and
reporting few false positives. There are some special cases in which a false
negative could occur:
One scenario is given in Figure 5.6, when a variable GLOB in New state is not
protected and is initialized by a thread. There is a race condition when a second
thread writes to GLOB concurrently. If the second thread holds an unrelated
lock, a race is caused which will be missed. However, any unprotected read or
write after this operation will be reported as a data race. Usually, programmers
tend to not use locks for initializations. Thus, the race could be counted as an
intentional race.
Note that by correct detection of synchronization with inter-thread event notifications finding some special race patterns are possible. We are able to find
races caused by spurious wake ups and further reduce the false negatives (more
details are presented in next chapter).
There still are some false positives, and reducing the false positive rate even
further is a challenge. This is mainly due to the missing information about
synchronization operations (e.g. ad-hoc synchronizations) in the program by
the detector that causes an imprecise happens-before detection.
56
Chapter 5. Helgrind+ Race Detection
int GLOB = 0;
int main()
{
c r e a t e (threadid, worker);
GLOB = 0;
j o i n (threadid, NULL);
void worker()
{
l o c k (l);
GLOB = 1;
unlock(l);
return NULL;
return 0;
}
}
(b) worker thread
(a) parent thread
Figure 5.6.: Example for a false negative due to the limitation of MSMs.
5.3.1. Imprecise Happens-Before Detection
Reconstructing hb-relations is an important task for race detectors. If hbrelations between thread segments are missed, the detector considers them to
be parallel although they were correctly synchronized, thus producing false positives. On the other hand, if we add false relations to the happens-before graph,
the detector causes false negatives.
The knowledge of all synchronization operations is crucial to data race detection.
We discovered three major problems which lead to inaccuracies in the happensbefore graph during data race detection:
• Inter-thread event notifications
• Ad-hoc synchronizations
• Unknown synchronization primitives from unsupported libraries
The problems occur often in parallel programs. The first problem is caused
by using inter-thread event notifications via condition variables. The second
one deals with ad-hoc synchronization constructs defined by the programmer
in program code. The third issue is caused by using unknown synchronization
primitives from other libraries that are not supported by the detector.
We discuss these problems in detail in the following chapters and present our
solution, which establishes hb-relations and automatically extracts the correct
synchronizations induced without relying on annotations or user assistance. Our
solution eliminates almost all cases of false alarms and missed races related to
inter-thread event notifications, ad-hoc synchronizations and unknown synchronization primitives of unsupported libraries.
57
Chapter 5. Helgrind+ Race Detection
58
Chapter 6.
Detecting Inter-thread Event
Notifications
When programmers use inter-thread event notifications, they use two separate
parts for synchronization: Functions for event notifications between threads
which is provided by a library (e.g. signal/wait primitives), and condition variables that are implemented in program code. The programmer uses both of
them to ensure reliable synchronization. The resulting synchronization is not
only dependent on library function calls, but also on the condition variables
implemented in the code. Due to that, detectors are not aware of condition variables and have to be cautious when handling inter-thread event notifications.
Synchronization with inter-thread event notifications reveals two problems during happens-before analysis: lost signals and spurious wake ups. Lost signals
happen when the signal is sent before a thread waits for it. Spurious wake ups
result from the usage of only one condition variable to signal several different
conditions at the same time.
By merely intercepting signal /wait, it is not clear if the synchronization was really
successful. Therefore, detectors cannot establish the required hb-relations. This
problem does not happen with other types of synchronization primitives. For
example, when using locks, the whole synchronization takes place within the
library primitive calls lock and unlock; after the termination of these primitives,
it is clear that the synchronization is successfully terminated.
The problems above were not solved in other approaches, e.g. [36], that extend
data race detection for condition variables.
59
Chapter 6. Detecting Inter-thread Event Notifications
6.1. Motivating Example
A higher sensitivity usually also means a higher rate of false alarms. To avoid
this, the detector has to distinguish more accurately between real data races and
harmless accesses. Only parallel accesses can lead to data races, so the detector
has to find out how accesses are ordered.
In some cases, it is extremely difficult to reconstruct the implicit ordering imposed by synchronization primitives, as shown in Figure 6.1. Thread 1 operates
on DATA and then signals Thread 2 to take over the data for further processing.
The threads are properly synchronized, but there is an ordering in which the
happens-before relation involving signal() and wait() is not visible to the
race detector, causing it to issue a false warning on DATA. This situation is as
follows.
DATA++
l o c k (l)
FLAG = 1
s i g n a l (CV)
unlock(l)
(a) Thread 1
l o c k (l)
while(FLAG != 1)
wait(CV)
unlock(l)
DATA-(b) Thread 2
Figure 6.1.: Lost signal when using synchronization primitives signal() and
wait().
If Thread 1 finishes first and then Thread 2 starts, Thread 2 will not call
wait(). Consequently, the signal sent by Thread 1 is lost. The instrumentation of signal() and wait() thus does not help the detector to identify
the proper ordering of the threads, since a part of synchronization (wait()
function) for building the hb-relation is missing. Thread 2 carries on and as
soon as it accesses DATA, a data race is reported, even though there is none.
The proper ordering is enforced by the condition variable FLAG, but noticed
by neither lockset nor happens-before detectors. This scenario is depicted on
the right side of Figure 6.2. Another Scenario shown on the left side of Figure
6.2 shows that Thread 2 is executed earlier and is waiting for the signal sent by
Thread 1. In this case the functions signal() and wait() are explicitly called
and could be intercepted by the detector to construct the synchronization.
60
Chapter 6. Detecting Inter-thread Event Notifications
!!
!!
Figure 6.2.: Depending on the interleaving during execution, different parts of
the code are responsible for constructing the synchronization.
6.2. Spurious Wake ups
Figure 6.3 shows another problematic situation with two pairs of signaling and
waiting threads (S1 ,W1 ) and (S2 ,W2 ). Each pair accesses a different set of data
and uses different conditions. But only one condition variable CV is used for
conceptually two different signals. This way, a signal would wake up both pairs,
which means one signal would spuriously wake up a wrong thread. The situation
is also the same if the synchronization primitive broadcast is applied instead of
signal .
X++
l o c k (l1)
FLAG1 = 1
s i g n a l (CV)
unlock(l1)
(a) S1
Y++
l o c k (l2)
FLAG2 = 1
s i g n a l (CV)
unlock(l2)
(c) S2
l o c k (l1)
while(FLAG1!=1)
wait(CV)
unlock(l1)
X-(b) W1
l o c k (l2)
while(FLAG2!=1)
wait(CV)
unlock(l2)
X-Y-(d) W2
Figure 6.3.: Several signaling and waiting threads using the same condition
variable CV.
Based on the program semantics, (S1 , W1 ) are synchronized through variable
61
Chapter 6. Detecting Inter-thread Event Notifications
FLAG1 and (S2 , W2 ) through FLAG2. Thus, after synchronizations W1 is allowed to access only X and W2 only Y . However, W2 also accesses X, and a data
race takes place between the pair S1 and W2 .
The above data race cannot always be identified by the detector, since in some
interleavings the detector deduces by mistake that the pair (S1 , W2 ) are synchronized. Assume the scenario that W1 and W2 are executed and waiting for
signals. Afterwards, S1 finishes and sends a signal that wakes up both threads
W1 and W2 ; the detector cannot decide which waiting threads should be synchronized with S1 , and synchronizes both of them with S1 . Since both waiting
threads W1 and W2 use the same CV, it is not possible for the detector to identify
the proper ordering, only by intercepting the wait(CV) function call. It cannot
distinguish the correct synchronization and determine if a real synchronization
happens.
In the following sections, we show how to solve these problems without relying
on source code annotations.
6.3. Detecting Lost Signals
Detecting hb-relations based on intercepting library function calls works fine
with the synchronization primitives such as fork/join and barriers. They are
explicitly called and could be intercepted directly by a detector. This direct
interception is not always the case when using inter-thread event notifications
(signal/wait functions). Because the exact point of time that the synchronization is successfully terminated by them is not clear for the detector. This point
is determined by the “condition variables” defined by the programmer in the
source code and not by the synchronization primitives i.e. signal() and
wait().
Thus, just by termination of synchronization primitives, a part of the semantics
of synchronization is hidden for the race detector. In Section 6.1, we stated
a typical synchronization pattern using condition variables. We discussed the
problem that condition variables are stateless and signals are not accumulated.
If the waiting thread is scheduled after the signaling thread, the signal will be
lost; the waiting thread will never call the corresponding wait(). Thus, the
detector does not know that synchronization has taken place.
Observing synchronization via condition variables, you will find a similar pattern in most cases that could be easily found in source code: a while-loop that
checks a condition and executes the wait() function until the while-condition
62
Chapter 6. Detecting Inter-thread Event Notifications
changes. Therefore, the point when the synchronization is successfully terminated is directly after the while loop.
A method may use source code annotations to mark the synchronization point
after the while loop. However, this method is troublesome for the developer
who uses the detector. The source code of the program has to be available and
it has to be changed. Furthermore, the additional compilation process makes
this method intrusive in the build process.
In this work, we propose a new automatic method that finds the synchronization points through binary instrumentation. The method could be integrated
directly into a dynamic race detector and doesn’t need any user intervention.
Our method searches for while-loops in the binary code which contain a call to
the wait() library function. All the wait()-enclosing loops are instrumented
so that the detector will be aware of them. Thus, it does not matter anymore
whether a call to wait() is executed or not. The detector is able to intercept
all wait() function calls, even if the signal is sent before calling the wait()
function. So, it is able to construct the hb-relation based on the corresponding
intercepted signal()/wait() primitives and lost signals do not affect the
detector.
The method works well since the code to correctly wait for a signal (as shown
in Figure 6.1) follows specific rules:
• The wait() library function is called within a loop, when a specific condition is met.
• It is assured that the signal was sent at the time the program leaves the
loop.
• Locks are used to protect the condition variables.
6.3.1. Source Code Annotation
As discussed earlier, a workaround to address the problem of lost signals is
source code annotation. An automatic method for source code annotation is
described in [30]. If condition variables are used in the program, the method
marks synchronization points in source code. First, it searches for a sequence
of lock ... while ... wait(cv) ... unlock in the source code. When it finds one,
it annotates the end of the while loop by inserting A N N O T A T E _ W A I T (cv). This
annotation gives the detector the necessary information for the synchronization,
without affecting the program semantics. Figure 6.4 displays a simple example
of source code annotation.
63
Chapter 6. Detecting Inter-thread Event Notifications
l o c k (mu)
...
while(condition)
{
...
wait(cv, mu)
...
}
A N N O T A T E _ W A I T (cv)
...
unlock(mu)
Figure 6.4.: Annotated while loop when using condition variable.
The detector handles the A N N O T A T E _ W A I T (cv) in the same way as a call to the
wait(cv) function. At the end of the call, the hb-relation between the synchronization point within the signaling thread and the waiting thread is constructed. Compared to the wait(cv) function inside the while loop, the function
A N N O T A T E _ W A I T (cv) will be called each time, so the hb-relation is guaranteed to
exist.
6.3.2. Binary Instrumentation
Locating the synchronization pattern (lock ... while ... wait(cv) ... unlock) described above in binary code is not trivial. In binary level, the high level source
code is compiled and transformed into a set of machine instructions. Constructing a proper hb-relation at this level requires having the correct synchronization
points.
Finding Synchronization Points
In binary instrumentation, the end of the while-loops have to be found to be
considered as synchronization points. However, in binary level one cannot find
while-loops, since after the build process they are converted to branches or jump
instructions.
As an example, Figure 6.5 depicts two different variants of while-loops in machine code. A while-loop is transformed to one or several machine code blocks.
There is a code block containing a conditional branch (jump). Depending on
the branch condition the destination code block is chosen. In Variant 2, one
can find only one conditional block at the end of the code, whereas in Variant
64
Chapter 6. Detecting Inter-thread Event Notifications
!
"
Figure 6.5.: While-loops in machine code.
1, there are two different blocks at the top and bottom of the code blocks containing the conditional branches. In Variant 2, the compiler has optimized the
code and duplicated the conditional branches.
After the evaluation of conditional branch, either the loop-body will be executed
or the loop is jumped over and terminated. Thus, the program counter after the
execution of the branch could be set to two possible instruction sets: Either to
the beginning address of the loop body or the ending address of the whole loop.
If one instruments the instruction at the ending address of the loop body, the
race detector is notified of the end of the loop. I.e. the detector will be aware
of termination of a successful synchronization via condition variable at runtime.
To assure identifying synchronization with condition variables, all conditional
branches in the program have to be examined. Additionally, these branches are
checked to see if they enclose any wait(cv) functions, since only loops applied
for synchronization with condition variables have to be considered.
Determining the Parameters
So far, our method can detect where a signal should be waited for. But it still
does not know exactly, which signal to wait for. In fact, after finding the synchronization point of the waiting side, some information is still missing, namely
65
Chapter 6. Detecting Inter-thread Event Notifications
which signaling side belongs to this synchronization point. This information is
given by the parameters provided in the wait(cv) function, i.e. the condition
variable used in the synchronization function (in this case, only the parameter
cv is used). Therefore, we wait for the signal(cv) which used the same parameters as in the synchronization function wait(cv). In this way, we are able to
specify both synchronization points related to condition variable cv.
The parameters are crucial to set up the hb-relation correctly. A possible way
to get these parameters is to wait for a call to wait(cv) and store its parameters.
This causes problems, because the wait(cv) function will not be executed each
time as in the cases with lost signals.
A solution to overcome these problems is on-the-fly simulation of the loop body
execution, and do a stack walk to extract the parameter set of wait(cv) function.
The simulation has to be done without side effects. The method works, except
for a few implementation limitation that we will discuss in Chapter 8.
At the end we have combined both methods to guarantee reliable identification
of condition variables during the instrumentation. Firstly, the beginning of the
while-loop will be simulated to get the set of parameters. Upon termination
of the while-loop, if the wait(cv) function is executed the parameters provided
by the wait(cv) function are used. Otherwise, if the wait(cv) function is not
executed at all (i.e. lost signal cases), the parameter set of wait(cv) function
derived from the simulation is used.
6.4. Data Dependency
In Figure 6.3, we presented an example in which the condition variable cv was
used by different threads: Two pairs of signaling and waiting threads accessed
different data, but only one condition variable was used. That is, the parts of
synchronization done in source code use only one cv for both pairs. The synchronization between four threads depicted in Figure 6.3 builds the hb-relations
demonstrated in Figure 6.6(a). There is no path between the thread groups (S1 ,
W1 ) and (S2 , W2 ). Therefore, the pair (S1 , W1 ) is parallel with the pair (S2 ,
hb
hb
W2 ), but (S1 →W1 ) and (S2 →W2 ).
In fact, race detectors store only one synchronization point for each conditional
variable. Therefore, when sending several signals in sequence, the older point
will be overwritten each time. For instance, assume threads are executed as
in the following sequence: S1 , S2 , W2 , W2 . The detector constructs a false
hb-relation as shown in Figure 6.6(b), since the synchronization point of S1 is
66
Chapter 6. Detecting Inter-thread Event Notifications
overwritten by S2 . In this case, a false warning on X between S1 and W1 is
reported due to the false happens-before graph.
An elementary solution is to combine all synchronization points with artificial
synchronization points [30]. For this reason, we could introduce fake thread
segments. By introducing a fake segment for cv, happens-before edges are redirected to and from a fake segment as in Figure Figure 6.6(c): The calculated
happens-before graph contains real hb-relations. Still some additional false hbrelations are constructed, which are not caused by any synchronization construct
in the program. For instance, the false hb-relation between S1 and W2 masks
the race on harmful access on X by W2 and causes a false negative.
To identify the correct synchronization, detectors must be able to understand
the semantics of conditions implemented in the program code. This could be
estimated by a data dependency analysis between the signaling and waiting
threads. If a thread, shortly before calling a signal or broadcast, changes a variable
and after that the same variable is checked within a condition by another thread,
apparently there is a causal relation between both threads. We call this relation
a write/read relation or shortly wr-relation. In compiler terminology this is
called Definition-Use chain. A Definition-Use chain (DU-chain) consists of a
definition, D, of a variable and all the uses, U, reachable from that definition
without any other intervening definitions.
6.4.1. WR-Relation
In our sample, there are only wr-relations within the pairs (S1 , W1 ) and (S2 , W2 ).
The signaling threads modify their corresponding FLAG variable and the waiting
threads evaluate them in their conditions. If we indicate the hb-relation between
threads based on the existing data dependency, the only correct happens-before
graph could be achieved easily. Figure 6.6(d) depicts the correct hb-relations
that Helgrind+ identifies [21]. No false positives or false negatives are caused by
this graph. Note that the synchronization points within the fake thread segment
do not create any data dependency.
Identifying wr-relations at runtime requires monitoring all variables adjacent to
a signal or a broadcast. These variables are protected by a lock operation. We
need to record only variables between a lock operation and the signal or broadcast.
All write accesses to variables within this code block will be recorded.
On the side of waiting thread, the conditional jump (branch) is already instrumented. The evaluation of the jump condition is completed at this point. All
read accesses on variables between the lock operation and the conditional jump
are recorded. When synchronization terminates successfully, we can search for
67
Chapter 6. Detecting Inter-thread Event Notifications
(c) Introducing fake thread segments (F)
that aggregate synchronization points
(b) Only one synchronization point for a
condition variable on the signaling side is
stored
(a) Correct happens-before graph
(d) hb-relations calculated by a data
dependency analysis (wr-relation) in
Helgrind+
Figure 6.6.: Happens-before graphs generated by different methods to variables X and Y.
direct data dependencies (wr-relations) between write and read accesses. Because, multiple wr-relations could be found, a hb-relation is constructed for each
wr-relation.
If no data dependency is found, the fake thread segment is used as an alternative solution, which merges all sent signals of a condition variable into a single
synchronization point.
68
Chapter 6. Detecting Inter-thread Event Notifications
Searching for data dependencies is allowed after finishing a successful synchronization. Under other circumstances, it is not clear whether the signaling thread
has already modified the variable or not. Furthermore, it must not have side
effects on the normal behavior and the execution of the wait function.
Algorithm 2 depicts the extension of our race detection algorithm to identify hbrelations based on wr-relations. By executing a lock operation, thread t enters a
lock-protected region with lock(). We start to record all the following memory
accesses. The read memory accesses on variables (such as d) are recorded into
a set of read variables called Rt and the write memory accesses are recorded
into the set of written variables Wt . Rt and Wt are reset when we leave a
lock-protected region with unlock().
{ Lock operations }
After t executes lock(l):
Rt ← ∅
Wt ← ∅
end
After t executes unlock(l):
Rt ← ∅
Wt ← ∅
end
{ Memory accesses }
After t executes write(d):
Wt ← Wt ∪ {d}
end
After t executes read(d):
Rt ← Rt ∪ {d}
end
{ Condition variables }
Before t executes signal (cv):
foreach d in Wt do
DS(d) ← T St
end
T Scv ← N ewSegment(T St , T Scv )
T St ← N ewSegment(T St )
end
After t executes wait(cv):
foreach d in Rt do
if DS(d) exists then
T St ←
N ewSegment(T St , DS(d))
end
else
T St ←
N ewSegment(T St , T Scv )
end
end
end
Algorithm 2: Basic detection algorithm and lockset update rules with wrrelation.
69
Chapter 6. Detecting Inter-thread Event Notifications
A call to signal in a lock-protected region causes the detector to scan all the
modified variables from the beginning of the lock-region up to signal . It maps
all variables recorded in Wt to the current thread segment identifier. This is
done by DS(d) in the algorithm, i.e. DS : d → ts where ts denotes the thread
segment of the last signaler which modified the variable d. Additionally, a fake
thread segment (T Scv )is created which is ordered after every signaler segment.
T St is the thread segment of the current thread t.
When a wait (or an annotated wait in a loop) is called, all recorded read operations Rt are checked to see if there is a mapping DS(d) indicating any wr-relation
on d. If it exists, a hb-relation between the waiting thread and the real signaler
is constructed. Otherwise, we have to fall back to use the former technique with
the fake thread segment (T Scv ), which was created by our signal -handler.
6.5. Summing-up
This section describes the steps for the reliable identification of inter-thread
event notifications. The approach is conceptually divided into three phases:
1. Pre-instrumentation phase: The relevant locations of machine code are
blockwise analyzed and particular points are marked to be instrumented.
2. Instrumentation phase: Instrumentation takes place just-in-time and blockwise. The analysis code (analysis functions) is inserted into the machine
code.
3. Runtime phase: During runtime the analysis functions perform the actual
program analysis.
6.5.1. Pre-instrumentation Phase
In the pre-instrumentation phase, we look into the given machine code and
find all conditional jumps. Then, for each conditional jump, we specify two
possible instruction addresses proceeding after the jump instruction. Regarding
the control flow graph, one target is the address of the first instruction inside
the loop body and the other one is the instruction address outside the loop
body, right after ending the loop. The loop body is located between these two
instruction addresses. For this reason, we search for a wait-function call between
these addresses. If there is a wait call, we assume that the loop is used for
inter-thread event notification via condition variables. We interpret the smaller
address as the starting address and the larger one as the ending address of the
70
Chapter 6. Detecting Inter-thread Event Notifications
loop body. The ending address indicates the end of a synchronization and is
marked for instrumentation. If no wait call is found the conditional jump is
ignored. The following list depicts briefly how the code locations are marked:
F or all conditional jumps in program code:
body_start ← min(jump_destination1, jump_destination2)
body_end ← max(jump_destination1, jump_destination2)
if ∃ wait -f unction call between body_start and body_end:
mark body_start
mark body_end
mark jump
6.5.2. Instrumentation phase
In the previous phase, we specified the conditional jumps with the beginning and
the ending address of the whole synchronization. We instrument the program
code based on the commands shown in Table 6.1.
Instruction / Markings
Instrumentation
before instruction
lock
Instrumentation
after instruction
B E G I N_R E C O R D I N G_R E A D S
B E G I N_R E C O R D I N G_W R I T E S
unlock
S T O P_R E C O R D I N G_R E A D S
S T O P_R E C O R D I N G_W R I T E S
marked
conditional jump
marked
body start
marked
body end
signal or broadcast
wait
S T O P_R E C O R D I N G_R E A D S
G E T_P A R A M E T E R S
S T A R T_I G N O R I N G_W A I T S
S T O P_I G N O R I N G_W A I T S
A N N O T A T E_W A I T
S T O P_R E C O R D I N G_W R I T E S
H A N D L E_S I G N A L
H A N D L E_W A I T
Table 6.1.: Instrumentation commands for the reliable handling of inter-thread
event notifications (condition variables).
The commands are functions that are inserted into machine code and will be
executed at runtime. The only exception is the command G E T _ P A R A M E T E R S that
executes a sequence of operations to specify the parameters for wait-function
calls, required by A N N O T A T E _ W A I T . Details about specifying the parameters of
71
Chapter 6. Detecting Inter-thread Event Notifications
function will be explained in Chapter 8. The column Instrumentation before instruction in Table 6.1 lists all commands that are injected before instruction; Instrumentation after instruction describes commands injected after the
instruction.
wait
Listing 6.1 lists the result of the pre-instrumentation and the instrumentation
phase for both loop variants depicted in Figure 6.5.
6.5.3. Runtime phase
The actual program analysis happens at runtime. We record variable accesses
at particular regions in the program code to find data dependencies and extract
wr-relations.
Functions B E G I N _ R E C O R D I N G _ R E A D S and S T O P _ R E C O R D I N G _ R E A D S record read accesses. Only read accesses of the current execution of a lock-protected region
are recorded. Thus, B E G I N _ R E C O R D I N G _ R E A D S overwrites the previous recording.
Similarly, B E G I N _ R E C O R D I N G _ W R I T E S and S T O P _ R E C O R D I N G _ W R I T E S record write
accesses. Listing 6.2 demonstrates what exactly the injected functions do at
runtime.
Listing 6.3 demonstrates the complete instrumented code of a signaling thread.
For better understanding, the instrumented machine code is expressed in C/C++
source code. The thread modifies variables that affect the loop condition within
a lock protected region. During instrumentation, the region that begins with a
lock and ends with signal , broadcast or unlock is marked. All write accesses within
this region are recorded at runtime. As soon as signal or broadcast is called, all
recorded accesses are associated with the current point of time (related thread
segment identifier).
Basically, we have to record only write accesses on signaler side and only read accesses on waiting side. However, as shown in Listing 6.3, after the lock-operation
all read and write accesses are recorded. This is because at the beginning of
a lock-protected region, it is not clear whether later on a signal or wait will be
called.
Listing 6.4 depicts the instrumented code of a waiting thread. In the code block
between the lock operation and the conditional jump (while-loop), variables
upon which the condition is dependent are accessed. This code block is also
instrumented so that all read accesses will be recorded at runtime. At the end
of synchronization, which is marked with A N N O T A T E _ W A I T , the detector searches
for possible data dependencies based on recorded read/write accesses to extract
any wr-relation between the signaling and waiting threads.
72
Chapter 6. Detecting Inter-thread Event Notifications
Variant 1:
804b47f: movl
804b486: call
)
0x804f550,(%esp)
8048dd4
# [mutex]
# pthread mutex lock(&mutex
B E G I N_R E C O R D I N G_R E A D S
B E G I N_R E C O R D I N G_W R I T E S
804b48b: cmpb
0x0,0x804f570
804b492: S T O P _ R E C O R D I N G _ R E A D S
G E T_P A R A M E T E R S
jne
804b4b1
804b494: S T A R T _ I G N O R I N G _ W A I T S
movl
0x804f550,0x4(%esp)
804b49c: movl
0x804f520,(%esp)
804b4a3: call
8048e14
&mutex)
H A N D L E_W A I T
804b4a8: cmpb
0x0,0x804f570
804b4af: je
804b494
804b4b1: S T O P _ I G N O R I N G _ W A I T S
A N N O T A T E_W A I T
movl
0x804f550,(%esp)
804b4b8: S T O P _ R E C O R D I N G _ R E A D S
S T O P_R E C O R D I N G_W R I T E S
call
8048cc4
mutex)
Variant 2:
8048724: movl
804872b: call
8048730:
8048732:
804873a:
8048741:
MU)
0x804a064,(%esp)
80485e0
B E G I N_R E C O R D I N G_R E A D S
B E G I N_R E C O R D I N G_W R I T E S
jmp
8048746
S T A R T_I G N O R I N G_W A I T S
movl
0x804a064,0x4(%esp)
movl
0x804a080,(%esp)
call
8048610
H A N D L E_W A I T
mov
0x804a060,%eax
cmp
0x1,%eax
setne %al
test
%al,%al
S T O P_R E C O R D I N G_R E A D S
G E T_P A R A M E T E R S
jne
8048732
8048755: S T O P _ I G N O R I N G _ W A I T S
A N N O T A T E_W A I T
movl
0x804a064,(%esp)
804875c: S T O P _ R E C O R D I N G _ R E A D S
S T O P_R E C O R D I N G_W R I T E S
call
80485c0
8048746:
804874b:
804874e:
8048751:
8048753:
# [open]
# while(!open) {
# [cond]
# [mutex]
# p t h r e a d c o n d w a i t (&cond,
#
# }
# [mutex]
# pthread mutex unlock (&
# [MU]
# pthread mutex lock(&MU)
# while(COND != 1) {
# [CV]
# [MU]
# p t h r e a d c o n d w a i t (&CV, &
# [COND]
#
#
#
# }
# [MU]
# pthread mutex unlock(&MU)
Listing 6.1: Instrumented machine code with loops and condition variables
73
Chapter 6. Detecting Inter-thread Event Notifications
B E G I N_R E C O R D I N G_R E A D S:
delete old recorded read accesses of the current thread
record all read accesses of the current thread up to now
S T O P_R E C O R D I N G_R E A D S:
stop recording of read accesses
B E G I N_R E C O R D I N G_W R I T E S:
delete old recorded write accesses of the current thread
record all write accesses of the current thread up to now
S T O P_R E C O R D I N G_W R I T E S:
stop recording of write accesses
H A N D L E _ S I G N A L (cv):
T Scv ← max(T Scv , T St ) // saving the point of time
f or all recorded write accesses: // saving f or data dependency analysis
T Scv (address) ← current thread segment T St
T St ← N ewSegment(T St ) // signaling thread get new time
S T A R T_I G N O R I N G_W A I T S:
inside_loop ← True
S T O P_I G N O R I N G_W A I T S:
inside_loop ← False
G E T_P A R A M E T E R S:
Simulate loop body
save parameters of simulated wait -call (cv,mu)
H A N D L E _ W A I T (cv,mu):
if inside_loop:
save parameters of wait -call (cv,mu)
else: // recording synchronization
dependency_found ← false
thread segment T Sw ← current thread segment T St
f or all recorded read accesses on address:
if ∃ Vcv (Address): // data dependency detected
T Sw ← max(T Sw , T Scv (address))
dependency_found ← true
if dependency_found:
current thread segment T St ← thread segment T Sw
else:
current thread segment T St ← max(T St , T Scv )
A N N O T A T E_W A I T:
thread segment T Sw ← current thread segment T St
f or all recorded parameters (cv,mu):
H A N D L E _ W A I T (cv,mu)
delete recorded parameters
Listing 6.2: Overview of the functions used for Instrumentation process.
74
Chapter 6. Detecting Inter-thread Event Notifications
...
l o c k (mu);
B E G I N _ R E C O R D I N G _ R E A D S ();
B E G I N _ R E C O R D I N G _ W R I T E S ();
...
S T O P _ R E C O R D I N G _ W R I T E S ();
s i g n a l (cv);
H A N D L E _ S I G N A L (cv);
...
S T O P _ R E C O R D I N G _ R E A D S ();
S T O P _ R E C O R D I N G _ W R I T E S ();
unlock(mu);
...
Listing 6.3: Instrumented code of a signaling thread using condition variables
...
l o c k (mu);
B E G I N _ R E C O R D I N G _ R E A D S ();
B E G I N _ R E C O R D I N G _ W R I T E S ();
...
G E T _ P A R A M E T E R S ();
while(condition) / for(;condition;) / if(condition)
{
S T O P _ R E C O R D I N G _ R E A D S ();
S T A R T _ I G N O R I N G _ W A I T S ();
...
wait(cv, mu);
H A N D L E _ W A I T (cv, mu);
...
}
S T O P _ R E C O R D I N G _ R E A D S ();
S T O P _ I G N O R I N G _ W A I T S ();
A N N O T A T E _ W A I T (cv);
...
Listing 6.4: Instrumented code of a waiting thread using condition variables
75
Chapter 6. Detecting Inter-thread Event Notifications
The functions S T A R T _ I G N O R I N G _ W A I T S / S T O P _ I G N O R I N G _ W A I T S inform the detector to ignore all wait-function calls within the wait-enclosing while loop. This is
because within the while loop the synchronization is still not completely terminated. The detector ignores the wait-function calls only inside the loop, and will
handle it after that by the injected functions.
Alternatively, we could ignore all wait-function calls in the program. But this
might lead to missed synchronization operations that do not completely match
the typical pattern of synchronization via condition variables. As an example,
Figure 6.7 shows a program that uses task queue to distribute tasks between
threads.
main() {
c r e a t e (&thread_1,
c r e a t e (&thread_2,
...
c r e a t e (&thread_n,
c r e a t e (&thread_0,
}
&consumer);
&consumer);
&consumer);
&producer);
void producer() {
while(DATA) {
Q.putTask();
s i g n a l (cv);
}
}
(a) Thread 1
void consumer() {
while(TRUE) {
wait(cv);
do_something(Q.getTask());
}
}
(b) Thread 2
Figure 6.7.: Using condition variables not following the standard pattern.
At the beginning, the consumer threads are blocked waiting for a signal without
any condition. Then, the producer thread produces a task and wakes up an
arbitrary thread that accomplishes the task. In this example, it is assured
that the task is finished and a condition variable cv is only used to block the
“idle” threads. If we ignore all wait-function calls, we would miss the resulted
synchronizations and this case would not be treated properly.
6.6. Limitations
Lost signals and spurious wake ups are considered as main problems for hybrid
race detectors. Static hybrid race detectors have to identify synchronization
directly in program source code. They could use source code annotations based
76
Chapter 6. Detecting Inter-thread Event Notifications
on the algorithm described in this chapter to mitigate these problems. For
dynamic hybrid race detectors, our algorithm works fine and eliminates these
problems.
For dynamic race detectors based on the lockset algorithm (Eraser-Style detectors), the partial order of events is not relevant at all; they report false warnings
on lost signals anyway and miss races on spurious wake ups.
Pure happens-before race detectors additionally construct hb-relations based on
lock/unlock operations. When using inter-thread event notifications via condition variables, accessing the variables of condition variables are within the lockprotected regions. Therefore, such detectors construct a hb-relation between
lock-protected regions (see Figure 6.8).
!!
!!
Figure 6.8.: hb-relation constructed from lock operations by a pure happensbefore race detector.
As long as condition variables are used properly, hb-relations reflect the synchronizations correctly– the lost signal problem disappears. However, spurious
wake ups still exist and the problem causes difficulties.
Nested Loop Conditions
Furthermore, there might be obscure use of inter-thread event notifications via
condition variables defined by the programmer which do not match the common
patterns. Our algorithm may not find the exact synchronization point in these
cases.
As an Example, Listing 6.5 shows a synchronization with a condition variable
using nested loops. The thread executes its own work in the outer loop. It is
difficult to determine which ending point terminates the synchronization and in
which loop level the synchronization occurs.
77
Chapter 6. Detecting Inter-thread Event Notifications
bool done = false;
while( !done ) {
// Synchronization
while( this ) {
while( that ) {
p t h r e a d c o n d w a i t (...);
}
}
// working
done = do_work();
}
Listing 6.5: Nested while-loops within a thread.
The algorithm presented has no special remedy for this case. The algorithm
processes each loop as an ordinary loop. As long as the loop body does not
seem too big for using a condition variable, each loop end is marked as a synchronization point. Only one of the marked synchronization points should be
counted as a real ending synchronization point and the remaining are actually
false synchronization points. The false synchronization points are considered
several times and possibly too early by the detector. This causes a problem for
the algorithm during the data dependency analysis only. If a synchronization
point is considered too early, some data dependencies are not caught at runtime. Therefore the detector is not able to construct the actual hb-relation based
on the required data dependencies. Ignoring the problem for data dependency
analysis, hb-relations are constructed redundantly.
Nevertheless in the next chapter, we present a general approach to find different synchronization operations. It provide as solution that is able to identify
programmer-defined synchronizations; among them such obscure synchronizations as nested loops.
78
Chapter 7.
Identifying Ad-hoc
Synchronization
Programmers tend to implement their own synchronization primitives when
available synchronization constructs are too slow. For instance, a programmer
may write a spinning loop instead of using a library-supplied wait-operation.
Furthermore, libraries may lack certain higher-level synchronization constructs
such as barriers or task queues, forcing programmers to implement their own.
We call such synchronization constructs implemented in programs programmerdefined or ad-hoc.
Ad-hoc synchronization operations occur surprisingly frequently. For instance,
we found that eight of the 13 PARSEC benchmarks [3] contain between 32 and
329 ad-hoc synchronization code segments. For race detectors, ad-hoc synchronization presents a problem, in that race detectors are not aware of these
constructs and thus generate an avalanche of false positives for them. For instance, Tian et al [44] observe an average of four million false positives generated
for programs containing from 12 to 131 ad-hoc synchronization segments.
The subject of this chapter is the reliable detection and treatment of ad-hoc
synchronization in race detectors, with the aim of eliminating false warnings.
We identified spin loops that check conditions as the basic pattern in ad-hoc
synchronization. We provide a dynamic method that detects ad-hoc synchronization constructs reliably, provided they use spin loops that examine condition
variables. The method dynamically and automatically identifies these loops by
analyzing the object code. The signaling thread which signals the condition(s)
(mostly by changing a flag) cannot be determined through analysis, but it can be
found dynamically by instrumenting the code. Our method detects both reads
and writes on condition variables and then establishes a hb-relation between signaling and signaled threads, thus preventing the generation of false warnings.
79
Chapter 7. Identifying Ad-hoc Synchronization
The method has been added to the race detector Helgrind+ [22, 21]. The results from substantial benchmark suites confirm that Helgrind+ eliminates false
warnings without missing true races.
7.1. Synchronization Operations
Dynamic data race detectors typically intercept calls to synchronization primitives in order to find ordering constraints. For instance, if a program calls the
synchronization primitive barrier wait, the detector intercepts this function call
and records the fact that accesses after the barrier are not concurrent with accesses before the barrier. For a race detector to identify all races and to produce
no false positives, it must be aware of the ordering effects of all synchronization
constructs, including locks, monitors, signal/wait, conditions variables, spurious
wakeup calls, barriers, etc. Our results given in Chapter 9 confirm that by tailoring the detection algorithm for each synchronization primitive, the detector
extracts highly accurate ordering information, identifies all races, and keeps the
number of false positives low.
But what if synchronization primitives are not supported by the detector? Then
the usual detectors are not able to intercept them, know nothing about ordering
effects, and therefore may produce numerous false positives. The number of false
positives can be so high as to overwhelm the programmer.
The idea of this chapter is to identify a basic pattern that occurs in virtually
all synchronization primitives and to extend the detection algorithm to handle
this pattern. This pattern is the spinning read loop waiting for a condition to
change. Once this pattern is handled well, we can, in fact, remove all code from
the race detector dealing with synchronization primitives built upon this loop.
Moreover, all synchronization libraries as well as ad-hoc synchronization based
on the spinning read loop will be handled automatically, eliminating the need
to enhance the detector for every library.
7.1.1. True and False Data Races
In addition to the data race classification given in Figure 3.5, we can classify
false data races as follows:
• apparent data races, and
• synchronization data races
80
Chapter 7. Identifying Ad-hoc Synchronization
If a detector is not aware of a synchronization construct, it may report races
where they are none, because they are actually prevented by the construct.
Such cases are called apparent data races. Since detectors may not support
all synchronization primitives, apparent races cause false positives. Figure 7.1
depicts a simple example that uses the synchronization primitive barrier wait(b).
Assuming the primitive is unknown to the detector, it will report races regarding
the variable DATA. The detector will consider all read operations after the barrier
as races, although there is no concurrent write. If the synchronization primitive
were known to the detector, the false races would disappear.
Thread 1, 2, ... n:
l o c k (l)
DATA++
unlock(l)
...
b a r r i e r w a i t (b)
...
print DATA
Figure 7.1.: Using the synchronization primitive barrier wait() from an unsupported library causes apparent data races on DATA.
Figure 7.2 depicts a simple ad-hoc synchronization in which the second thread
waits for condition variable FLAG. An uninformed standard detector would report an apparent race on variable DATA.
The second major reason for false positives are synchronization data races. Consider FLAG in Figure 7.2. Its accesses are unordered and constitute a real data
race. However, this data race is a harmless and, in fact, intentional. The data
race is necessary for proper synchronization. Intentional data races are often
known as synchronization races [24, 44].
The example in Figure 7.1 also produces synchronization data races. To see why,
consider the typical implementation of the barrier primitive in Figure 7.3. The
intentional data races on the variable counter are harmless synchronization
data races. Synchronization primitives require data races to enable competition
for entering critical sections, for locking, for changing condition variables, etc.
Our aim is to refine Helgrind+ in such a way that it does not report apparent
or synchronization data races, while reporting all other races.
81
Chapter 7. Identifying Ad-hoc Synchronization
/* Initially FLAG is 0 */
...
DATA = 1
...
while(FLAG != 1)
/* do_nothing */
...
FLAG = 1
print DATA
(a) Thread 1
(b) Thread 2
Figure 7.2.: Ad-hoc synchronization causes an apparent data race on DATA
and a synchronization data race on FLAG.
l o c k (l)
counter++
unlock(l)
...
while(counter != NUMBER_THREADS)
/* do_nothing */
...
Figure 7.3.: Implementation of synchronization primitive barrier wait() causes
synchronization races on counter.
7.2. Ad-hoc Synchronizations
A good race detector should avoid false positives associated with ad-hoc synchronization and synchronization races. In this section, we propose a dynamic
detection method based on the fact that the spinning read loop is the common
pattern of almost all synchronization constructs, and, a major source of synchronization races. The method identifies spinning-loop synchronization correctly
even if the spinning read is actually not entered (recall that programmers assume spinning loops are entered rarely). We discuss the underlying pattern first
and present our detection algorithm afterwards. The algorithm identifies all
spin-loop synchronization operations, including those in libraries.
82
Chapter 7. Identifying Ad-hoc Synchronization
7.2.1. Common Pattern in Ad-hoc Synchronization
The so called spin-lock synchronization is the most common and simplest synchronization construct [24]. It employs a condition shared by two threads. One
thread executes a while-loop waiting for the value of the condition to be changed
by the other thread. At the moment the value changes, the waiting thread is
able to leave the loop and proceed. Figure 7.4 illustrates the use of the spin-lock.
Thread 2 executes a spinning read loop on the shared variable CONDITION, until Thread 1 changes the value. The read and write operations are the source of
a harmless synchronization data race that need not be reported to the user.
...
do_before(X)
while(!CONDITION){
/* do_nothing */
}
set CONDITION to TRUE
.
.
.
do_after(X)
.
.
.
(a) Thread 1
(b) Thread 2
Figure 7.4.: Spinning read loop pattern.
A number of publications analyzed different implementations of synchronization
operations [28, 29, 17, 24, 44] and observed that the spinning read loop is a common pattern used for implementing synchronization constructs. For example,
the implementation of the barrier primitives in Figure 7.3 also uses a spinning
read loop on a flag with a counterpart write ending the spin.
Another example is different lock implementations in various thread libraries
that use the Test-and-Set or compare and swap construction. Test-and-Set is
also used by the PThread library to implement the lock primitives as shown in
Figure 7.5.
By executing the lock(l) operation, each thread executes an atomic Test-andSet instruction i.e. Test-and-Set(lock_flag). This instruction reads and
stores the value of lock_flag and sets the variable lock_flag to TRUE. If the
lock_flag is available and not acquired by other threads, then the Test-andSet instruction returns FALSE, that lets the executing thread wins to enter the
critical region. Other threads have to wait and spin on the lock_flag (while
(lock_flag);) until there is a possibility that Test-and-Set instruction can
succeed.
83
Chapter 7. Identifying Ad-hoc Synchronization
1
bool lock_flag = FALSE;
2
3
4
5
6
7
l o c k () {
while (Test-and-Set(lock_flag) {
while(lock_flag);
}
}
8
9
10
11
unlock() {
lock_flag = FALSE;
}
Figure 7.5.: Implementation of lock/unlock operations in various libraries (e.g.
Pthread library).
To avoid executing the Test-and-Set instruction repeatedly, threads do spinning read on line 5. Running the Test-and-Set instruction repeatedly causes
cache invalidations and generating cache coherence messages. This could lead
to significant overhead. In the implementation, there is a spinning read loop on
variable lock_flag at line 5 (loop: while(lock_flag);). Along with the counterpart write at line 10 (lock_flag = FALSE;), a synchronization data race on
variable lock_flag is created.
One can see that the atomic instruction Test-and-Set(lock_flag); in line
4 simultaneously reads and writes the lock_flag variable, and consequently
causes synchronization data races with lines 5, 10, and itself.
7.2.2. Detecting Spinning Read Loops
In the previous section, we found that the spinning read loop and its counterpart
write are the common construct for ad-hoc synchronizations. Helgrind+ finds
spinning read loops in program code and instruments them before runtime.
When the program is executed, Helgrind+ establishes the correct happens-before
relations between spinning read loops in one thread and counterpart writes in
another thread, so that the detector is aware of synchronizations.
The general idea of our method is as follows: Helgrind+ searches the binary
code to find all loops. This is done by building a blockwise control flow graph
on-the-fly before the actual runtime. Next, it narrows the set to spinning read
loops based on the following criteria:
• Evaluating the loop condition involves at least one load instruction from
memory.
84
Chapter 7. Identifying Ad-hoc Synchronization
• The value of the loop condition is not changed inside the loop body.
We instrument each spinning read loop and mark the variables that affect the
value of the loop condition (this may be a single flag or several variables, if
the condition is an expression). However, at this point we do not know where
the counterpart write is. Next, we discuss the instrumentation that finds the
write.
Being a runtime race detector, Helgrind+ monitors all read/write accesses. The
state of a variable indicates whether it is used by one thread only (state exclusive) or multiple threads (state shared ). When entering a spinning loop, the
states of the variables affecting the loop condition are set to a special state called
spin. Two cases are possible:
(a) In the first case, the counterpart write does not happen before entering the
spin loop. In this case, Helgrind+ waits for the first write operation that
affects the loop condition. If the write operation is performed by another
thread other than the spinning thread, then this is the counterpart write.
When leaving the loop, Helgrind+ records a happens-before edge between
the spinning read loop and its counterpart write.
Consider the example in Figure 7.4. CONDITION is the condition variable
in the spinning read loop. Assume the spinning read is entered by Thread
2 before the counterpart write. The happens-before relation is constructed
based on the data dependency (write/read dependency) on CONDITION.
Thus, the detector will be aware of this synchronization operation and no
race will be reported on X. The warning regarding the benign synchronization race on CONDITION is also suppressed, since it is marked as being in
the special state spin.
(b) In the second case the counterpart write happens first: One or more variables affecting the loop condition are written before the loop is entered.
Helgrind+ sets the states of the changed variables to exclusive and records
the location of the write instructions. As soon as the instrumented spinning read loop is entered, the detector notices that variables affecting the
loop condition have been changed. The loop itself terminates immediately. Helgrind+ records the hb-relation as before and sets the states of
the changed variables to spin. In this case no actual spinning happens—
the loop condition is evaluated only once and the loop ends.
The method described by Tian et al [44] fails to establish the hb-relation in the
second case, because this method relies on the loop spinning several times. It
also fails to recognize inter-thread event notifications (signal()/wait()) in case
of lost signals. A signal is lost if a thread sends a signal before any other
85
Chapter 7. Identifying Ad-hoc Synchronization
thread waits for it. In this case, no spinning read happens at runtime. The
wait() primitive is not even executed, since the condition variable is already set
earlier by the signaling thread; the loop terminates immediately. Failing to take
signaling into account may lead to false positives. Another tricky case involves
spurious wake ups. These can lead to false negatives (missed races) when threads
uses same condition variables (as discussed in Chapter6). Helgrind+ handles all
of these cases correctly.
Another problem by the method of Tian et al [44] concerns the heuristic of using
a threshold iteration count in order to distinguish spinning read loops from
ordinary loops. If the spinning read loop dose not spin long enough to reach
the threshold value, the detector misses the spinning read loop and generates
false positives. On the other hand, if the threshold value is too low, ordinary
loops in the program could be mistaken for spinning read loops, which also
results in missed races. Thus, without exploiting the semantics information by
dynamic code analysis just before runtime, one may easily miss synchronizations
or misinterpret them, since actual spinning reads may not happen at all at
runtime or might not reach a preset threshold value.
7.2.3. The Algorithm
Conceptually, our method is divided into three phases:
• pre-instrumentation phase,
• instrumentation phase, and
• runtime phase
In the pre-instrumentation phase, loops in the program are recognized and then
only the spinning read loops are selected to be instrumented just-in-time in
instrumentation phase. During runtime, a runtime data dependency analysis
is carried out to construct the hb-relation between the related parts (spinning
read loop and counterpart write).
Recognizing loops in the program is performed by means of online control flow
analysis. We construct a blockwise control flow graph on-the-fly based on the
current superblock (a superblock contains a maximum of three basic blocks)
and consider loops with three to seven basic blocks in the graph. We check
whether they are spinning read loops or not. In our experiments, we found
three to seven basic blocks deliver good results, since the spinning read loops
are typically small loops with few instructions. Decreasing this number may
result in missing some spinning read loops and producing some false positives.
86
Chapter 7. Identifying Ad-hoc Synchronization
On the other hand, increasing the number of basic blocks causes additional
overhead.
Figure 3 provides a high level description of spinning read loop detection algorithm. The first step constructs the data dependency table Dl for every loop l.
Dl (conditionl ) returns all variables that the loop condition conditionl depends
on within the loop l. The data dependency analysis takes function calls into
account. Step 2 determines for all variables v that the conditionl depends on,
whether v is modified inside the loop. If there is an assignment to any such v,
then the loop l is not a spinning read loop. Otherwise, the loop is marked as
performing spinning reads only, and the variables of Dl (conditionl ) are prepared
for instrumentation.
foreach loop l do
1. Dl (conditionl ): the set of variables, on which the condition
conditionl of the loop l depends
2. foreach v ∈ Dl (conditionl ) do
// v is modified
if (Dl (v) = ∅) then
return;
end
end
3. mark l as spinning read loop
prepare all v ∈ Dl (conditionl ) for instrumentation
end
Algorithm 3: Basic algorithm for detecting spinning read loops.
Loops are converted to conditional branches at low level code. Hence, we must
consider all conditional branches in the low level code. We search the control
flow graph for loops that span a maximum number of three to seven basic
blocks. Then, we track the dependencies of each variable within these basic
blocks by constructing a data dependency table. The data dependency table is
built up with respect to registers at the low level code. All temporary variables
and addresses in basic blocks are traced to identify the registers they depend
on. By means of the dependency table we can now check if the loop condition
variable depends on a register that is the target of a load instruction. If the load
addresses stay constant, then the loop condition variable is not modified within
87
Chapter 7. Identifying Ad-hoc Synchronization
the loop body and the loop is marked as a spinning read loop. We instrument
the spinning read loop and insert the required instructions to intercept and
analyze it at runtime.
volatile int spinlock = 1;
//worker thread
void *run_pm(void* arg) {
spinlock = 0;
return NULL;
}
//parent thread
int main(){
pthread_t threadid;
pthread_create(&threadid, NULL, &run_pm, NULL);
while (spinlock != 0) {
sched_yield();
}
pthread_join(threadid, NULL);
return 0;
}
Figure 7.6.: An example for spinning read loop.
Figure 7.6 shows exactly how the algorithm works in more detail: The spinning
read loop is located in a parent thread. In low level code, the spinning loop is
converted to conditional jumps resulting in the object code depicted in Figure
7.7. For the sake of simplicity, we just show the code for the spinning read
loop part: while (spinlock != 0). The first instruction is a mov operation
that loads a value from memory to register eax. Then the conditional jump is
evaluated. Register eax stays constant within the loop body, since it depends
on itself only. Thus, the loop is marked and instrumented as a spinning read
loop.
As in the previous chapter, we use the functions B E G I N _ R E C O R D I N G _ R E A D S and
S T O P _ R E C O R D I N G _ R E A D S to record all read accesses at this specific code region.
They will be used during runtime analysis for extracting write/read dependencies and constructing hb-relations.
Unlike the previous example, the example provided in Figures 7.8 and 7.9 is
a non-spinning read loop. It is a small while-loop, but the variable runp is
modified within the loop body. This can be easily derived from analyzing the
object code given in Figure 7.9. Register rdx is loaded from a memory location
88
Chapter 7. Identifying Ad-hoc Synchronization
B E G I N_R E C O R D I N G_R E A D S
4006a0: mov
4006a6: test
4006a8: jne
0x200462(%rip),(%eax)
%eax,%eax
40069b
S T O P_R E C O R D I N G_R E A D S
40069b: call
400548
40069e: cmpb
0x0,0x200462
4006ab: je
40069b
# eax <- load(...); [spinlock]
#
# while(spinlock) {
# sched_yield()
#
# }
Figure 7.7.: Machine code of spinning read loop depicted in Figure 7.6.
by instruction mov (%rax),%rdx and then the loop condition is evaluated at the
Line e44ed by test %rdx,%rdx. However, rdx is modified within the loop body
by the instruction mov %rdx,%rax at Line e44e7. In fact, the loading address
(rax) of the load instruction mov (%rax),%rdx is modified.
while (runp != NULL)
if (runp->dso_handle == dso_handle)
break;
else
{
lastp = runp;
runp = runp->next; // loop variable ‘‘runp’’ is modified!
}
Figure 7.8.: An example for non-spinning read loop.
e44e1: cmp
e44e5: je
%r9,0x20(%rdx) #
e44f4
# if (runp->dso_handle == dso_handle)
e44e7: mov
%rdx,%rax
# rax <- rdx; modified!
e44ea: mov
e44ed: test
e44f0: jne
(%rax),%rdx
%rdx,%rdx
e44e1
# rdx <- load(rax); [runp]
# while (runp != NULL)
Figure 7.9.: Machine code of non-spinning read loop depicted in Figure 7.8.
7.2.4. Limitations
There could be obscure implementations of spinning read loops that do not
follow the common patterns. As an example, the code presented in Figure 7.10
89
Chapter 7. Identifying Ad-hoc Synchronization
is a type of spinning loop synchronization done by a do-while loop. However,
the loop condition variable c inside the loop body is changed in each iteration
and based on our algorithm the detected loop is not instrumented as a spinning
read loop.
static int COND = 0;
void Thread1() {
X = 1;
l o c k (l);
COND = 1
unlock(l);
}
void Thread2() {
int c;
do {
l o c k (l);
c = COND; // loop condition changed!
unlock(l);
sleep(1);
} while(c);
if (c) {
X = 2;
}
}
Figure 7.10.: Obscure implementation of a spinning read loop.
7.3. Universal Race Detector
A side benefit of the method mentioned in this chapter is that it can also be
applied to unknown libraries. Helgrind+ currently uses information about the
synchronization constructs of PThreads, but if application programmers use
different libraries, then our enhanced Helgrind+ can also detect races reliably,
provided the libraries are based on spin loops. Note that even operating system
calls such as wait that relinquish the processor are typically used inside loops
and therefore detectable by Helgrind+ . A surprising result is that information
about PThreads can be removed entirely from Helgrind+ , resulting in only a
minor increase in false positives. Thus, Helgrind+ with spin loop detection can
be seen as a universal race detector that is aware of synchronization operations.
90
Chapter 7. Identifying Ad-hoc Synchronization
We overcome the serious limitation of prior work which limits detectors to only
synchronization primitives of a particular library.
7.3.1. Detecting Synchronization Primitives
The above method is a general approach capable of detecting synchronization
operations implemented by spinning read loops e.g. locks, barriers, etc.
A race detector based on this approach is a pure happens-before detector. It
cannot make use of the lockset algorithm, because it is not aware of locks.
In our case, if we turn off the support of Pthreads so that synchronization
primitives of Pthreads are not directly intercepted, we get a pure happensbefore detector. Our empirical results show that relying only on this general
approach for identifying synchronization operations might be too limited in some
situations. There may be obscure implementations of spinning read loops that
are difficult to detect, leading to false positives. We will show that using this
approach as a complementary method achieve better results.
Our method is based on dynamic binary instrumentation. It does not need any
program source code or user intervention such as source code annotations and
therefore is non-intrusive in the build process. The semantic analysis of the program code is done automatically during just-in-time binary instrumentation.
91
Chapter 7. Identifying Ad-hoc Synchronization
92
Chapter 8.
Implementation of Helgrind+
This chapter describes the main points in the implementation of Helgrind+ . We
provide a general overview and discuss important data structures and algorithms
used in the Helgrind+ implementation.
8.1. Valgrind Framework
Valgrind [33, 31, 32] is a framework for dynamic binary instrumentation. It
consists of a virtual machine (core) and different tools (skins) built on top.
The tools perform various analyses of program execution using instrumentation.
Some existing tools built on top of Valgrind are, for example, Memcheck 1 or
Cachegrind 2 , etc. Our tool Helgrind+ is built on top of Valgrind, too.
The virtual machine disassembles binary code into a platform independent code
called Intermediate Representation (IR): IR is a RISC-like intermediate language that uses main memory and registers with some temporary variables as
memory locations. A tool inserts its instrumentation functions into the IR code.
The instrumented IR code is handed back to the virtual machine. The virtual
machine resynthesizes the machine code from the instrumented IR. Then, the
code is executed. During execution, the instrumentation functions are also executed and tools can monitor the memory and register contents for their analysis.
This process is depicted in Figure 8.1.
Valgrind performs instrumentation just-in-time and on demand. It is blockwise
based on Valgrind superblocks. A superblock contains a maximum of three basic
blocks. A basic block is a sequence of IR instructions ending with a branch operation (control flow branch). Therefore, a superblock could have more than one
exit point (end of each basic block could be an exit point for the superblock).
1
2
A memory checker tool.
A cache profiler tool.
93
Chapter 8. Implementation of Helgrind+
Figure 8.1.: Instrumentation process in Valgrind.
If a superblock is going to be executed, then superblock instrumentation is enforced. Superblocks not executed , are not instrumented. The superblock is
instrumented only once and instrumented superblocks are stored for possible
reuse during program execution. However, it is possible that an instruction appears in different superblocks and thus the instruction could be instrumented
several times. The instrumentation has no side effects on program functionality. Each instruction is always instrumented the same way regardless of its
context.
A superblock could have entry points within its body. In this case, only the
part following the entry point will be instrumented. Superblocks are allowed to
overlap with each other.
Valgrind supports multi-threaded programs and schedules threads in a finegrained way. It is able to intercept function calls from the Pthread library. The
virtual machine is single-threaded. Threads are created and Valgrind cares for
very fine granular interleavings, but at any point of time, only one thread will
be executed.
Event Handler and User Requests In addition to instrumentation of IR,
Valgrind proposes two other mechanisms to get more information about the
program execution: Many events, such as memory allocation, or lock acquisition
are intercepted by Valgrind and could be delivered to the tool by an event
handler. Also, a tool can define user requests; functions in the program that are
going to be analyzed by the tool, so that Valgrind diverts the program control
94
Chapter 8. Implementation of Helgrind+
to a function provided by the tool – annotations in program source code are
implemented in this way.
All together this functionalities makes Valgrind a powerful and flexible tool for
all kinds of runtime checking.
8.2. Machine Code and Intermediate
Representation (IR)
It is difficult to describe or locate high level constructs such as loops directly in
IR code, because IR is relatively expanded compared to machine (object) code.
It could be useful for finding such constructs, if we consider machine code first,
instead of IR code. But instrumentation in IR code is easier. The operations
in IR are more explicit: Each machine instruction is expanded into several
simple IR instructions. There are less varied IR instructions and therefore the
instrumentation process in IR level is easier.
Figure 8.2 shows different code representations of a sample program. The example depicts a small program in C/C++ source code and its x86 machine code.
The machine code uses instructions for arithmetic operations, branch operations
and function calls. At lines 8 and 9 of the machine code, the if construct is
replaced by a “conditional jump” and “compare” instructions. At lines 11 to
14, first the parameters of a function are pushed onto the stack, before jumping
to the function address located at 0x8048330. How the parameters are delivered
after that, depends on the calling conventions which differ for each platform or
hardware architecture. It is very difficult to infer that the address at 0x8048330
is a function call to printf. In machine code, there are no explicit write/read instructions. Lines 4 and 8 demonstrate different instructions to access variables.
The Intermediate Representation abstracts from different machine instructions
and forms a platform independent representation of program code. Figure 8.3
shows the intermediate representation of the example given in Figure 8.2. The IR
code of this program is divided into two superblocks including their Instruction
Marks (IMarks). Each IMark relates the IR instructions to its specific machine
code instruction, as every instruction in machine code is translated into several
IR instructions.
At the end of each superblock, there is a pointer to the next superblock according
to the execution order. A conditional jump cannot be used as the last instruction
in a superblock. Instead, a goto statement is used at the end of each superblock,
95
Chapter 8. Implementation of Helgrind+
1
2
3
4
1
2
int a = 2;
int b = 2 * a;
5
6
7
3
4
5
if(!b) return;
printf("%d", b);
(a) Source code
8
9
10
11
12
13
14
int a = 2;
8048405: movl
int b = 2 * a;
804840c: mov
804840f: add
8048411: mov
if(!b) return;
8048414: cmpl
8048418: je
printf("%d", a);
804841a: mov
804841d: mov
8048421: movl
8048428: call
0x2,-0x8(%ebp)
-0x8(%ebp),%eax
%eax,%eax
%eax,-0xc(%ebp)
0x0,-0xc(%ebp)
804843a
-0xc(%ebp),%eax
%eax,0x4(%esp)
0x8048510,(%esp)
8048330
(b) Machine code
Figure 8.2.: Example for machine code generated for x86.
as shown in the Figure 8.3. Thus, within a superblock there are no unconditional
jumps (e.g. goto statement). If an unconditional jump is encountered, the
superblock ends, and a pointer to the new superblock is set. As an alternative,
jump chasing could be used so that the jump address is evaluated, and the code
at the jump destination will be attached to the current superblock. Within
a superblock, temporary variables tn are created that follow the single static
assignment rule (only one assignment to each temporary). Temporary variables,
called temporaries, are used only as arguments for IR operations, and work
according to the load/store principle.
96
Chapter 8. Implementation of Helgrind+
1
2
3
4
5
6
7
8
9
10
11
12
13
14
15
16
17
18
19
20
21
22
23
24
25
26
27
28
29
30
31
32
33
---- IMark(0x8048405, 7) ---PUT(60) = 0x8048405:I32
t35 = Add32(t30,0xFFFFFFF8:I32)
STle(t35) = 0x2:I32
---- IMark(0x804840C, 3) ---PUT(60) = 0x804840C:I32
t37 = Add32(t30,0xFFFFFFF8:I32)
t39 = LDle:I32(t37)
---- IMark(0x804840F, 2) ---t16 = Shl32(t39,0x1:I8)
PUT(0) = t16
---- IMark(0x8048411, 3) ---PUT(60) = 0x8048411:I32
t40 = Add32(t30,0xFFFFFFF4:I32)
STle(t40) = t16
---- IMark(0x8048414, 4) ---PUT(60) = 0x8048414:I32
t43 = Add32(t30,0xFFFFFFF4:I32)
t22 = LDle:I32(t43)
IR-NoOp
PUT(32) = 0x6:I32
PUT(36) = t22
PUT(40) = 0x0:I32
PUT(44) = 0x0:I32
---- IMark(0x8048418, 2) ---PUT(60) = 0x8048418:I32
t52 = CmpEQ32(t22,0x0:I32)
t51 = 1Uto32(t52)
t50 = t51
t53 = 32to1(t50)
t45 = t53
if (t45) goto {Boring} 0
x804843A:I32
goto {Boring} 0x804841A:I32
1
2
3
4
5
6
7
8
9
10
11
12
13
14
15
16
17
18
19
20
21
22
---- IMark(0x804841A, 3) ---t7 = GET:I32(20)
t6 = Add32(t7,0xFFFFFFF4:I32)
t8 = LDle:I32(t6)
PUT(0) = t8
---- IMark(0x804841D, 4) ---PUT(60) = 0x804841D:I32
t10 = GET:I32(16)
t9 = Add32(t10,0x4:I32)
STle(t9) = t8
---- IMark(0x8048421, 7) ---PUT(60) = 0x8048421:I32
STle(t10) = 0x8048510:I32
---- IMark(0x8048428, 5) ---PUT(60) = 0x8048428:I32
t12 = Sub32(t10,0x4:I32)
PUT(16) = t12
STle(t12) = 0x804842D:I32
---- IMark(0x8048330, 6) ---PUT(60) = 0x8048330:I32
t4 = LDle:I32(0x804A008:I32)
goto {Boring} t4
(b) IR Superblock 2
(a) IR Superblock 1
Figure 8.3.: Example of intermediate representation (IR-code).
There are specific IR operations that are classified into the following categories:
Arithmetic operations are used for calculation and comparison as well as for
address calculations. In the first superblock in Figure 8.3, there are some
examples at lines 3 and 27. The suffix 32 indicates that the operands are
32-bit long. Operands are temporaries only and the result is also assigned
to temporaries (max. four operands).
Accesses to registers of the processor are done by PUT and GET commands.
97
Chapter 8. Implementation of Helgrind+
The actual registers are represented by an architecture specific constant
offset number. For example in x86 the program counter has the offset
60, the accumulator has the offset eax and 0, and the stack pointer has
the offset 16. Examples for them are on lines 2 or 21 to 24 in the first
superblock.
Access to main memory is performed explicitly by ST or LD instructions.
When using these instructions, the most significant bit (MSB) and the
loading or storing word length is needed, too. Temporaries are allowed as
address (operand) only. See line 4 or 8 in IR Superblock 1.
Conditional branches are used in the form of if(tn){info} goto y, where
tn is a 1-bit temporary variable and y is the branch destination address.
info gives some additional information about the branch operation. For
example, on line 32, one can find such a branch operation. In this case,
the keyword Boring indicates the branch as an ordinary branch operation.
Dirty Helper provides function calls for the tool. It is not trivial to implement
complex functions in IR code. The dirty helper commands call C functions
inside the tool so that the programmer comfortably can use C language
syntax for analysis functions (see the example given in Figure 8.4).
Additional information is the IR instructions that do not affect the program
behavior. However, they provide useful information about the code for
the instrumenting tool, such as, IMarks that provide the address and the
length of machine instruction.
A Valgrind tool is allowed to arbitrarily modify the code. Of course, the program semantics should not be affected. For instance, if the Helgrind+ tool wants
to monitor all read/write accesses, it has to insert its own analysis code before
or after each load or store operation. Figure 8.4 provides an example: A simple
tool counts the number of jump conditions evaluated to true. What we need is
to insert an analysis function by the Dirty Helper command before each jump
instruction and pass the condition temporary as a parameter to the function.
The function represented by Dirty Helper (line 32) checks the value of the condition at runtime and increments a counter, if appropriate. Line 32 depicts the
function inserted by Dirty Helper.
As with machine code, IR function calls are not easy to identify. Additionally,
loading dynamic functions is platform dependent and varies for each platform.
Valgrind’s workaround for this problem is to overwrite some specific library
functions with help from the operating system3 . Thus, by calling a library
3
LD PRELOAD environment variables.
98
Chapter 8. Implementation of Helgrind+
26
27
28
29
30
31
32
33
34
PUT(60) = 0x8048418:I32
t52 = CmpEQ32(t22,0x0:I32)
t51 = 1Uto32(t52)
t50 = t51
t53 = 32to1(t50)
t45 = t53
DIRTY 1:I1 ::: countTrueConds{0x38019600}(t45)
if (t45) goto {Boring} 0x804843A:I32
goto {Boring} 0x804841A:I32
Figure 8.4.: Instrumented IR code.
function, a Valgrind function is called instead of the actual library function.
Valgrind receives the function calls together with parameters at runtime.
8.3. Shadow Memory
Shadow memory [33] is used by many tools including Helgrind+ . Using shadow
memory, a tool manages the meta data (e.g. vector clock of last access) about
each word of memory which will be used for program analysis. The program
itself, which is going to be analyzed by the tool, does not know about the shadow
memory.
The implementation of shadow memory in Helgrind+ is done by a two stage
table, similar to page tables in virtual memory management. Assume addr is a
memory address in the user program. To determine the related shadow value
of addr, a part of addr, exactly the high level 16 bits are considered as an index
for the first table, that points to a second table. In the second table the low 16
bits of addr are used as an index to locate the actual shadow value. The second
table will be allocated if it is needed. This simple structure facilitates some
optimizations, i.e. fast access to multi byte operations and compact shadow
values.
Furthermore, there are shadow registers for hardware registers available to
Helgrind+ similar to other tools. They are used for internal purposes and can
be read and written only by tools. Valgrind keeps the registers and shadow registers during thread switches. Tools are able to access only the shadow values
of the current active thread.
Helgrind+ has to maintain state information not only for each thread, but also
for each data used by the program. As Helgrind+ is unaware of high level data
structures, it can only operate on memory locations with byte level granularity.
99
Chapter 8. Implementation of Helgrind+
State information about memory locations is stored with shadow memory. For
every byte of memory used in the program, a shadow word is stored. Valgrind
provides an extra memory pool for the shadow memory and other data structures
such as mutex or thread segment information so that Helgrind+ ’s data will not
mix with the data of the program. Tools may use 32-bit shadow words, which is
too small for our race checker, so we use 64-bit shadow memory. We explain the
structure of 64-bit shadow word used by Helgrind+ in the following sections.
8.3.1. Shadow memory for MSM-long
Our extended memory state machine for long-running applications, MSM-long,
has eight different states. In the state Shared-Modified2, both lockset and thread
segment information is stored. Therefore, Helgrind+ uses a 64-bit shadow word
for each memory location. Figure 8.5 demonstrates the structure of the 64-bit
shadow words in different states.
New
0
…
…
Exclusive-Write
1
TSID
…
Exclusive-Read
2
TSID
…
Exclusive-ReadWrite
3
TSID
…
Shared-Read
4
…
threadset
lockset
Shared-Modified1
5
…
threadset
lockset
Shared-Modified2
6
TSID
threadset
lockset
Race
7
…
…
Figure 8.5.: Structure of 64-bit word shadow value and state encoding for
MSM-long
The three most significant bits of the 64-bit shadow value are used to encode
the state (0 - 7). The interpretation of the other bits depends on the state.
Three bytes are used to store the thread segment identifiers in exclusive states
and Shared-Modified2. In the exclusive states, the second 32-bit word is unused.
Lockset information is stored in the four least significant bytes (second 32-bit
100
Chapter 8. Implementation of Helgrind+
word) of shared states. The states New and Race use three bits only to store
encoded state. If a memory location is in an exclusive state, the thread segment
ID of the last access is stored. The lockset is not initialized unless one of the
shared states is reached.
Moreover, a fixed heap provides structures that require dynamic allocation during runtime to avoid dynamic memory allocation. These structures include
condition variable and mutex information, as well as thread segments. Reference counting is used to determine which segments are free and is no more
referenced; a simple garbage collection algorithm returns unused segments back
to the heap.
8.3.2. Shadow memory for MSM-short
As Figure 8.6 shows, Helgrind+ takes advantage of 64-bit shadow values for
memory states for short-running applications. Bits are used differently in different states. The state is stored in the first three bits. Not all information
is relevant in each state. Threadsets, for example, are not tracked in exclusive
states, so we do not need to store them in these states. A thread segment identifier is stored in the remaining bits of the first 32-bit word; candidate lockset
and threadset are stored in the second 32-bit word.
New
0
…
…
Exclusive-Write
1
TSID
…
Exclusive-Read
2
TSID
…
Shared-Read
3
TSID
threadset
lockset
Shared-Modified
4
TSID
threadset
lockset
Race
5
…
…
Spin
6
…
…
Figure 8.6.: Structure of 64-bit word shadow value and state encoding for
MSM-short
We use the state Spin for the spinning read loop detection and assign it to the
special value of spin, if the variable is used for spinning read loops (similarly,
the state Spin is used for shadow memory of MSM-long).
101
Chapter 8. Implementation of Helgrind+
Shadow values in Helgrind+ double the space overhead compared to tools that
use 32-bit shadow value. But there are several optimizations that could reduce
the memory overhead in Helgrind+ , as 64 bits are needed in only two states.
8.4. Control Flow Analysis
A challenge during the instrumentation process is the control flow dependency
that results in Control Flow Graphs (CFG) for identifying loops. The control
flow analysis is done on the fly and based on Valgrind’s suprblocks in IR. A
superblock includes up to three basic blocks and contains a next pointer to
the successive superblock. Superblocks symbolize the nodes with a maximum
outdegree of four. Normally, loops are identified by finding a cycle within the
CFG. This is done by a depth-first search with the limited depth of n (number of
superblocks), which could be set by the command line –CFG = n in Helgrind+
.
Valgrind instruments a program block by block at runtime. We construct the
control flow graph on the fly based on the executing superblocks and analyze
their instructions. Thus, the complete control flow graph for the whole program
is not available. Since loops are converted to conditional branches in IR code,
we have to analyze all branches at IR level to find loops.
8.4.1. Branch Analysis
As each branch could belong to a loop, we have to check all of them in IR. At
first, we determine the jump destination addresses to identify the loop body.
Figure 8.7 shows a branch that is part of a while-loop in machine code and the
corresponding IR. We have to search for a conditional branch at the end of the
superblock, because Valgrind ends superblocks directly after an IR branch.
In Figure 8.7, the conditional branch in machine code at line 6 corresponds
to the conditional branch in IR-Code at line 19. Surprisingly, the destination
address is not 0x8048732 as in machine code, but 0x8048755. This is because
Valgrind could invert the conditional branches. For this reason, the condition of
IR branch is inverted and the destination jump address is exchanged with the
address of next superblock (0x8048755). In the example provided, you find the
absolute jump destination address 0x8048732 at line 20.
Generally, there are two kinds of IR branches: direct an inverted. Figure 8.8
compares them. The difference is that in a inverted branch the destination
address of the jump instruction (if (t5)goto) is the next pointer (beginning
102
Chapter 8. Implementation of Helgrind+
1
2
3
4
5
1
2
3
4
5
6
7
8048732: # First instruction
of loop body
...
804874b: cmp
0x1,%eax
804874e: setne %al
8048751: test
%al,%al
8048753: jne
8048732 <-8048755: # First instruction
after the loop
6
7
8
9
10
11
12
13
14
15
(a) Machine cod of a conditional branch.
16
17
18
19
20
...
[ before is register eax used
an in t8 stored.]
---- IMark(0x804874B, 3) ---IR-NoOp
---- IMark(0x804874E, 3) ---t1 = CmpNE32(t8,0x1:I32)
t2 = 1Uto8(t1)
PUT(0) = t2
---- IMark(0x8048751, 2) ---PUT(32) = 0xD:I32
t3 = 8Uto32(t2)
PUT(36) = t3
PUT(40) = 0x0:I32
PUT(44) = 0x0:I32
---- IMark(0x8048753, 2) ---PUT(60) = 0x8048753:I32
t4 = And32(t3,0xFF:I32)
t5 = CmpEQ32(t4,0x0:I32)
if (t5) goto 0x8048755:I32
goto 0x8048732:I32
(b) IR code of the same conditional branch
(the code is simplified for more readability).
Figure 8.7.: A conditional branch in IR.
address of the next superblock). The reason of having inverted branches is the
limitation of IR instructions that not every condition could be directly formulated. There is no specific command for testing an unequal condition (e.g. jne
as in machine code). Valgrind negates the condition and exchanges the jump
destinations.
Overall, the absolute destination address and the branch distances are determined in both cases . If the branch is not taken the execution continues to the
next instruction right after the branch instruction. It is also possible to calculate the address of this instruction. The loop body is located between these two
addresses.
8.5. Instrumenting Loops in IR
For each conditional branch at the IR level, we have to examine if they are part
of synchronization with inter-thread event notification (condition variables) or
belongs to a spinning read loop.
103
Chapter 8. Implementation of Helgrind+
···
-- IMark (0 x48A00 , 2) -t5 = CmpEQ32 ( t4 , 0 x0 )
i f ( t5 ) goto 0 x6B008
goto 0 x48A02
# next
···
-- IMark (0 x48A00 , 2) -t5 = CmpEQ32 ( t4 , 0 x0 )
i f ( t5 ) goto 0 x48A02
goto 0 x6B008
# next
-- IMark (0 x48A02 , 3) -# next superblock
···
-- IMark (0 x48A02 , 3) -# next superblock
···
···
···
-- IMark (0 x6B008 , 3) -# branch destination
···
-- IMark (0 x6B008 , 3) -# branch destination
···
Figure 8.8.: IR branches: left side direct branch and and right side inverted
branch.
We applied our algorithm explained in Section7.2.3 for spinning read loop detection to all temporaries, addresses, and registers in IR. We considered loops up
to seven Valgrind’s superblocks. If the branch condition (a condition temporary
e.g. t5) depends on a register that is target of a load instruction (this could
be done by the Ld instruction) and the loading address stays constant within
the loop body, this branch is a candidate for a spinning read loop. Then, it is
instrumented and the instrumenting function is inserted by a Dirty Helper with
the condition temporary as parameter.
Example for Instrumenting a Spinning Read Loop
Figure 8.9 provides a simple example of an instrumented spinning read loop.
The machine code is translated into three superblocks by Valgrind. The first
superblock starts at the address 0x400718 for the jmp instruction and the second
one at the address 0x40071a for callq instruction, which is a function call to
a dynamic loaded library. For the sake of simplicity, we only show the third
superblock beginning at the address 0x40071f, where a spinning read loop is
detected.
The detected spinning read is located at the address 0x40071f. The required instrumentation functions S T A R T _ S P I N _ R E A D I N G / S T O P _ S P I N _ R E A D I N G are inserted
at the proper place for the related instructions (lines 1 and 5). The memory
104
Chapter 8. Implementation of Helgrind+
1
1
2
3
4
5
...
while (spinlock != 0){
sched_yield();
}
...
2
3
4
5
6
7
...
400718:
40071a:
40071f:
400725:
400727:
...
jmp
callq
mov
test
jne
40071f <main+0x34>
4005a0 <sched_yield@plt>
0x20091b(%rip),%eax <-%eax,%eax
40071a <main+0x2f>
(a) Spinning read loop.
(b) Spinning read loop - machine code.
1
1
2
3
4
5
6
7
8
9
10
11
12
13
14
15
16
17
18
19
20
21
22
23
-- IMark(0x40071F, 6) -t5 = LDle:I32(0x601040:
I64)
t13 = 32Uto64(t5)
t4 = t13
PUT(0) = t4
-- IMark(0x400725, 2) -t3 = GET:I32(0)
PUT(128) = 0x13:I64
t14 = 32Uto64(t3)
t6 = t14
PUT(136) = t6
PUT(144) = 0x0:I64
-- IMark(0x400727, 2) -PUT(168) = 0x400727:I64
IR-NoOp
t17 = Shl64(t6,0x20:I8)
t16 = CmpEQ64(t17,0x0:
I64)
t15 = 1Uto64(t16)
t12 = t15
t18 = 64to1(t12)
t7 = t18
if (t7) goto {Boring} 0
x400729:I64
goto {Boring} 0x40071A:
I64
2
3
4
5
6
7
8
9
10
11
12
13
14
15
16
17
18
19
20
21
22
23
24
25
26
(c) Spinning read loop - IR code.
DIRTY 1:I1 ::: S T A R T _ S P I N _ R E A D I N G {0
x380054b0}()
---- IMark(0x40071F, 6) ---DIRTY 1:I1 ::: E V H __ M E M _ H E L P _ R E A D [
rp=1]{0x38010440}(0x601040:I64)
t5 = LDle:I32(0x601040:I64)
t13 = 32Uto64(t5)
t4 = t13
PUT(0) = t4
DIRTY 1:I1 ::: S T O P _ S P I N _ R E A D I N G {0
x380054c0}()
---- IMark(0x400725, 2) ---t3 = GET:I32(0)
PUT(128) = 0x13:I64
t14 = 32Uto64(t3)
t6 = t14
PUT(136) = t6
PUT(144) = 0x0:I64
---- IMark(0x400727, 2) ---PUT(168) = 0x400727:I64
IR-NoOp
t17 = Shl64(t6,0x20:I8)
t16 = CmpEQ64(t17,0x0:I64)
t15 = 1Uto64(t16)
t12 = t15
t18 = 64to1(t12)
t7 = t18
if (t7) goto {Boring} 0x400729:I64
goto {Boring} 0x40071A:I64
(d) Spinning read loop - instrumented IR code.
Figure 8.9.: Example of spinning read loop.
state machine (MSM) traces every read access, whether a spinning read or a
normal read operation happens( E V H __ M E M _ H E L P _ R E A D , line 3).
For the case of synchronization with inter-thread event notification, we have
to instrument while-loops which enclose a call to the wait() library function.
105
Chapter 8. Implementation of Helgrind+
The loop condition is usually not very complex (e.g. a flag or a function call)
and the loop body often only contains a call to wait() at the beginning. This
means that the branching distance is short. We consider branches up to ten
basic blocks (approximately equal to ten function calls and branch distances up
to 2000 instruction bytes). In the next step, we look inside the loop body and
determine whether there is a call to wait(). Helgrind+ searches for branches to
the wait() address in the loop body. An example deals with inter-thread event
notification and wait() function call which is described in Section 8.5.2.
8.5.1. Look Ahead Instrumentation
Valgrind instruments a program block by block and just-in-time at runtime.
Only the piece of code is instrumented that is actually going to be executed.
If the program reaches at point that is not instrumented, Valgrind reads a
machine code block (superblock) instruments it, and lets the program executes
the instrumented code. The instrumentation is done dynamically on the fly.
As before mentioned, the instrumentation itself is divided into three steps: A
disassemble step, which the machine code is translated into an independent
platform intermediate language (IR). The step for IR instrumentation that the
analyzing tool e.g. Helgrind+ instruments the IR code, and the last step resynthesize, where the instrumented IR code is translated back to machine code.
Helgrind+ receives the program code piecewise in form of superblocks. It instruments the superblock immediately and gives it back to Valgrind.
However, during instrumentation, information about a superblock not yet instrumented/executed might be needed. For example, when instrumenting the
loop branch, it has to be clear if the loop body contains wait() function calls
(we would not ignore wait-function calls, as discussed in Section 6.6). At the
time of instrumenting the branch, the loop body is not yet executed – exactly
this information is missing. Another example concerns loop identification: If
we consider the executing superblock only, it may not be possible to identify
the loops. We may need the information about not yet instrumented/executed
superblocks to locate the branch destination. For this reason, we extended Valgrind for look ahead instrumentation, so that Helgrind+ can request Valgrind to
translate an arbitrary machine code block into IR at any time. So, Helgrind+
is able to analyze not yet instrumented/executed superblocks.
The only prerequisite for the look ahead instrumentation is that the branch
addresses in machine code should be known. Unfortunately, this is not always
the case. For example, in the x86 architecture, function pointer calls need an
offset which is specified at runtime and based on this offset the absolute function
106
Chapter 8. Implementation of Helgrind+
address is calculated. We mark and instrument these function calls and then,
we perform a runtime analysis when the function actually executes. Section
8.5.2.1 discusses how to deal with function pointers and solve this problem.
8.5.2. Identifying Function Calls in IR
After finding the loop boundaries during instrumentation, we search for library
function calls within the loop body. We use also look ahead instrumentation
for dynamic function calls. Normally, calling a function of a dynamic library
requires the following three steps:
• Function parameters and function return address are stored according to
the calling convention on the stack or in special registers.
• A function stub is called which represents the dynamic library function.
This function stub is located in PLT (Procedure Linkage Table) of the
Linux ELF file [11].
• The function stub determines the absolute address of the library function.
It stores the address in GOT (Global Offset Table). Future function calls
directly jump to the address stored in GOT.
!!!"#!$
%%%%%%%%%%%%%%%%%%%%%%%%%%
!!! &'()
!!!''*)' & ''
!!! &')'(*)
!!!''(+' & '()
!!! &' '),
-!!!&() -!!! &' ',
-!!! &'& -!!!
!!! &')'.(
Figure 8.10.: Calling a dynamic library function.
The entries in GOT table are also known as jump slots. In the Linux ELF file,
the jump slots and corresponding function names are listed in a table called
relocation table. We extended Valgrind in a way that is able to read out the
107
Chapter 8. Implementation of Helgrind+
relocation table of a Linux ELF file. We implemented this function for x86 and
amd64 ELF types. Thus, the function call is identified, when a jump slot entry
is read and an indirect branch to the value of the read jump slot is done.
Figure 8.11 depicts a complete function call of pthread cond wait(): lines 1, 2, 5
and 6 calculate the value for the stack pointer. By lines 3, 4 and 7, the processor
pushes both parameters for the function call and the return address on the stack.
Line 8 loads the value of the jump slot entry. At line 9, the processor jumps
on the loaded address. The address of the jump slot entry on stack indicates
that the function call is pthread cond wait(). By calling the dynamic function
call pthread cond wait(), a new superblock starts.
1
2
3
4
5
6
7
8
9
t6 = GET:I32(16)
t5 = Add32(t6,0x4:I32)
STle(t5) = 0x8049A10:I32
STle(t6) = 0x80499E0:I32
t7 = Sub32(t6,0x4:I32)
PUT(16) = t7
STle(t7) = 0x80486E1:I32
t3 = LDle:I32(0x8049980:I32)
goto {Boring} t3
<-- address of p t h r e a d c o n d w a i t ().
Figure 8.11.: Function call of pthread cond wait() in IR.
In case of inter-thread event notifications, the wait() function might be skipped
and not executed (lost signals). Thus, ahead instrumentation is applied to locate
the wait() function call within the loop body. The next step after finding the
wait() function call is to specify the parameters of wait() function. These parameters determine the starting point of hb-relation (the signaling side of a waiting
thread). The parameters are only known at runtime during the execution of
function. Thus, we simulate the loop body and a portion of the stack/registers
to determine these parameters. For instance, in Figure 8.11 between lines 8 and
9 the instrumenting functions for stack simulation will be inserted.
The simulation is done at IR level and does not affect the program semantics at
all. During the simulation, all temporaries are renamed so that the arithmetic
operations stay safe for the actual execution later on. No store operation is
executed and the memory accesses are carefully handled. In this way, we are
able to determine the parameters independent of the evaluation of the loop condition even if the whole loop-body is skipped. However, this technique does not
work well for few cases which need additional runtime information (e.g. when
parameters are on the heap). When we are not able to extract the parameters
during the instrumentation, the loop in superblock is instrumented and we com-
108
Chapter 8. Implementation of Helgrind+
plete afterwards the hb-relation at actual runtime based on the data dependency
analysis.
8.5.2.1. Function Pointers
Function pointers are used by unpredictable function calls, which are mainly
used in C++ (see the keyword virtual). They are not easy to handle during
instrumentation, because the absolute function address is first known at runtime.
Figure 8.12 lists an example of a C++ function pointer and the machine code4 .
1
2
3
int test(void){
return (spin != 0);
}
4
5
6
7
2
main() {
...
int (*test_func) (
void) = &test;
8
9
10
11
12
13
1
3
4
5
6
7
while (test_func()){
sched_yield();
}
...
}
8
9
10
...
40073a:
400741:
400742:
400744:
400749:
40074d:
40074f:
400751:
...
movq
0x4006eb,-0x8(%rbp)
00
jmp
400749 <main+0x44>
callq 4005a0 <sched_yield@plt>
mov
-0x8(%rbp),%rax
callq *%rax
<-test %eax,%eax
jne
400744 <main+0x3f>
(b) Machine code of the main() function.
(a) Call to a function pointer.
Figure 8.12.: Example of call to function pointer.
At the address 0x400749 (line 6, the content of a local variable is loaded into
the accumulator %rax. Then in line 7 at the address 0x40074d, a function call
gets issued and rax is interpreted as a function pointer address. Generally,
it is not possible to know the address referenced by a function pointer during
instrumentation. In the example given, the content of the function pointer will
be assigned at runtime by the given address (0x4006eb) at line 2. Valgrind
creates three different superblocks for this example: A superblock at address
0x40073a. Another superblock after the function call callq beginning from
address 0x40074f; and the function test() itself also fits in a new superblock.
For the sake of simplicity, we show only the first superblock created at address
0x40073a in Figure 8.13 (a).
First, our algorithm identifies the loading function pointer at address 0x400749
line 6 in the IR code. Then, it detects the actual spinning read loop happening
4
Only the machine code of main() function is listed.
109
Chapter 8. Implementation of Helgrind+
1
2
3
1
2
3
4
5
6
7
8
9
10
11
12
13
14
15
16
17
18
19
-- IMark(0x40073A, 8) -t6 = GET:I64(40)
t5 = Add64(t6,0xFFFFFFF8:
I64)
STle(t5) = 0x4006EB:I64
-- IMark(0x400742, 2) --- IMark(0x400749, 4) -PUT(168) = 0x400749:I64
t7 = Add64(t6,0xFFFFFFF8:
I64)
t9 = LDle:I64(t7)
PUT(0) = t9
-- IMark(0x40074D, 2) -PUT(168) = 0x40074D:I64
IR-NoOp
t11 = GET:I64(32)
t10 = Sub64(t11,0x8:I64)
PUT(32) = t10
STle(t10) = 0x40074F:I64
t12 = Sub64(t10,0x80:I64)
goto {Call} t9
(a) Call to function pointer (first
superblock of the example in Figure 8.12).
4
5
6
7
8
9
10
11
12
13
14
15
16
17
18
19
20
21
22
23
24
25
DIRTY 1:I1 :::
S E T _ C U R R E N T _SB_ A N D _UC[rp=1]{0
x380066e0}(0x404B52CB0:I64)
-- IMark(0x40073A, 8) -t6 = GET:I64(40)
t5 = Add64(t6,0xFFFFFFF8:I64)
DIRTY 1:I1 ::: E V H __ M E M _ H E L P _ W R I T E
[rp=1]{0x380106c0}(t5)
STle(t5) = 0x4006EB:I64
-- IMark(0x400742, 2) -DIRTY 1:I1 ::: S T A R T _ S P I N _ R E A D I N G
{0x380054b0}()
-- IMark(0x400749, 4) -PUT(168) = 0x400749:I64
t7 = Add64(t6,0xFFFFFFF8:I64)
DIRTY 1:I1 ::: E V H __ M E M _ H E L P _ R E A D [
rp=1]{0x380103a0}(t7)
t9 = LDle:I64(t7)
PUT(0) = t9
DIRTY 1:I1 ::: S T O P _ S P I N _ R E A D I N G {0
x380054c0}()
-- IMark(0x40074D, 2) -PUT(168) = 0x40074D:I64
IR-NoOp
t11 = GET:I64(32)
t10 = Sub64(t11,0x8:I64)
PUT(32) = t10
DIRTY 1:I1 ::: E V H __ M E M _ H E L P _ W R I T E
[rp=1]{0x380106c0}(t10)
STle(t10) = 0x40074F:I64
t12 = Sub64(t10,0x80:I64)
goto {Call} t9
(b) Call to function pointer - instrumented IR
code.
Figure 8.13.: Example of call to function pointer - IR code.
in the test() function, since the address of each load operation within the loop
is constant.
We instrument each superblock containing a function pointer at the beginning
with the analysis function S E T _ C U R R E N T _SB_ A N D _UC as shown in Figure 8.13(b).
Therefore, we are able to trace the function pointer and extract the exact address at runtime to handle unpredictable function calls. If any spinning read
is detected the functions S T A R T _ S P I N _ R E A D I N G / S T O P _ S P I N _ R E A D I N G are inserted
as before.
110
Chapter 8. Implementation of Helgrind+
Furthermore, the functions E V H __ M E M _ H E L P _ R E A D / E V H __ M E M _ H E L P _ W R I T E are used
by the memory state machine (msm) to check whether the executing read/write
operation is a spinning read or a counterpart write.
8.6. Data Dependency Analysis
We use runtime data dependency analysis to construct the correct hb-relation
between corresponding synchronization parts as described in the previous chapters. After executing each instruction in IR, we have to specify the set of all
variables written or read by that instruction and identify data dependencies.
In fact after executing the instruction a, we determine the sets a.use, the read
locations5 by instruction a, and a.def, the written locations by instruction a.
Valgrind translates each machine instruction into a sequence of IR instructions.
Every IR instruction is either an arithmetic operation or a load/store operation
for a register or memory address. Results and operands are stored in temporaries
in each case, as earlier mentioned. Considering the temporaries, we are able to
construct the computation tree of each IR instruction and extract the existing
data dependencies. Data dependencies for temporaries are stored only for a
limited period of time, since temporaries do not exist outside their superblock.
An example is provided in Figure 8.14: On the left side in IR code, lines 3 and
5, two variables are loaded form the stack and then added at line 6. Then,
the result is pushed on the stack at line 8. The addresses come from the value
of stack pointer at line 1 adding with different offset at lines 2, 4 and 8. On
the right side of the figure, the computation tree for the example is depicted.
The dashed lines indicate address calculations, whereas data nodes are linked
by solid arrows. The numbers in the nodes are the line numbers given by IR
code.
The algorithm to obtain the sets of a.def and a.use is simple: Each time when a
write command in IR is executed (ST for main memory and PUT for registers), we
look in the computation tree for data nodes with a load command (LD for main
memory and GET for registers). The locations written by a write command are
assigned to a.def, whereas the locations read by a load command build a.use.
5
As location is meant a main memory location or a register, identical to a variable as in high
level programming languages.
111
Chapter 8. Implementation of Helgrind+
1
2
3
4
5
6
7
8
t14 = GET:I32(20)
t13 = Add32(t14,0xFFF4:I32)
t15 = LDle:I32(t13)
t12 = Add32(t14,0xFFF8:I32)
t11 = LDle:I32(t12)
t10 = Add32(t11,t15)
t16 = Add32(t14,0xFFF0:I32)
STle(t16) = t10
2
Add
4
Add
3
LD
5
LD
1
Get
7
Add
6
Add
8
Store
Figure 8.14.: IR code and the corresponding computation tree.
8.7. Limitations
For the implementation, we have considered the library function calls with the
calling convention in Linux. For other platforms, we have to adjust our implementation. However, the presented methods and techniques for detecting loops
and condition variables are at IR level and independent of a specific platform.
When using nested loops or nested conditions, it may not be easy to find the
spinning read loop. Figure 8.1 depicts an example of a nested spinning read loop.
The implementation of our algorithm handles such cases as ordinary loops: Each
loop is processed as long the loop body is small enough (3-7 superblocks). If
the spinning read loop is identified, then it is instrumented.
...
/* synchronization */
while( FLAG1 ) {
while( FLAG2 ) {
while( FLAG3 ) {
/* do_nothing */
}
}
}
/* do something... */
do_something();
...
Listing 8.1: A nested spinning read loop.
If there are many nested loops and loops get bigger than the preset threshold (seven blocks) then the loop might not be identified. Certainly, one could
112
Chapter 8. Implementation of Helgrind+
increase the threshold for the number of blocks to be analyzed during loop detection, which might increase the overhead. However, such big nested loops are
rarely used as spinning reads.
Listing 8.2 depicts a multi conditions while-loop that FLAG2 is evaluated only if
FLAG1 is true. The while-loop calls the wait() function. In machine code level,
such while-loops are converted into nested loops, similar as the above example;
they are handled in the same way. Each loop is processed if it is small enough
and the end of each loop is considered as the ending synchronization point.
while( FLAG1 && FLAG2 ) {
p t h r e a d c o n d w a i t (...)
}
Listing 8.2: Multi-conditions evaluation.
113
Chapter 8. Implementation of Helgrind+
114
Chapter 9.
Experiments and Evaluation
In this chapter, we present our experiences with Helgrind+ and evaluate our
approach by applying it to a number of various applications and benchmarks.
Both memory state models, MSM-long and MSM-short, are evaluated. While
MSM-short is sensitive and reports immediately a race as soon as it is detected,
MSM-long is less sensitive and waits for the reoccurrence of a race in some
situations. The new feature for synchronization with inter-thread event notifications is tested. Then, identifying ad-hoc synchronizations in programs is
evaluated. Finally, results of Helgrind+ as a universal race detector (neglecting
library information) are presented and discussed.
9.1. Experimental Setup
All experiments and measurements in this chapter were conducted on a machine with 2x Intel XEON E5320 Quadcore CPUs at 1.86GHz, 8 GB RAM,
running Linux Ubuntu 8.10.1 x64. All programs use POSIX Threads or GNU
OpenMP for parallelization. The programs were compiled with GCC 4.2 for
x64 architecture. We did not annotate any source code.
Each program was executed 5 times to lessen the effect of random schedules
during our measurements. Average values are presented with maximum and
minimum values in some cases. For the experiments, we employed different
existing detectors such as the commercial tool Intel Thread Checker 3.1 [1] or
the open source happens-before race detector DRD [47] to compare Helgrind+
against them.
115
Chapter 9. Experiments and Evaluation
9.2. Results
We applied our approach on various benchmarks suites. The first experiment
with Helgrind+ was the analysis of SPLASH-2 benchmarks [43] and several
multi-threaded programs, such as a parallel single source shortest path algorithm (sssp) or parallel Bzip, collected from our previous publications [38, 37].
The results show that the algorithm in Helgrind+ is able to reduce the number
of false positives without missing races [23]. In this section, we summarize the
results of two benchmarks: A unit test suite for race detectors, called data-racetest [46], and the recently released PARSEC benchmark [2].
9.2.1. Unit Test Suite
We applied Helgrind+ to programs provided in data-race-test [46], a unit test
suite for race detectors. The test suite aims to create a framework to check
a race detector and evaluate the effect of each test case on the tool. It provides more than 150 short programs (called unit test cases) that implement
different scenarios which could occur during execution of multi-threaded programs. The scenarios include tricky situations, which are difficult to discover
by race detectors. Currently, 120 of these unit test cases can be classified into
two main categories: 40 ”racy” programs that involve at least one data race,
and 80 ”race-free” programs. The remaining 30 programs are related to performance and stress testing. We examine and analyze the effect of each test
case on Helgrind+ . All test cases are implemented in C/C++ using PThreads
with a varying number of threads (2-32) and executed without any source code
annotation.
9.2.1.1. Evaluation of MSMs and Inter-thread Event Notifications
Table 9.1 shows the results of our experiment. The basic version of Helgrind+
based on MSM-short denoted by short+lib in Table 9.2 failed on 41 test cases
out of 120. The option lib denotes that Helgrind+ uses the library information
and intercepts PThreads synchronization primitive calls. It produces 33 false
positives and eight false negatives.
When using MSM-long which is less sensitive and optimized for long-running
applications, the false positives are reduced to 27 but on the other hand, the
false negatives increase to 9. This indicates that MSM-long, denoted by long+lib
is not adequate to find data races in short programs provided in the unit tests.
116
Chapter 9. Experiments and Evaluation
Tools
Helgrind+
short+lib
Helgrind+
short+lib+cv
Helgrind+
long+lib
Helgrind+
long+lib+cv
False
Positives
33
False
Negatives
8
FP+FN Passed
Cases
41
80
28
6
34
86
27
9
36
84
22
9
31
89
Table 9.1.: Results on the test suite data-race-test. FP and FN denote False
Positives and False Negatives, respectively. lib means interception of Pthread
library and cv enables correct interception of condition variables.
Applying the extended feature for correct handling of inter-thread event notifications increases the accuracy of Helgrind+ for both memory state machines,
and reduces the false positives and false negatives. Helgrind+ based on MSMshort with the extended feature denoted by short+lib+cv improves the results.
Since each unit test is a short program, the results are as expected. Activating
the lost signal detection and writ/read dependency analysis removes five false
positives and one false negative, i.e., 86 cases of 120 cases pass. Two test cases
provided in the unit test suite are similar to the example for spurious wake ups
provided in Figure 6.3; they are correctly passed, as we detect the write/read
dependency.
All test cases regarding lost signal detection are passed by enabling the cv option. Most cases that failed use ad-hoc synchronization defined by the programmer; Helgrind+ is not yet aware of them. Few false positives are difficult
to identify just by intercepting the synchronization primitives, since they do
not follow the standard pattern given for the use of synchronization primitives.
Also, few failed test cases are benign data races that should be suppressed.
9.2.1.2. Evaluation of Ad-hoc Synchronizations
We appleid Helgrind+ to the test suite, including checks for ad-hoc synchronization. The results are shown in Table 9.2. We only present the results for
Helgrind+ with MSM-short (considering the unit test cases as short-running
programs).
The basic version of Helgrind+ (lib) in Table 9.2, is only able to intercept
PThreada synchronization primitives. It fails on 41 test cases out of 120 and
117
Chapter 9. Experiments and Evaluation
produces 33 false positives with eight false negatives. The new feature spin(7)
activates spinning read loop detection of up to seven basic blocks. By identifying
ad-hoc synchronization, 24 false positives and one false negative are removed,
i.e., 106 test cases out of 120 pass. The removed false positives are all apparent
data races or synchronization data races that arise from using ad-hoc synchronization. The removed false negative is correctly identified: It was because of
spurious wake ups when using the same condition variable by several threads.
We consider spinning read loops from three up to seven blocks. All PThreads
synchronization primitives are intercepted by Helgrind+ .
Tools
Helgrind+ lib
Helgrind+
lib+spin(7)
Helgrind+
nolib+spin(7)
Helgrind+
lib+spin(3)
Helgrind+
lib+spin(6)
Helgrind+
lib+spin(7)
Helgrind+
lib+spin(8)
False
Positives
33
8
False
Negatives
8
6
FP+FN Passed
Cases
41
79
14
106
9
6
15
105
24
6
30
90
23
6
29
91
8
6
14
106
8
6
14
106
Table 9.2.: Results on the test suite data-race-test. lib means interception of
PThreads library; spin stands for spinning read detection with the given
number of basic blocks as a parameter.
A few failed test cases (false positives) use ad-hoc synchronization. However, it
is not easy to detect them, as they do not follow the standard pattern of spinning
read loops in the ad-hoc synchronization. They use nested or multi-conditional
loops. This is a limitation of our implementation that could be mitigated by
improving the algorithm and the implementation.
If we disable PThreads library support, synchronization primitives are no longer
intercepted and therefore unknown to Helgrind+ . In this case, the detector
acts as a pure happens-before detector and no library information is used. We
indicate this situation by nolib+spin(7) in the table. By this option, only one
additional test case fails (one false positive). However, we observe that the best
results are achieved when using the new feature as a complementary method to
118
Chapter 9. Experiments and Evaluation
our race detection algorithm (shown as lib+spin(7)).
The second part of Table 9.2 depicts the results when using a different number
of basic blocks for spinning read loop detection. By increasing the number of
basic blocks, the number of false positives are decreased considerably. We got
the best result with seven basic blocks. This is because the test suite uses
function templates and complex function calls. Thus, spinning read loops in
most test cases contain more than three basic blocks. Increasing the number of
basic blocks beyond seven did not improve the results further.
9.2.1.3. Comparing with Other Race Detectors
To Compare our results, we employed different race detectors for our measurements: The commercial tool Intel Thread Checker 3.1 [1] and a 64 bit version
of Helgrind 3.3.1 [45]. Both of them are hybrid race detectors based on lockset and happens-before analyses. Additionally, we compared Helgrind+ against
DRD [47], an open source happens-before race detector.
The results of Helgrind+ against Helgrind 3.3.1, show significant improvement.
38 more tests passed with Helgrind+ in the best case. This is because of the
Eraser-like memory state model used in Helgrind 3.3.1 which performs happensbefore analysis for one state only.
Tools
Helgrind+
long+lib+cv+spin(7)
Helgrind+
long+nolib+spin(7)
Helgrind+
short+lib+cv+spin(7)
Helgrind+
short+nolib+spin(7)
DRD 3.4.1
Helgrind 3.3.1
Intel Thread checker
3.1
False
Positives
7
False
Negatives
12
FP+FN Passed
Cases
19
101
6
10
16
104
8
6
14
106
9
6
16
105
12
40
15
20
12
21
32
52
36
88
68
84
Table 9.3.: Results of Helgrind+ and other dynamic race detectors on the test
suite data-race-test.
119
Chapter 9. Experiments and Evaluation
We compared the behavior of Helgrind+ with the commercial tool Intel Thread
Checker for the test suite. The false positives produced by Intel Thread Checker
are nearly twice against false positives produced by Helgrind+ . Intel Thread
Checker did not detect races in 21 test cases, whereas Helgrind+ overlooked
only six racy test cases using the option short+lib+cv+spin(7).
Deactivating PThreads library support (nolib), makes Helgrind+ works as a
happens-before detector. In addition, we compare our results against the results produced by DRD 3.4.1 [47], a pure happens-before detector. It achieves
considerably better results than DRD. In particular, the number of false negatives with DRD is more than twice than the false negatives with the option
short+nolib+spin(7). Having false negatives is a drawback of pure happensbefore detectors.
The results on unit tests confirm that Helgrind+ with the provided options is
able to discover masked races more accurately compared to other race detectors mentioned here. Especially when using Helgrind+ with the complementary
option for the spinning read detection (short+lib+cv+spin), the fault detection
ratio is promising for small and short-running applications.
9.2.2. PARSEC Benchmark Suite
We applied Helgrind+ to the recently released PARSEC 2.0 benchmark [3].
PARSEC is a benchmark for performance measurement of shared memory computer systems. It differs from other benchmark suites, as it is not HPC-focused.
It contains 13 programs from different areas such as computer vision, video
encoding, financial analytics, animation, physics and image processing. The
programs use different synchronization mechanisms, which makes the benchmark an ideal test case for race detectors. Table 9.4 provides a short summary
of the programs1 .
The PARSEC programs support different threading libraries. Most of them
use the standard POSIX Thread Library (PThreads) by default. freqmine
uses OpenMP, and vips uses Glib [26] functions for parallelization. Though
OpenMP and Glib use internally PThreads for their implementations, their
synchronization constructs are unknown to Helgrind+ and not supported. These
unknown synchronization constructs causes false positives.
PARSEC offers different input sets varying in size for the program executions.
We used the input sets simsmall for simulations and ran each program five
1
raytrace was added recently to PARSEC benchmark and comes with the new version.
We placed it as the last program in our evaluation order.
120
Chapter 9. Experiments and Evaluation
Program
blackscholes
bodytrack
canneal
dedup
facesim
ferret
fluidanimate
freqmine
streamcluster
swaptions
vips
x264
raytrace
Application
Domain
Financial Analysis
Computer Vision
Engineering
Enterprise Storage
Animation
Similarity Search
Animation
Data Mining
Data Mining
Financial Analysis
Media Processing
Media Processing
Visualization
Parallelization
Model
data-parallel
data-parallel
unstructured
pipeline
data-parallel
pipeline
data-parallel
data-parallel
data-parallel
data-parallel
data-parallel
pipeline
data-parallel
Input
Set
simsmall
simsmall
simsmall
simsmall
simsmall
simsmall
simsmall
simsmall
simmedium
simmedium
simsmall
simsmall
simsmall
Thread
Model
POSIX
POSIX
POSIX
POSIX
POSIX
POSIX
POSIX
OpenMP
POSIX
POSIX
Glib
POSIX
POSIX
Table 9.4.: Summary of PARSEC benchmarks.
times, averaging the results. For streamcluster and swaptions, we use
the simmedium input set, since the runtime with simsmall is too short for
our measurements.
Helgrind+ reports data races together with the program context of the second
unsynchronized access. If several races in the same program context happen,
Helgrind+ reports only the first race context. The numbers provided in the
following tables are distinct program code locations with at least one potential
data race that we call racy contexts.
PARSEC allows the setting to set the number of executing threads. We present
the result of executions with two threads for most cases. The empirical study by
Lu et al [27] implies that most concurrency bugs manifest themselves with only
two threads. Additionally, Valgrind schedules threads in a more fine-grained
way than the operating system would do. We assume that many races can
already be observed with two threads.
Table 9.5 lists runtime data about PARSEC benchmarks when executing only
with two threads. All numbers provided in the table for read/write instructions and synchronization primitives are totals across all threads. Numbers for
synchronization primitives include primitives in system libraries. Locks are all
lock-based synchronizations including read-write locks (rwlocks). Barriers are
barrier-based synchronizations, Conditions are waits on condition variables.
The authors of the PARSEC Benchmarks claim the programs to be race free, but
121
Chapter 9. Experiments and Evaluation
Program
LOC
blackscholes
bodytrack
canneal
dedup
facesim
ferret
fluidanimate
freqmine
streamcluster
swaptions
vips
x264
raytrace
812
10,279
4,029
3,689
29,310
9,735
1,391
2,706
1,255
1,494
3,228
40,393
13,302
Instructions (109 )
Reads
Writes
0.092
0.045
0.425
0.102
0.435
0.187
0.658
0.254
9.632
4.191
0.005
0.002
0.584
0.144
0.744
0.283
1.795
0.033
1.414
0.365
0.758
0.199
0.500
0.204
19.260
106.4
Synchronization Primitives
Lock Barrier
CV
0
2
0
35,849
215
90
88
0
0
18,436
0
3,536
10,460
0
1,795
6,660
0
10
923,750
0
0
78
0
0
146
12,998
34
78
0
0
10,575
0
2,698
1,339
0
157
867,339
0
3,862
Table 9.5.: Runtime data on PARSEC executed with two threads for input set simsmall except swaptions and streamcluster that are for
simmedium.
we cannot be absolutely sure od that. Under the assumption that the programs
are race free, the warnings produced by race detectors could be counted as false
positives. However, we discuss each racy context produced by Helgrind+ and
analyze them to see if they are true races or not.
Table 9.6 depicts the results of the experiments with two threads on Helgrind+
with the option for correct condition variables handling (lib+cv ). As before, lib
denotes the interception of PThreads (using library information). short or long
symbolizes the memory state machines MSM-short or MSM-long, respectively.
9.2.2.1. Programs without Using Condition Variables
Out of 13 programs in PARSEC, five programs i.e. blackscholes, fluidanimate,
freqmine, swaptions and canneal do not apply any inter-thread event notifications (condition variables). So, the extended option lib+cv for correct handling
of condition variables should not effect the results. This could be verified in the
upper part of Table 9.6. The number of warnings for these five programs are
constant whether this option is active or not.
122
Chapter 9. Experiments and Evaluation
Program
blackscholes
canneal
fluidanimate
freqmine
swaptions
bodytrack
dedup
facesim
ferret
streamcluster
vips
x264
raytrace
Helgrind+
short+lib short+lib+cv
0
0
1
1
0
0
149.2
151.4
0
0
21.2
15.6
1
0
85.3
81
111
2
3.6
2
48.2
46.6
103
28
88
82
Helgrind+
long+lib long+lib+cv
0
0
1
1
0
0
146.6
149.4
0
0
30.2
26.6
1
0
77.4
91.6
43.6
2
1
1
47.4
46.2
103
24.8
64
64
Table 9.6.: Number of racy contexts reported on PARSEC with two threads.
blackscholes The program blackscholes uses barriers for its synchronization.
Every synchronization operation is detected by Helgrind+ and no race is reported.
canneal The threads in canneal work also on separated data blocks and do not
produce races. However, an intentional data race is reported, on a variable used
for ad-hoc synchronizing. The race occurs in the function annealer_thread::
Run(), which is executed by all threads. All threads accomplish their work in
a spinning read loop. Threads check the global variable _keep_going as a flag
in each iteration to stop or continue to work (spin).
In fact, threads use a programmer-defined synchronization and communicate
through the variable with each other in a spinning read loop. The spin variable
_keep_going is changed only once and is set to false to indicate threads to
leave the loop. The intentional data race happens as a synchronization data race
which should be suppressed. We show in the upcoming results that Helgrind+
is able to remove this benign synchronization race successfully.
fluidanimate fluidanimate protects its critical regions with locks. No other
synchronization primitives are applied. Helgrind+ produces no warning for this
program.
123
Chapter 9. Experiments and Evaluation
freqmine freqmine uses OpenMP to parallelize the program. The Linux implementation of OpenMP uses synchronization operations that are unknown to
Helgrind+ and therefore, it cannot detect them. For this reason, many false
positives are reported, which increases when using more threads. We show
later that spinning read detection suppresses the false positives due to unknown
synchronization primitives of OpenMP.
swaptions In swaptions, there is only one code block where threads are created. Shortly after the creation, threads are joined. This means the main thread
waits till all worker threads finish their jobs, and then continues. The worker
threads are all working on separated data blocks. Helgrind+ does not generate
any false positive here.
9.2.2.2. Programs Using Condition Variables
The remaining programs in PARSEC use condition variables for synchronization
between threads. The lower part of Table 9.6 depicts the results for these
programs running with two threads.
bodytrack bodytrack uses mainly condition variables. However, bodytrack
implements its own synchronization functions ( signal /wait) for inter-thread event
notifications. Helgrind+ without ad-hoc synchronization detector is not able to
identify them. In their implementation, the POSIX variable cv is used for
sleeping (waiting) and wakening up (signaling) the threads. If a signal is sent
in this program, the signal() primitive of the PThreads library is not called, as
in the case of synchronization with a normal condition variable.
Our extension for correct handling of inter-thread event notifications based on
direct interception of the PThread primitives does not improve the results. Since
PThread primitives are used to implement ad-hoc synchronization (A more
abstract synchronization functions at a higher level). Therefore, the results
provided in Table 9.6 are as expected: Only minor improvement is achieved
because of write/read dependency analysis which makes the parameter cv more
recognizable. The high level synchronization functions implemented here will be
detected by enabling the option of Helgrind+ to detect ad-hoc synchronization,
as we show in the following section.
124
Chapter 9. Experiments and Evaluation
dedup dedup utilizes a task queue that divides the work between threads.
Each operation on task queue is correctly synchronized by a pair of signal/wait
primitives that are identified by the option lib+cv.
dedup is the only program in PARSEC that applies nested conditions in synchronization with condition variables. Such synchronizations may create multiple
ending synchronization points during loop detection (as we discussed in Section 6.6). Apparently, this causes no problem for Helgrind+ and by the enabled
option cv, all synchronizations by condition variables are correctly identified and
no false warning is reported.
facesim This program uses task queue as an ad-hoc synchronization to distribute work between threads. Locks and condition variables (signal/wait) of
the PThreads library are used to implement the task queue. In facesim, on each
access to the task queue, synchronization with signal/wait does not necessarily
happen.Our race detector can only detect that the task queue is protected by a
lock, but does not recognize the programmer-defined synchronization used for
data packets delivery through task queue. Thus, the option lib+cv does not
suppress the false positives because of the inconsistent synchronization use of
signal/wait.
ferret ferret uses also a task queue, but unlike facesim, each access to the
task queue is synchronized with condition variables (signal/wait). Before each
access, it is checked that the task queue is not empty or is not full. The option
lib+cv improves the results significantly; only two benign races remain: (1) a
variable is used as a flag to signal if the input is read completely, (2) a variable
is used as a counter for the input packets. Both variables are modified only once
by one thread and are read several times by other threads.
streamcluster In streamcluster, we detect five racy contexts by the option lib.
Three of them are apparent data races counted as false positives. Activating
the option cv removes these three apparent races (see Table 9.6).
The remaining two racy contexts are benign races: One is an intentional race2
that no synchronization happens between the initialization and the use of an
array in the program. The other benign race is when all threads write the same
value into a variable3 using ad-hoc synchronization.
2
3
streamcluster.cpp, Line 202 and Line 236
streamcluster.cpp, Line 275
125
Chapter 9. Experiments and Evaluation
vips vips uses the Glib, a synchronization library unknown to Helgrind+ .
Additionally, the functions in Glib are called by means of a global variable
which contains a collection of function pointers. Therefore, Helgrind+ with
lib+cv cannot detect the anonymous synchronization operations used in vips
and generates many false warnings.
x264 Most synchronization operations in x264 are detected by the option
lib+cv. However, some ad-hoc synchronizations are still hidden to Helgrind+ .
Without enabling the option cv for inter-thread event notification more than
1000 racy contexts4 are reported, whereas by activating this option only 28
remain.
By analyzing the warnings, we found benign races on some code blocks. Before
the main thread starts a new thread, the whole working context of the old thread
is copied by the main thread for the new thread5 . Each thread uses a part of his
working context as a local memory block. The copied data is not used by the
new thread, and will be initialized immediately. All reported races are harmless
which could be counted as false positives.
raytrace This program uses also a task queue as an ad-hoc synchronization
to divide tasks between threads. The synchronization primitives from PThreads
library i.e. locks and inter-thread event notifications (signal/wait) are used for
the implementation of the task queue. Accesses within the task queue, are
synchronized by the programmer-defined constructs. Helgrind+ with option
lib+cv detects that the task queue is protected. However, it cannot identify the
programmer-defined synchronizations within the task queue. Therefore, there
are still some false positives which Helgrind+ cannot suppress with this option.
In addition to the experiment above, we also provide the results of the same experiment with four threads. Table 9.7 lists the results for the option lib+cv with
four threads. Using four threads increases the number of false positives. Generally, by increasing the number of executing threads, the number of apparent
data races and synchronization data races will also increase.
Overall, Tables 9.6 and 9.7 have shown that the number of false warnings decreases when using the extended option cv for correct handling of inter-thread
event notifications.
4
5
Helgrind+ reports only the first 1000 racy contexts, the rest will be suppressed.
The copy operation is done within the function x264_thread_sync_context().
126
Chapter 9. Experiments and Evaluation
Program
blackscholes
canneal
fluidanimate
freqmine
swaptions
bodytrack
dedup
facesim
ferret
streamcluster
vips
x264
raytrace
Helgrind+
short+lib short+lib+cv
0
0
1
1
0
0
182.6
178.2
0
0
27
23.4
1
0
85.3
81
6
2
5.4
3.6
51
50.4
103
49
88
85.4
Helgrind+
long+lib long+lib+cv
0
0
1
1
0
0
170.4
173
0
0
35.8
28.2
1
0
85.3
81.2
6
2
5.2
3.4
49
47.4
103
41
82
82.4
Table 9.7.: Number of racy contexts reported on PARSEC benchmarks with
four threads.
9.2.2.3. Ad-hoc Synchronization and Unknown Synchronization
Operations
At least eight applications in PARSEC use explicit ad-hoc synchronization in
addition to standard synchronization primitives (locks, barriers and condition
variables). All programs except freqmine and vips use PThreads. In this
section, we present the results with Helgrind+ based on MSM-short for spinning
read loop detection (option spin).
The results of our experiments on PARSEC are demonstrated in Table 9.8.
Loops identified as a potential spinning read loop by our algorithm, are listed
in the third column. Compared to the basic versions of Helgrind+ with option lib or lib+cv, the number of warnings produced by activating the new
feature spin is reduced considerably, as expected. In case of dedup, facesim,
streamcluster, vips and raytrace, all false warnings are eliminated.
Two benchmarks, freqmine and vips, use unknown libraries: OpenMP and
Glib. The number of warnings decreases to eight and zero respectively. In x264
and dedup, the basic version of Helgrind+ produces more than 1000 warnings
(only the first 1000 warnings are reported by the tool), whereas with the new
feature (lib+cv+spin), all warnings for dedup are suppressed and only 32 warnings remain for x264. ferret generates only two warnings. All together, nine
out of 13 applications do not produce any warnings.
127
Chapter 9. Experiments and Evaluation
We examine the warnings generated by our race detector. All warnings are
benign races. The reasons for false warnings in some cases are synchronization
constructs such as a task queue implemented by the programmer in a different
way that does not match the spinning read loop pattern. For instance, consider
the program ferret that uses a task queue and contains two benign races:
A variable is used as a counter for input packets. A single thread modifies it,
while other threads read it without any synchronization. Another benign race
is a variable that is used as signal to indicate if the input is read completely. In
both cases, an obscure implementation is applied and the variables are not used
as a condition for a while loop.
Loops
Program
blackscholes
bodytrack
canneal
dedup
facesim
ferret
fluidanimate
freqmine
streamcluster
swaptions
vips
x264
raytrace
Total
Spins
28
303.4
152
116
1445
6301
161
207
100
144
583
383
199.4
8
79.2
43
32
171
219
34
87
37
36
329
199
77.2
Helgrind+
lib
0
21.2
0
1000
123.8
6
0
149.2
3.6
0
48.2
1000
88
Racy Contexts
Helgrind+
Helgrind+
lib+cv+spin nolib+spin
0
0
2
4
0
0
0
0
0
5
2
2
0
0
8.4
8.4
0
0
0
0
0
0
32.2
31.8
0
0
Table 9.8.: Number of potential racy contexts reported on PARSEC benchmarks with two threads.
If we disable PThreads support so that the detector works as a pure happensbefore detector based on identification of spinning read loops (nolib+spin), approximately the same results are achieved. The number of false positives increases only in two cases. The detector is not aware of the library information
and works as a universal race detector.
Overall, the results on various benchmarks confirm that Helgrind+ with the
new complementary feature is able to discover ad-hoc synchronization and synchronizations used from unknown libraries without modifying the program or
upgrading the race detector. The results are promising and acceptable for real
world applications, help programmers to focus on the real data races.
128
Chapter 9. Experiments and Evaluation
9.2.2.4. Comparison to other Dynamic Race Detectors
To validate our method, we also compared the results of our race detector on
PARSEC with other race detectors: a pure happens-before race detector DRD
3.4.1 and two hybrid race detectors: Helgrind 3.1.1 and Intel thread Checker.
Table 9.9 compares the results of Helgrind+ for MSM-short against the results
of other race detectors.
Program
blackscholes
bodytrack
canneal
dedup
facesim
ferret
fluidanimate
freqmine
streamcluster
swaptions
vips
x264
raytrace
Helgrind+
lib+cv+spin nolib+spin
0
0
2
4
0
0
0
0
0
5
2
2
0
0
8.4
8.4
0
0
0
0
0
0
32.2
31.8
0
0
DRD
3.4.1
0
31.4
0
0
1000
246.6
0
1000
1000
0
838.4
1000
1000
Helgrind
3.3.1
2
223.6
2
3
112.6
111
58
225.6
70
0
69.4
486.4
117
Intel
TC
0
13
4
0
0
0
0
1000
2
0
0
1
0
Table 9.9.: Comparing the number of potential racy contexts reported on PARSEC benchmarks for different race detectors. All programs are executed with
two threads.
The number of warnings with Helgrind+ are considerably smaller and only few
warnings as benign data races are reported. Best results are achieved when using
spinning read loop detection plus library interception (option lib+cv+spin).
Using spinning read loop detection (spin) alone causes Helgrind+ to behave as a
pure happens-before race detector. Number of warnings generated in this mode
compared to DRD as a happens-before race detector is significantly smaller.
DRD produces numerous false alarms – in some cases more than 1000 warnings.
Applying Intel Thread Checker (Intel TC) to PARSEC benchmarks generates
acceptable results. However, lib+cv+spin in Helgrind+ produces smaller number of warnings in most cases, compared with Intel TC. vips uses the Glib
library that is not supported by Helgrind 3.3.1 and DRD. This is why they
129
Chapter 9. Experiments and Evaluation
show many false alarms. They are not able to intercept synchronization function calls inside vips. The same happens in freqmine that uses OpenMP.
The outcome on PARSEC benchmarks shows that Helgrind+ reports races only
in cases where they actually occurred. If any correct synchronization is inferred
by Helgrind+ , no race is reported. Identifying unknown library calls removes
many false positives and makes real world applications easier to be handled by
programmers.
Putting all the results together, our empirical results have shown the correctness
of our hypotheses (Hypothesis 1 and Hypothesis 2 ) mentioned in Section 2.3. We
have demonstrated that there is a need to define the exact semantics of each
synchronization primitive for the detector and have an accurate race detection
algorithm. Our experimental data shows clearly that the presented algorithm
combines the lockset and happens-before analyses properly, and is able to reduce
the number of false positives and false negatives, compared to existing race
detectors. So, we prove our first hypothesis (Hypothesis 1 ).
Additionally, we have shown that it is possible to build a universal race detector,
which is not limited to a specific set of libraries. Our results confirm that
the universal race detector is able to detect different kinds of synchronization
operations, and thereby, we have shown the correctness of our second hypothesis
(Hypothesis 2 ).
9.3. Performance Evaluation
We measured the runtime behavior and the memory requirements of our detector
with different features on PARSEC benchmark. The extensions in Helgrind+
cause some reasonable overhead both in time and space. We compared the
overhead caused by our detector with other race detectors. All measurements
are average values of five executions with two threads using the simsmall or
simmedium inputs for the PARSEC programs. We used simmedium inputs
for streamcluster and swaptions, as the runtime with simsmall was
too short.
9.3.1. Memory Consumption
Firstly, we measured the memory usage of instrumented code executed by the
detectors. Figure 9.1 depicts the average memory consumption. The memory
consumption of Helgrind+ is approximately constant across different memory
states machines (Figure 9.1(a)). There is some overhead caused by the extended
130
Chapter 9. Experiments and Evaluation
Average Memory Consumption [MB]
8000
HG++ lib+long
HG
lib+short
+
HG lib+long+cv
HG+ lib+short+cv
7000
6000
5000
4000
3500
3000
2500
2000
1500
1000
500
0
bla
bo
ck
fac
dy
sc
tra
ho
es
im
ck
les
fer
ret
fre
sw
qm
flu
ap
tio
ine
vip
ida
s
nim
ns
x2
64
ca
de
nn
ea
du
p
l
ate
str
ray
ea
tra
mc
ce
lus
ter
(a) Memory consumption for different memory state machines
Average Memory Consumption [MB]
8000
Intel TC 3.1
Helgrind 3.3.1
HG++ lib+long+cv
HG lib+short+cv
7000
6000
5000
4000
3500
3000
2500
2000
1500
1000
500
0
bla
bo
ck
fac
dy
sc
tra
ho
es
im
ck
les
fer
ret
fre
sw
qm
flu
ap
tio
ine
vip
ida
s
nim
ns
x2
64
ca
de
nn
ea
du
p
l
ate
str
ray
ea
tra
mc
ce
lus
ter
(b) Memory consumption for handling inter-thread event notifications (option cv )
Average Memory Consumption [MB]
8000
+
HG lib
HG++lib+spin+cv
HG nolib+spin
DRD 3.4.1
7000
6000
5000
4000
3500
3000
2500
2000
1500
1000
500
0
bla
ck
bo
sc
dy
ho
les
fac
tra
ck
es
im
fer
ret
fre
sw
qm
ine
ap
flu
tio
ns
vip
ida
s
nim
ate
x2
64
ca
nn
de
ea
l
du
p
str
ea
ray
mc
tra
lus
ter
ce
(c) Memory consumption for spinning read loop detection (option spin)
Figure 9.1.: Memory consumption on PARSEC by different tools.
131
Chapter 9. Experiments and Evaluation
memory state machine and the new options implemented features for interthread event notifications and ad-hoc synchronizations (options cv and spin).
Some additional memory is required due to the data dependency analysis for
deriving the hb-relations.
Figure 9.1(b) compares the overhead of Helgrind+ lib+cv with the hybrid detectors. The overhead by Helgrind+ lib+cv against Helgrind 3.3.1 is only significant in the case of dedup. Although Helgrind 3.3.1 uses a 32-bit shadow
memory and Helgrind+ a 64-bit one, the memory overhead by Helgrind+ is not
much. The hybrid Intel Thread Checker caused fairly large memory overhead,
especially in the case of memory-intensive programs such as facesim, dedup
and raytrace that was remarkable while analyzing them with Intel Thread
Checker.
Enabling the spin option increases memory consumption (Figure 9.1(c)). Since
loops in the program have to be checked and analyzed for spinning reads. In case
of happens-before detectors as universal race detector: Helgrind+ nolib+spin has
higher memory than DRD. Note that DRD also uses a 32-bit shadow memory.
However, the memory overhead in Helgrind+ is small enough that real world
applications with high memory usage are still testable. Optimizing our implementation could help reduce the memory overhead, which we intend to do as a
future work.
9.3.2. Runtime Overhead
The execution time of instrumented code versus the actual execution time is
typically slowed down by a factor of 10 to 70 on Helgrind+ . We measured and
compared the execution time of instrumented code on different race detectors.
The measurements are shown in Figure 9.2 for the PARSEC benchmark. Execution time for different memory state machines are approximately constant
(Figure 9.2(a)). The difference in memory state machines incurs almost no runtime overhead.
There is minor overhead of Helgrind+ lib+cv over the tool Helgrind 3.3.1 (Figure 9.2(b)). In the worst case, facesim and raytrace on Helgrind+ increase
the execution time significantly. In contrast to other programs, facesim and
raytrace need more time for reading and preparing of the input data. These
two programs in PARSEC are object oriented and implemented in C++. In
other cases, different options of Helgrind+ have approximately equal execution
times. Intel Thread Checker increased the execution time remarkably. On average, the slowdown is equal to Helgrind+ lib+cv.
132
Chapter 9. Experiments and Evaluation
The spin option (Figure 9.2(c)) causes some overhead in Helgrind+ compared to
the basic mode (lib option). In the worst cases, ferret and x264 on Helgrind+
with lib+spin and nolib+spin options increase the execution time significantly.
In other cases, Helgrind+ delivers approximately equal execution times. This is
because the main work is done during instrumentation. Normally, code pieces
are instrumented only once and used repeatedly during execution. Thus, the
slow analysis of loops happens only once. In case of facesim and raytrace,
the execution time by Helgrind+ increases.
Compared to DRD, a happens-before race detector, there is an execution overhead by Helgrind+ . But in cases of dedup and fluidanimate DRD’s execution time is much higher. This is because many locks are used in these two
benchmarks in contrast to the other programs and DRD has to construct a
hb-relation for each lock. On average, the slowdown factor by Helgrind+ with
nolib+spin as a universal race detector is reasonable to apply for real world
applications.
Summing up, the results confirm that the methods presented in this thesis cause
reasonable overhead. Helgrind+ is scalable and fast enough and does not need
much memory. The true positives are comparable to other tools, and results are
accurate in case of short-running as well as long-running applications.
133
Average Runtime [min]
Chapter 9. Experiments and Evaluation
160
150
140
130
120
110
100
90
35
HG++ lib+long
HG
lib+short
+
HG lib+long+cv
HG+ lib+short+cv
30
25
20
15
10
5
0
bla
bo
ck
fac
dy
sc
tra
ho
es
im
ck
les
fer
ret
fre
sw
qm
flu
ap
tio
ine
vip
ida
s
nim
ns
x2
64
ca
de
nn
ea
du
p
l
ate
str
ray
ea
tra
mc
ce
lus
ter
Average Runtime [min]
(a) Execution time for different memory state machines
160
150
140
130
120
110
100
90
35
Intel TC 3.1
Helgrind 3.3.1
HG++ lib+long+cv
HG lib+short+cv
30
25
20
15
10
5
0
bla
bo
ck
fac
dy
sc
tra
ho
es
im
ck
les
fer
ret
fre
sw
qm
flu
ap
tio
ine
vip
ida
s
nim
ns
x2
64
ca
de
nn
ea
du
p
l
ate
str
ray
ea
tra
mc
ce
lus
ter
Average Runtime [min]
(b) Execution time for handling inter-thread event notifications (option cv )
160
150
140
130
120
110
100
90
35
+
HG lib
HG++lib+spin+cv
HG nolib+spin
DRD 3.4.1
30
25
20
15
10
5
0
bla
ck
bo
sc
dy
ho
les
fac
tra
ck
es
im
fer
ret
fre
sw
qm
ine
ap
flu
tio
ns
vip
ida
s
nim
ate
x2
64
ca
nn
de
ea
l
du
p
str
ea
(c) Execution time for spinning read loop detection (option spin)
Figure 9.2.: Execution time on PARSEC by different tools.
134
ray
mc
tra
lus
ter
ce
Chapter 10.
Conclusion
10.1. Conclusion
In this thesis, we presented a novel hybrid dynamic race detection approach
based on combining lockset-based and happens-before-based detection. Our
approach achieves high accuracy with reasonable overhead by adapting the race
detector to short-running and long-running applications.
We extended our hybrid approach to identify synchronization by means of interthread event notifications via condition variables. In contrast to classic race
detectors, our approach is able to identify synchronization with inter-thread
event notifications independent of the execution order. This extension increases
the precision of the race detection and reduces the number of false positives and
false negatives.
Furthermore, we showed that knowledge of all synchronization operations in
a program is crucial for accurate data race detection. We demonstrated that
missing ad-hoc synchronization causes numerous false positives. We developed a
dynamic method which is able to identify ad-hoc synchronization operations. It
has also the ability to detect synchronization primitives from unknown libraries,
eliminating the need to modify the detector for each additional library. This
method can be used alone or as a complementary method to any other race
detector. Using the method alone as a complete race detection approach (with
a minor increase in false positives), results in a universal happens-before race
detector that is able to detect different synchronization operations from various
libraries.
Our hybrid approach is based only on the information extracted by dynamic
program analysis. It is automatic and does not need source code annotation or
program modifications. The technique that extracts information dynamically by
means of just-in-time instrumentation and pre-runtime analysis of the not-yet
executed code blocks represents the state-of-the-art.
135
Chapter 10. Conclusion
We implemented our approach in an open source race detector tool called
Helgrind+ and applied it to a wide variety of benchmarks. Our empirical results confirm that the new dynamic approach works precisely and removes many
false positives and false negatives. The programmer is not overwhelmed by numerous false positives as in other detectors, helping programmers to focus on
real races. In situations where certain synchronization patterns occur (e.g. adhoc synchronizations or synchronization with inter-thread event notifications),
Helgrind+ is more reliable compared to other race detectors. The evaluation
shows that the overhead in our race detector is moderate enough to apply in
practical applications.
10.2. Discussion
Our approach reduced the number of false positives and false negatives. However, removing false positives and false negatives in multi-threaded programs
completely seems to be impossible. For instance, the program listed in Figure
10.1 demonstrates a false positive that neither Helgrind+ nor any other race
detector examined in this thesis could eliminate. The program does not contain
any data race, but current race detectors are unable to deal with this type of
synchronization. All race detectors used in Chapter 9 report a false data race on
DATA, whereas the threads are correctly synchronized by any schedule. In fact,
Function try lock(MU) within function_2 returns 0 if successful, and accesses on
DATA are not parallel.
Boehm in [4] shows that a valid interpretation of the Pthread standards requires
that a program using the Pthread library must be race free. Furthermore, each
access to a shared variable by more than one thread has to be protected by
locks. Otherwise, the program behavior is not only non-deterministic but also
undefined. Sometimes, it is not easy to discover the programmer’s intention
and the behavior of programs just by code inspection. Additionally, compilers
and processors complicate this task by reordering the instructions and code
optimization.
As an example, assume the program provided in Figure 10.2 that initializes
variables X, Y, t1, t2 to zero. Each thread assigns a value to pairs (X, t1)
or (Y, t2). This causes data races on the variables X and Y. After executing
each code block, t1 or t2 would be set to one, depending on whether X = 1 or
Y = 1 was executed. If the compiler reorders the instructions, it is also possible
that t1 = Y or t2 = X run first. Thus, the values of t1, t2 are not determined
– the behavior of this program is non-deterministic and also undefined.
136
Chapter 10. Conclusion
int DATA = 0;
main()
{
c r e a t e (thread_1, function_1);
c r e a t e (thread_2, function_2);
}
void function_1() {
DATA = 1;
void function_2() {
while ( t r y l o c k (MU) == 0)
unlock (MU);
l o c k (MU);
return NULL;
}
DATA = 2;
}
(a) Thread 1
(b) Thread 2
Figure 10.1.: A race free program, but detectors report a false data race on
DATA.
To resolve this problem, one may put the instructions in a critical section by
using a common lock. This solves any atomicity violations if they exist, and
eliminates the race warnings caused by them. But the problem still exists and
locks cannot help. The program remains non-deterministic and this is because
of an order violation which happens between threads. In fact, order violations
are problems and they are still difficult to guess by detectors – the correct
interleaving and the programmer’s intention can not be identified completely by
race detectors (including Helgrind+ ).
10.3. Future Research
There are many opportunities for future research to improve Helgrind+ . For
example, program analysis might be used to automatically select the appropriate
memory state machine for a program. Classification techniques for warnings
might draw upon the state machine’s history. Applying a runtime analysis
that excludes variables that are only accessed by a single thread could improve
performance as well. Another direction for future work is improving the accuracy
of the universal race detector by identifying lock operations, in order to enable
lockset analysis.
So far, we have focused on races that might happen only on a single variable. A
method to detect races on correlated variables in programs could be very useful.
137
Chapter 10. Conclusion
int
int
int
int
X = 0;
Y = 0;
t1 = 0;
t2 = 0;
main()
{
c r e a t e (thread_1, function_1);
c r e a t e (thread_2, function_2);
}
function_1() {
X = 1;
t1 = Y;
}
(a) Thread 1
function_2() {
Y = 1;
t2 = X;
}
(b) Thread 2
Figure 10.2.: A program demonstrates an order violation. Even if each function is protected by a lock/unlock pair, the problem still remains.
Automatically finding the atomic regions and correlated variables in a program
at runtime is challenging.
Finally, performing a static or dynamic analysis to reduce the amount of instrumentation improves performance. Since many reads and writes are not parallel,
finding a method to exclude them during instrumentation could be quite useful.
138
Bibliography
[1] Utpal Banerjee, Brian Bliss, Zhiqiang Ma, and Paul Petersen. Unraveling
R thread checker. 2005.
data race detection in the intel
[2] Christian Bienia, Sanjeev Kumar, Jaswinder Pal Singh, and Kai Li. The
parsec benchmark suite: Characterization and architectural implications.
Technical report, January 2008.
[3] Christian Bienia and Kai Li. Parsec 2.0: A new benchmark suite for chipmultiprocessors. June 2009.
[4] Hans-J. Boehm. Reordering constraints for pthread-style locks. pages 173–
182, 2007.
[5] Chandrasekhar Boyapati and Martin Rinard. A parameterized type system
for race-free java programs. pages 56–69, 2001.
[6] Jong-Deok Choi and Sang Lyul Min. Race frontier: reproducing data races
in parallel-program debugging. SIGPLAN Not., 26(7):145–154, 1991.
[7] Jong-Deok Choi and Harini Srinivasan. Deterministic replay of java multithreaded applications. In SPDT ’98: Proceedings of the SIGMETRICS
symposium on Parallel and distributed tools, pages 48–59, New York, NY,
USA, 1998. ACM Press.
[8] Jyh-Herng Chow and William Ludwell Harrison, III. Compile-time analysis
of parallel programs that share memory. pages 130–141, 1992.
[9] Mark Christiaens and Koen De Bosschere. Trade, a topological approach
to on-the-fly race detection in java programs. In JVM’01: Proceedings
of the JavaTM Virtual Machine Research and Technology Symposium on
JavaTM Virtual Machine Research and Technology Symposium, pages 15–
15, Berkeley, CA, USA, 2001. USENIX Association.
[10] Edmund M. Clarke, Orna Grumberg, Somesh Jha, Yuan Lu, and Helmut
Veith. Counterexample-guided abstraction refinement. In Computer Aided
Verification, pages 154–169, 2000.
XVII
Bibliography
[11] TIS Committee. Tool interface standard (tis) executable and linking format
(elf) specification version 1.2, 1995.
[12] Anne Dinning and Edith Schonberg. Detecting access anomalies in programs with critical sections. SIGPLAN Not., 26(12):85–96, 1991.
[13] Tayfun Elmas, Shaz Qadeer, and Serdar Tasiran. Goldilocks: a race-aware
java runtime. Commun. ACM, 53:85–92, November 2010.
[14] Dawson Engler and Ken Ashcraft. Racerx: effective, static detection of
race conditions and deadlocks. SIGOPS Oper. Syst. Rev., 37(5):237–252,
2003.
[15] Cormac Flanagan and Stephen N. Freund. Fasttrack: efficient and precise
dynamic race detection. Commun. ACM, 53:93–101, November 2010.
[16] Cormac Flanagan and Shaz Qadeer. Types for atomicity. pages 1–12, 2003.
[17] Rajiv Gupta. The fuzzy barrier: a mechanism for high speed synchronization of processors. SIGARCH Comput. Archit. News, 17(2):54–63, 1989.
[18] Shantanu Gupta, Florin Sultan, Srihari Cadambi, Franjo Ivancic, and Martin Rotteler. Using hardware transactional memory for data race detection. Parallel and Distributed Processing Symposium, International, 0:1–11,
2009.
[19] Jerry J. Harrow. Runtime checking of multithreaded applications with
visual threads. In Proceedings of the 7th International SPIN Workshop on
SPIN Model Checking and Software Verification, pages 331–342, London,
UK, 2000. Springer-Verlag.
[20] Klaus Havelund and Thomas Pressburger. Model checking java programs
using java pathfinder. STTT, 2(4):366–381, 2000.
[21] A. Jannesari, Kaibin Bao, V. Pankratius, and W.F. Tichy. Helgrind+: An
efficient dynamic race detector. In Parallel Distributed Processing, 2009.
IPDPS 2009. IEEE International Symposium on, pages 1 –13, 23-29 2009.
[22] A. Jannesari and W.F. Tichy. Identifying ad-hoc synchronization for enhanced race detection. In Parallel Distributed Processing (IPDPS), 2010
IEEE International Symposium on, pages 1 –10, 19-23 2010.
[23] Ali Jannesari and Walter F. Tichy. On-the-fly race detection in multithreaded programs. In PADTAD ’08: Proceedings of the 6th workshop on
Parallel and distributed systems, pages 1–10, New York, NY, USA, 2008.
ACM.
XVIII
Bibliography
[24] Bohuslav Krena, Zdenek Letko, Rachel Tzoref, Shmuel Ur, and Tomáš
Vojnar. Healing data races on-the-fly. In PADTAD ’07: Proceedings of
the 2007 ACM workshop on Parallel and distributed systems: testing and
debugging, pages 54–64, New York, NY, USA, 2007. ACM.
[25] Leslie Lamport. Time, clocks, and the ordering of events in a distributed
system. Commun. ACM, 21(7):558–565, 1978.
[26] GNOME Documentation Library. Glib reference manual, 2008.
[27] Shan Lu, Soyeon Park, Eunsoo Seo, and Yuanyuan Zhou. Learning from
mistakes: a comprehensive study on real world concurrency bug characteristics. In ASPLOS XIII: Proceedings of the 13th international conference
on Architectural support for programming languages and operating systems,
pages 329–339, New York, NY, USA, 2008. ACM.
[28] Peter Magnusson, Anders Landin, and Erik Hagersten. Queue locks on
cache coherent multiprocessors. pages 165–171, 1994.
[29] John M. Mellor-Crummey and Michael L. Scott. Algorithms for scalable
synchronization on shared-memory multiprocessors. ACM Trans. Comput.
Syst., 9(1):21–65, 1991.
[30] Arndt Mühlenfeld and Franz Wotawa. Fault detection in multi-threaded
c++ server applications. Electron. Notes Theor. Comput. Sci., 174(9):5–22,
2007.
[31] Nicholas Nethercote. Dynamic Binary Analysis and Instrumentation. PhD
thesis, University of Cambridge, UK, 2004.
[32] Nicholas Nethercote and Julian Seward. Valgrind: A program supervision
framework. 2003.
[33] Nicholas Nethercote and Julian Seward. How to shadow every byte of
memory used by a program. Proceedings of the Third International ACM
SIGPLAN/SIGOPS Conference on Virtual Execution Environments (VEE
2007), 2007.
[34] Robert H. B. Netzer and Barton P. Miller. What are race conditions?:
Some issues and formalizations. ACM Lett. Program. Lang. Syst., 1(1):74–
88, 1992.
[35] Hiroyasu Nishiyama. Detecting data races using dynamic escape analysis
based on read barrier. In VM’04: Proceedings of the 3rd conference on Virtual Machine Research And Technology Symposium, pages 10–10, Berkeley,
CA, USA, 2004. USENIX Association.
XIX
Bibliography
[36] Robert O’Callahan and Jong-Deok Choi. Hybrid dynamic data race detection. SIGPLAN Not., 38(10):167–178, 2003.
[37] Victor Pankratius, Ali Jannesari, and Walter F. Tichy. Parallelizing bzip2:
A case study in multicore software engineering. IEEE Softw., 26(6):70–77,
2009.
[38] Victor Pankratius, Christoph Schaefer, Ali Jannesari, and Walter F. Tichy.
Software engineering for multicore systems: an experience report. In
IWMSE ’08: Proceedings of the 1st international workshop on Multicore
software engineering, pages 53–60, New York, NY, USA, 2008. ACM.
[39] Eli Pozniansky and Assaf Schuster. Multirace: efficient on-the-fly data race
detection in multithreaded c++ programs: Research articles. Concurr.
Comput. : Pract. Exper., 19(3):327–340, 2007.
[40] Michiel Ronsse and Koen De Bosschere. Recplay: a fully integrated practical record/replay system. ACM Trans. Comput. Syst., 17(2):133–152,
1999.
[41] Paul Sack, Brian E. Bliss, Zhiqiang Ma, Paul Petersen, and Josep Torrellas.
Accurate and efficient filtering for the intel thread checker race detector.
In ASID ’06: Proceedings of the 1st workshop on Architectural and system
support for improving software dependability, pages 34–41, New York, NY,
USA, 2006. ACM.
[42] Stefan Savage, Michael Burrows, Greg Nelson, Patrick Sobalvarro, and
Thomas Anderson. Eraser: a dynamic data race detector for multithreaded
programs. ACM Trans. Comput. Syst., 15(4):391–411, 1997.
[43] SPLASH-2. Splash-2: Stanford parallel applications for shared memory
(splash), 2007.
[44] Chen Tian, Vijay Nagarajan, Rajiv Gupta, and Sriraman Tallam. Dynamic
recognition of synchronization operations for improved data race detection.
In ISSTA ’08: Proceedings of the 2008 international symposium on Software
testing and analysis, pages 143–154, New York, NY, USA, 2008. ACM.
[45] Valgrind-project. Helgrind 3.3.1 : A dynamic hybrid data race detector,
2007.
[46] Valgrind-project. Data-race-test: Unit test suite framework for data race
detectors, 2009.
[47] Valgrind-project. Drd 3.4.1: A happens-before thread error detector, 2009.
[48] Christoph von Praun and Thomas R. Gross. Object race detection. SIGPLAN Not., 36(11):70–82, 2001.
XX
Bibliography
[49] Yuan Yu, Tom Rodeheffer, and Wei Chen. Racetrack: efficient detection
of data race conditions via adaptive tracking. SIGOPS Oper. Syst. Rev.,
39(5):221–234, 2005.
[50] Pin Zhou, Radu Teodorescu, and Yuanyuan Zhou. Hard: Hardware-assisted
lockset-based race detection. High-Performance Computer Architecture,
International Symposium on, 0:121–132, 2007.
XXI
Bibliography
XXII
Appendix A.
Helgrind+ User Manual
Helgrind+ 3.4.1 is based on Valgrind 3.4.1, a dynamic binary instrumentation
framework. In addition to the standard commands provided by Valgrind into
Helgrind+ , we shortly explain the new command for the features implemented
in Helgrind+ . For more details please use the help command provided by the
tool.
A.1. Choosing a Memory State Machine
Commands provided in Helgrind+ for choosing the proper memory state machine (MSMs) is as following:
• valgrind –tool=helgrind-ukas: using Helgrind+ with MSM-short (adequate
for short-running applications).
• valgrind –tool=helgrind-ukal : using Helgrind+ with MSM-long (adequate
for long-running applications).
• valgrind –tool=helgrind-ukas-nolib : using Helgrind+ with MSM-short and
turning off the PThreads library interception (no library information).
• valgrind –tool=helgrind-ukal-nolib : using Helgrind+ with MSM-long version and turning off the PThreads library interception (no library information).
XXIII
Appendix A. Helgrind+ User Manual
A.2. Handling Inter-thread Event
Notifications
Command line options for correct handling of inter-thread event notifications
(Detecting lost signals and spurious wake ups):
• –lsd=no—yes—wr (could be used for all versions of MSMs).
–lsd=no : no ahead instrumentation.
–lsd=yes : use ahead instrumentation for lost signal detection.
–lsd=wr : with data dependency analysis (constructing write/readrelation) additionally to ahead translation (most accurate option).
• –verbose-lostsig : verbose option to dump details used for debugging purposes.
A.2.1. Example
Running Helgrind+ based on MSM-short with lost signal detection and data
dependency analysis (write/read - relation)
• valgrind –tool=helgrind-ukas –lsd=wr –suppressions=helgrind.supp date
The option –suppressions=helgrind.supp could provide a suppression file (if
needed) for Helgrind+ .
A.3. Spinning Read Loop Detetcion
Option for control flow analysis for spinning read loop detection:
• use ”–cfg=N” to set the maximum number of basic blocks a spinning read
loop may span.
– if it’s set too low, spin reads may be missed and if it’s set too high,
the overhead may increase.
– default value of 3 shows good results for some x86 programs.
• use command line option ”–verbose-cfg” to dump details of detected spin
reads.
XXIV
Appendix A. Helgrind+ User Manual
• use –ignore-pthread-spins: Option to turn off spinning read loop detection within PThreads primitives. This option is only applicable when
library primitives are intercepted and it has no influence when nolib (e.g.
–tool=helgrind-ukas-nolib) is used.
A.3.1. Example
Running Helgrind+ based on MSM-short with spinning read loop detection.
Loops with maximum number of basic blocks three is considered for spinning
red detection.
• valgrind –tool=helgrind-ukas-nolib –cfg=3 date
In the esxample below, Helgrind+ works as a universal race detector with no
interception of library information. Number of basic blocks is set to seven.
• valgrind –tool=helgrind-ukas-nolib –cfg=4 date
A.3.2. Control flow graph
Show the graph output in format dot (graphviz):
• –sow-cfg : output control flow graph.
A.4. Miscellaneous Commands
Some other useful commands implemented for Helgrind+ are listed below:
• -v : Counting the number of calls to synchronization primitives(pthead mutex,
pthread cond wait/signal and pthread barrier wait).
• –xml=yes—no : XML Output for Helgrind+ .
• –hgdebug=useOrigAlgo : Change spin read detection algorithm to the
initial algorithm for small loops (for debugging purpose). By default the
advance algorithm explained in the thesis is used for spinning read detection.
XXV
Appendix A. Helgrind+ User Manual
XXVI
Appendix B.
Experiment Results on Unit Test
Suite
B.1. Results Based on MSM-short
In the following section, we present the detailed results of our race detectors on
unit test suite data-race-test[46]. Different options used for Helgrind+ are listed
below:
• Helgrind+ +lib: Interception of synchronization primitives from PThreads
library.
• Helgrind+ +lib+cv: Interception of PThreads library and correct handling
of inter-thread event notification via condition variables.
• Helgrind+ +lib+cv+spin(n): In addition to the library interception and
handling of event notifications, Helgrind+ uses spinning read loop detection. n denotes the maximum number of basic blocks during loop detection.
• Helgrind+ +nolib+spin(n): No library interception. Detector works only
based on spinning read loop detection and as a pure universal race detector.
Furthermore, we present the detailed results on three other race detectors used
for our experiments: DRD 3.4.2 [47], Helgrind 3.3.1 [45] and Intel Thread checker
3.1 [1]. We firstly show the results based on MSM-short and then the results
produced by MSM-long.
XXVII
!
"
#!
$
%
!
"
#!
$
%
!
"
#!
$
%
&"
(
*(
!
"
#!
$
%
'
'(
'
(
'
)'
)
'
,
+
(
'*
,
'(
,*
'*
(
,)
+
)'
Appendix B. Experiment Results on Unit Test Suite
B.2. Result Based on MSM-long
As previous section, all experiments are done also on MSM-long. Same options
of Helgrind+ are used with comparison to other data race detectors. Detailed
results are listed as following.
XXXII
% %, %+ %* &+
% %, %+ %* &+
% %, %+ %* &+
%
&"
%,
%+
%*
&+
(
,
,
*
,
+
,
+
,
,
)
+(
+'
+
+
+
Appendix C.
Experiment Results on PARSEC
Benchmark
Detailed results of our experiments on PARSEC 2.0 [3]with Helgrind+ and different tools are listed below. All the programs are executed with two threads
and the result are the average value of five executions. We used the input sets
simsmall for simulations. Only, streamcluster and swaptions, use the
simmedium input set.
For Helgrind+ , we use the following option:
• Helgrind+ +short+lib: Interception of synchronization primitives from
PThreads library based on MSM-short.
• Helgrind+ +long+lib: Interception of synchronization primitives from PThreads
library based on MSM-long.
• Helgrind+ +short(long)+lib+cv: Interception of PThreads library using
MSM-short (MSM-long) and correct handling of inter-thread event notification via condition variables.
• Helgrind+ +lib+cv+spin(n): In addition to the library interception and
handling of event notifications, Helgrind+ uses spinning read loop detection. n denotes the maximum number of basic blocks during loop detection.
• Helgrind+ +nolib+spin(n): No library interception. Detector works only
based on spinning read loop detection and as a pure universal race detector.
As before, we present the detailed results on three other race detectors used for
our experiments: DRD 3.4.2, Helgrind 3.3.1 and Intel Thread checker 3.1.
XXXVII
" #$
% &$
'
%$
%
!
!
!
!
!!
!
!
!
" #$
% &$
'
%$
%
!
!
!
!
!
!
!
!
!!
!
!
!!
!
!
!
!
!
!
!!
!
!
!
!
!
!!
!
!
!!
!
&
" #$
% &$
'
%$
%
!
!
!
!!
!
!!
!
!
&
" #$
% &$
'
%$
%
!
!
!
!!
!!
!
!
!
!
!
!
!
!
!
!
!!
!
!
!
!!
!
!
!
!
!
!!
" #$
% &$
'
%$
%
!
!
!!
!
!!
!
!
!!
!
" #$
% &$
'
%$
%
!
!
!
!
!
!
!
!
!
!
!
!
!
!
!
!
!
!
!
!
!
!
!!
!
!
!
!!
!
!!
&
" #$
% &$
'
%$
%
!
!
!!
!
!
!
!
!
!
&
" #$
% &$
'
%$
%
!
!
!
!
!
!!
!
!
!
!
!
!
!
!
!
!
!
!
!!
!!
!
!
!
!
!
!
!
!
!
!
!!
&$
" #$
% &$
'
%$
%
!
!
!!
!
!
!
&$
" #$
% &$
'
%$
%
!
!
!
!!
!
!
!!
!!
!
!
!!
!
!
!
!
!
!
!!
!
!!
!
!
!
!
!
!
!!
!
!
!
!!
!
!
!
!
!
$
" #$
% &$
'
%$
%
!
!
!
!
!
!
!
!!
$
" #$
% &$
'
%$
%
!
!!
!
!
!
!
!!
!
!!!
!
!
!
!!
!
!
!
!
!!
!
!
!!
!
!
!
!!!
!!
!
!
!
!
!
!
!
!
!
()(
" #$
% &$
'
%$
%
!
!!
!
!!
!!
!
!
!!
()(
" #$
% &$
'
%$
%
!
!
!!
!
!
!
!!
!
!
!!
!
!!
!
!
!
!
!
!!
!
!!!
!
!
!
!
!
!
!
*
+
,
" #$
% &$
'
%$
%
!
!
!
!
*
+
,
" #$
% &$
'
%$
%
!
!!
!
!
!
!
!
!
!!
!!
!
!
!
!
!!
!
!
!
!
!
!!
!
!
!
!
!
!
" #$
% &$
'
%$
%
!
!
!
!
!
!
!
!
!!!
!
!
!
!!
" #$
% &$
'
%$
%
!
!
!
!
!!!
!
!
!!
!
!
!
!!
!!!
!
!
!
!
!
!
!
!!
!
!!
!
!