1
Instruction
Manual
1314 Photoacoustic
Multi-gas Monitor
1412 Photoacoustic
Field Gas-Monitor
BE6011-16
Index
________________________________________________________________________
Index
Index .................................................................................................................................2
1314 Photoacoustic Multi-gas Monitor 1412 Photoacoustic Field Gas-Monitor ................................4
Safety Considerations. ....................................................................................................5
Applying Power ..............................................................................................................7
Chapter 1 Using this Manual .................................................................................................8
1.1 Introduction ..........................................................................................................9
1.2 PC Use..................................................................................................................9
1.3 Stand-alone Use................................................................................................... 10
1.4 Tool-bar Icons in Gas Monitoring Software 7304 ....................................................... 11
Chapter 2 Preliminary Tasks ............................................................................................... 13
2.1 Installing the Gas Monitoring Software 7304. ........................................................... 14
2.2 Connecting the Monitor to the PC............................................................................ 15
2.3 Checking /changing the Fuses in the Monitor. ........................................................... 15
2.4 Setting the Communication Parameters ................................................................... 21
2.5. Setting-up user Levels .......................................................................................... 23
2.6 Upgrading to newer versions of Gas Monitoring Software 7304. .................................. 26
Chapter 3 Philosophy of Operation....................................................................................... 33
3.1 PC Use – Online ................................................................................................... 34
3.2 PC Use – Offline ................................................................................................... 34
3.3 Stand-alone Use................................................................................................... 35
Chapter 4 Introduction to and Familiarization with the Monitor ................................................ 38
4.1 Special Terminology.............................................................................................. 39
4.2 Attaching the Sampling Tube and External Filter ....................................................... 42
4.3 Familiarization with the Monitor using Gas Monitoring Software 7304 ........................... 43
4.4 Familiarization with the Monitor using Front Panel ..................................................... 53
Chapter 5 The Monitor ....................................................................................................... 74
5.1 Introduction ........................................................................................................ 75
5.2 Front Panel.......................................................................................................... 75
5.3 Starting-up or Restarting the Monitor ...................................................................... 79
5.4 Configuring the Monitor......................................................................................... 83
5.5 Alarm Relay......................................................................................................... 86
Chapter 6 Keying-in Parameters ......................................................................................... 88
6.1 Types of Parameters ............................................................................................. 89
6.2 Choosing Parameters ............................................................................................ 89
Chapter 7 Setting-up and Starting a Monitoring Task ............................................................. 93
7.1 The Parameters’ Units ........................................................................................... 94
7.2 The Measurement Parameters ................................................................................ 98
7.3 Setting-up the Monitor’s Alarm Levels ................................................................... 109
7.4 Starting a Monitoring Task ................................................................................... 110
Chapter 8 Viewing Measurement Data – using a PC.............................................................. 117
8.1 Measurement Data ............................................................................................. 118
8.2 Graphic Window ................................................................................................. 120
8.3 Numeric Window ................................................................................................ 124
8.4 Using the Cursors ............................................................................................... 128
8.5 User Event Markers ............................................................................................ 131
8.6 Status Windows ................................................................................................. 133
8.7 Displaying Measurement Results while Monitoring ................................................... 135
8.8 Displaying Measurement Results after Monitoring.................................................... 137
8.9 Printing Measurement Results. ............................................................................. 140
Chapter 9 Viewing Measurement Data – Using the Monitor .................................................... 146
9.1 Displayed Monitoring Task Data............................................................................ 147
9.2 Printed Monitoring Task Data ............................................................................... 152
9.3 Storage Space in the Display Memory.................................................................... 156
Chapter 10 Database Administration for PC Use................................................................... 158
10.1 Introduction ...................................................................................................... 159
_____________________________________________________________________________
BE6011-16
1314 Photoacoustic Multi-gas Monitor
LumaSense Technologies A/S
1412 Photoacoustic Field Gas-Monitor
Page 2 of 280
Index
________________________________________________________________________
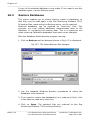
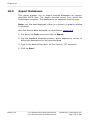
10.2 Backup Databases .............................................................................................. 159
10.3 Restore Databases.............................................................................................. 160
10.4 Delete Databases ............................................................................................... 161
10.5 Export Databases ............................................................................................... 162
Chapter 11 Storage of Data in the Monitor’s Memory............................................................ 163
11.1 Types of Memory in the Monitor ........................................................................... 164
11.2 Storage of Measurement Results .......................................................................... 173
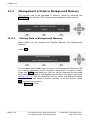
11.3 Management of Data in Background Memory .......................................................... 176
Chapter 12 Using a Printer with the Monitor ........................................................................ 179
12.1 Introduction ...................................................................................................... 180
12.2 Printer Cables .................................................................................................... 180
12.3 Setting-up Communication Parameters.................................................................. 181
12.4 Additional Parameters Required ............................................................................ 184
12.5 Data Logging Function ........................................................................................ 185
12.6 Error Logging Function ........................................................................................ 185
12.7 Printing-out Data from the Monitor ....................................................................... 185
Chapter 13 Maintenance of the 1314/1412 ......................................................................... 187
13.1 Changing the Fine Air-filters................................................................................. 188
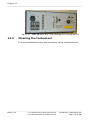
13.2 Cleaning the Filter in the Ventilation Unit ............................................................... 194
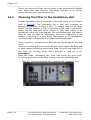
13.3 Cleaning the Instrument...................................................................................... 195
Chapter 14 Calibration of the Optical Filters ........................................................................ 196
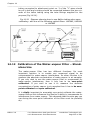
14.1 About the Installed Optical Filters ......................................................................... 197
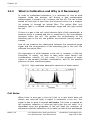
14.2 What is Calibration and Why is it Necessary? .......................................................... 198
14.3 Tasks Before Starting Any Calibration.................................................................... 202
14.4 The Basic Calibration Set-up ................................................................................ 210
14.5 General Settings for a Calibration – PC Use ............................................................ 213
14.6 General Settings – Stand-alone Use ...................................................................... 221
14.7 Zero-point Calibration ......................................................................................... 225
14.8 Humidity Calibrations – PC Use............................................................................. 230
14.9 Humidity-interference Calibrations – Stand-alone Use.............................................. 231
14.10 Cross-interference Calibrations .......................................................................... 236
14.11 Span Calibration .............................................................................................. 237
14.12 Calibration of the Water-vapour Filter – Stand-alone Use....................................... 250
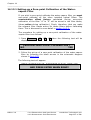
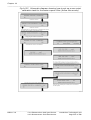
14.13 Setting-up a Combined Zero-point and Humidity-interference Calibration – Stand-alone
Use ....................................................................................................................... 256
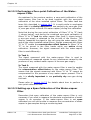
14.14 Setting-up any Combined Calibration – Stand-alone Use ....................................... 258
Chapter 15 Installing the Optical Filters .............................................................................. 260
15.1 Introduction ...................................................................................................... 261
Chapter 16 Messages Related to Calibration ........................................................................ 265
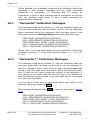
16.1 “Successful” Calibration Messages......................................................................... 266
16.2 “Successful *” Calibration Messages ...................................................................... 266
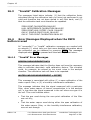
16.3 “Invalid” Calibration Messages.............................................................................. 267
16.4 Error Messages Displayed when the INFO button is used .......................................... 267
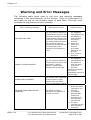
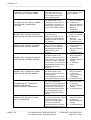
Chapter 17 Warning and Error Messages ............................................................................ 274
Warning and Error Messages........................................................................................... 276
_____________________________________________________________________________
BE6011-16
1314 Photoacoustic Multi-gas Monitor
LumaSense Technologies A/S
1412 Photoacoustic Field Gas-Monitor
Page 3 of 280
Safety Considerations
________________________________________________________________________
1314 Photoacoustic Multi-gas Monitor
1412 Photoacoustic Field Gas-Monitor
July 2009
_____________________________________________________________________________
BE6011-16
1314 Photoacoustic Multi-gas Monitor
LumaSense Technologies A/S
1412 Photoacoustic Field Gas-Monitor
Page 4 of 280
Safety Considerations
______________________________________________________________________
Safety Considerations.
Through out this manual Monitor is used for:
Photoacoustic Multi-gas Monitor – INNOVA 1314
Photoacoustic Field Gas-Monitor – INNOVA 1412
The Monitor complies with:
•
EN/IEC 61010-1, 2nd (2001): Safety requirements for electrical
equipment for measurement, control and laboratory use.
•
Can/CSA-C22.2 No. 1010.1-92 - Safety Requirements for Electrical
Equipment for Measurement, Control, and Laboratory Use, Part 1:
General Requirements
•
UL Std. No. 61010A-1 (1st Edition) - Safety Requirements for
Electrical Equipment for Measurement, Control, and Laboratory
Use, Part 1: General Requirements
To ensure safe operation and retain the Monitor in safe condition,
note the following:
EXPLOSION HAZARD!
TO AVOID THE POSSIBILITY OF AN EXPLOSION; MONITORING
OF FLAMMABLE GASES IN EXPLOSIVE CONCENTRATIONS
MUST NEVER BE ATTEMPTED.
Never operate the 1314 Photoacoustic Multi-Gas Monitor or
the 1412 Photoacoustic Field Gas-Monitor in potentially
explosive environments.
When monitoring potentially flammable or toxic gases it is essential
that:
•
The instrument itself is placed in a well-ventilated area outside the
potentially hazardous zone.
•
A sufficiently long tube is connected to the air-outlet on the back
panel so that the sampled gas is carried away to the open air or to
an extraction and/or filtration unit.
_____________________________________________________________________________
BE6011-16
1314 Photoacoustic Multi-gas Monitor
LumaSense Technologies A/S
1412 Photoacoustic Field Gas-Monitor
Page 5 of 280
Safety Considerations
______________________________________________________________________
Warnings!
•
Avoid water condensation in the instrument.
•
Switch off all equipment before connecting or disconnecting their
digital interface. Failure to do so could damage the equipment.
•
Whenever it is likely that correct function or operating safety of
the apparatus has been impaired, the apparatus must be made
inoperative and secured against unintended operation.
•
Any adjustment, maintenance and repair of the open apparatus
under voltage must be avoided as far as possible and, if
unavoidable, must be carried out only by trained personnel.
•
If a fault is reported by the monitor that indicates correct function
of the instrument may be impaired, consult your local LumaSense
Technologies representative. Under no circumstances should repair
be attempted by persons not qualified in service of electronic
instrumentation.
_____________________________________________________________________________
BE6011-16
1314 Photoacoustic Multi-gas Monitor
LumaSense Technologies A/S
1412 Photoacoustic Field Gas-Monitor
Page 6 of 280
Safety Considerations
______________________________________________________________________
Applying Power
Before using the 1314 or the 1412 check that the available mains
voltage match the specified voltage and frequency for the instrument.
SAFETY SYMBOLS
The apparatus will be marked with this symbol when it is important
that the user refers to the associated warning statement given in the
User Guide.
Frame or
Dangerous
Chassis
voltage
Protective earth
Copyright © 2004 LumaSense Technologies A/S
All rights reserved. No part of this publication may be reproduced or
distributed in any form or by any means without prior consent in
writing from LumaSense Technologies A/S, Denmark
_____________________________________________________________________________
BE6011-16
1314 Photoacoustic Multi-gas Monitor
LumaSense Technologies A/S
1412 Photoacoustic Field Gas-Monitor
Page 7 of 280
Chapter 1
______________________________________________________________________
Chapter 1
Using this Manual
July 2009
_____________________________________________________________________________
BE6011-16
1314 Photoacoustic Multi-gas Monitor
LumaSense Technologies A/S
1412 Photoacoustic Field Gas-Monitor
Page 8 of 280
Chapter 1
______________________________________________________________________
1.1 Introduction
This manual can be used in several ways. The first time users can
work their way through the examples in order to get to know this
monitoring system. The more experienced users can jump directly to
the relevant chapters in order to gain assistance, and experts can
use this manual as a reference book by using the index.
The monitor can be operated in three ways; Online, Offline and as a
Stand-alone instrument. Therefore, the instructions in this manual
are divided in to the following sections; PC use and Stand-alone Use.
When Offline operation is required, the normal Online instructions
should be followed. If there is a deviation from these instructions,
this will be indicated in the relevant sections.
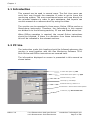
1.2 PC Use
The instruction under this heading should be followed whenever the
monitor is used together with the Gas Monitoring Software 7304.
Both Online and Offline instructions are covered here.
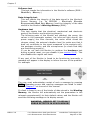
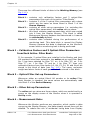
The information displayed on screen is presented in this manual as
shown below:
1. Menu bar option e.g. Edit
2. Pull-down menu option e.g. Open
3. Index card e.g. “Gas”
4. Group e.g. Gas Setup
5. Select Field e.g. Select S.I.T.
6. Check box. used to select several options
7. Soft-key e.g. Reload Filter info.
_____________________________________________________________________________
BE6011-16
1314 Photoacoustic Multi-gas Monitor
LumaSense Technologies A/S
1412 Photoacoustic Field Gas-Monitor
Page 9 of 280
Chapter 1
______________________________________________________________________
Radio push-buttons: these are not illustrated above, but are
commonly used in the software. They act as a toggle function when
several options are available, but only one can be selected at a time.
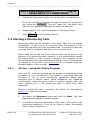
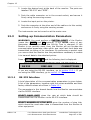
1.3 Stand-alone Use
In some situations, it may be necessary to set up without connecting
it to a PC. The procedure to do this are covered in this manual under
the Stand-alone use headings. The way these instructions are
presented is shown below:
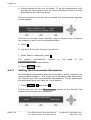
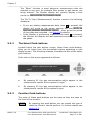
SELECT SET-UP BRANCH
MEASUREMENT
FORMAT
CONFIGURATION
The display above is used continuously through-out this manual. It
assists you displaying the text on screen and by indicating which of
the push-buttons can and should be pressed.
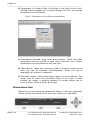
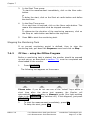
In general, the push-buttons shown above are used to navigate
through the various modes possible within the 1314 / 1412 but are
described in more detail below:
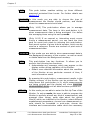
S1
S2
S3
These push-buttons are illustrated as S1, S2 and S3. The numbers
are only present on the front of the 1314 instrument. For 1412 they
correspond to the key and their position on the instrument.
These select push-buttons enable you to select one of the options
displayed.
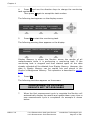
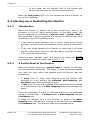
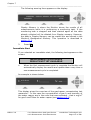
This group of 5 push-buttons are referred to in this manual
collectively as the direction keys. The symbols below are used to
simplify the instruction in this manual.
_____________________________________________________________________________
BE6011-16
1314 Photoacoustic Multi-gas Monitor
LumaSense Technologies A/S
1412 Photoacoustic Field Gas-Monitor
Page 10 of 280
Chapter 1
______________________________________________________________________
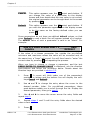
▲ & ▼ enable you to increase & decrease numbers, respectively, or
to go to the Previous & Next Displays, respectively.
◄ & ► enable you to move across number fields or go to the
Previous & Next gases, respectively.
↵ , depending on the situations, acts as an “Enter” or “ Go To Head”
key.
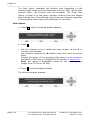
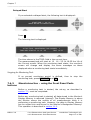
Memory
Function push-buttons are always represented with the name
of the push-button enclosed in a box which is shaded-in.
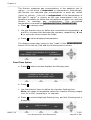
SYSTEM
Text that appears on the display screen is shown in an open
shaded box, using UPPER case letters.
FORMAT
System
General
Clock
When referring to any part of the Set-up “tree”, the text is
shown in open shaded boxes with the same typeface as that
used in the “tree”.
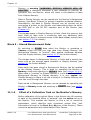
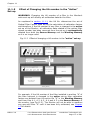
1.4 Tool-bar Icons in Gas Monitoring Software 7304
The instructions in this manual use the pull-down menu paths to
describe how operations are possible. However, in many cases, the
icons in the tool-bar can be used to speed things up.
1
2
3
4
5
6
7
8
9
10
11
12
13
The text below provides the key to the icons.
1.
2.
3.
4.
5.
6.
7.
8.
9.
Create a new measurement task.
Open an existing measurement task.
Copy active window to clipboard.
Print active screen.
Change sequence settings.
Online and calibration only- Start a measurement sequence.
Online and calibration only- Pause a measurement sequence.
Online and calibration only- Stop a measurement sequence.
Auto-scale axis from 0 to maximum value (only available when
the Auto-scale OFF is selected in the windows properties
dialogue).
_____________________________________________________________________________
BE6011-16
1314 Photoacoustic Multi-gas Monitor
LumaSense Technologies A/S
1412 Photoacoustic Field Gas-Monitor
Page 11 of 280
Chapter 1
______________________________________________________________________
10.
11.
12.
13.
14
14.
15.
16.
17.
18.
Auto-scale axis from minimum to maximum values (only
available when the Auto-scale OFF is selected in the windows
properties dialogue).
Zoom in (only available when two cursors are selected).
Zoom out (only available when zoom is enabled).
Display the active window properties.
15 16
17
18
presentation only- Go to the start of the measurement task.
presentation only- Scroll backwards through the measurement
task.
presentation only- Scroll forwards through the measurement
task
presentation only- Go to the end of the measurement task.
Open the cursor values dialogue.
19
19. Online only- open the Alarm status dialogue.
_____________________________________________________________________________
BE6011-16
1314 Photoacoustic Multi-gas Monitor
LumaSense Technologies A/S
1412 Photoacoustic Field Gas-Monitor
Page 12 of 280
Chapter 2
______________________________________________________________________
Chapter 2
Preliminary Tasks
July 2009
_____________________________________________________________________________
BE6011-16
1314 Photoacoustic Multi-gas Monitor
LumaSense Technologies A/S
1412 Photoacoustic Field Gas-Monitor
Page 13 of 280
Chapter 2
______________________________________________________________________
When taking delivery of the 1314 Photoacoustic Multi-gas Monitor or
the 1412 Photoacoustic Field Gas-Monitor, five very important and
preliminary tasks must be completed before starting to operate it:
Install the Gas Monitoring Software 7304 (to enable operation from
via a PC) (see section 2.1).
Connect the Monitor to a PC (see section 2.2).
Check/Change the fuses in the monitor (see section 2.3).
Set the Communication parameters (see section 2.4).
Set-up the password protected user levels (see section 2.5).
2.1 Installing the Gas Monitoring Software 7304.
Before installing the software, the PC must meet the following
requirements:
Hardware:
A personal Computer, Pentium 166 MHz or
better
Min. 64 Mbytes of RAM
Min. 40 Mbytes of space available on the hard
disc
VGA monitor or better
One RS-232 port
Mouse
Software:
Windows NT, Windows 2000, Windows XP
It is recommended to install the latest version of the Windows
Service Pack.
The software comes complete with an installation program. Insert
the disc and use the standard Windows procedure to install the
software. When installing the software you must be logged in as an
Administrator that means that you must have “administrator” rights.
The users, who are going to use the software, must have “Standard
User” rights, in order to be able to use the software. “Restricted
User” rights will not be sufficient to operate the program. It is
recommended that your system administrator performs the task of
installing the program and creates the user logins with the proper
user rights to operate the software.
If you are unsure how to install programs, refer to the Windows Help.
_____________________________________________________________________________
BE6011-16
1314 Photoacoustic Multi-gas Monitor
LumaSense Technologies A/S
1412 Photoacoustic Field Gas-Monitor
Page 14 of 280
Chapter 2
______________________________________________________________________
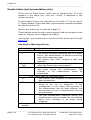
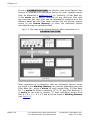
After the installation is successfully completed, five icons appear in
the Gas Monitoring Software 7304 program menu. These are
labelled:
ONLINE
PRESENTATION
CALIBRATION
OFFLINE
DATABASE ADMINISTRATION
These icons can be placed on your desktop for easy access to the
programs.
2.2 Connecting the Monitor to the PC
The monitor comes complete with a 9-pin to 25-pin null modem RS232 interface cable. If your PC has a 25-pin serial port, an adapter
can be fitted to enable the supplied cable to be used.
2.2.1 Fitting the RS-232 Cable.
Ensure that both the monitor and the PC are switched off at the
mains. Failure to do so may result in your equipment being
damaged.
Locate the serial port at the back of the PC, refer to your PC manual
if in doubt.
Push the connector on the RS-232 cable on to the serial port socket,
and secure it firmly using the securing screws.
Locate the output labelled “RS-232” at the back of the Monitor.
Push the connector at the other end of the RS-232 cable on to this
socket, and secure it firmly using the securing screws.
Turn on the PC. Wait for Windows to start up.
The instruments can be turned on at the mains now.
2.3 Checking /changing the Fuses in the Monitor.
Unplug the Monitor from the mains power supply and pull out the
plug in the AC Mains socket of the Monitor
If the fuses in the Monitor are blown it can indicate a serious fault in
the instrument, therefore it is advisable to contact your Innova
service representative before changing the fuse!
_____________________________________________________________________________
BE6011-16
1314 Photoacoustic Multi-gas Monitor
LumaSense Technologies A/S
1412 Photoacoustic Field Gas-Monitor
Page 15 of 280
Chapter 2
______________________________________________________________________
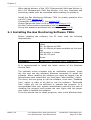
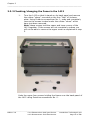
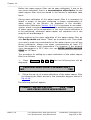
2.3.1 Checking/changing the Fuses in the 1314
1.
Remove the top lid.
2.
Remove the rear cross rail:
_____________________________________________________________________________
BE6011-16
1314 Photoacoustic Multi-gas Monitor
LumaSense Technologies A/S
1412 Photoacoustic Field Gas-Monitor
Page 16 of 280
Chapter 2
______________________________________________________________________
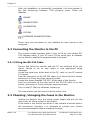
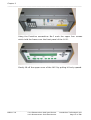
3.
Use a screwdriver to remove the fuse-holder:
4.
Remove the old fuse from the holder and replace it with a new.
Check that the fuse have the correct rating.
The fuse must be:
Slow-blow (T) fuse with a rating of 2.5 A, 250 VAC, 5x20 mm, UL
approved.
Innova order number: VF0087A
5.
Install the fuse-holder and re-assemble the 1314 again.
_____________________________________________________________________________
BE6011-16
1314 Photoacoustic Multi-gas Monitor
LumaSense Technologies A/S
1412 Photoacoustic Field Gas-Monitor
Page 17 of 280
Chapter 2
______________________________________________________________________
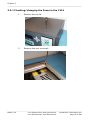
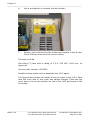
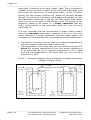
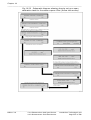
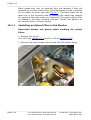
2.3.2 Checking/changing the Fuses in the 1412
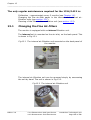
1.
Turn the 1412 so that it stands on its back panel and remove
the rubber “shoes” mounted on the four “feet” of its baseplate. Using Pozidrive screwdriver No. 1, undo and completely
remove the screws located under the rubber “shoes” which
have just been removed.
Note: these screws hold the upper and lower covers of the
1412 together. If the screws are not completely undone you
will not be able to remove the upper cover as explained in step
5.
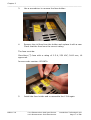
Undo the upper four screws holding the frame over the back-panel of
the 1412 using Pozidrive screwdriver No. 0.
_____________________________________________________________________________
BE6011-16
1314 Photoacoustic Multi-gas Monitor
LumaSense Technologies A/S
1412 Photoacoustic Field Gas-Monitor
Page 18 of 280
Chapter 2
______________________________________________________________________
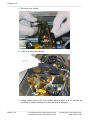
Using the Pozidrive screwdriver No.0 undo the upper four screws
which hold the frame over the front panel of the 1412.
Gently lift off the upper cover of the 1412 by pulling it firmly upward.
_____________________________________________________________________________
BE6011-16
1314 Photoacoustic Multi-gas Monitor
LumaSense Technologies A/S
1412 Photoacoustic Field Gas-Monitor
Page 19 of 280
Chapter 2
______________________________________________________________________
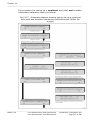
6.
Use a screwdriver to remove the fuse-holder:
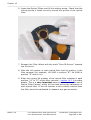
7.
Remove the old fuse from the holder and replace it with a new.
Check that the fuse have the correct rating.
The fuse must be:
Slow-blow (T) fuse with a rating of 2.5 A, 250 VAC, 5x20 mm, UL
approved.
Innova order number: VF0087A
Install the fuse-holder and re-assemble the 1412 again.
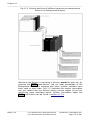
The figure below shows the inside of the top cover of the 1412. Note
that the front side of the cover has square flanges. Place the top
cover back in its correct position on top of the 1412 and screw in the
all screws.
_____________________________________________________________________________
BE6011-16
1314 Photoacoustic Multi-gas Monitor
LumaSense Technologies A/S
1412 Photoacoustic Field Gas-Monitor
Page 20 of 280
Chapter 2
______________________________________________________________________
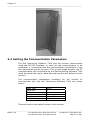
2.4 Setting the Communication Parameters
The Gas Monitoring Software 7304 and the monitor communicate
using the RS-232 interface. In order for the communication to be
successful, it is essential that the communication parameters in the
two instruments are set correctly. This is a two stage process: the PC
communication port is selected via the Gas Monitoring Software 7304
while the baud rate, parity, data bits and stop bits are defined via the
monitor.
The communication parameters necessary for the monitor to
communicate with the Gas Monitoring Software 7304 are shown
below:
Baud rate
Stop bits
Data bits
Parity
Hardwire mode
Handshake type
9600
1
7
Even
Leased line
Hardwire
These are set as the default values in the monitor.
_____________________________________________________________________________
BE6011-16
1314 Photoacoustic Multi-gas Monitor
LumaSense Technologies A/S
1412 Photoacoustic Field Gas-Monitor
Page 21 of 280
Chapter 2
______________________________________________________________________
To prevent communication errors, the text line terminator, print data
log and print error log must be set as shown below.
Text line Terminator CR-LF
Print Data Log
NO
Print Error Log
NO
2.4.1 Selecting the PC communication Port
It is just a simple case of selecting the correct port on the PC. The
software offers four to choose from: COM1, COM2, COM3 and COM4.
If you are not sure which port the cable is connected on your
computer refer to your PC manual.
Start any one of the Gas Monitoring Software 7304 options: Online,
Offline or Calibration.
Pull down the Task menu. Click on Communication.
communication dialogue is displayed.
Click on the radio push-button next to the correct port name.
Click on OK to store the selection and exit this dialogue.
The
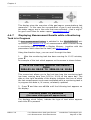
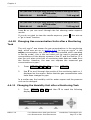
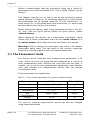
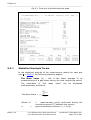
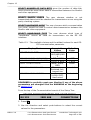
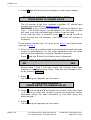
2.4.2. Checking/Changing the Communication Parameters
The communication parameters for the serial interface must be set
using the push-buttons on the front of the monitor.
1. Press SET-UP S3 S1 S3 S1 .The screen display now shows the
following text.
If the baud rate displayed is incorrect press ↵ and use ▲ and ▼ to
display the correct value. Press ↵ again to store the selection.
If the baud rate displayed is correct, then press ▼ to continue to the
next parameter.
Press S1 to select 1 STOP BIT.
Press S1 to select 7 DATA BITS
Press S2 to select EVEN PARITY
Press S3 to select LEASED-LINE
Press S3 to select HARD-WIRED HANDSHAKE.
Press SET-UP to exit the set-up mode
Press RESET and S1 in order that the new settings are enabled.
The monitor and the Gas Monitoring Software 7304 are now able to
communicate together.
_____________________________________________________________________________
BE6011-16
1314 Photoacoustic Multi-gas Monitor
LumaSense Technologies A/S
1412 Photoacoustic Field Gas-Monitor
Page 22 of 280
Chapter 2
______________________________________________________________________
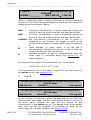
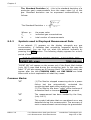
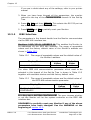
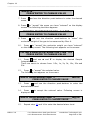
2.4.3. Checking/Changing the Text line Terminator.
The Text line Terminator must be set using the push-buttons on the
front of the monitor.
Press SET-UP S2 ▼S3
Press SET-UP to exit the set-up mode
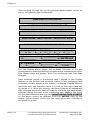
2.4.4. Checking/Changing the Data Log and Error Log Options.
The Data Log and Error Log must be set using the push-buttons on
the front of the monitor.
Press SET-UP S3 S1 S1 S3 ▼S1 S1
Press SET-UP to exit the set-up mode
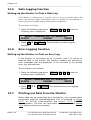
2.5. Setting-up user Levels
Press the Lock function push button on the front of the Monitor.
This enables setting up 3 different user levels, Level 1, Level 2 and
Level 3.
These user levels are password protected.
Level 1 is the Operator level, which enables start/stop and reading of
measurement results. Partial Reset is possible.
Level 2 is the Expert level, which in addition to Level 1 access
enables set up of parameters. Full Reset is possible.
Level 3 is the Super-User level, which allows all possible operations
including calibration.
2.5.1
Default settings for User Level and Password.
Before dispatch from the factory the User Level and the Password are
set to the following default setting.
User Level 3
and the default settings for the Password is:
Password : ***** (5 times *)
These settings are to be used to change user level or password the
first time.
_____________________________________________________________________________
BE6011-16
1314 Photoacoustic Multi-gas Monitor
LumaSense Technologies A/S
1412 Photoacoustic Field Gas-Monitor
Page 23 of 280
Chapter 2
______________________________________________________________________
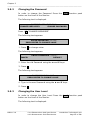
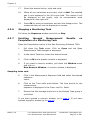
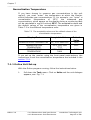
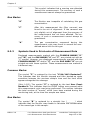
2.5.2
Changing the Password
In order to change the Password Press the Lock function push
button on the front of the Monitor.
The following text is displayed.
CURRENT USER LEVEL IS X
CHANGE USER LEVEL
CHANGE PASSWORD
Press S3 “CHANGE PASSWORD”
The following text appears.
ENTER PASSWORD "*****"
PRESS ENTER TO CHANGE VALUE
1. Press ↵ to change value.
The following text appears.
CANCEL
ENTER PASSWORD "*****"
DEFAULT
2. Enter the old Password using the ▲ and ▼ keys.
3. Press ↵ .
The following text appears.
PASSWORD IS "*****"
PRESS ENTER TO CHANGE VALUE
4. Type in the new Password using the ▲ and ▼ keys.
5. Press ↵ .
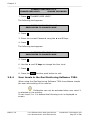
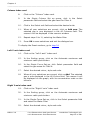
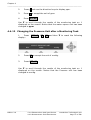
2.5.3
Changing the User Level
In order to change the User Level Press the Lock function push
button on the front of the Monitor
The following text is displayed.
_____________________________________________________________________________
BE6011-16
1314 Photoacoustic Multi-gas Monitor
LumaSense Technologies A/S
1412 Photoacoustic Field Gas-Monitor
Page 24 of 280
Chapter 2
______________________________________________________________________
CURRENT USER LEVEL IS X
CHANGE USER LEVEL
CHANGE PASSWORD
1. Press S1 “CHANGE USER LEVEL”
The following text appears.
ENTER PASSWORD "*****"
PRESS ENTER TO CHANGE VALUE
2. Press ↵ .
3. Enter the current Password using the ▲ and ▼ keys.
4. Press ↵ .
The following text appears.
CURRENT USER LEVEL IS X
PRESS ENTER TO CHANGE VALUE
5. Press ↵ .
6. Use the ▲ and ▼ keys to change the User level.
7. Press ↵ .
8. Press the Lock function push button to exit.
2.5.4
User Levels in the Gas Monitoring Software 7304.
When using the Gas Monitoring Software 7304 the software checks
the user level setting of the monitor.
Calibration can only be activated when user Level 3
is selected on the monitor.
If user Level 2 or 1 is defined the following error is displayed on
screen.
_____________________________________________________________________________
BE6011-16
1314 Photoacoustic Multi-gas Monitor
LumaSense Technologies A/S
1412 Photoacoustic Field Gas-Monitor
Page 25 of 280
Chapter 2
______________________________________________________________________
2.6 Upgrading to newer versions of Gas Monitoring
Software 7304.
In order to upgrade from an earlier version of the Gas Monitoring
Software 7304, a few preliminary tasks are recommended:
Backup of data before upgrading to a new version. Please use the
'Full backup' function in the Database Administration program:
Deleting of old program version using the 'explorer' or through
'Control Panel' and 'Add/Remove programs'.
Install the new program version. Please follow the instructions from
the installation program.
Restoring of data using the Database Administration program and the
'Restore' function.
If installation of the new version is done without deleting the old
version you will not have access to your old calibration and
measurement tasks.
2.6.1 Download of the latest version
You will find the latest version of the software on
http://www.lumasense.dk
_____________________________________________________________________________
BE6011-16
1314 Photoacoustic Multi-gas Monitor
LumaSense Technologies A/S
1412 Photoacoustic Field Gas-Monitor
Page 26 of 280
Chapter 2
______________________________________________________________________
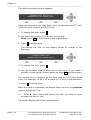
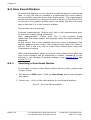
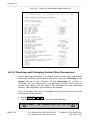
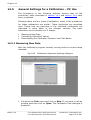
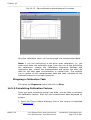
2.6.2 Restoring of calibration data
If you have ordered a calibration from our calibration laboratory, you
will receive a diskette with a backup of the calibration data. It is very
important that you store these data in your Gas Monitoring Software
7304, which you just have installed. Please store the data before
using the Gas Monitoring Software 7304, otherwise the storing
procedure will cause overwriting of existing calibration data.
Example 1
Storing of calibration data
Assume that you have ordered a calibration of your monitor, which
have 2 optical filters installed: UA0986 and UA0973. For these two
filters you have ordered calibration with Acetaldehyde and Ammonia.
Filter A
Filter B
UA0986
UA0973
Acetaldehyde
Ammonia
After calibration, the calibration data is stored in a calibration task
with the Gas Monitoring Software 7304, and the data is copied to a
diskette. This calibration task is named as:
Serial No.CAL ex.
have been ordered.)
710-002.CAL
(Single calibration task
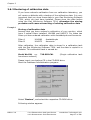
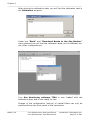
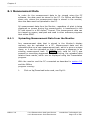
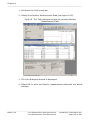
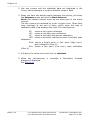
Please insert your backup CD in the CD-ROM drive.
Start the Database Administration program:
Select "Restore", and select the respective CD-ROM drive:
Following window appears.
_____________________________________________________________________________
BE6011-16
1314 Photoacoustic Multi-gas Monitor
LumaSense Technologies A/S
1412 Photoacoustic Field Gas-Monitor
Page 27 of 280
Chapter 2
______________________________________________________________________
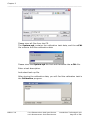
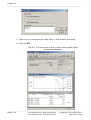
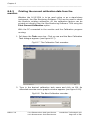
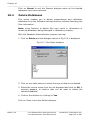
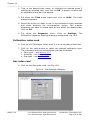
Please store all files from the CD.
The System.syb contains the calibration task data, and the x.CAL
file contains the filter calibration data.
Please store the System.syb file first and thereafter the x.CAL file.
Enter a task description.
And select back-up file.
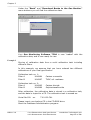
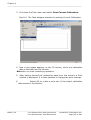
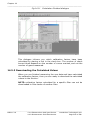
After storing the calibration data, you will find the calibration task in
the Calibration program:
_____________________________________________________________________________
BE6011-16
1314 Photoacoustic Multi-gas Monitor
LumaSense Technologies A/S
1412 Photoacoustic Field Gas-Monitor
Page 28 of 280
Chapter 2
______________________________________________________________________
Under the "Bank" and "Download Banks to the Gas Monitor"
menu bottoms you will find the calibration data:
Your Gas Monitoring Software 7304 is now ‘loaded’ with the
calibration data, and is now ready for use.
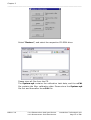
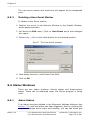
Example 2
Storing of calibration data from a multi calibration task including
different filters.
In this example, we assume that you have ordered two different
calibrations of your Dual-gas Monitor:
Calibration task no. 1:
Filter A
UA0984
Filter B
UA0987
Carbon monoxide
TVOC ref. methane
Calibration task no. 2:
Filter A
UA0983
Filter B
UA0988
Carbon dioxide
Sulphurhexaflouride
After calibration, the calibration data is stored in a calibration task,
and the data is copied to a CD. The calibration task is named as:
Serial No.CAL
ex.
710-002.CAL
Please insert your backup CD in the CD-ROM drive.
Start the Database Administration program:
_____________________________________________________________________________
BE6011-16
1314 Photoacoustic Multi-gas Monitor
LumaSense Technologies A/S
1412 Photoacoustic Field Gas-Monitor
Page 29 of 280
Chapter 2
______________________________________________________________________
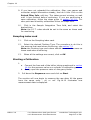
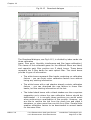
Select “Restore”, and select the respective CD-ROM drive:
Please store all files from the CD.
The System.syb contains the calibration task data, and the x.CAL
file contains the filter calibration data. Please store the System.syb
file first and thereafter the x.CAL file.
_____________________________________________________________________________
BE6011-16
1314 Photoacoustic Multi-gas Monitor
LumaSense Technologies A/S
1412 Photoacoustic Field Gas-Monitor
Page 30 of 280
Chapter 2
______________________________________________________________________
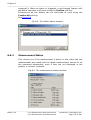
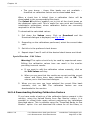
After storing the calibration data, you will find the calibration task in
the Calibration program:
Under the "Bank" and "Download Banks to the Gas Monitor"
menu bottoms you will find the calibration data, for the different setups (filter configurations):
Your Gas Monitoring software 7304 is now ‘loaded’ with the
calibration data, and is now ready for use.
Change of the configuration (set-up) of optical filters can only be
performed from the front-panel of the instrument.
_____________________________________________________________________________
BE6011-16
1314 Photoacoustic Multi-gas Monitor
LumaSense Technologies A/S
1412 Photoacoustic Field Gas-Monitor
Page 31 of 280
Chapter 2
______________________________________________________________________
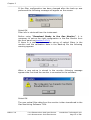
If the filter configuration has been changed after the back-up was
performed the following message will appear on the screen:
Select OK.
Filter info is retrieved from the instrument.
Before using "Download Banks to the Gas Monitor", it is
necessary to set-up the right configuration in the Gas Monitor from
the front panel see section 14.3.3.
If there is a conflict between the set-up of optical filters in the
monitor and the calibration data in the Back-up file the following
warning appears.
When a new set-up is stored in the monitor following message
appears the first time the monitor is connected to the software.
Select OK.
The new optical filter data from the monitor is then transferred to the
Gas Monitoring Software 7304.
_____________________________________________________________________________
BE6011-16
1314 Photoacoustic Multi-gas Monitor
LumaSense Technologies A/S
1412 Photoacoustic Field Gas-Monitor
Page 32 of 280
Chapter 3
______________________________________________________________________
Chapter 3
Philosophy of Operation
July 2009
_____________________________________________________________________________
BE6011-16
1314 Photoacoustic Multi-gas Monitor
LumaSense Technologies A/S
1412 Photoacoustic Field Gas-Monitor
Page 33 of 280
Chapter 3
______________________________________________________________________
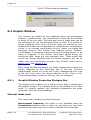
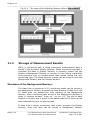
The monitor has several essential operational features, which enable
you to operate it without undue reference to this Instruction Manual.
The main features of the monitor which ensure its simple and easy
operation, are listed below:
•
•
•
•
The fully, comprehensive Gas Monitoring Software 7304.
The short, self-explanatory texts, which appear in the monitor
display when the monitor is being used, give operational guidance
to the user.
The small light-emitting diodes at some of the push-buttons allow
the user to identify how the monitor is operating at any particular
time.
Audible warning “beep” if any push-buttons are used in the wrong
way.
3.1 PC Use – Online
A monitoring system, where you use the PC environment to set-up
the monitor prior to measuring, display measurement data on the PC
screen while monitoring and store the measurement results directly
on the PC’s hard disc. These results can be used by other programs
that use Open Database Connectivity (ODBC). The instructions for
this mode of operation are covered in this manual under the PC Use
headings.
Using the online mode provides you with
Not only are the alarm trigger levels
resulting from an alarm being triggered
This enables you to connect external
monitoring system.
a variety of Alarm options.
definable, but the action
can also be defined here.
warning systems to the
The philosophy behind the Gas Monitoring Software 7304 is common
to almost all Windows programs. Access to the various levels of the
program is gained by use of the MENU BAR, PULL-DOWN MENUS,
NEW WINDOW options and INDEX-CARD separators. These familiar
procedures, together with the simple software structure, make the
instructions in the On-line sections of this manual understandable
and easy to implement.
If you are unsure of any of the commands used in the On-line
instructions, please refer to section 1.2 of this manual or your
Windows manual.
3.2 PC Use – Offline
This method of operation enables you to set-up the monitor using
the PC, download the set-up to the monitor, and then disconnect the
_____________________________________________________________________________
BE6011-16
1314 Photoacoustic Multi-gas Monitor
LumaSense Technologies A/S
1412 Photoacoustic Field Gas-Monitor
Page 34 of 280
Chapter 3
______________________________________________________________________
PC. The monitor is ready for use as a stand-alone instrument. While
monitoring, the monitor stores all the measurement results in its
internal memory. On completion of the monitoring task, the PC and
the monitor can then be connected again and the results uploaded to
the PC. These results can then be displayed on the PC screen
analysed and, if necessary, are available to other software programs.
When Offline operation is required, the On-line instructions in this
manual should be followed. If there is a deviation from these
instructions, this will be indicated in the relevant sections.
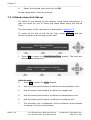
3.3 Stand-alone Use
This method of operation is available to those of you who wish to use
the monitor without connection it to a PC. The monitor is set-up and
the results are displayed via the monitor’s front panel.
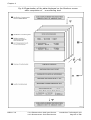
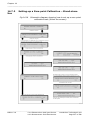
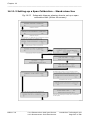
The structure of the monitor set-up can be viewed like an inverted
tree. The main branches divide and separate into minor branches.
These in turn divide again and again.
To move through the tree, the branches are selected using the
“select” push-buttons (see section 1.3). Use the Set-up Tree,
supplied with the monitor and the example steps below to see how
the instructions progress. Starting from the initial screen display.
CURRENT TIME IS 2004-06-13 17:12
MONITOR IS READY FOR USE
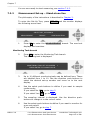
1. Press SET-UP, and the text changes to that displayed below.
MEASUREMENT
SELECT SET-UP BRANCH
FORMAT
CONFIGURATION
_____________________________________________________________________________
BE6011-16
1314 Photoacoustic Multi-gas Monitor
LumaSense Technologies A/S
1412 Photoacoustic Field Gas-Monitor
Page 35 of 280
Chapter 3
______________________________________________________________________
2. To select the MEASUREMENT branch, press S1. (Pressing either
of the other “select” push-buttons will take you along another
branch of the set-up tree. The following text is displayed.
SELECT SET-UP BRANCH
MONITORING TASK
ENVIRONMENT
To select the ENVIRONMENT branch, press S3. The text is
displayed.
AUTO
SELECT FLUSHING MODE
FIXED TIME
3. To select the AUTO flushing mode, press S1. The following text is
LENGTH OF SAMPLING TUBE 00.00 m
PRESS ENTER TO CHANGE VALUE
displayed.
This branch does not divide again. At this stage you are able to
define the parameters in this branch of the tree using the direction
push-buttons.
If the branch had divided again, it is a simply process of using the
correct “select” push-button to continue down the desired branch.
Parameters that are already selected are displayed either with a
cursor under the current selection or the value is displayed on the
top line.
When the correct value or parameter is already selected, you can
continue on through the tree using the ▼direction push-button.
To exit SET-UP mode press SET-UP
_____________________________________________________________________________
BE6011-16
1314 Photoacoustic Multi-gas Monitor
LumaSense Technologies A/S
1412 Photoacoustic Field Gas-Monitor
Page 36 of 280
Chapter 3
______________________________________________________________________
Defining parameters is covered in section 6.2.
The procedures in the example above are common to all the
situations where the “select” push-buttons can be used to access the
different levels in the monitor.
_____________________________________________________________________________
BE6011-16
1314 Photoacoustic Multi-gas Monitor
LumaSense Technologies A/S
1412 Photoacoustic Field Gas-Monitor
Page 37 of 280
Chapter 4
______________________________________________________________________
Chapter 4
Introduction to and Familiarization
with the Monitor
July 2009
_____________________________________________________________________________
BE6011-16
1314 Photoacoustic Multi-gas Monitor
LumaSense Technologies A/S
1412 Photoacoustic Field Gas-Monitor
Page 38 of 280
Chapter 4
______________________________________________________________________
The Monitor is an extremely versatile measuring instrument, which
can be used to perform almost any kind of monitoring task. Its
versatility may appear overwhelming at first, but to avoid such a
reaction, we suggest that you read this chapter thoroughly, and
follow the practical exercises, which are included. These exercises
give you a “guided tour” through a number of different practical
procedures – monitoring task; performance of a monitoring task;
scrolling through data after completion of a monitoring task. By
following these different procedures the Monitor operating philosophy
will become apparent and you will be able to quickly familiarise
yourself with its operation and control.
4.1 Special Terminology
Certain terms are used to describe the operation of the Monitor and
it is necessary to fully understand what these terms mean before you
start any practical exercise with the
Monitor.
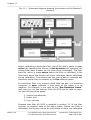
4.1.1 Measurement Cycle
A description of a measurement cycle is given on page 2 of the
Product Data Sheet (see boxed-in text and schematic diagram of the
measurement system of the Monitor). “Measurement Cycle” is the
term used to describe everything that takes place in the Monitor from
the time the pump starts to flush out the “old” gas sample in its
analysis cell, until the signal in the measurement chamber has been
measured using the last relevant optical filter.
The time taken to complete a measurement cycle is dependent upon
the following factors:
How many gases/vapours are being measured – this affects the
number of optical filters which need to be used.
The sample integration time selected – longer measurement times
provide greater accuracy.
The flushing times selected for the measurement chamber and the
tube as well as the length of the sampling tube attached to the
Monitor’s air-inlet – the longer the tube, the more time is needed to
flush it out between measurement cycles.
The cleanliness of air-filters which filter the air drawn into the cell
(this affects the pumping time required to draw a fresh air sample
into the analysis cell).
The degree of fluctuation in the concentration of the various gases
measured in consecutive measurement cycles (this affects the time
required to adjust the gain of the amplifier attached to the
microphones).
_____________________________________________________________________________
BE6011-16
1314 Photoacoustic Multi-gas Monitor
LumaSense Technologies A/S
1412 Photoacoustic Field Gas-Monitor
Page 39 of 280
Chapter 4
______________________________________________________________________
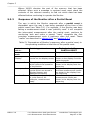
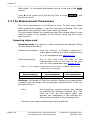
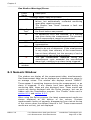
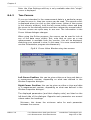
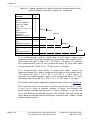
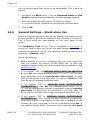
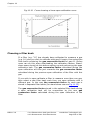
Table 4.1 gives some indication to the measurement times depending
on the number of gases measured and the measurement times
selected. However, these times may vary from one measurement
cycle to another due to the cleanliness of the filters and the degree
of fluctuation in the concentration of the various gases.
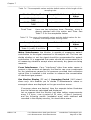
Table 4.1 Approximate measurement times
Monitor Setup
S.I.T.: “Normal” (5s)
Volume of Air
SIT : “Low Noise”
(20s)
140 cm3/sample
Response Times
One gas: ~25s
5 gases + water:
~60 s
5 gases + water:
~150 s
Flushing:
Auto, (tube 1m)
S.I.T.: “Fast” (1s)
Flushing:
Chamber 4s, Tube
“OFF”
4.1.2
20cm3/sample
One gas: ~13s
5 gases + water:
~27s
Monitoring Task
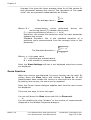
A monitoring task consists of a series of similar measurement cycles.
These cycles can either be repeated at regular intervals or be
continuous:
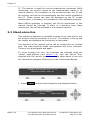
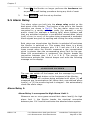
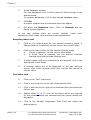
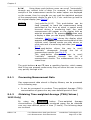
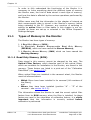
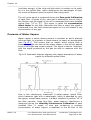
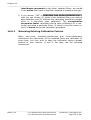
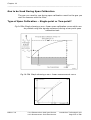
Sampling Interval
The sampling interval is a measure of the time between the start of
one measurement cycle and the start of the following measurement
cycle.
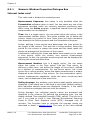
When the Monitor is not sampling continuously the sampling interval
has to be defined by the user and is a fixed period of time (see
Fig.4.1).
_____________________________________________________________________________
BE6011-16
1314 Photoacoustic Multi-gas Monitor
LumaSense Technologies A/S
1412 Photoacoustic Field Gas-Monitor
Page 40 of 280
Chapter 4
______________________________________________________________________
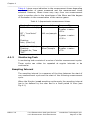
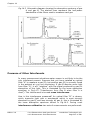
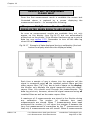
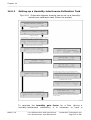
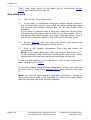
Fig.4.1
An illustration of the fixed sampling intervals of the monitor
when it is not sampling continuously.
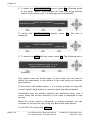
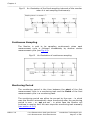
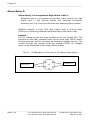
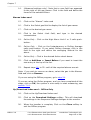
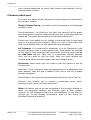
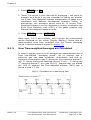
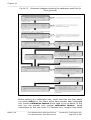
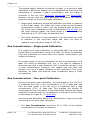
Continuous Sampling
The Monitor is said to be sampling continuously when each
measurement cycle is followed immediately by another similar
measurement cycle (see Fig.4.2).
Fig.4.2
An illustration of continuous sampling
Monitoring Period
The monitoring period is the time between the start of the first
measurement cycle in a monitoring task and the finish of the final
measurement cycle in a monitoring task.
The monitoring period can either be pre-set by the user – in which
case the Monitor automatically stops monitoring after the monitoring
period is over – or, not pre-set – in which case the Monitor will
continue to monitor until the user stops the monitoring task manually
(see section 4.3.6).
_____________________________________________________________________________
BE6011-16
1314 Photoacoustic Multi-gas Monitor
LumaSense Technologies A/S
1412 Photoacoustic Field Gas-Monitor
Page 41 of 280
Chapter 4
______________________________________________________________________
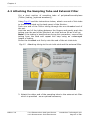
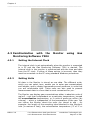
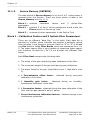
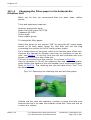
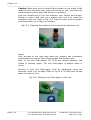
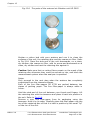
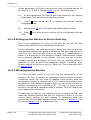
4.2 Attaching the Sampling Tube and External Filter
Cut a short section of sampling tube of polytetrafluoroethylene
(Teflon) tubing, (optional accessory).
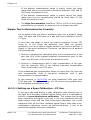
Using Fig.4.3 and the instructions below, attach one end of this tube
to the air-inlet stub on the back-panel of the Monitor.
Push one end of the Teflon tubing through the non-threaded end of
the nut.
Hold the end of the tubing between the fingers and gently push the
tubing over the end of the Monitor’s air-inlet stub as far as it will go.
Note: if the tubing is bent/broken during this procedure, remove the
tubing from the stub and repeat this step using an undamaged
length of tubing.
Screw the threaded-nut firmly onto the end of the air-inlet stub.
Fig.4.3
Attaching tubing to the air-inlet stub and the external filter
3. Attach the other end of the sampling tube to the external air-filter
which is provided as an optional accessory.
_____________________________________________________________________________
BE6011-16
1314 Photoacoustic Multi-gas Monitor
LumaSense Technologies A/S
1412 Photoacoustic Field Gas-Monitor
Page 42 of 280
Chapter 4
______________________________________________________________________
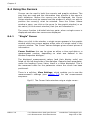
4.3 Familiarization with the
Monitoring Software 7304
4.3.1
Monitor
using
Gas
Setting the Internal Clock
The internal clock is set automatically when the monitor is connected
to a PC and the Gas Monitoring Software 7304 is started. The
internal clock in the monitor is synchronised with the time and date
from the PC clock. If either of these entries is incorrect, then they
must be corrected via the PC using standard Windows procedures.
4.3.2
Setting Units
All data in the Monitor is stored as raw data. The different units,
which you can select here, enable you to enter gas concentrations
and lengths, and to display temperatures and pressures in units that
you are comfortable with. These units are also used to present
measurement data in a form that is most convenient for you.
The Monitor can display gas concentrations either in absolute units of
mg/m3 – unit that is dependent on a particular temperature, termed
the normalization temperature, or in units of parts per million (by
volume) – which is independent of the temperature of the gas. You
can inform the Monitor about the units you intend to use – for
example: the length of the sampling tube attached to the Monitor’s
inlet (in metres of feet); the normalization temperature (°C of °F or
_____________________________________________________________________________
BE6011-16
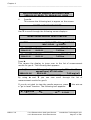
1314 Photoacoustic Multi-gas Monitor
LumaSense Technologies A/S
1412 Photoacoustic Field Gas-Monitor
Page 43 of 280
Chapter 4
______________________________________________________________________
K); the units of atmospheric pressure (kPa or mBar or mmHg) and
unit for humidity (ppm or Tdew or kPa or mg/m3).
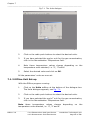
With the Monitor and the PC connected properly, as described in
section 2.2 and section 2.5, and the Gas Monitoring Software already
running:
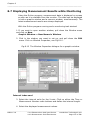
Click on Online to start this option.
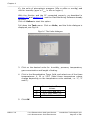
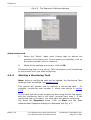
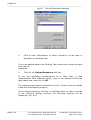
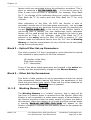
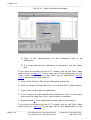
Pull down the Task menu. Click on Units, and the Units dialogue is
displayed, see Fig.4.4.
Fig.4.4 The Units dialogue
3. Click on the desired units for: humidity, pressure, temperature,
gas concentration and length of tubing.
4. Click in the Normalization Temp. field, and select one of the three
temperatures: 0, 20 or 25°C (Note these temperature values
change depending on the temperature units selected, i.e. °C, °F
and K).
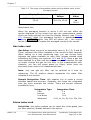
Unit
°C
°F
K
Normalization Temp.
Values
0°C, 20°C and 25°C
32°F, 68°F and 77°F
273K, 293K and 298K
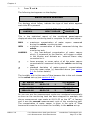
5. Click OK.
_____________________________________________________________________________
BE6011-16
1314 Photoacoustic Multi-gas Monitor
LumaSense Technologies A/S
1412 Photoacoustic Field Gas-Monitor
Page 44 of 280
Chapter 4
______________________________________________________________________
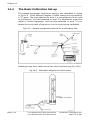
4.3.3
Setting-up a Monitoring Task
The optical filters in the Monitor have to be calibrated before they
can be used to measure gas concentrations. The user can only set-up
a monitoring task using those optical filters which have been
installed. In this example, we have chosen to measure gas A (that is,
to measure gas A’s concentration using the optical filter installed in
position “A” of the filter carousel) and water vapour. If your Monitor
has only been calibrated to measure with another filter (for example,
the filter in position “B”) then choose gas B to replace gas A in the
following instructions. The parameters which describe the monitoring
task we shall set-up, are listed below:
Online Settings
Sampling index card
Monitoring Task name = Area 1
Sampling Mode = Continuous
Flushing = Auto, Tube Length = 1m
Gas Monitor Display = Instantaneous (i.e. no tick in check box)
Gas index card
Gas Set-up: Active = A: Ethanol & water
Sample Integration Time = Normal (5s)
Alarm index card
None active (i.e. none displayed in the Alarms field)
With the monitor and the PC connected properly, as described in
section 2.2 and
section 2.5, and the Gas Monitoring Software 7304 already running:
1.
Click on Online to start this option.
2.
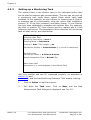
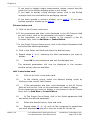
Pull down the Task menu. Click on New, and the New
Measurement Task dialogue is displayed, see Fig. 4.5.
_____________________________________________________________________________
BE6011-16
1314 Photoacoustic Multi-gas Monitor
LumaSense Technologies A/S
1412 Photoacoustic Field Gas-Monitor
Page 45 of 280
Chapter 4
______________________________________________________________________
Fig.4.5
The New Measurement Task dialogue
Type in the desired name for the monitoring task, i.e. Area 1.
Press OK. The name you have just typed in appears at the top of the
window. An extended menu bar and a graphic window appear.
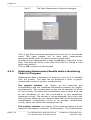
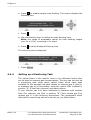
3.
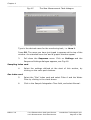
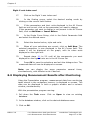
Pull down the Sequence menu. Click on Settings and the
Sequence Settings dialogue appears, see Fig.4.6.
Sampling index card
4.
Select the settings defined at the start of this section, by
clicking on the radio push-buttons.
Gas index card
5.
Select the “Gas” index card and select Filter A and the Water
Filter by clicking in the check boxes.
6.
Click in the Sample Integration Time field, and select Normal.
_____________________________________________________________________________
BE6011-16
1314 Photoacoustic Multi-gas Monitor
LumaSense Technologies A/S
1412 Photoacoustic Field Gas-Monitor
Page 46 of 280
Chapter 4
______________________________________________________________________
Fig.4.6. The Sequence Settings dialogue
Alarm index card
7.
Select the “Alarm” index card. Ensure that no alarms are
selected in the Alarm box. If any alarms are selected, click on
the name and then click on Remove.
8.
When all the settings are correct, click on OK.
The monitoring task is now set-up. This information is not transferred
to the monitor until you start monitoring.
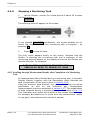
4.3.4
Starting a Monitoring Task
Note: before a monitoring task can be started, the Monitoring Task
Settings must be defined, see section 4.3.3.
This section will explain how to perform a monitoring task – for
example, monitoring task number 1, which was set-up in section
4.3.3.
If you have just set up the monitoring task using the On-line option,
and the monitoring task is still open, proceed from step 1. If the
monitoring task is not open, you must open one before continuing.
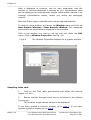
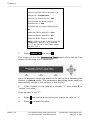
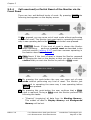
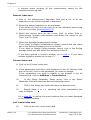
Pull down the Sequence menu. Click on Start and the Start
measurement Sequence dialogue is displayed, see Fig. 4.7.
_____________________________________________________________________________
BE6011-16
1314 Photoacoustic Multi-gas Monitor
LumaSense Technologies A/S
1412 Photoacoustic Field Gas-Monitor
Page 47 of 280
Chapter 4
______________________________________________________________________
Fig.4.7
The Start Measurement Sequence dialogue
Click in the Enter sequence description field and type in the desired
name. This name enables you to have many measurement
sequences stored under the same monitoring task name.
In order for the measurement to start immediately, select Now in the
Start Time field and None in the Stop Time field by clicking on the
radio push-buttons.
Click on OK to start a monitoring task.
4.3.5
Displaying Measurement Results while a Monitoring
Task is in Progress
Measurement data is displayed on screen as soon as it is available
from the monitor. The data can be displayed in both a graphic
window and a numeric window, simultaneously.
The graphic window: can display all the measured gas
concentrations and the measured atmospheric pressure as graphs,
simultaneously. The concentration curves can be allocated to either
of the two axes. The scale and concentration units of these axes can
be set individually to suit the concentration of the parameters
displayed on them. The number of curves displayed, their colour and
their style are defined by you. Measurement data can be displayed as
instantaneous concentration curves or as average concentration
curves, where you define the averaging interval.
The numeric window: can display all the measured gases and the
measured atmospheric pressure, simultaneously. The measurement
_____________________________________________________________________________
BE6011-16
1314 Photoacoustic Multi-gas Monitor
LumaSense Technologies A/S
1412 Photoacoustic Field Gas-Monitor
Page 48 of 280
Chapter 4
______________________________________________________________________
data is displayed in columns, one for each parameter, and the
number of columns displayed is defined by you. Measurement data
can be displayed as instantaneous sample concentration values or as
average concentration values, where you define the averaging
interval.
With the Online option selected and a monitoring task started:
To open an extra window, pull down the Window menu and click on
New Graphic Window or New Numeric Window. The measured
parameters are automatically displayed in this window.
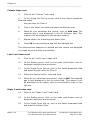
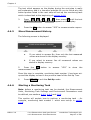
Click in the window you want to set up, and pull down the Edit
menu. Click in Window Properties, see Fig. 4.8.
Fig.4.8
The Window Properties dialogue for a graphic window
Sampling index card
1.
Click on the Time radio push-button and define the interval
length to 1 min.
2.
Ensure that the Average check box is not ticked in the Sample
Type group.
This enables single sample values to be displayed.
If you have opened a numeric window, go to step 3. If you have
opened a graphic window go to step 9.
_____________________________________________________________________________
BE6011-16
1314 Photoacoustic Multi-gas Monitor
LumaSense Technologies A/S
1412 Photoacoustic Field Gas-Monitor
Page 49 of 280
Chapter 4
______________________________________________________________________
Column index card
3.
Click on the “Column” index card.
4.
In the Single Gas Set-up group, click in the Select parameter
field and select
the gas name for Filter A.
5.
Click in the Select unit field and select the desired units.
6.
When all your selections are correct, click on Add new. The
selected gas is now displayed in the All Columns field. This
means it will be displayed in the numeric window.
7.
Repeat steps 6 to 8 selecting the Water filter.
8.
Press OK to save selections and exit the dialogue box.
The measurement sequence is started and the results are displayed
on screen as soon as they are available.
Left Y-axis index card
9.
Click on the “Left Y-axis” index card.
10.
In the Scaling group, click on the radio push-button next to
Autoscale maximum and minimum.
11.
In the Single Curve Set-up, click in the Select parameter field
and select the gas name for Filter A.
12.
Select the desired colour, style and units.
13.
When all your selections are correct, click on Add. The selected
gas is now displayed in the All curves field. This means it will
be displayed on the graph, with its concentration scale on the
left axis.
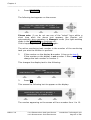
Right Y-axis index card
14.
Click on the “Right Y-axis” index card.
15.
In the Scaling group, click on the radio push-button next to
Autoscale maximum and minimum.
16.
In the Single Curve Set up, click in the Select parameter field
and select the Water Filter.
_____________________________________________________________________________
BE6011-16
1314 Photoacoustic Multi-gas Monitor
LumaSense Technologies A/S
1412 Photoacoustic Field Gas-Monitor
Page 50 of 280
Chapter 4
______________________________________________________________________
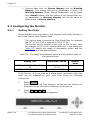
4.3.6
17.
Select the desired colour, style and units.
18.
When all your selections are correct, click on Add. The selected
gas is now displayed in the All curves field. This means it will
be displayed on the graph, with its concentration scale
displayed on the right axis.
19.
Press OK to save the selections and exit the dialogue box. The
measured data will now be displayed on screen.
Stopping a Monitoring Task
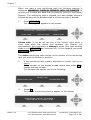
Pull down the Sequence window and click on Stop.
4.3.7
Scrolling
through
Measurement
Completion of a Monitoring Task
Results
on
Open the Presentation option of the Gas Monitoring Software 7304:
1.
Pull down the Task menu. Click on Open and the Open
Measurement Task dialogue is displayed.
2.
In the select Task box, select the desired name.
3.
Click on OK and a graphic window is displayed.
4.
If you want a numeric window, pull down the Window menu
and click on
New Numeric Window. A numeric window is displayed.
Sampling index card
5.
Click in the Measurement Sequence field and select the desired
sequence
name.
6.
Click on the Time radio push-button. The time period for the
measurement
sequence is displayed in the From: and To: fields.
7.
Ensure that the Average check box in the Sample Type group is
not ticked.
If you have opened a numeric window, go to step 8. If you have
opened a graphic window go to step 14.
_____________________________________________________________________________
BE6011-16
1314 Photoacoustic Multi-gas Monitor
LumaSense Technologies A/S
1412 Photoacoustic Field Gas-Monitor
Page 51 of 280
Chapter 4
______________________________________________________________________
Column index card
8.
Click on the “Column” index card.
9.
In the Single Column Set up group, click in the Select
parameter field and select the gas name for Filter A.
10.
Click in the Select unit field and select the desired units.
11.
When all your selections are correct, click on Add new. The
selected gas is now displayed in the All Columns field. This
means it will be displayed in the numeric window.
12.
Repeat steps 9 to 11, selecting the Water filter.
13.
Press OK to save selections and exit the dialogue box.
To display the Event markers, go to step 24.
Left Y-axis index card
14.
Click on the “Left Y-axis” index card.
15.
In the Scaling group, click on the Autoscale maximum and
minimum radio push-button.
16.
In the Single Curve Set-up, click Select parameter field and
select the gas name for Filter A.
17.
Select the desired colour, style and units.
18
When all your selections are correct, click on Add. The selected
gas is now displayed in the All Curves field. This means it will
be displayed on the graph, with its concentration scale on the
left axis.
Right Y-axis index card
19.
Click on the “Right Y-axis” index card.
20.
In the Scaling group, click on the Autoscale maximum and
minimum radio push-button.
21.
In the Single Curve Set-up, click in the Select parameter field
and select the Water Filter
22.
Select the desired colour, style and units.
_____________________________________________________________________________
BE6011-16
1314 Photoacoustic Multi-gas Monitor
LumaSense Technologies A/S
1412 Photoacoustic Field Gas-Monitor
Page 52 of 280
Chapter 4
______________________________________________________________________
23.
When all your selections are correct, click on Add. The selected
gas is now displayed in the All curves field. This means it will
be displayed on the graph, with its concentration scale
displayed on the right axis.
Events index card
4.3.8
24.
Click on the “Events” index card.
25.
Click in all event check boxes to enable all the event markers,
if there are any, to be displayed. The event markers appear as
vertical lines with a letter at the end of them. See section 8.5
for full details.
26.
Press OK to save the selections and exit the dialogue box. The
measured data will now be displayed on screen.
Changing Units after a Monitoring Task
The Monitor has all the measurement data as SI units. So, to change
any of the displayed parameters’ units, it is simply a case of
repeating the instructions in section 4.3.2.
For example, change the selected concentration units to ppm and see
how they are displayed on screen.
4.4 Familiarization with the Monitor using Front Panel
4.4.1
Setting the Internal Clock
Before dispatch from the factory, the internal clock of the Monitor is
set to the correct local (Danish) time. If the monitor is to be used as
a stand-alone instrument, then the clock can be adjusted to your
local time using the following instructions.
1. Switch on the AC Mains power switch on the back-panel of the
Monitor.
2. Press SET-UP.
Refer to the Set-Up Tree, supplied with the Monitor, so that you can
follow your movement through the various branches of this “tree” in
the following sequence of button presses.
3. Press S3
S1
S1.
_____________________________________________________________________________
BE6011-16
1314 Photoacoustic Multi-gas Monitor
LumaSense Technologies A/S
1412 Photoacoustic Field Gas-Monitor
Page 53 of 280
Chapter 4
______________________________________________________________________
The following screen picture appears:
CURRENT DATE 2004-04-19
PRESS ENTER TO CHANGE VALUE
Dates are entered as the Year-Month-Day, for example the 19th April,
2004 has to be entered as 2004-04-19.
4. To change the date, press ↵ .
5. Use the direction keys to enter the correct date.
Note: press S1 to revert back to the original date.
6. Press ↵ to accept date.
This causes the text on the display screen to change to the
following:
CURRENT TIME 12:00
PRESS ENTER TO CHANGE VALUE
7. To change the time, press ↵.
8. Use the direction keys to enter the correct time. If you make a
mistake in entering the correct date just press S1 and start again.
The current time is entered as the time read on a 24-hour digital
clock. For example, 13:45 is 15 minutes to 2 o’clock in the afternoon.
9. Press ↵ to accept time.
When this step is completed, the display then moves to the previous
head of the Set-Up Tree.
10. Press ▲ three times and follow the path you take en route
through the Set-Up Tree.
The screen display shows the following text:
_____________________________________________________________________________
BE6011-16
1314 Photoacoustic Multi-gas Monitor
LumaSense Technologies A/S
1412 Photoacoustic Field Gas-Monitor
Page 54 of 280
Chapter 4
______________________________________________________________________
MEASUREMENT
11.
4.4.2
SELECT SET-UP BRANCH
FORMAT
CONFIGURATION
Press SET-UP to exit.
Setting Units
All data in the Monitor is stored as raw data. The different units,
which you can select here, enable you to enter gas concentrations
and to display temperatures, lengths and pressures in units, which
you are comfortable with. These units are also used to present
measurement data in a form that is most convenient for you.
The Monitor can display gas concentrations either in absolute units of
mg/m3 unit that is dependent on a particular temperature, termed
the normalization temperature, or in units of parts per million (by
volume) – which is independent of the temperature of the gas. You
can inform the monitor about the units you intend to use – for
example: the length of the sampling tube attached to the Monitor’s
inlet (in meters or feet) atmospheric pressure (kPa or mBar or
mmHg) and unit for humidity (ppm or Tdew or kPa or mg/m3).
The measurement units can be changed using the push-buttons on
the front of the monitor:
1. Press SET-UP.
2. Press S3 and then S2.
The following text appears on the screen display:
SELECT CONCENTRATION UNIT
mg/m3
ppm
The cursor appears under the unit which is presently in the active
set-up.
3. Press S1 to select mg/m3.
_____________________________________________________________________________
BE6011-16
1314 Photoacoustic Multi-gas Monitor
LumaSense Technologies A/S
1412 Photoacoustic Field Gas-Monitor
Page 55 of 280
Chapter 4
______________________________________________________________________
4. Select metres as the unit of length, °C as the temperature unit,
and kPa as the pressure unit by using a procedure similar to that
described in the previous steps.
After the pressure unit has been selected the following text appears
on the display:
SELECT HUMIDITY UNIT
mg/m3
PRESS ENTER TO CHANGE VALUE
There are more than three humidity units to choose from, therefore
the means by which a unit is selected differs:
5. Press ↵ .
6. Use ▲ & ▼ to scroll through the options.
7. When Tdew is displayed, press ↵ .
The display automatically returns
CONFIGURATION setup branch.
to
the
head
of
the
8. Press SET-UP to exit.
4.4.3
Setting the Environment Parameters
Environmental parameters describe the factors which influence the
measurement situation – the length of the sampling tube attached to
the Monitor and the normalization temperature. These parameters
are discussed more fully later on in this section.
1. Press SET-UP, S1 and then S3.
This brings you into the Environment branch of the Set-Up Tree
where the following text is displayed:
AUTO
SELECT FLUSHING MODE
FIXED TIME
_____________________________________________________________________________
BE6011-16
1314 Photoacoustic Multi-gas Monitor
LumaSense Technologies A/S
1412 Photoacoustic Field Gas-Monitor
Page 56 of 280
Chapter 4
______________________________________________________________________
The Auto option regulates the flushing time depending on the
sampling tube length and the cleanliness of the air-filter (as the filter
become dirtier, the flushing time will increase). The Fixed Time
option is divide in to two parts; chamber flushing time and sample
tube flushing time. Once defined, these times are constant regardless
of the sampling tube length and cleanliness of the filters.
Auto Option
a. Press S1, and the following display appears.
LENGTH OF SAMPLING TUBE 0.00 m
PRESS ENTER TO CHANGE VALUE
b. Press ↵ .
c. Use the direction keys to define the tube length: ▲ and ▼ to
increase and decrease
the numbers, respectively; W and X to move the cursor across the
fields.
Change the length of the sampling tube shown on the screen to
the length of the tube you attached to the Monitor in section 4.2.
Note: the range of acceptable values for the sampling tube
ranges from 00.00m to 99.00m.
d. Press ↵ to select displayed length.
The following display appears:
NORMALIZATION TEMPERATURE 20.0 º C
PRESS ENTER TO CHANGE VALUE
_____________________________________________________________________________
BE6011-16
1314 Photoacoustic Multi-gas Monitor
LumaSense Technologies A/S
1412 Photoacoustic Field Gas-Monitor
Page 57 of 280
Chapter 4
______________________________________________________________________
The Monitor measures gas concentrations in the absolute unit of
mg/m3 – a unit which is dependent on temperature. Alternatively,
the Monitor can calculate gas concentrations in parts per million
(ppm) by volume – this unit is independent of the temperature of
the gas. If mg/m3 is chosen as the gas concentration unit it is
therefore necessary to define the temperature at which you wish the
Monitor to calculate gas concentrations. This pre-defined
temperature is termed the NORMALIZATION TEMPERATURE.
e. Press ↵ to change value.
f. Use the direction keys to define the normalization temperature: ▲
and ▼ to increase and decrease the numbers, respectively; W and
X to move the cursor across the fields.
g. Press ↵ to select displayed temperature.
The display screen then jumps to the “head” of the MEASUREMENT
branch of the Set-Up Tree and the following text is shown:
SELECT MEASUREMENT SET-UP BRANCH
MONITORING TASK
ENVIRONMENT
Fixed Time Option
a. Press S3, and the screen displays the following text.
CHAMBER FLUSHING TIME 8 s
PRESS ENTER TO CHANGE VALUE
b. Press ↵ .
c. Use the direction keys to define the chamber flushing time.
Note: the range of acceptable values for chamber flushing ranges
from 2s to 60s, increasing in 1s intervals.
d. Press ↵ to select displayed flushing time, and the following text is
displayed.
NO
TUBE FLUSHING ?
YES
_____________________________________________________________________________
BE6011-16
1314 Photoacoustic Multi-gas Monitor
LumaSense Technologies A/S
1412 Photoacoustic Field Gas-Monitor
Page 58 of 280
Chapter 4
______________________________________________________________________
e. Press S3 to enable sample tube flushing. The screen displays the
following text.
TUBE FLUSHING TIME
3s
PRESS ENTER TO CHANGE VALUE
f. Press ↵ .
g. Use the direction keys to define the tube flushing time.
Note: the range of acceptable values for tube flushing ranges
from 3s to 120s, increasing in 1s steps.
h. Press ↵ to select displayed flushing time.
The following text is displayed.
NORMALIZATION TEMPERATURE
20.0°C
PRESS ENTER TO CHANGE VALUE
i. Press SET-UP
4.4.4
Setting up a Monitoring Task
The optical filters in the monitor have to be calibrated before they
can be used to measure gas concentrations. The user can only set-up
a monitoring task using those optical filters which have been
installed. In this example we have chosen to measure gas A (that is,
to measure gas A’s concentration using the optical filter installed in
position “A” of the filter carousel) and water vapour.
If your Monitor has only been calibrated to measure with another
filter (for example, the filter in position “B”) then choose gas B to
replace gas A in the following instructions. The parameters which
describe the monitoring task we shall set-up, are listed below:
_____________________________________________________________________________
BE6011-16
1314 Photoacoustic Multi-gas Monitor
LumaSense Technologies A/S
1412 Photoacoustic Field Gas-Monitor
Page 59 of 280
Chapter 4
______________________________________________________________________
Stand-alone Settings
Monitoring Task Set-up Number = 1
Sampling = Continuous
Monitor for preset period = No
Compensate for Water Vapour
Interference = Yes
Compensate for cross-interference =
No
Measure Gas A: XXXXXX = Yes
Measure Gas B: XXXXXX = No
Measure Water Vapour = Yes
Note: flushing is set in Environmental
Parameters, section 4.4.3, and the
S.I.T’s are set up in the Filters setup,
section 14.3.3
1.
Press SET-UP, S1 and then S1.
This brings you into the Monitoring Task branch of the Set-Up Tree
where the following text is displayed:
MONITORING TASK SET-UP NUMBER
PRESS ENTER TO CHANGE VALUE
1
Up to 10 different monitoring tasks can be set-up while operating the
Monitor in Set-up mode. The parameters describing these tasks are
automatically stored in the memory of the Monitor.
2.
If the number on the display is already “1” then press T to
“accept” the value.
If the number is not “1”:
a.
Press ↵ and use the direction keys to change its value to “1”.
b.
Press ↵ to accept the value.
_____________________________________________________________________________
BE6011-16
1314 Photoacoustic Multi-gas Monitor
LumaSense Technologies A/S
1412 Photoacoustic Field Gas-Monitor
Page 60 of 280
Chapter 4
______________________________________________________________________
The text which appears on the display during the next step is really
self-explanatory and it is therefore possible for you to follow why the
button-pushes listed in the next step will set-up the monitoring task
which is described at the beginning of section 4.4.4.
4.4.5
3.
Press S3 S1 S3 S1 S3, then press S1 until the text
MEASURE WATER
VAPOUR appears on the display.
4.
Press the S3 button to answer “YES” to measure water vapour.
Store Measurement History.
The following screen is displayed.
NO
STORE MEASUREMENT HISTORY
YES
a.
If you select to answer No, then only the last measured
values are stored in the display memory.
b.
If you select to answer Yes all measured values are
stored in display memory.
5.
Press the S3
measurement history.
button
to
answer
“YES”
to
store
the
Once this step is complete, monitoring task number 1 has been setup and the display moves to the previous head of the Set-Up Tree.
6.
4.4.6
Press SET-UP to exit the Set-Up mode.
Starting a Monitoring Task
Note: before a monitoring task can be started, the Measurement
Units, Monitoring Task Settings and Environment Parameters must
be defined, see sections 4.4.2, 4.4.3 and 4.4.4.
This section will explain how to perform a monitoring task – for
example, monitoring task number 1 which was set-up in section
4.4.4.
_____________________________________________________________________________
BE6011-16
1314 Photoacoustic Multi-gas Monitor
LumaSense Technologies A/S
1412 Photoacoustic Field Gas-Monitor
Page 61 of 280
Chapter 4
______________________________________________________________________
1.
Press MEASURE.
The following text appears on the screen:
ACTIVE TASK: MONITORING TASK NUMBER 1
START TASK
DELAYED TASK
CHANGE TASK
Please note: if you do not use one of the “select” keys within a
short time after the above text appears, the Monitor will
automatically stop operating in Measure mode (the light-emitting
diode in the MEASURE key switches off).
If this happens just press MEASURE again.
The active monitoring task number is the number of the monitoring
task you wish the Monitor to perform.
2.
If the number on the display is number 1 then go to step 5.
If the number on the display is not number 1 then press S2 to
change the task number to number 1.
This changes the display text to the following:
MONITORING TASK
3.
SELECT TASK
CALIBRATION TASK
Press S1.
This causes the following text to appear on the display:
MONITORING TASK SET-UP NUMBER
PRESS ENTER TO CHANGE VALUE
1
The number appearing on the screen will be a number from 1 to 10.
_____________________________________________________________________________
BE6011-16
1314 Photoacoustic Multi-gas Monitor
LumaSense Technologies A/S
1412 Photoacoustic Field Gas-Monitor
Page 62 of 280
Chapter 4
______________________________________________________________________
4.
Press ↵ and use the direction keys to change the monitoring
task number to 1.
Then press ↵ again to accept the task number.
The following text appears on the display screen:
ACTIVE TASK: MONITORING TASK NUMBER 1
START TASK
DELAYED TASK
CHANGE TASK
5.
Press S1 to start the monitoring task.
The following warning then appears on the display:
WARNING: DISPLAY MEMORY WILL BE DELETED
PROCEED
STOP
Display Memory is where the Monitor stores the results of all
measurements while it is performing a monitoring task. If the
monitoring task is stopped and then started again all the data
already collected will be deleted from Display Memory. However, the
data in Display Memory can be copied into and stored in the
Monitor’s Background Memory. This operation is described in section
11.2.
6.
Press S1.
The following text then appears on the screen:
MEASUREMENT IN PROGRESS
RESULTS NOT YET AVAILABLE
7.
When the first measurement cycle is complete the Monitor will
automatically display the results and update them every time a
new measurement cycle is completed. An example is shown
below:
_____________________________________________________________________________
BE6011-16
1314 Photoacoustic Multi-gas Monitor
LumaSense Technologies A/S
1412 Photoacoustic Field Gas-Monitor
Page 63 of 280
Chapter 4
______________________________________________________________________
A: 84.5 E+00
D:________
B:________
E:________
C: ________
W: 8.25 E+00
This display gives the overview of the gas/vapour concentrations last
measured – in this case the concentration of gas A and humidity of
the water vapour are in the units that were selected – that is mg/m3
for gas A and Tdew for water vapour (see section 4.4.2).
4.4.7
Displaying Measurement Results while a Monitoring
Task is in Progress
If store measurement history is selected in the MEASUREMENT setup branch (see section 4.4.5) all measurement data collected during
a monitoring task is stored in Display Memory together with the
parameters which describe the task (see section 4.4.4).
Using the direction keys, you can scroll through this data.
1.
After the monitoring task has been running for 10-15 minutes,
press T.
An example of the text which appears on the screen is shown below:
DATA IN DISPLAY MEMORY RECORDED
FROM
2004-01-16 09:50 TO 2004-01-16 10:04
This screen text allows you to find out how long the monitoring task
has been running here from 9:50 to 10:04 on the same day. The
date on the right-handside of the display indicates the time at which
the last measurement cycle was completed while a monitoring task is
in progress this date is, of course, constantly updated.
2. Press T and then use W & X until the following text appears on
the display:
FILTER A USED TO MEASURE
(the name of the gas will appear here)
The displays which follow, indicate the type of text which appears
each time T is pressed:
_____________________________________________________________________________
BE6011-16
1314 Photoacoustic Multi-gas Monitor
LumaSense Technologies A/S
1412 Photoacoustic Field Gas-Monitor
Page 64 of 280
Chapter 4
______________________________________________________________________
GAS A:
MAX 84.5E+00 μ
8.03+00
ALARM 1________
MIN 7.42E+00 σ 2.36E+00
While a monitoring task is being performed a running statistical
analysis of the monitored gases/vapours is made and the results are
displayed as shown above, where:
MAX
=
maximum concentration of gas A measured during the
period of time the monitoring task has been performed.
MIN =
minimum concentration of gas A measured during the
period of time the monitoring task has been performed.
ALARM 1= the user-defined concentration of gas A which, if
measured by the Monitor, will trigger a switch in the
Monitor and activate an external alarm relay connected to
it.
μ
=
linear average, or mean value, of all the gas A
concentrations measured during the period of time the
monitoring task has been performed
σ
=
standard deviation of gas A’s concentrations from the
mean value (μ) described above (see section 9.1 for
further details).
All numbers are written in the exponential form, for example:
84.5E+00 = 84.5 x 10+0 = 84.5
The concentration unit in this case is mg/m3 as this was chosen in
the active set-up (see section 4.4.2).
3.
Press T.
A:
(the name of the gas being measure by Filter A will appear here)
2004-01-16
A:
972.06 mBar
09:50:32 ___________
7.42 mg/m3
(the name of the gas being measure by Filter A will appear here)
2004-01-16
972.06 mBar
09:51:33 ___________
7.42 mg/m3
As you can see, the display provides the date and time at which the
measurement was made, and the concentration of gas A is given in
the units mg/m3 because this was the unit chosen for gas
concentration in the active set-up. The dashed lines, which appear
after the time will be replaced by a number as soon as the
monitoring task has been stopped (see section 4.4.8).
_____________________________________________________________________________
BE6011-16
1314 Photoacoustic Multi-gas Monitor
LumaSense Technologies A/S
1412 Photoacoustic Field Gas-Monitor
Page 65 of 280
Chapter 4
______________________________________________________________________
After scrolling through the list of individual measurement results for
gas A, the following text is displayed:
SAMPLING IS CONTINUOUS
MONITORING PERIOD IS NOT PRE-SET
COMPENSATION FOR WATER VAP. INTERFERENCE
MONITORING TASK STARTED
2004-01-16 09:50
MEASUREMENT CHAMBER TEMPERATURE 29.6°C
SAMPLE INTEGRATION TIME
A: 5s
B:___s
C:___s
D:___s
W: 5s
E:___s
A:Carbon monoxide B:__________ C:___________
D: _________
E:__________ W: WATER VAP
A: 7.42E+00
B:__________
C:___________
D: _________
E:__________ W:
8.13+00
The last display above shows the up-dated overview of the gas
concentrations measured during the most recent measurement cycle.
This display does not appear, after the monitoring task has been
stopped.
Data collected during a monitoring task i stored in the Display
Memory of the Monitor and therefore, before a new monitoring task
is started, all data stored in this memory is deleted. Display Memory
has finite size, and therefore there is a limit to how much data can
be stored in it. Once this memory has been filled-up all subsequent
data collected during the task will start to overwrite the data already
collected during the start of the monitoring task. Only in this event
will the date displayed after the text MONITORING TASK STARTED
on the above screen be different from the earliest date on the
display (shown below) which give the most up-to-date overview of
the monitoring task:
_____________________________________________________________________________
BE6011-16
1314 Photoacoustic Multi-gas Monitor
LumaSense Technologies A/S
1412 Photoacoustic Field Gas-Monitor
Page 66 of 280
Chapter 4
______________________________________________________________________
DATA IN DISPLAY MEMORY RECORDED FROM
2004-01-16 09:50 TO 2004-01-16 10:04
4.
Press X.
This causes the following text to appear on the screen:
WATER VAPOUR MEASURED
Use T to scroll through the following screen displays:
MONITORING PERIOD IS NOT PRE-SET
WATER:
MAX 8.55E+00 μ 8.15+00
MIN 7.01E+00 σ 816E-03
W: WATER VAPOUR:
2004-01-16
09:50:32 _________
971.88mBar
7.39Tdew
W: WATER VAPOUR:
2004-01-16
09:51:33 _________
971.88mBar
7.49Tdew
Press X.
This causes the display to jump over to the list of measurement
results for gas A. The following text appears:
A: (the name of the gas being measure by Filter A will
appear here) 972.06 mBar
2004-01-16
09:51:33 ___________
7.43 mg/m3
By using S and T you can now scroll through the list of
measurement results for gas A.
If you do not wish to view the results anymore, press ↵ , this acts as
a “go to head” function. The following text appears:
A: 7.42E+00
B:__________
C:___________
D: _________
E:__________ W:
8.13+00
_____________________________________________________________________________
BE6011-16
1314 Photoacoustic Multi-gas Monitor
LumaSense Technologies A/S
1412 Photoacoustic Field Gas-Monitor
Page 67 of 280
Chapter 4
______________________________________________________________________
4.4.8
Stopping a Monitoring Task
1.
Let the Monitor, monitor for a total period of about 30 minutes
and then press
MEASURE.
The following text will appear on the screen:
NO
STOP MONITORING TASK ?
YES
If you pressed MEASURE accidentally, this screen enables you to
cancel the request to stop the monitoring task in progress – by
pressing S1.
2.
Press S3 to stop the task.
The text, which appears briefly on the screen, indicates that the
Monitor is aborting the monitoring task and a summary of the
monitoring task will appear on the display as soon as the Monitor has
aborted the task. For example:
DATA IN DISPLAY MEMORY RECORDED FROM
2004-01-16 09:50 TO 2004-01-16 10:04
4.4.9 Scrolling through Measurement Results after Completion of a Monitoring
Task
All measurement data collected during a monitoring task, is stored in
Display Memory together with the parameters which describe the
task (a description of the task is given in section 4.4.3).
Using the direction push-buttons, you can scroll through the set-up
parameters as well as the individual gas concentration
measurements results as explained in section 4.3.7. The organisation
of data collected during a monitoring task is illustrated in Fig. 4.9.
This illustration also shows the function of the various direction keys.
For example, X enables you to move from the measurement results
of one gas to the measurement results of another.
_____________________________________________________________________________
BE6011-16
1314 Photoacoustic Multi-gas Monitor
LumaSense Technologies A/S
1412 Photoacoustic Field Gas-Monitor
Page 68 of 280
Chapter 4
______________________________________________________________________
Fig.4.9 Organisation of the data displayed on the Monitors screen
after completion of a monitoring task
_____________________________________________________________________________
BE6011-16
1314 Photoacoustic Multi-gas Monitor
LumaSense Technologies A/S
1412 Photoacoustic Field Gas-Monitor
Page 69 of 280
Chapter 4
______________________________________________________________________
1.
Press T and X.
The following text appears on the display:
WATER VAPOUR MEASURED
The displays which follow, indicate the type of text which appears
each time T is pressed:
WATER:
ALARM 1
MAX 8.55E+00
MIN 7.01E+00
μ 8.15+00
σ 816E-03
This is the statistical report of the monitored gases/vapours
displayed when the monitoring task is complete. In this case where:
MAX
= maximum concentration of water vapour measured
during the whole monitoring task.
MIN
= minimum concentration of water measured during the
whole
monitoring task.
ALARM 1
=
the user-defined concentration of water vapour
which, if measured by the Monitor, will trigger a switch
in the Monitor and activate an external alarm relay
connected to it.
μ
= linear average, or mean value, of all the water vapour
concentrations measured during the whole monitoring
task.
σ
= standard deviation of water-vapour’s concentrations
from the mean value (μ) described above (see section
9.1 for further details).
The humidity unit in this case is Tdew because this is the unit chosen
in the active set-up (see section 4.4.2).
W: WATER VAPOUR:
2004-01-16
09:51:33
1
971.88mBar
7.49Tdew
W: WATER VAPOUR:
2004-01-16
09:51:33
2
971.88mBar
7.49Tdew
As you can see the measurement cycles are numbered sequentially
as soon as the monitoring task has been stopped for example, the
above measurement was made at 09:51:33 on the 16th of January
and it was the second measurement cycle of the monitoring task.
The concentration of water vapour is given in the units of Tdew
because this was the unit chosen for humidity in the active set-up.
_____________________________________________________________________________
BE6011-16
1314 Photoacoustic Multi-gas Monitor
LumaSense Technologies A/S
1412 Photoacoustic Field Gas-Monitor
Page 70 of 280
Chapter 4
______________________________________________________________________
After scrolling through the list of individual measurement results for
water vapour the following screen displays appear:
SAMPLING IS CONTINUOUS
MONITORING PERIOD IS NOT PRE-SET
COMPENSATION FOR WATER VAP.
INTERFERENCE
MONITORING TASK STARTED
2004-01-16 09:50
MEASUREMENT CHAMBER TEMPERATURE 29.6°C
SAMPLE INTEGRATION TIME
A: 5s
B:___s
C:___s
A:Carbon monoxide
D: _________
D:___s
B:__________
E:__________
W: 5s
E:___s
C:___________
W: WATER VAP
DATA IN DISPLAY MEMORY RECORDED FROM
2004-01-16 09:50 TO 2004-01-16 10:04
Note that the screen showing the overview of gas concentrations
measured during any particular measurement cycle is no longer
shown when the monitoring task has been stopped.
2.
Press X.
This causes the following text to appear on the screen:
FILTER A USED TO MEASURE
(the name of the gas being measured by Filter A will appear
here)
3.
Press T to scroll through the following data displays:
GAS A:
ALARM 1________
MAX 84.5E+00 μ 8.03+00
MIN 7.42E+00 σ 2.36E+00
_____________________________________________________________________________
BE6011-16
1314 Photoacoustic Multi-gas Monitor
LumaSense Technologies A/S
1412 Photoacoustic Field Gas-Monitor
Page 71 of 280
Chapter 4
______________________________________________________________________
A:
(the name of the gas being measure by Filter A will appear here)
2004-01-16
A:
972.06 mBar
09:50:32 ________
7.42 mg/m3
(the name of the gas being measure by Filter A will appear here)
2004-01-16
972.06 mBar
09:51:33 _________
7.43 mg/m3
Press X so you can scroll through the list showing water-vapour’s
results.
If you do not wish to view the results anymore, press ↵ , this acts as
a “go to head” function.
4.4.10
Task
Changing Gas-concentration Units after a Monitoring
The unit mg/m3 was chosen for gas concentrations in the monitoring
task, which was set up in section 4.4.4. As long as mg/m3 is the
active concentration unit (that is, the unit selected while operating
in Set-Up mode), this is the unit which will be used to express gas
concentrations on the display screens of the PC and the Monitor. It is
also the unit when print-outs of monitoring task data are made from
the Monitor. However, the user can express the measured gas
concentrations in ppm:
1.
Press SET-UP S3 S2 S3 and then SET-UP.
2.
Use T to scroll through the results of the monitoring task no. 1
displayed on the screen. Notice that the gas concentration units
have been changed to ppm.
In a similar way the humidity unit for water vapour and the pressure
unit can be changed.
4.4.11
Changing the Humidity Unit after a Monitoring Task
1.
Press SET-UP
display:
S3
S2 and then T to reach the following
HUMIDITY UNIT
Tdew
PRESS ENTER TO CHANGE VALUE
_____________________________________________________________________________
BE6011-16
1314 Photoacoustic Multi-gas Monitor
LumaSense Technologies A/S
1412 Photoacoustic Field Gas-Monitor
Page 72 of 280
Chapter 4
______________________________________________________________________
2.
Press ↵ and use the direction keys to display ppm.
3.
Press ↵ to accept the unit of ppm.
4.
Press SET-UP.
Use T to scroll through the results of the monitoring task no. 1
displayed on the screen. Notice that the water vapour unit has been
changed to ppm.
4.4.12
Changing the Pressure Unit after a Monitoring Task
1.
Press
display:
kPa
SET-UP
S3
S2 and then T to reach the following
SELECT PRESSURE UNIT
mBar
mmHg
2.
Press S3 to accept the unit of mmHg.
3.
Press SET-UP.
Use T to scroll through the results of the monitoring task no. 1
displayed on the screen. Notice that the Pressure unit has been
changed to mmHg.
_____________________________________________________________________________
BE6011-16
1314 Photoacoustic Multi-gas Monitor
LumaSense Technologies A/S
1412 Photoacoustic Field Gas-Monitor
Page 73 of 280
Chapter 5
______________________________________________________________________
Chapter 5
The Monitor
July 2009
_____________________________________________________________________________
BE6011-16
1314 Photoacoustic Multi-gas Monitor
LumaSense Technologies A/S
1412 Photoacoustic Field Gas-Monitor
Page 74 of 280
Chapter 5
______________________________________________________________________
5.1 Introduction
This chapter is primarily for those users who want to use the monitor
as a stand-alone instrument. But the start-up and alarm relay
sections are also of interest for the PC user.
5.2 Front Panel
The front panel of the monitor is dominated by a 2 x 40 character
fluorescent display screen, 3 Select push-buttons located beneath it
and 5 direction push-buttons (see Fig. 5.1). The rest of the pushbuttons, situated in a line along the bottom, are function pushbuttons.
Fig.5.1 The front panel of the 1314.
Fig.5.2 The front panel of the 1412.
_____________________________________________________________________________
BE6011-16
1314 Photoacoustic Multi-gas Monitor
LumaSense Technologies A/S
1412 Photoacoustic Field Gas-Monitor
Page 75 of 280
Chapter 5
______________________________________________________________________
Small light-emitting diodes (LEDs) are mounted above some of the
front-panel push-buttons. Their function is to inform you of the
operating state of the monitor. For example, if the LED above the
MEASURE push-button is lit, it indicates that the Monitor is either
busy performing measurements or has been set-up to start
measurements at a pre-defined time.
5.2.1
Direction Push-buttons
This group of 5 push-buttons is referred to in this manual as the
direction push-buttons.
▲ & ▼ have two uses: to increase & decrease numbers, respectively,
or to go to the Previous & Next Displays, respectively.
The number increase and decrease functions are used whenever
values, which can be changed manually, are displayed on screen,
for example, changing a parameter such as the length of sampling
tube.
The “Previous Display” and “Next Display” functions are used when
you want to view the previous or next screen texts. This can be
useful when setting up the monitor. By using these push-buttons,
you can scroll quickly through a branch of the Set-Up Tree. These
push-buttons can also be useful when viewing measurement data,
for example, if you are looking at gas A’s measurement result no.3
– by pressing ▲, gas A’s measurement result no.2 will be shown
on the screen. By pressing ▼, gas A’s measurement result no.4
will appear on the display screen.
◄ & ► enable you to move across number fields or go to the
Previous & Next gases, respectively.
When you are entering values or names in the monitor, for
example when setting up the monitor, you can use these pushbuttons to move the cursor across the entry fields.
“Previous Gas” & “Next Gas” functions, are used primarily when
viewing measurement data. The display screen only displays the
measurement data for one gas at a time (out of 5 gases and water
vapour). These push-buttons allow you to look at the
measurement data for any one of the 4 other gases and water
vapour (see Fig.4.9 and section 4.4.8).
↵ Depending on the situation, this push-button acts as either an
“Enter” or “Go To Top of Measurements” function.
_____________________________________________________________________________
BE6011-16
1314 Photoacoustic Multi-gas Monitor
LumaSense Technologies A/S
1412 Photoacoustic Field Gas-Monitor
Page 76 of 280
Chapter 5
______________________________________________________________________
The “Enter” function is used whenever measurement units are
selected or any text, for example filter names or gas names, are
being entered. The Monitor display will typically display a text
similar to PRESS ENTER TO CHANGE VALUE.
The “Go To Top of Measurements” function is used in the following
situations:
•
•
5.2.2
If you are viewing measurement data, when ↵ is pressed, the
display will move to the screen showing the text DATA IN
DISPLAY MEMORY RECORDED FROM… which gives the period
of time data was recorded – see Fig.4.9 for details.
If the Monitor is performing measurements when ↵ is pressed,
the Monitor will display the last measured concentrations of all
the gases.
The Select Push-buttons
Located below the text display screen, these three push-buttons,
allow you to select from the pre-defined options appearing on the
display screen. The following example illustrates the use of the select
push-buttons:
If the text on the screen appeared as follows:
SELECT CONCENTRATION UNIT
mg/m3
5.2.3
ppm
a.
By pressing S1 the gas concentrations which appear in the
measurement results will be quoted in mg/m3.
b.
By pressing S3 the gas concentrations which appear in the
measurement results will be quoted in ppm.
Function Push-buttons
The order of these push-buttons are the same as they are seen on
the front of the monitor.
RESET
By pressing this push-button you can choose the type of
reset the Monitor should perform. For further details see
section 5.3.
_____________________________________________________________________________
BE6011-16
1314 Photoacoustic Multi-gas Monitor
LumaSense Technologies A/S
1412 Photoacoustic Field Gas-Monitor
Page 77 of 280
Chapter 5
______________________________________________________________________
LOCK
This push button enables setting up three different
password protected User Levels. For further details see
section 2.5.
MEASURE In this mode you are able to choose the type of
measurement the Monitor should perform, and decide
when the measurement should start.
AVERAGE (Only 1412) This push-button allows you to average
measurement data. The lamp in this push-button is lit
when measurement data is being averaged. You define
the averaging times using the set-up mode.
EVENT
(Only 1412) If an unusual or interesting event occurs
during a measurement period, you can mark the time
such an event took place by pressing this push-button.
Each event marker is given a serial number, which can be
used as a reference. Events are marked on print-outs of
measurement data.
MEMORY In this mode you are able to store measurement data in
the Background memory of the monitor, as well as recall
or delete data from the Background memory.
INFO
This push-button has two functions. It allows you to
perform the following two functions:
• Acknowledge any message, which may appear on the
display screen during operation of the Monitor.
• Obtain more detailed information about the condition
of the Monitor at any particular moment of time, if
such information exists.
PRINT
By pressing this push-button, measurement results in the
Display memory of the Monitor can be printed out. The
lamp above this push-button is lit, while measurements
are being printed and the display will show PRINTING
MEASUREMENT DATA until all data has been printed out.
SET-UP
In this mode you are able to enter the Set-Up Tree of the
Monitor. In set-up mode, the user is able to program the
Monitor to perform almost any kind of measurement, and
amongst other things; enter data about the optical
filter(s) which are installed in the Monitor; select different
measurement parameters; choose how measurement results should be formatted in print-outs; choose the
interface and communication codes which are necessary
_____________________________________________________________________________
BE6011-16
1314 Photoacoustic Multi-gas Monitor
LumaSense Technologies A/S
1412 Photoacoustic Field Gas-Monitor
Page 78 of 280
Chapter 5
______________________________________________________________________
to print data; set the internal clock of the Monitor and
choose the self-tests the Monitor should perform.
When the Talk/Listen LED is lit, this means that there is activity on
one of the interfaces.
5.3 Starting-up or Restarting the Monitor
5.3.1
Introduction
When the monitor is started up in the normal way, that is, by
switching on the AC Mains power-switch on the back panel, the
monitor responds by performing a partial reset. A partial reset is
also performed if during operation the monitor is switched off and is
re-started in any of the following ways:
•
•
If the Monitor stops operating due to an AC mains power failure
and then re-starts itself (automatically) when power is restored to
it;
If the user stops operating the Monitor by switching it off using
the AC mains power switch on the back panel, and then re-starts
it by using the same switch:
Users can also “partially reset” the Monitor by using the RESET
push-button on the front panel (see section 5.2.3).
5.3.2
A Partial Reset of the Monitor
When the Monitor performs a partial reset a number of self-tests
are automatically performed. The types of tests performed depend
only upon the time, which has elapsed since the Monitor was last
switched on.
•
•
If more than 10 mins. have elapsed since the Monitor was
switched on it will perform the software, data-integrity, and
hardware tests when switched on again.
If less than 10 mins. have elapsed since the Monitor was switched
on it will perform only the data-integrity tests when switched on
again.
There are essentially 3 types of self-tests which can be performed
during a “partial reset” – a software test, a data-integrity test and
a hardware test.
It takes the Monitor only a few seconds to perform the dataintegrity tests; and about 3 minutes to perform both the software
and hardware test. The different tests are explained below.
_____________________________________________________________________________
BE6011-16
1314 Photoacoustic Multi-gas Monitor
LumaSense Technologies A/S
1412 Photoacoustic Field Gas-Monitor
Page 79 of 280
Chapter 5
______________________________________________________________________
Software test
This test checks the information in the Monitor’s software (ROM –
Read Only Memory.)
Data-integrity test
This test checks the integrity of the data stored in the Monitor’s
Source Memory (i.e. its EEPROM – Electrically Erasable
Programmable Read Only Memory) and the integrity of the data
stored in the Monitor’s Working Memory (RAM).
Hardware test
This test checks that the electrical, mechanical and electronic
parts of the Monitor are functioning properly.
The following parts of the Monitor are checked: the pump; the
valves in the pneumatic system; the infra-red light source; the
power supply; the filter carousel; the motor which drives the
chopper wheel; the external vibration level (to make sure that it
does not contribute to the signal measured in the analysis cell);
the analogue circuitry and the microphones (to check that they
are functioning properly).
If you do not wish the Monitor to perform the hardware test
during a partial reset, you can disable it (see section 5.4.3). This
also disables the regular self-tests.
If any part of the Monitor is found to be functioning incorrectly a
message will appear in the display to inform the user of the problem.
For example:
OPERATING ERROR:
PUMP TEST FAILED
The user must acknowledge receipt of such a message by pressing
INFO. Operating errors and warning messages are listed in tableform in Chapter 17 at the end of this manual.
If a fault is found in any of the blocks of data stored in the Working
Memory, the Monitor will automatically set the parameters in the
relevant compartment(s) to their default values, and the Monitor will
send the following message on its display screen:
WARNING: MEMORY SET TO DEFAULT
ERROR DETECTED IN XXXXX MEMORY
_____________________________________________________________________________
BE6011-16
1314 Photoacoustic Multi-gas Monitor
LumaSense Technologies A/S
1412 Photoacoustic Field Gas-Monitor
Page 80 of 280
Chapter 5
______________________________________________________________________
Where XXXXX denotes the part of the memory that has been
affected. When such a message is received users must check the
contents of the relevant memory to find out which data has been
affected before continuing to operate the Monitor.
5.3.3
Response of the Monitor after a Partial Reset
The way in which the Monitor responds after a partial reset is
dependent upon the way it was being operated at the time of the
partial reset (see Table 5.1). For example, if the Monitor was busy
taking a measurement when it was “partially reset” it will complete
the interrupted measurement after the partial reset, continue its
monitoring task and make a special “mark” alongside the first
complete measurement cycle it performs after the reset. These
“marks” are described in section 9.2.2 and section 9.2.3.
Table 5.1 Dependence of Monitor’s response, after a partial reset, to
its operating condition at the time of the partial reset.
Monitor last used Task being performed
while in…
Measurement
mode
“Display”
Set-up mode
Memory mode
“Interface”
Task started after a
PARTIAL RESET
A gas measurement
Completes the monitoring task
Looking at measurement
results on the display screen
Measurement results are
shown on the display from the
beginning again
Measurement results are
shown in the display from the
beginning
Completes any interrupted task
and then measurement results
are shown in the display from
the beginning
Print-out is stopped and
measurement results are
shown in the display from the
beginning
Changing set-up parameters
which control the operation
of the Monitor
Handling measurement
results which are stored in
Display Memory and
Background Memory
Obtaining hard-copies (that
is, print-outs of, for
example, measurement
data)
_____________________________________________________________________________
BE6011-16
1314 Photoacoustic Multi-gas Monitor
LumaSense Technologies A/S
1412 Photoacoustic Field Gas-Monitor
Page 81 of 280
Chapter 5
______________________________________________________________________
5.3.4
Full reset and/or Partial Reset of the Monitor via its
Front Panel
There are two well-defined levels of reset. By pressing RESET the
following text appears on the display screen:
SELECT RESET TYPE
PARTIEL
FULL
NONE
If S3 is pressed, you can come out of reset mode without performing
any kind of reset. The Monitor just goes back to operating the same
way it was operating before the RESET push-button was pressed.
S1
PARTIAL Reset: If this level of reset is chosen the Monitor
stops operating,
performs a partial reset as described in the
previous section (section 5.3.2) and then resumes operating in
the fashion described in Table 5.1.
S2 FULL Reset: If this level of reset is chosen the Monitor responds
by changing the text on the display so that you have a chance to
confirm that you wish the Monitor to perform a FULL reset:
PERFORM FULL RESET ?
NO
YES
S1 By pressing this push-button the user can come out of reset
mode without performing any kind of reset. The Monitor just
goes back to operating the same way it was operating before
RESET was pressed.
S3 By pressing this push-button the user confirms that a FULL
reset is required. During a FULL reset the Monitor performs the
following two tasks:
• “Clearing” (emptying) all data from its Working Memory.
This means all data in Display Memory and Background
Memory will be lost.
_____________________________________________________________________________
BE6011-16
1314 Photoacoustic Multi-gas Monitor
LumaSense Technologies A/S
1412 Photoacoustic Field Gas-Monitor
Page 82 of 280
Chapter 5
______________________________________________________________________
• Copying data from its Source Memory into its Working
Memory. This means that set-up parameters in block 3 of
Working Memory “Other Set-up Parameters” will be given
their default values, and the values of the optical filter setup parameters in Working Memory will be the same as
those found in Source Memory.
5.4 Configuring the Monitor
5.4.1
Setting the Clock
Before dispatch from the factory, the internal clock of the Monitor is
set to the correct local (Danish) time.
The current date is entered as Year-Month-Day for example
the 24th of July 2004 is entered as 2004-07-24.
The current time is entered as the time on the 24-hour clock
for example 14:05 is five minutes after two in the afternoon.
Table 5.2 details the range of acceptable values and the
default value of the date and time.
Table 5.2
The range of acceptable values and the default value of
the date and time
Display Text
Acceptable Values
ENTER CURRENT DATE 0000-0101
ENTER CURRENT TIME 12:47
0000-01-01 to 999912-31
00:00 to 23:59
Default
Value
1988-01-01
12:00
If the Monitor is to be used as a stand-alone instrument, then the
clock can be adjusted to your local time using the following
instructions.
1.
Press SET-UP.
Refer to the Set-Up Tree diagram, so that you can follow your
progress through the various branches of this set-up.
2.
Press S3 S1 S1 S1.
The following screen picture appears:
CURRENT DATE
2004 – 06 – 13
PRESS ENTER TO CHANGE VALUE
_____________________________________________________________________________
BE6011-16
1314 Photoacoustic Multi-gas Monitor
LumaSense Technologies A/S
1412 Photoacoustic Field Gas-Monitor
Page 83 of 280
Chapter 5
______________________________________________________________________
3.
To change the date, press ↵ .
4.
Use the direction push-buttons to enter the correct date. If you
make a mistake, press S1 to revert back to the original date.
5.
Press ↵ to accept the date.
This causes the text on the display screen to change to the
following:
CURRENT TIME
12:00
PRESS ENTER TO CHANGE VALUE
6.
To change the time, press ↵ .
7.
Use the direction push-buttons to enter the correct time. If you
make a mistake in entering the correct date just press S1 and
start again.
8.
Press ↵ to accept the time.
When Step 8. has been completed the display then moves to the
previous head of the set-up “tree”.
9.
Press S three times. The screen display shows the following
text:
MEASUREMENT
10.
5.4.2
SELECT SET UP BRANCH
FORMAT
CONFIGURATION
Press SET-UP to exit the set-up function.
Adjusting the Sound Level
During certain operations or, for example, when an incorrect pushbutton is pressed, the Monitor emits a “beep”. You choose the
volume of the Monitor’s “beep”. The volume of the “beep” is
expressed on a scale from 0 (no “beep”) to 3 (loudest “beep”). Table
_____________________________________________________________________________
BE6011-16
1314 Photoacoustic Multi-gas Monitor
LumaSense Technologies A/S
1412 Photoacoustic Field Gas-Monitor
Page 84 of 280
Chapter 5
______________________________________________________________________
5.3 provides details of the available choices and the default value of
this parameter.
Table 5.3
The available choices and the default value of the
Monitor’s “beep”
Display Text
ENTER SOUND VOLUME 0
Available Choices
0, 1, 2, 3
Default Value
1
To set the volume:
1.
Press SET-UP.
2.
Press S3 S1 S1 S2 .
The following screen picture appears:
SOUND VOLUME 1
PRESS ENTER TO CHANGE VALUE
5.4.3
3.
To change the volume, press ↵ .
4.
Use the direction push-buttons to enter the correct volume. If
you make a mistake, press S1 to revert back to the original
volume.
5.
Press ↵ to accept volume.
6.
Press SET-UP to exit the set-up function.
Enabling/Disabling Self Tests
If you do not wish the Monitor to perform regular self tests, including
the hardware test on power-up you can disable it.
1.
Press SET-UP S3 S1 S1 S3
NO
REGULAR SELF - TESTS ?
YES
_____________________________________________________________________________
BE6011-16
1314 Photoacoustic Multi-gas Monitor
LumaSense Technologies A/S
1412 Photoacoustic Field Gas-Monitor
Page 85 of 280
Chapter 5
______________________________________________________________________
2.
Press S1, the Monitor no longer performs the hardware test
as part of its self-testing procedure during any kind of reset.
3.
Press SET-UP to exit the set-up function.
5.5 Alarm Relay
Two alarm relays are built into the alarm relay socket on the
back panel of the Monitor. The function of the pins in this female
connector are shown in Fig.5.2. The two alarm relays can be
connected to a variety of either audio (for example, a siren)
and/or visual (for example a flashing light) alarm systems and
they are activated whenever a pre-defined concentration (alarm
level) of one (or more) of the gases being measured is exceeded.
Alarm signals are given by opening and closing the relay contacts.
Both relays are closed when the Monitor is switched off and when
the Monitor is switched on. This means that there is a direct
electrical connection between pins 1 & 2 and pins 4 & 5 at all
times except when the Monitor measures a gas concentration
which is greater than the corresponding alarm limit for the gas.
When this concentration is measured, the Monitor breaks the
connection between pins 1 & 2 or 4 & 5. The monitor will
furthermore activate the internal beeper and write the following
message on the display:
WARNING:
ALARM LIMIT EXCEEDED
The user can switch off the beeper and the message by pressing
INFO or RESET push-button on the frontpanel of the Monitor.
The alarm relays will continue being activated until either (1) all
measured gas concentrations fall below their user-defined alarm
level(s); or (2) the monitoring task is stopped – this automatically
closes the alarm relays.
Alarm Relay 1:
Alarm Relay 1: correspond to High Alarm Limit 1.
Whenever one or more gases exceed their alarm level(s) for high
alarm limit 1, the Monitor breaks the electrical connection
between pins 1 & 2 and this activates the attached alarm system.
_____________________________________________________________________________
BE6011-16
1314 Photoacoustic Multi-gas Monitor
LumaSense Technologies A/S
1412 Photoacoustic Field Gas-Monitor
Page 86 of 280
Chapter 5
______________________________________________________________________
Alarm Relay 2:
Alarm Relay 2: correspond to High Alarm Limit 2.
Whenever one or more gases exceed their alarm level(s) for high
alarm limit 2, the Monitor breaks the electrical connection
between pins 4 & 5 and this activates the attached alarm system.
INNOVA supplies a 6-pin DIN plug (male) with a locking collar
JP0600 for connecting external alarm devices to the alarm relay.
Caution:
The DC voltage across the relay contacts must not exceed 25V. The
potential on the relay contacts must not be more than 25VDC above
chassis potential, as this will cause an excessive leakage current. The
current through the contacts must not exceed 100mA. AC voltages
must not be connected to the Alarm Relay socket.
Fig.5.2
Alarm Relay 2
Configuration of the pins in the alarm relay socket
Alarm relay 1
_____________________________________________________________________________
BE6011-16
1314 Photoacoustic Multi-gas Monitor
LumaSense Technologies A/S
1412 Photoacoustic Field Gas-Monitor
Page 87 of 280
Chapter 6
______________________________________________________________________
Chapter 6
Keying-in Parameters
July 2009
_____________________________________________________________________________
BE6011-16
1314 Photoacoustic Multi-gas Monitor
LumaSense Technologies A/S
1412 Photoacoustic Field Gas-Monitor
Page 88 of 280
Chapter 6
______________________________________________________________________
6.1 Types of Parameters
There are four types of parameters:
Numerical: you are free to enter the desired values. However, there
may in many instances be a range in which your values must lie.
These ranges can be found in the relevant sections of this manual.
Text: you are able to type user-defined text, for example, the names
of the gases you are measuring and when using the PC the names of
your databases.
The characters available to you when using the monitor on its own
are shown in the table below:
Fig.6.1 The characters which are available for gas names
Characters available for Gas Names
▲→
AaBbCcDdEeFfGgHhIiJjKkLlMmNnOoPpQqRrSs
TtUuVvXxYyZz_’ ”. , : ; &!?@ | ^ # $ \ % / + - ( ) { } [
]<>Ø
1 2 3 4 5 6 7 8 9 AaBbCc etc
←▼
Pre-defined: you are able to select a parameter using the “select”
push-buttons when there are three or less options, or by scrolling
through a pre-defined list using the direction push-keys. The
parameters in the lists are given in more detail in the relevant sections of this manual.
Current Time: in the monitor is synchronized to match the time and
date of the internal clock in the PC when the two are connected
together. However, it is possible to adjust the monitors date and
time using the front panel push-buttons. This is described in full in
section 5.4.1.
6.2 Choosing Parameters
PC Use
Parameters can be set in three ways: Using the numbers illustrated
in Fig.6.1.
_____________________________________________________________________________
BE6011-16
1314 Photoacoustic Multi-gas Monitor
LumaSense Technologies A/S
1412 Photoacoustic Field Gas-Monitor
Page 89 of 280
Chapter 6
______________________________________________________________________
n Parameters in a Select Field. By clicking in the field, a list of predefined options appear. By scrolling through this list, the desired
parameter can be selected.
Fig.6.2 Illustration of the different parameters
o Parameters selected using radio push-buttons. These are often
parameters that are similar to each other. But only one of these
parameters can be selected at any one time.
p Check Boxes. These are commonly used for functions where more
than one can be selected, simultaneously. When the tick is
displayed, the function is selected.
q Definable values. Some parameters require a value defined. This
value must lie within the permitted range. If you enter a value
outside the range, a warning appears on screen telling you to
enter a value, which is within the range.
Stand-alone Use
Whenever you are choosing parameters and/or “entering” parameter
values via the front-panel push-keys, two options are available:
SELECT HUMIDITY UNIT
CANCEL
Tdew
DEFAULT
_____________________________________________________________________________
BE6011-16
1314 Photoacoustic Multi-gas Monitor
LumaSense Technologies A/S
1412 Photoacoustic Field Gas-Monitor
Page 90 of 280
Chapter 6
______________________________________________________________________
CANCEL
This option appears over the S1 select push-button. If
you change the value of a parameter on the display
screen and then decide that the new value is not correct,
the original parameter can be brought back to the screen
by pressing S1.
Default
This option appears over the S3 select push-button. If
you wish the parameter appearing on the display screen
to be the same as the factory-defined value you can
press S3.
Some parameters do not have pre-defined default values, so that
when Default is used a blank line will appear instead of a number.
The default value of such a parameter is said to be “blank”. For
example:
GAS A’S HIGH ALARM LIMIT 1________ppm
CANCEL
DEFAULT
If the value of a chosen parameter lies outside the pre-defined
minimum and maximum values the value will be corrected and, at
the same time, a “beep” will sound. You will then have to “enter” the
correct value by pressing ↵ and repeating the process.
When you have to choose or change a parameter, and the text
PRESS ENTER TO CHANGE VALUE is displayed, use the direction
push-buttons and follow the procedure below. Details about the
direction keys are provided in section 5.2.
1.
Press ↵ . A cursor will blink under one of the parameter’s
numbers or letters and the bottom line will display the softkeys Cancel and Default.
2.
Use S and T to change the entry above the cursor to the
desired number, letter. For pre-defined parameters, these
push-buttons enable you to scroll through the list. Display the
desired parameter, then go to step 5.
3.
Use W and X to move the cursor across the entry fields and
repeat step 2.
4.
Repeat steps 2 and 3 until the entry fields show the desired
value or text.
5.
Press ↵ .
_____________________________________________________________________________
BE6011-16
1314 Photoacoustic Multi-gas Monitor
LumaSense Technologies A/S
1412 Photoacoustic Field Gas-Monitor
Page 91 of 280
Chapter 6
______________________________________________________________________
If the parameter you desire is already selected (i.e. a cursor is
displayed under it), then using T enables you to move directly to the
next display.
These procedures are common for all the parameters in the Monitor.
_____________________________________________________________________________
BE6011-16
1314 Photoacoustic Multi-gas Monitor
LumaSense Technologies A/S
1412 Photoacoustic Field Gas-Monitor
Page 92 of 280
Chapter 7
______________________________________________________________________
Chapter 7
Setting-up and Starting
a Monitoring Task
July 2009
_____________________________________________________________________________
BE6011-16
1314 Photoacoustic Multi-gas Monitor
LumaSense Technologies A/S
1412 Photoacoustic Field Gas-Monitor
Page 93 of 280
Chapter 7
______________________________________________________________________
Before a measurement task can commence, there are a variety of
parameters that must be defined first. This is called “Setting up the
Monitor”.
This chapter instructs you on how to set up the monitoring system
before starting to measure. As mentioned previously in this manual,
the parameters can be defined using the PC Use instructions, i.e.
when using a PC, or the stand-alone Use instructions, i.e. when using
the front panel push-keys on the monitor.
Before leaving the factory, each of the parameters found in the setup “tree” (see the Quick Set-up Guide) are given factory values
(default values).
When setting-up the Monitor as a stand-alone instrument, those
values with a cursor underneath them are the active values. It is
the active values, which determine how the Monitor will operate.
Warning! Failure to define any parameter may result in the default
parameters being used. This can result in the monitor measuring
incorrectly or being unable to start the measurement task.
7.1 The Parameters’ Units
The Monitor works internally with measurement parameters in SI
units. These units can be converted and displayed as a variety of
other measurement units. Defining the units here has two uses. It
enables you to set-up the measurement parameters using familiar
units and displays the measurement results with the desired
concentration units.
These parameters are listed below.
Table 7.1 The possible parameter units and the default settings
Parameters
Units
Default Unit
Humidity
mg/m , ppm, Tdew, kPa
mg/m3
Pressure
mbar, mmHg, kPa
kPa
Temperature
°C, °F, K
°C
Gas
Concentrations
Length
3
mg/m , ppm
mg/m3
m, ft
m
3
The units for existing measurement results can also be changed
using these instructions.
_____________________________________________________________________________
BE6011-16
1314 Photoacoustic Multi-gas Monitor
LumaSense Technologies A/S
1412 Photoacoustic Field Gas-Monitor
Page 94 of 280
Chapter 7
______________________________________________________________________
Normalization Temperature
If you have chosen to measure gas concentrations in the unit
mg/m3, you must “enter” the temperature at which the Monitor
should calculate gas concentrations. If, for example, you “enter” a
normalization
temperature
of
25°C,
the
measured
gas
concentrations, which appear on the display during a monitoring task
will be calculated in mg/m3 units at 25°C. The acceptable values and
the default values of the normalization temperature are given in
Table 7.2 in the different temperature units.
Table 7.2 The acceptable values and the default values of the
normalization temperature
Display Text
Acceptable Values
NORMALIZATION TEMPERATURE
0°C, 20°C and 25°C
NORMALIZATION
TEMPERATURE
NORMALIZATION
TEMPERATURE
32°F, 68°F and
77°F
273K, 293K and
298K
Default
Value
20°C
68°F
293K
If you set up the monitor using the front panel push-buttons, the
instructions to set the normalization temperature are included in the
section 7.2.1.
7.1.1 Online Unit Set-up
With the Online program running, follow the instructions below.
1.
Pull down the Task menu. Click on Units and the unit dialogue
appears, see. Fig. 7.1.
_____________________________________________________________________________
BE6011-16
1314 Photoacoustic Multi-gas Monitor
LumaSense Technologies A/S
1412 Photoacoustic Field Gas-Monitor
Page 95 of 280
Chapter 7
______________________________________________________________________
Fig.7.1 The Units dialogue
2.
Click on the radio push-buttons to select the desired units.
3.
If you have selected the mg/m3 unit for the gas concentration,
click in the Normalization Temperature field.
4.
Note these temperature values change depending on the
temperature units selected, i.e. °C, °F and K.
5.
Select the desired value and click on OK.
All the parameters’ units are now set.
7.1.2 Offline Unit Set-up
With the Offline program running:
1.
Click on the Units softkey at the bottom of the dialogue box.
The Units dialogue appears, see Fig. 7.1.
2.
Click on the radio push-buttons to select the desired units.
3.
If you have selected the mg/m3 unit for the gas concentration,
click in the Normalization Temperature field.
Note these temperature values change
temperature units selected, i.e. °C, °F and K.
depending
on
the
_____________________________________________________________________________
BE6011-16
1314 Photoacoustic Multi-gas Monitor
LumaSense Technologies A/S
1412 Photoacoustic Field Gas-Monitor
Page 96 of 280
Chapter 7
______________________________________________________________________
4.
Select the desired value and click on OK.
All the parameters’ units are now set.
7.1.3 Stand-alone Unit Set-up
For those of you setting up the monitor using these instructions, it
may be useful for you to follow the steps taken using the Set-Up
Tree.
The philosophy of the instructions is described in section 3.3.
To enter at the top of the Set-Up Tree, press SET-UP and the
monitor displays the following screen text.
MEASUREMENT
SELECT SET-UP BRANCH
FORMAT
CONFIGURATION
1. Press S3 to enter the CONFIGURATION branch. The new text
displays three branches.
SELECT CONFIGURATION SET-UP BRANCH
SYSTEM
UNIT
FILTERS
Units branch
2.
Press S2 to enter the Units branch.
3.
Use the select push-buttons to define the concentration unit.
4.
Use the select push-buttons to define the length unit.
5.
Use the select push-buttons to define the temperature unit.
6.
Use the select push-buttons to define the pressure unit.
7.
The humidity unit is displayed. Use the direction push-buttons
to change it to the correct value.
_____________________________________________________________________________
BE6011-16
1314 Photoacoustic Multi-gas Monitor
LumaSense Technologies A/S
1412 Photoacoustic Field Gas-Monitor
Page 97 of 280
Chapter 7
______________________________________________________________________
When step 7 is completed the display returns to the top of the Units
branch.
Press S to go to the top of the Set-Up Tree, or press SET-UP to exit
the set-up mode.
7.2 The Measurement Parameters
The list of parameters to be defined is long. To help show where
these parameters appear in the Gas Monitoring software 7304, the
parameters are grouped under their index card name.
The information about the parameters and the ranges shown is also
valid for those of you setting up the Monitor using the front panel
push-buttons.
Sampling index card
Sampling mode: the manner in which the gases are sampled. There
are two possibilities here:
Continuous sampling: once the monitor is finished measuring it
starts again making the next measurement,
for a full explanation see section 4.1.2.
Interval Sampling:
this is the time from the start of one
measurement cycle to the start of the next
one, for a full explanation see section 4.1.2.
Table 7.3 The range of acceptable values and the default value for the
Fixed interval sampling
Acceptable Values
hours:minutes
00:01 to 01:00
Interval
hours:minutes
00:01
Defalut Value
hours:minutes
00:02
Flushing: the length of time the monitor flushes the measurement
chamber and the sample tubing between measurements. There are
two options here:
Auto:
the monitoring system controls the flushing
by selecting the optimum flushing time. This
time can vary as this option takes into
account the cleanliness of the external airfilters and the length of the sampling tube.
Therefore, the sample tube length must be defined.
_____________________________________________________________________________
BE6011-16
1314 Photoacoustic Multi-gas Monitor
LumaSense Technologies A/S
1412 Photoacoustic Field Gas-Monitor
Page 98 of 280
Chapter 7
______________________________________________________________________
Table 7.4 The acceptable values and the default values of the length of the
sampling tube
Monitor Display Text
Acceptable Values
LENGTH OF SAMPLING
TUBE
LENGTH OF SAMPLING
TUBE
0 – 99 metres
Default
Value
0.00
0 – 324.90 feet
0.00
Fixed Time:
there are two selections here: Chamber, which is
always selected with this option and Tube. See
Table 7.5 for the acceptable values.
Table 7.5 The range of acceptable values and the default values for the
chamber and sample tube flushing times
Acceptable Values
Interval
Chamber: 2 to 60 s
Tube: 0 (=off), 3 to 120 s
1s
1s
Default
Value
8s
3s
Water Interference: the Monitor is capable of measuring water’s
contribution to the signal measured in its analysis cell. The user can
decide whether or not the signal should be compensated for water’s
contribution. It is suggested that water should be compensated for in
all measuring situations except where extremely dry gases are being
measure.
Cross Interference: if any “interferent” other than water vapour is
present in the ambient air-sample, the Monitor can cross compensate
for the interference caused by its presence provided that a selective
optical filter is installed in the monitor to measure the concentration
of interferent gas present.
Gas Monitor Display (PC use) / Averaging Period (1412 standalone use): this enables you to decide if instantaneous values or
averaged values are displayed on the gas monitors screen.
If average values are desired, then the example below illustrates
how the values are calculated and displayed.
Let us suppose that the Monitor has been taking measurements
every 2.5 mins., over a period of 30 mins., of gas A (acetone),
and the following results (unshaded area) were obtained and
recorded in the display memory, for stand-alone users.
_____________________________________________________________________________
BE6011-16
1314 Photoacoustic Multi-gas Monitor
LumaSense Technologies A/S
1412 Photoacoustic Field Gas-Monitor
Page 99 of 280
Chapter 7
______________________________________________________________________
A:
ACETONE
Averaged
Values
0
0
0
0
0
0
0
0
0
0
0
0
11:42:
30
11:45:
00
11:47:
30
11:50:
00
11:52:
30
11:55:
00
11:57:
30
12:00:
00
12:02:
30
12:05:
00
12:07:
30
12:10:
00
1
66.72
mg/m
66.72
mg/m3
2
154.90
mg/m
110.9
mg/m3
3
271.30
mg/m
164.3
mg/m3
4
415.90
mg/m
227.2
mg/m3
5
588.70
mg/m
299.5
mg/m3
6
789.70
mg/m
444.1
mg/m3
7
1.019
g/m3
616.9
mg/m3
8
1.276
g/m3
817.9
mg/m3
9
1.562
g/m3
1.047
g/m3
10
1.876
g/m3
1.304
g/m3
11
2.218
g/m3
1.159
g/m3
12
2.589
g/m3
1.904
g/m3
3
3
3
3
3
3
Let us suppose that the averaging period was set to 10 mins.
When the above measurement results are displayed on the screen
and the averaging function is activated then each measurement
will be averaged over the previous 10 mins. and the averaged
measurement results will replace the individual measurement
results (averaged results are shown in the shaded area in the list
above). For example: measurement number 7 would be 616.9
mg/m3. This is the average of the 5 measurements taken in the
10 min. period ending at 11:57:30. Measurement number 12
would be 1.904 g/m3 which is the average of the 5 measurements
taken in the 10 min. period ending at 12:12:00.
The range of acceptable values and the default value of the
averaging period are shown in Table 7.6.
_____________________________________________________________________________
BE6011-16
1314 Photoacoustic Multi-gas Monitor
LumaSense Technologies A/S
1412 Photoacoustic Field Gas-Monitor
Page 100 of 280
Chapter 7
______________________________________________________________________
Table 7.6 The range of acceptable values and the default value of the
averaging period
Display Text
ENTER AVERAGING PERIOD
00:10
Acceptable
Values
hours:minutes
00:10 to 12:00
Default
Value
hours:minut
es
00:10
Stand-alone Use
When the averaging function is active it will not only affect the
results displayed on the screen but also the measurement results
which are being printed out from the Display Memory (see Chapter
12). However, when the averaging function is deactivated – by
pressing AVERAGE again (the LED will switch off) – the original
results (unshaded) will replace the averaged results on the screen.
Gas index card
Gas Setup: there are up to six selections here: A, B, C, D, E and W.
These represent the filters installed in the monitor’s filter carousel.
When setting up a new monitoring task, you can choose freely
between the gases available for each filter (names entered when
calibrating the filters, see sections 14.3 and 14.5). Once a gas has
been selected for a filter and the measurement task started, you can
no longer change the gas for this filter in this measurement task.
However, you can still select gases for filters, which have not
previously been used in the measurement task.
Note: only one gas per filter can be selected at a time for
measuring. The W position always represents the water filter
installed in the monitor.
Sample Integration Time: this enables you to make a choice
between speed and accuracy. Generally, the longer the integration
time the more accurate the results. There are several selection
possibilities here:
Integration Type
Fast
Normal
Low Noise
Advanced
Integration Time
1s
5s
20 s
0.5s, 1s, 2s, 5s, 10s, 20s, 50s
Alarm index card
Select Gas: this option enables you to select any of the gases (one
per filter position) already defined in the set-up.
_____________________________________________________________________________
BE6011-16
1314 Photoacoustic Multi-gas Monitor
LumaSense Technologies A/S
1412 Photoacoustic Field Gas-Monitor
Page 101 of 280
Chapter 7
______________________________________________________________________
Limit: enables you to define the gas concentration that will trigger
the alarms. The acceptable values are shown in Table 7.7.
Select limits: this defines the concentration level when the alarm
is triggered. This parameter must be defined.
Table 7.7 The range of acceptable values and default value of the alarm
limit for the gases
Display Text
Acceptable Values
GAS A HIGH ALARM LIMIT
1
n _____PPM
GAS A HIGH ALARM LIMIT
1
n _____mg/m3
0-1000000ppm
Depends on the
molecular weight of
the gas
Default
Value
Blank
Blank
n = A to W
Instantaneous/Rolling Average: (PC use – Online only) these are
toggle functions, only one of these can be selected. The Rolling
Average option enables you to prevent the alarm being triggered
by sudden, small fluctuation in the gas concentrations by using
values, which are averaged over a defined period of time. The
averaging time is defined in minutes. The acceptable values are: 1
to 999 mins, and the default value is 10 mins.
Action: this provides you with 4 ways to trigger the alarm. One or
more of the options can be selected simultaneously.
PC Beep: (PC use – Online only) when an alarm is triggered the
PC makes a beeping noise.
Monitor Beep: when an alarm is triggered the monitor makes a
beeping noise.
Monitor Relay 1 & Monitor Relay 2: selecting these options
enable you to connect the alarms to a variety of either audio (for
example, a siren) and/or visual (for example a flashing light)
alarm systems.
Active Alarms: only the gases, which you have selected and
activated, are shown in this field.
7.2.1
Measurement Set-up – PC Use
If you are using the Online program, follow the instructions below. If
you are using the Offline program go directly to step 5.
1.
Pull down the Task menu. Click on New if you want to create a
new database or click on Open to use an existing database.
_____________________________________________________________________________
BE6011-16
1314 Photoacoustic Multi-gas Monitor
LumaSense Technologies A/S
1412 Photoacoustic Field Gas-Monitor
Page 102 of 280
Chapter 7
______________________________________________________________________
2.
In the database window:
For new databases: click in Enter name for field and type in the
desired name.
For existing databases, click on the desired database name.
3.
Click OK.
A graphic window and an extended menu bar appear.
4.
Pull down the Sequence menu. Click on Settings and the
Setup window appears.
In the new window there are several labelled “index
separators. Each index card contains several parameters.
card”
Sampling index card
5.
Click on the radio-button for the desired sampling mode. If
Sample Interval is selected, set the time to the correct value.
6.
Click on the radio-button for the desired flushing mode.
a.
If Auto is selected, set the correct tube length
b.
If Fixed Time is selected, set the desired chamber
flushing time and the tube flushing time.
7.
If water vapour and cross interference are required, click in the
appropriate check boxes.
8.
If average values are to be displayed on the gas monitors
screen, click in the Average check box, and set the interval to
correct value.
Gas index card
9.
Click on the “Gas” index card.
10.
Click in the check box to the left of the desired filter.
11.
Click in the field to the right of the selected filter and select the
correct gas.
12.
Repeat steps 10. & 11. until all the filters which are required
for the measurements are selected and the correct names are
displayed.
13.
Click in the Sample Integration Time field and select the
desired option.
_____________________________________________________________________________
BE6011-16
1314 Photoacoustic Multi-gas Monitor
LumaSense Technologies A/S
1412 Photoacoustic Field Gas-Monitor
Page 103 of 280
Chapter 7
______________________________________________________________________
14.
(Advanced settings only). Note that a new field has appeared
to the right of the gas names. Click in the field and define the
times for the selected filters.
Alarms index card
15.
Click on the “Alarms” index card
16.
Click in the Select gas field to display the list of gas names.
17.
Click on the desired gas name.
18.
Click in the Select Limit field, and type in the desired
concentration.
19.
Online Only – Click on the High Alarm Limit 1 or 2 radio pushbutton.
20.
Online Only – Click on the Instantaneous or Rolling Average
radio push-button. If you select Rolling Average, click in the
field to the right and define the averaging interval for the
alarm.
21.
Online Only – Click in the desired Action check boxes.
22.
Click on Add New or Insert Before if you want to insert the
new entry at the top of the list.
23.
Repeat steps 16. to 22. until all the required alarms are set.
Note: if you wish to remove an alarm, select the gas in the Alarms:
field and click on Remove.
If you are using the Offline program, go to step 24.
If you are using the Online program, and you have completed all the
steps, click on OK, the system is now ready to start measuring, see
section 7.4.1.
Up/Download index card – Offline Only
24.
Click on the Up/Download index card
25.
Click on the Download Settings softkey. This will download
the settings in the Sequence Settings dialogue to the monitor.
26.
When the transfer is complete, Click on the Close softkey to
exit the Offline program.
_____________________________________________________________________________
BE6011-16
1314 Photoacoustic Multi-gas Monitor
LumaSense Technologies A/S
1412 Photoacoustic Field Gas-Monitor
Page 104 of 280
Chapter 7
______________________________________________________________________
You are now ready to start measuring, see section 7.4.2.
7.2.2
Measurement Set-up – Stand-alone Use
The philosophy of the instructions is described in Chapter 3.
To enter the Set-Up Tree, press SET-UP and the monitor displays
the following screen text.
SELECT SET_UP BRANCH
MEASUREMENT
1.
FORMAT
CONFIGURATION
Press S1 to enter the MEASUREMENT branch. The new text
displays two branches.
Monitoring Task branch
2.
Press S1 to enter the Monitoring Task branch.
The following text is displayed:
MONITORING TASK SET-UP NUMBER
PRESS ENTER TO CHANGE VALUE
1
3.
Up to 10 different monitoring tasks can be defined here. These
are labelled from 1 to 10. Use the direction push-buttons to
select the desired set-up number and move on to the next
display.
4.
Use the select push-buttons to define if you want to sample
continuously:
If you select No (S1), go to step 5.
If you select Yes (S3), go to step 6.
5.
The sampling interval is displayed. Use the direction pushbuttons to change it to the correct value.
6.
Use the select push-buttons to define if you want to monitor for
a pre-set period:
If you select Yes, go to step 7.
_____________________________________________________________________________
BE6011-16
1314 Photoacoustic Multi-gas Monitor
LumaSense Technologies A/S
1412 Photoacoustic Field Gas-Monitor
Page 105 of 280
Chapter 7
______________________________________________________________________
If you select No, go to step 8.
7.
The monitoring period is displayed. Use the direction pushbuttons to change it to the correct value.
The MONITORING PERIOD is entered as Days Hours:Minutes.
For example, if this particular measurement cycle needs to be
performed during 5 days, 14 hours and 30 minutes, the
“monitoring period” should be “entered” as 5 14:30. The Monitor
will then automatically stop monitoring 5 days, 14 hours and 30
minutes after the measurement cycle with this particular set-up
number is started. The range of acceptable values and the default
value of the monitoring period is shown in Table 7.8.
Table 7.8 The range of acceptable values and the default value of the
monitoring period
Display Text
ENTER MONITORING
PERIOD
Acceptable Values
days
hours:minutes
0 00:01 to 7 00:00
Default Value
days
hours:minutes
0 01:00
The Monitor’s Display Memory has finite storage capacity. The
data storage time available depends upon the number of gases
being measured, as well as the frequency with which
measurements are performed (that is, the sampling interval).
Section 9.3 provides information about how you can roughly
calculate the length of time the data from a particular monitoring
task can be stored in the Display Memory.
It is important to realise that once the Display Memory has been
filled up by the results of a particular monitoring task, the results
of any further measurements in the same monitoring task will
start to overwrite the data already stored in the memory.
8.
Use the select push-buttons to define
compensate for water vapour interference.
if
you
want
to
9.
Use the select push-buttons to define if you want to cross
compensate for interferents.
10.
Use the select push-buttons to select the filters/gases you want
to measure. This step can be repeated up to 5 times, if 5 filters
are installed.
11.
Use the select push-buttons to define if you want to measure
water vapour.
_____________________________________________________________________________
BE6011-16
1314 Photoacoustic Multi-gas Monitor
LumaSense Technologies A/S
1412 Photoacoustic Field Gas-Monitor
Page 106 of 280
Chapter 7
______________________________________________________________________
12.
Use the select push-button to define if You want to store the
measurement history.
When step 12 is completed the display returns to the top of the
branch.
SELECT MEASUREMENT SET-UP BRANCH
MONITORING TASK
ENVIRONMENT
_____________________________________________________________________________
BE6011-16
1314 Photoacoustic Multi-gas Monitor
LumaSense Technologies A/S
1412 Photoacoustic Field Gas-Monitor
Page 107 of 280
Chapter 7
______________________________________________________________________
Environment branch
13.
Press S3 to enter the Environment branch.
14. Use the select push-buttons to select the desired flushing
mode.
If you select Auto, go to step 17.
If you select Fixed Time, go to step 15.
15. Use the direction push-buttons to define the Chamber Flushing
Time.
16. Use the select push-buttons to select Tube Flushing.
If you don’t want tube flushing, select NO and go to step 18.
If you select tube flushing, use the direction push-buttons to
define the flushing time and go to step 18.
17. Use the direction push-buttons to select the desired sample
tube length and move on to the next display.
18. Use the direction push-buttons to select the desired
normalization temperature.
See section 7.1 for details about the normalization options.
When step 18 is completed, the display returns to the top of the
MEASUREMENT branch.
Press S to go to the top of the Set-up Tree.
If you want measurement data presented as averaged concentration
values, then go to step 20. If you want your measurement data
presented as sample concentration values, then press SET-UP to
exit the set-up function.
Format branch
If you are starting here, press SET-UP:
19.
Press S2 to enter the FORMAT branch.
20. Use the direction push-buttons to enter the correct averaging
period.
21. Use the select push-buttons to choose if you want to print each
gas.
If you select Yes, go to step 22.
If you select No, go to step 23.
_____________________________________________________________________________
BE6011-16
1314 Photoacoustic Multi-gas Monitor
LumaSense Technologies A/S
1412 Photoacoustic Field Gas-Monitor
Page 108 of 280
Chapter 7
______________________________________________________________________
22. Use the select push-buttons to choose which individual
parameters should be printed. Each time one of the select pushbuttons are pressed, the next parameter is displayed. This step
can be repeated up to 7 times, depending on the number of filters
installed.
23.
Use the select push-buttons to select the Text line Terminator.
24. The text screen returns to the top of the set-up tree. Press
SET-UP to exit the set-up tree.
If you want to set Alarm limits for the measured gases, go to section
7.3.
7.3 Setting-up the Monitor’s Alarm Levels
The alarm limits of a gas are those concentrations of gas which
should activate any alarm relay connected to the Monitor via its back
panel “Alarm Relay” socket. There are two different alarm relays,
which function slightly differently. Details of these relays and the way
in which they function is described fully in section 5.5. The alarm
level parameters are found in the Filters branch of the Set-Up Tree.
Warning! If the UA number for any filter is changed here, then all
the calibration data for that filter will be lost and the filter will need
to be recalibrated.
1.
Press SET-UP S3 S3. The following text is displayed
CHECK AND/OR CHANGE SET-UP FOR FILTER A
NO
YES
2.
Use the select push-buttons to ignore this filter or to select this
filter if alarms are to be set.
3.
Press T 5 times until the following text is displayed.
GAS A HIGH ALARM LIMIT 1 _________mg/m3
PRESS ENTER TO CHANGE VALUE
4.
Use the direction push-buttons to set the alarm concentration.
If you do not wish to activate the alarm function for a particular
gas, select the DEFAULT. This will “blank out” the alarm level
value for the gas and deactivate the alarm for that gas.
_____________________________________________________________________________
BE6011-16
1314 Photoacoustic Multi-gas Monitor
LumaSense Technologies A/S
1412 Photoacoustic Field Gas-Monitor
Page 109 of 280
Chapter 7
______________________________________________________________________
GAS A HIGH ALARM LIMIT 2 _________mg/m3
PRESS ENTER TO CHANGE VALUE
5.
Use the direction push-buttons to set the alarm concentration.
If you do not wish to activate the alarm function for a particular
gas, select the DEFAULT. This will “blank out” the alarm level
value for the gas and deactivate the alarm for that gas.
6.
Repeat steps 2 to 4 to set the alarms for the other filters.
7.
Press SET-UP to exit the alarm set-up.
7.4 Starting a Monitoring Task
Monitoring tasks can be started in two ways. They can be started
immediately, or set to start at a pre-set time. The duration of the
monitoring sequence can also be determined. A monitoring task can
continue until it is stopped manually, or at a pre-set time.
When using the PC and the Online option, there are no limits to the
duration of a monitoring task. However, if the measurement results
are being stored in the monitor’s memory, the duration of the
monitoring task should be considered as there is only a finite amount
of memory in the monitor. See section 9.3 for full details about the
storage capacity of the monitor.
7.4.1
PC Use – using the Online Program
Using the PC, a monitoring task can be paused or stopped and then
re-started at your convenience. This means a monitoring task can
comprise of one or more monitoring sequences, where each
sequence has a distinct name. When sequences are measured
consecutively, using the same name, a number appears after the
name (starting at 1). This shows the order in which they were
measured.
Before a monitoring task is started, the set-up, as described in
section 7.2, must be completed.
1.
Pull down the Sequence menu and click on Start. The New
Measurement Sequence window opens.
2.
In the Enter sequence description: field, type in the name of the
monitoring sequence. If you do not enter a name, the default
name is used: Sequence 1.
_____________________________________________________________________________
BE6011-16
1314 Photoacoustic Multi-gas Monitor
LumaSense Technologies A/S
1412 Photoacoustic Field Gas-Monitor
Page 110 of 280
Chapter 7
______________________________________________________________________
3.
In the Start Time group:
To start the measurement immediately, click on the Now radiobutton.
or
To delay the start, click on the Start at: radio-button and define
the start time.
4.
In the Stop Time group:
If no stop time is required, click on the None radio-button. This
means the measurement must be stopped manually.
or
To determine the duration of the monitoring sequence, click on
the Stop at: radio-button and define the stop time.
5.
Press OK to start the monitoring task.
Stopping the Monitoring Task
If no pre-set monitoring period is defined, then to stop the
monitoring task, pull down the Sequence menu and click on Stop.
7.4.2
PC Use – using the Offline Program
Before a monitoring task is started, the monitor should be warmed
up and set-up, as described in section 7.2, must be completed and
downloaded to the monitor.
1.
Press MEASURE.
The following text appears on the screen:
ACTIVE TASK : MONITORING TASK NUMBER
START TASK
DELAYED TASK
1
CHANGE TASK
Please note: if you do not use one of the “select” keys within a
short time after the above text appears, the Monitor will
automatically stop operating in Measure mode (the light-emitting
diode in the MEASURE key switches off). If this happens, just press
MEASURE again.
2.
To start the measurement immediately, press S1.
To delay the start, press S2.
_____________________________________________________________________________
BE6011-16
1314 Photoacoustic Multi-gas Monitor
LumaSense Technologies A/S
1412 Photoacoustic Field Gas-Monitor
Page 111 of 280
Chapter 7
______________________________________________________________________
The following warning then appears on the display:
WARNING : DISPLAY MEMORY WILL BE DELETED
PROCEED
STOP
Display Memory is where the Monitor stores the results of all
measurements while it is performing a monitoring task. If the
monitoring task is stopped and then started again all the data
already collected will be deleted from Display memory. However,
the data in Display Memory can be copied into and stored in the
Monitor’s Background Memory. This operation is described in
section 11.2.
3.
Press S1.
Immediate Start
If you selected an immediate start, the following text appears on the
screen:
MEASUREMENT IN PROGRESS
RESULTS NOT YET AVAILABLE
4.
When the first measurement cycle is complete the Monitor will
automatically display the results and update them every time a
new measurement cycle is completed.
An example is shown below:
A: 4.52 E+01
D : ________
B :__________
E :__________
C : _________
W : 3.52
This display gives the overview of the gas/vapour concentration last
measured – in this case the concentration of gas A and humidity of
the water vapour are in the units that were selected – that is mg/m3
for gas A and Tdew for water vapour (see section 4.3.2).
_____________________________________________________________________________
BE6011-16
1314 Photoacoustic Multi-gas Monitor
LumaSense Technologies A/S
1412 Photoacoustic Field Gas-Monitor
Page 112 of 280
Chapter 7
______________________________________________________________________
Delayed Start
If you selected a delayed start, the following text is displayed:
START TIME 1 00 : 00
PRESS ENTER TO CHANGE VALUE
Press ↵
The following text is displayed.
ACTIVE TASK : MONITORING TASK NUMBER 1
TASK WILL START AT 10 16 : 25
TIME 16:25
The time shown in the TIME: field is the current time.
The measurement task will start at 10 16 : 25. At 16:25 the 10th of
the Current month. When the monitoring task starts, the monitor’s
screen will change and display the same messages as those
displayed when a monitoring task starts immediately.
Stopping the Monitoring Task
If no pre-set monitoring period is defined, then to stop the
monitoring task, press MEASURE and S3.
7.4.3
Stand-alone Use – using the Front Panel Pushbuttons
Before a monitoring task is started, the set-up, as described in
section 7.2, must be completed:
Before any monitoring task is started, all data stored in the Monitor’s
Display Memory is removed (cleared). The Display Memory is where
the Monitor stores the results of all measurements while it is
performing a monitoring task. However, the data in Display Memory
can be copied into and stored in the Monitor’s Background Memory.
This operation is described in section 11.2.
_____________________________________________________________________________
BE6011-16
1314 Photoacoustic Multi-gas Monitor
LumaSense Technologies A/S
1412 Photoacoustic Field Gas-Monitor
Page 113 of 280
Chapter 7
______________________________________________________________________
When you start a new monitoring task the following warning is
displayed WARNING: DISPLAY MEMORY WILL BE DELETED to
remind you to store any data that is presently stored in the Display
Memory. If a monitoring task is stopped, any data already stored in
Display Memory will be deleted when a monitoring task is started.
1.
Press MEASURE.
The following text appears on the screen:
ACTIVE TASK : MONITORING TASK NUMBER 1
START TASK
DELAYED TASK
CHANGE TASK
Please note: if you do not use one of the “select” keys within a
short time after the above text appears, the Monitor will
automatically stop operating in Measure mode (the light-emitting
diode in the MEASURE key switches off). If this happens just press
MEASURE again.
The active monitoring task number is the number of the monitoring
task you wish the Monitor to perform.
2.
If the monitoring task number displayed is correct, then go to
step 5.
If the number on the display is not correct then press S3 to
change the task number.
This changes the display text to the following:
MONITORING TASK
3.
SELECT TASK
CALIBRATION TASK
Press S1.
This causes the following text to appear on the display:
MONITORING TASK SET-UP NUMBER 1
PRESS ENTER TO CHANGE VALUES
_____________________________________________________________________________
BE6011-16
1314 Photoacoustic Multi-gas Monitor
LumaSense Technologies A/S
1412 Photoacoustic Field Gas-Monitor
Page 114 of 280
Chapter 7
______________________________________________________________________
The number appearing on the screen will be a number from 1 to
10.
4.
Press ↵ and use the direction keys to change the monitoring
task number to the desired value. Then press ↵ again to accept
the task number.
The following text appears on the display screen:
ACTIVE TASK : MONITORING TASK NUMBER 1
START TASK
5.
DELAYED TASK
CHANGE TASK
To start the measurement immediately, press S1.
To delay the start, press S2.
The following warning then appears on the display:
WARNING : DISPLAY MEMORY WILL BE DELETED
PROCEED
6.
STOP
Press S1.
Delayed Start
If you selected a delayed start, the following text is displayed:
START TIME :
1 00 : 00
PRESS ENTER TO CHANGE VALUE
Use the direction push-buttons to enter the desired date and start
time, e.g. 10 16:25. The following text is displayed.
_____________________________________________________________________________
BE6011-16
1314 Photoacoustic Multi-gas Monitor
LumaSense Technologies A/S
1412 Photoacoustic Field Gas-Monitor
Page 115 of 280
Chapter 7
______________________________________________________________________
ACTIVE TASK : MONITORING TASK NUMBER 1
TASK WILL START AT : 10 16 : 25
TIME 16 : 00
When the monitoring task starts, the screen will change and
display the same messages as those displayed when a monitoring
task starts immediately.
Immediate Start
If you selected an immediate start, the following text appears on
the screen:
MEASUREMENT IN PROGRESS
RESULTS NOT YET AVAILABLE
7.
When the first measurement cycle is complete the Monitor will
automatically display the results and update them every time a
new measurement cycle is completed. An example is shown
below:
A : 4.52 E + 01
B :__________
D : __________
E : __________
C : _________
W : 8.33 E + 00
This display gives the overview of the gas/vapour concentrations last
measured – in this case the concentration of gas A and humidity of
the water vapour are in the units that were selected – that is mg/m3
for gas A and Tdew for water vapour (see section 4.3.2).
If no pre-set monitoring period is defined, then to stop the
monitoring task, press MEASURE and S3.
_____________________________________________________________________________
BE6011-16
1314 Photoacoustic Multi-gas Monitor
LumaSense Technologies A/S
1412 Photoacoustic Field Gas-Monitor
Page 116 of 280
Chapter 8
______________________________________________________________________
Chapter 8
Viewing Measurement Data – using a PC
July 2009
_____________________________________________________________________________
BE6011-16
1314 Photoacoustic Multi-gas Monitor
LumaSense Technologies A/S
1412 Photoacoustic Field Gas-Monitor
Page 117 of 280
Chapter 8
______________________________________________________________________
8.1 Measurement Data
In order for the measurement data to be viewed using the PC
software, the data must be stored in the PC. For Offline and Standalone use, where the measurement data is stored in the monitor,
then the data must be Uploaded to the PC.
All measurement data from the Monitor, regardless of what is being
displayed on screen during the measurement, is transferred to the
PC and stored in a MS-Access® format. This measurement data can
be viewed on screen, analyzed and used in other software programs
that utilize ODBC.
8.1.1
Uploading Measurement Data from the Monitor
Any measurement data that is stored in the Monitor’s display
memory can be uploaded to a PC. Measurement data can be
uploaded either as a new measurement task, which is given a unique
name, or it can be uploaded so that it becomes a sequence in an
existing measurement task. If EVENT (only valid for 1412) was
pressed or something happened while monitoring, the uploaded data
retains these marks, which can be displayed using the Presentation
program.
With the monitor and the PC connected as described in section 2.2
and the Offline
program running:
1.
Click on Up/Download index card, see Fig.8.1.
_____________________________________________________________________________
BE6011-16
1314 Photoacoustic Multi-gas Monitor
LumaSense Technologies A/S
1412 Photoacoustic Field Gas-Monitor
Page 118 of 280
Chapter 8
______________________________________________________________________
Fig.8.1 The Up/Download dialogue
2.
Click on the radio-button to either Upload to a new task or
Upload to an existing task.
If you are adding data to an Existing Task, select the monitoring task
from the list
displayed.
3.
Click on the Upload Sequence soft-key.
If you are uploading measurement to a New Task, a New
measurement Task dialogue opens, type in the desired monitoring
task name now, and click on OK.
The measurement data is uploaded to the PC, where it can be viewed
using the Presentation program.
If the upload sequence soft-key is activated when no data is stored
in the Monitor’s display memory the following warning will be
displayed. (Fig. 8.2).
_____________________________________________________________________________
BE6011-16
1314 Photoacoustic Multi-gas Monitor
LumaSense Technologies A/S
1412 Photoacoustic Field Gas-Monitor
Page 119 of 280
Chapter 8
______________________________________________________________________
Fig.8.2 Offline warning message.
8.2 Graphic Window
This window can display all the measured gases and atmospheric
pressure, simultaneously. The concentration curves can be allocated
to either of the two axes. The scale and units of these axes can be
set individually to suit the displayed value on them. The number of
curves displayed, their colour and their styles are defined by you.
Measurement data can be displayed as instantaneous concentration
curves or as average concentration curves, where you define the
averaging interval. This window also displays several “MARKS”.
These appear if something happens during the measurement, or an
alarm is triggered. If any events have been added during the
monitoring task, these are also displayed here. These marks and
events are always displayed with the Online program, but can be
hidden with the Presentation program. See “Events” index card in
section 8.2.1 and section 8.3.1.
When using the Online program, the latest measurement results are
always displayed at the right-hand end of the axis. Previous
measurement results roll across the X-axis, disappearing from view
at the left Y-axis when the interval defined for the X-axis is full.
These measurement results are not lost, just not displayed.
8.2.1
Graphic Window Properties Dialogue Box
This dialogue box enables you to define exactly what is displayed in
the graphic window. The separate sections are divided up by index
cards. To simplify matters, the following explanations are given
under the index card name headings.
Interval index card
This index card is divided into several groups:
Measurement Sequence: this option is only available when the
Presentation software option is used. You can select any one of the
sequences recorded under the currently selected monitoring task.
_____________________________________________________________________________
BE6011-16
1314 Photoacoustic Multi-gas Monitor
LumaSense Technologies A/S
1412 Photoacoustic Field Gas-Monitor
Page 120 of 280
Chapter 8
______________________________________________________________________
Time: this is a toggle option. You can select either this option or the
measurement number option. This option enables you to define the
X-axis as a period of time.
Note there are slight variations here between the Online program
and the Presentation program.
Online: defining a time period here determines the time period for
the length of the X-axis. This acts like a rolling window, where the
period for the X-axis is always the same and the latest measurement
result will always be displayed at the right-hand end of the X-axis.
Presentation: defining the times and dates here, enable you to select
a time period which can stretch over several measurement
sequences. In fact, the complete monitoring task can be displayed by
defining the times and dates here.
Measurement Number: this is a toggle option. You can select
either this option or the Time option. Like the time option, by
defining a value here, you define the length of the X-axis, defined as
a number of measurements. For the Online program, the X-axis
works like a rolling window, where the latest measurement is always
displayed at the right-hand end of the axis. For the presentation
option, several measurement sequences, under the same monitoring
task name, can be displayed at the same time.
Rolling Average: this enables you to define what sample values are
displayed. If the check box in this field is not ticked (default setting),
then individual sample concentration values are displayed. However,
if the check box is ticked an averaging interval must be entered
Rolling Average: the individual sample values are averaged and
displayed on the graph. By defining the averaging time, you can
display defined Time-weighted Average (TWA) values. This can be of
use if you need to know 8 hour National Occupational Exposure
Limits or Short Term Exposure Limits (STEL) averaged over 15
minutes. The formulae used to calculate the average values are
described in detail in section 8.4. The units of the value defined here
change depending on which radio-button was selected, time or
measurement number.
Left Y-axis index card
It is here you define the scale of the left Y-axis, which curves are
allocated to this axis, and their appearance.
Scaling: this enables you to set the scale of this axis. There are
three possibilities:
_____________________________________________________________________________
BE6011-16
1314 Photoacoustic Multi-gas Monitor
LumaSense Technologies A/S
1412 Photoacoustic Field Gas-Monitor
Page 121 of 280
Chapter 8
______________________________________________________________________
Autoscale maximum and minimum: by selecting this option, the
measurement data will always be displayed. The scale will start just
below the minimum value and end just above the maximum value.
With the Online option, the scale will widen as the values vary, both
upwards and downwards.
Autoscale maximum (minimum = 0): by selecting this option, the
axis will always start at zero. The top value depends on the
maximum value. With the Online option, the scale will increase when
the values exceed the displayed value.
Autoscale OFF: this option enables you to define the minimum and
maximum values on the axis. This can be of use if you are interested
in a particular range. Note that with this option, the curve(s) may not
appear on the screen. When you select this option, the scaling icons
in the tool bar become active.
These icons enable you to change the scaling :
0
to
maximum
maximum, respectively..
or
minimum
to
Single Curve Setup: it is here you define which gas curves are
allocated to this axis. You define their colour, the style of line, you
can even change their units here if necessary.
Select parameter: by clicking in this field, the names of all the gases
and the atmospheric pressure measured during this monitoring task
are displayed. Clicking on a parameter name enables you to set up
the curves individually.
Select colour: there are seven standard colours to choose from. If
necessary, a user-defined colour can be selected. By clicking on
Define, the Windows® mixing palette is displayed. The standard
Windows procedure should be followed.
Select style: there are several styles to choose from. These are
displayed by clicking in the style field.
Select unit: this enables you to display the gas or pressure with the
desired units.
When you click in the select unit field, the units
available for this gas or pressure are displayed.
All Curves: if a curve for a measured value is to be displayed in the
graphic window, then it must appear here. Gases and the
atmospheric pressures are entered in this field by first displaying
their name in the Select Parameter field, setting up the display
parameters for the curve and then pressing the Add New soft-key.
Note that if a parameter already appears here, but you want to edit
_____________________________________________________________________________
BE6011-16
1314 Photoacoustic Multi-gas Monitor
LumaSense Technologies A/S
1412 Photoacoustic Field Gas-Monitor
Page 122 of 280
Chapter 8
______________________________________________________________________
one or more of the display parameters, then you must remove the
existing parameter and add it with changed display parameters.
Soft-keys: these three keys are used to edit the names in the All
curves list.
Add New: if this is pressed after the appearance of a gas and the
atmospheric pressure has been defined, then the gas is added to the
end of the list of gases already displayed.
Insert Before: this puts the selected parameter at the top of the list.
Remove: this enables you to remove a curve name, resulting in this
curve not being displayed.
Note: the fastest way to set type Y-axis in the graphic window is:
when the sequence settings are defined, open a new graphic window.
All the selected parameters are displayed. If you want to change any
of the display parameters, then do this using the Windows Properties
dialogue.
Right Y-axis index card
It is here you define the scale of the right Y-axis, which curves are
allocated to this axis and their appearance.
All the values in this index card are set up in exactly the same way
as those in the Left Y-axis index card.
Event index card (presentation only)
There are five check boxes that can be selected here. If a tick
appears in the check box, then this “event” is displayed in the
graphic window.
Communication Errors: are marked by a line with a “C” at the end of
it. These indicate when a communication error has occurred between
the monitor and the PC.
Alarms: are marked by a line with a small red triangle at the end.
These indicate when the alarm was triggered, and which gas
triggered the alarm.
User Events: are marked by a cursor with a User event Text at the
top of it.
_____________________________________________________________________________
BE6011-16
1314 Photoacoustic Multi-gas Monitor
LumaSense Technologies A/S
1412 Photoacoustic Field Gas-Monitor
Page 123 of 280
Chapter 8
______________________________________________________________________
Gas Monitor Warnings/Errors:
Event
Marks
Description
Common Marks: apply to all filters
The Monitor stopped measuring due to a power
failure, but automatically re-started monitoring
again after regaining power.
The Monitor was “reset” because a fault was
detected.
The measurement was marked by the user when
“User Event
Text”
the Event button was pressed.
“W”
An operational error was detected, or a warning
was given during the measurement. The accuracy
of the measurement cannot be guaranteed.
Gas Marks: apply to individual filters
“B”
The Monitor was incapable of calculating this gas
concentration.
“F”
After this measurement the filter carousel was
found to be out of alignment. If the misalignment
is only slight, then accuracy of the measurement
has not been affected, but the accuracy of such a
measurement can not be guaranteed.
“▼”
The gas concentration measured during this
measurement cycle exceeded the user-defined
alarm limit, resulting in an alarm being triggered.
To see which gas the Common Mark adheres to, open a numeric
window.
“P”
8.3 Numeric Window
This window can display all the measurement data, simultaneously.
Gas Measurement data can be displayed as instantaneous values or
as average values. This window also displays several “MARKS”.
These appear if something happens during the measurement, or an
alarm is triggered. If any events have been added during the
monitoring task, these are also displayed here. These marks and
events are always displayed with the Online program, but can be
hidden with the Presentation program. See “Events” index card in
section 8.2.1 and section 8.3.1.
When using the Online program, the latest measurement results are
always displayed at the bottom of the column, Previous
measurement results roll upwards, disappearing from view at the top
of the column when the defined interval is full. These measurement
results are not lost, just not displayed.
_____________________________________________________________________________
BE6011-16
1314 Photoacoustic Multi-gas Monitor
LumaSense Technologies A/S
1412 Photoacoustic Field Gas-Monitor
Page 124 of 280
Chapter 8
______________________________________________________________________
8.3.1
Numeric Window Properties Dialogue Box
Interval index card
This index card is divided into several groups:
Measurement Sequence: this option is only available when the
Presentation software option is used. You can select any one of the
sequences recorded under the currently selected monitoring task.
When using the Online program, a specified interval from the latest
measurement can be displayed.
Time: this is a toggle option. You can select either this option or the
measurement number option. This option enables you to define the
column length as a period of time. Note there are slight variations
here between the Online program and the Presentation program.
Online: defining a time period here determines the time period for
the length of the column. This acts like a rolling window, where the
period for the column is always the same and the latest result will
always be displayed at the bottom of the column.
Presentation: defining the times and dates here enable you to select
a time period, which can stretch over several measurement
sequences. In fact, the complete monitoring task can be displayed by
defining the times and dates here.
Measurement Number: this is a toggle option. You can select
either this option or the Time option. Like the Time option, by
defining a value here, you define the length of the column, defined
as a number of measurements. For the Online option, the X-axis
works like a rolling window, where the latest measurement is always
displayed at the bottom of the column. For the presentation option,
several measurement sequences, under the same monitoring task
name, can be displayed at the same time.
Rolling Average: this enables you to define what sample values are
displayed. If the check box in this field is not ticked (default setting),
then individual sample values are displayed. However, if the check
box is ticked an averaging interval must be entered:
Rolling Average: the individual sample values are averaged and
displayed in the columns. By defining the averaging time, you can
display defined Time-weighted Average (TWA) values. This can be of
use if you need to know 8 hour National Occupational Exposure
Limits or Short Term Exposure Limits (STEL) averaged over 15
minutes. The formulae used to calculate the average values are
described in detail in section 8.4.2. The units of the value defined
_____________________________________________________________________________
BE6011-16
1314 Photoacoustic Multi-gas Monitor
LumaSense Technologies A/S
1412 Photoacoustic Field Gas-Monitor
Page 125 of 280
Chapter 8
______________________________________________________________________
here change depending on which radio-button was selected, time or
measurement number.
Columns index card
It is here you define which component’s parameters are displayed in
the numeric window.
Single Column Setup: you define which parameters are displayed
and their units.
Select parameter : by clicking in this field, the names of all the gases
and atmospheric pressure measured during this monitoring task are
displayed. The gases and pressure are selected individually.
Select unit: this enables you to display the desired units for each gas
and for the atmospheric pressure. When you click in the select unit
field, the available units for this parameter are displayed.
All Columns: if a component’s parameter is to be displayed in the
numeric window, then it must appear here. Parameters are entered
in this field by first selecting their name and units and then pressing
the Add New soft-key. Note that if a parameter already appears
here, but you want to edit the units, then you must remove the
existing parameter and add it again with the changed units.
Soft-keys: these three keys are used to edit the names in the All
Columns list.
Add New: if this is pressed after the appearance of a parameter has
been defined, then the gas is added to the end of the list of gases
already displayed.
Insert Before: this puts the selected parameter at the top of the list.
Remove: this enables you to remove a parameter curve name,
resulting in this curve not being displayed.
Note: the fastest way to set the properties in the numeric window is:
when the sequence settings are defined, open a new numeric
window. All the selected components are displayed. If you want to
change any of the display parameters, then do this using the
Windows Properties dialogue.
_____________________________________________________________________________
BE6011-16
1314 Photoacoustic Multi-gas Monitor
LumaSense Technologies A/S
1412 Photoacoustic Field Gas-Monitor
Page 126 of 280
Chapter 8
______________________________________________________________________
Events index card (presentation only)
There are five check boxes, which can be selected here. If a tick
appears in the check box, then this “event” is displayed in the
numeric window.
Communication Errors: are marked by a line with a “C” at the end of
it. These indicate if there has been communication problems between
the Monitor and the PC.
Alarms: are marked by a small red triangle ▼.
These indicate when the alarm was triggered, and are situated on the
value for the gas, which triggered the alarm.
User Events: are marked with a User Event Text at the end of it (see
figure 8.6).
Gas Monitor Warnings/Errors:
Event Marks
Description
Common Marks: apply to all filters
“P”
The Monitor stopped measuring due to a power
failure, but automatically re-started monitoring
again after regaining power.
The Monitor was “reset” because a fault was
detected.
“User Event
The measurement was marked by the user
Text”
when the Event button was pressed
“W”
An operational error was detected, or a warning
was given during the measurement. The
accuracy of the measurement cannot be
guaranteed.
Gas Marks: apply to individual filters
“B”
The Monitor was incapable of calculating this
gas concentration.
“F”
After this measurement the filter carousel was
found to be out of alignment. If the
misalignment is only slight, then accuracy of
the measurement has not been affected, but
the accuracy of such a measurement can not
be guaranteed.
“▼”
The gas concentration measured during this
measurement cycle exceeded the user-defined
alarm limit, resulting in an alarm being
triggered.
To see which gas the Common Mark adheres to, open a numeric
window.
_____________________________________________________________________________
BE6011-16
1314 Photoacoustic Multi-gas Monitor
LumaSense Technologies A/S
1412 Photoacoustic Field Gas-Monitor
Page 127 of 280
Chapter 8
______________________________________________________________________
8.4 Using the Cursors
Cursors can be used in both the numeric and graphic windows. The
way they are used and the information they provide is the same in
both situations. Before the cursors can be displayed, the Cursor
Values window must be opened and the window in which you wish to
position the cursor(s) must be selected. Once the Cursor Values
window is open, you click on the curve (in the graphic window) or on
the value (in the numeric window) that you are interested in.
The cursor function is divided into two parts: when a single cursor is
displayed and when two cursors are displayed.
8.4.1
“Single” Cursor
When you click in the window, a single cursor appears in the graphic
window while two cursors appear either side of a single value in the
numeric window. The Cursor Values dialogue gives several pieces of
information:
Cursor Position: this can be given as either a time and date or a
measurement number, depending on what was defined in the
Window Properties dialogue.
The displayed measurement values (and their display units) are
listed on the left-hand side of the dialogue. Opposite each parameter,
under the heading Cursor Value, there is a value displayed. This is
the measured value for the parameter where the cursor has been
positioned.
There is a soft-key, View Settings, which enables you to see the
measurement’s settings (see section 7.3) for the measurement
sequence.
Fig.8.3 The Cursor Value window using a single cursor .
_____________________________________________________________________________
BE6011-16
1314 Photoacoustic Multi-gas Monitor
LumaSense Technologies A/S
1412 Photoacoustic Field Gas-Monitor
Page 128 of 280
Chapter 8
______________________________________________________________________
Note: the View Settings soft-key is only available when this “single”
cursor is displayed.
8.4.2
Two Cursors
If you are interested in the measurement data in a particular range,
or need to zoom in, then two cursors can be used. The second cursor
is displayed when you click on the initial cursor (either of the cursors
in the numeric window), hold the left mouse button down and drag
the cursor to the desired position and then release the mouse button.
The two cursors are quite easy to see now. The information in the
Cursor Values dialogue changes.
When using the Online program, the cursors can be used to look at
any of the data more closely. But, note that as soon as a new
measurement is available from the monitor, this will be displayed,
disturbing your zoomed in view. In this case, it is more convenient to
use the Presentation program simultaneously.
Fig.8.4 Cursor Value Window using two cursors.
Left Cursor Position: this can be given either as a time and date or
a measurement number, depending on what was defined in the
Window Properties dialogue.
Right Cursor Position: this can be given as either a time and date
or a measurement number, depending on what was defined in the
Window Properties dialogue.
The displayed parameters (and their display units) are listed on the
left-hand side of the dialogue. Opposite each parameter are several
values under the headings:
Minimum: this shows the minimum value for each parameter
between the cursors.
_____________________________________________________________________________
BE6011-16
1314 Photoacoustic Multi-gas Monitor
LumaSense Technologies A/S
1412 Photoacoustic Field Gas-Monitor
Page 129 of 280
Chapter 8
______________________________________________________________________
Average: this gives the linear average value for all the values for
each parameter between the cursors. The calculation of “the mean
value” can be expressed mathematically as follows:
n= N
The average value =
∑ (Cn)
n =1
N
Where: N =
measurement
cycles
performed
during
the
monitoring period (T) between the cursors.
Cn = gas concentrations (where n = 1 to N)
Maximum: this shows the maximum value for each parameter
between the cursors.
Standard Deviation: this is the standard deviation of a
particular gas’s measurements from the average value of this
parameter.
n= N
The Standard deviation =
∑ (Cn − μ )
2
n =1
N −1
Where: µ = the mean value
Cn = individual gas concentrations
N = total number of measurements
Note: the View Settings soft-key is not displayed when two cursors
are displayed.
Zoom Function
When two cursors are displayed, the zoom function can be used. By
pulling down the View menu and clicking on Zoom in. All the
measurement data outside the cursors is removed from the screen.
By setting new cursors, the zoom can be repeated.
Note: the Cursor Values dialogue updates each time the new cursors
are displayed.
There are two ways to zoom out again.
You can pull down the View menu and click on Zoom out.
or
You can redefine the time “window” or the number of measurements
displayed in the Window Properties dialogue.
_____________________________________________________________________________
BE6011-16
1314 Photoacoustic Multi-gas Monitor
LumaSense Technologies A/S
1412 Photoacoustic Field Gas-Monitor
Page 130 of 280
Chapter 8
______________________________________________________________________
8.5 User Event Markers
If something happens or you change something during a monitoring
task, or you just want to indicate a measurement for some reason,
this is possible using the Insert User Event option. The measurement
results are marked by a vertical line with a Keyed in User Event Text
at the top in the graphic window and a horizontal line with the event
text at the end of it in the numeric window.
User events can be inserted:
Previous measurement: (Online only) this is the measurement prior
to the one currently being measured.
Next measurement: (Online only) this is one currently being
measured. The event marker first appears when the measurement is
displayed.
At the cursor: this is only possible when the cursor is displayed. The
marker appears at the cursor, but remains there after the cursor is
moved. This is the only way to insert User Events when using the
Presentation program.
When the presentation option is used to view measurement data, the
user event markers can be displayed or hidden, depending on the
settings in the Window Properties dialogue (see section 8.2.1 and
section 8.3.1).
8.5.1
Inserting a User Event Marker
If you want to insert a User Event marker at the cursor, position the
“single” cursor.
1. Pull down the Edit menu. Click on User Event and a new dialogue
box opens.
2. Online only – click on the radio-button for the desired position.
Fig.8.5 The User Event window.
_____________________________________________________________________________
BE6011-16
1314 Photoacoustic Multi-gas Monitor
LumaSense Technologies A/S
1412 Photoacoustic Field Gas-Monitor
Page 131 of 280
Chapter 8
______________________________________________________________________
3. Type in any comments you may have in the Events Text field.
4. Click on OK.
Fig.8.6 The User Event text in the online graphic and
numerical windows.
_____________________________________________________________________________
BE6011-16
1314 Photoacoustic Multi-gas Monitor
LumaSense Technologies A/S
1412 Photoacoustic Field Gas-Monitor
Page 132 of 280
Chapter 8
______________________________________________________________________
The user event marker and event text will appear at the designated
point.
8.5.2
Deleting a User Event Marker
To delete a User Event marker:
1. Position the cursor in the Numeric Window or the Graphic Window,
at the desired position.
2. Pull down the Edit menu. Click on User Event and a new dialogue
box opens.
3. Online only – click on the radio-button for the desired position.
Fig.8.7 The User Event window.
4. Now delete the text in the Events Text field.
5. Click on OK.
8.6 Status Windows
There are two status windows: Alarms status and Measurement
status. These can be displayed when the Online program is being
used.
8.6.1
Alarm Status
If an alarm has been defined in the Sequence Settings dialogue (see
section 7.3), and that alarm has been triggered, then by opening the
sequence settings alarm index card window, you can see which gas
_____________________________________________________________________________
BE6011-16
1314 Photoacoustic Multi-gas Monitor
LumaSense Technologies A/S
1412 Photoacoustic Field Gas-Monitor
Page 133 of 280
Chapter 8
______________________________________________________________________
triggered it. When an alarm is triggered, a red triangle flashes until
the alarm has been confirmed, using the Confirm soft-key.
Furthermore all the alarms can be confirmed at once using the
Confirm All soft key.
See figure 8.8
Fig.8.8 The Alarm Status window.
8.6.2
Measurement Status
This informs you if the measurement is active or idle, when the last
measurement was made and the latest measurement values for all
the measured parameters, even if they are not displayed in the
graphic or numeric windows.
Fig.8.9 The measurement status window.
_____________________________________________________________________________
BE6011-16
1314 Photoacoustic Multi-gas Monitor
LumaSense Technologies A/S
1412 Photoacoustic Field Gas-Monitor
Page 134 of 280
Chapter 8
______________________________________________________________________
8.7 Displaying Measurement Results while Monitoring
Using the Online program, measurement data is displayed on screen
as soon as it is available from the monitor. The data can be displayed
in both a graphic window and a numeric window, simultaneously. The
latest measurement results are always displayed.
With the Online program running and a monitoring task started:
1. If you want to open another window, pull down the Window menu
and click on New
Graphic Window or New Numeric Window.
2. Click in the window you want to set up, and pull down the Edit
menu. Click on Window Properties, see Fig.8.10.
Fig.8.10 The Window Properties dialogue for a graphic window
Interval index card
3. Select the interval units for the X-axis. Click on either the Time or
Measurement Number radio-buttons and define the interval length.
4. Select the displayed measurement values.
_____________________________________________________________________________
BE6011-16
1314 Photoacoustic Multi-gas Monitor
LumaSense Technologies A/S
1412 Photoacoustic Field Gas-Monitor
Page 135 of 280
Chapter 8
______________________________________________________________________
If you want to display single measurement values, ensure that the
check box in the Rolling Average group is not ticked.
If you want to display rolling average values, click in the Rolling
average check box and define the averaging interval.
If you have opened a numeric window, go to step 5. If you have
opened a graphic window go to step 11.
Column index card
5. Click on the Column index card.
6. If the parameters and their units displayed in the All Columns field
are not correct, click on the parameter you want to change.
If the parameter you want to display is not present in the All
Columns field, click on Add New or Insert Before.
7. In the Single Column Setup group, click in the Select Parameter field
and select the desired parameter.
8. Click in the Select unit field and select the desired units.
9. Repeat steps 6. to 8., selecting the other parameters you want to
display.
10.
Press OK to save selections and exit the dialogue box.
The selected parameters will now be displayed in the numeric
window as they become available.
Left Y-axis index card
11.
Click on the Left Y-axis index card.
12.
In the Scaling group, select the desired scaling mode by
clicking on the correct radio-button.
13.
If the parameters and their units displayed in the All Curves
field are not correct, click on the parameter you want to change.
If the component you want to display is not present in the All Curves
field, click on Add New or Insert Before.
14.
In The Single Curve Setup, click in the Select parameter field
and select the desired parameter.
15.
Select the desired colour, style and units.
16.
Repeat steps 13. to 15. until all the component’s parameters
you want displayed on the left Y-axis are in the All Curves list.
_____________________________________________________________________________
BE6011-16
1314 Photoacoustic Multi-gas Monitor
LumaSense Technologies A/S
1412 Photoacoustic Field Gas-Monitor
Page 136 of 280
Chapter 8
______________________________________________________________________
Right Y-axis index card
17.
Click on the Right Y-axis index card
18.
In the Scaling group, select the desired scaling mode by
clicking on the correct radio-button.
19.
If the parameters and their units displayed in the All Curves
field are not correct, click on the parameter you want to change.
If the parameter you want to display is not present in the All Curves
field, click on Add New or Insert Before.
20.
In the Single Curve Setup, click in the Select Parameter field
and select the desired name.
21.
Select the desired colour, style and units.
22.
When all your selections are correct, click on Add New. The
selected parameter is now displayed in the All Curves field. This
means it will be displayed on the graph, with its value scale
displayed on the right axis.
23.
Repeat steps 19. to 22. until all the components you want
displayed on the right Y-axis are in the All Curves list.
24.
Press OK to save the selections and exit the dialogue box. The
measured data will now be displayed on screen.
Note: you can display the same parameter
simultaneously, with different units if desired.
several
times,
8.8 Displaying Measurement Results after Monitoring
Using the Presentation program, measurement data from monitoring
tasks stored in the computers memory is displayed on screen, The
data can be displayed in both a graphic window and a numeric
window, simultaneously.
With the presentation program running:
1. Pull down the Task menu. Click on Open to view an existing
database.
2. In the database window, click on the desired database name.
3. Click on OK.
_____________________________________________________________________________
BE6011-16
1314 Photoacoustic Multi-gas Monitor
LumaSense Technologies A/S
1412 Photoacoustic Field Gas-Monitor
Page 137 of 280
Chapter 8
______________________________________________________________________
A window opens showing all the measurement values for the
complete monitoring task.
Interval index card
4. Click in the Measurement Sequence field and a list of all the
sequences in the monitoring task is displayed.
5. Select the desired sequence or all sequences.
If you select all, then you can zoom in on the individual areas using
the cursor function (see section 8.4.2).
6. Select the interval units for the X-axis. Click on either Time or
Measurement Number radio-buttons and define the values in the
From: and To: fields.
7. Select the displayed measurement values.
If you want to display instantaneous values, ensure that the check
box in the Rolling Average group is not ticked.
If you want to display rolling average values, click in the Rolling
average check box and define the averaging interval.
If you have opened a numeric window, go to step 8. If you have
opened a graphic window go to step 13.
Column index card
8. Click on the Column index card.
9. If the parameters and their units displayed in the All Columns field
are not correct, click on the parameter you want to change.
If the parameters you want to display is not present in the All
Columns field, click on Add New or Insert Before.
10.
In the Single Parameter Setup group, click in the Select
Parameter field and select the desired parameter name.
11.
Click in the Select unit field and select the desired units.
12.
Repeat steps 9. to 11., selecting the other parameters you
want to display.
Go to step 25. to define the event markers that you want displayed
in the numeric window.
Left Y-axis index card
13.
Click on the Left Y-axis index card.
_____________________________________________________________________________
BE6011-16
1314 Photoacoustic Multi-gas Monitor
LumaSense Technologies A/S
1412 Photoacoustic Field Gas-Monitor
Page 138 of 280
Chapter 8
______________________________________________________________________
14.
In the Scaling group, select the desired scaling mode by
clicking on the correct radio-button.
15.
If the parameters and their units displayed in the All Curves
field are not correct, click on the parameter you want to change.
If the parameters you want to display is not present in the All
Columns field, click on Add New or Insert Before.
16.
In the Single Curve Setup, click in the Select Parameter field
and select the desired name.
17.
Select the desired colour, style and units.
18.
Repeat steps 15. to 17. until all the parameters you want
displayed on the left Y-axis are in the All Curves list.
Right Y-axis index card
19.
Click on the Right Y-axis index card.
20.
In the Scaling group, select the desired scaling mode by
clicking on the correct radio-button.
21.
If the parameters and their units displayed in the All Curves
field are not correct, click on the parameter you want to change.
If the parameters you want to display is not present in the All
Columns field, click on Add New or Insert Before.
22.
In the Single Curve Setup, click in the Select Parameter field
and select the desired name.
23.
Select the desired colour, style and units.
24.
Repeat steps 21. to 23. until all the parameters you want
displayed on the right Y-axis are in the All Curves list.
Events index card
25.
Click on the Events index card.
26.
Click in the desired check boxes to display the different event
markers.
27.
Press OK to save selection and exit the dialogue box.
Although the measurement data may be displayed on screen, you
can change any of the parameters, including the averaging value, in
the Window Properties dialogue whenever you please without losing
any data in the process.
_____________________________________________________________________________
BE6011-16
1314 Photoacoustic Multi-gas Monitor
LumaSense Technologies A/S
1412 Photoacoustic Field Gas-Monitor
Page 139 of 280
Chapter 8
______________________________________________________________________
8.9 Printing Measurement Results.
When using the online or presentation program, it is possible to
make a print-out of the measured data.
8.9.1
Printing the numeric, graphic or cursor values
window
1. Select the specific window by clicking on it while pointing at it with
the cursor.
2. Pull down the Task menu
3. Select print (see figure 8.11)
Fig.8.11 The Task dialogue for a print of the numeric window
4. The Print window is displayed. Here it is possible to change the
print settings. (see figure 8.12).
_____________________________________________________________________________
BE6011-16
1314 Photoacoustic Multi-gas Monitor
LumaSense Technologies A/S
1412 Photoacoustic Field Gas-Monitor
Page 140 of 280
Chapter 8
______________________________________________________________________
Fig.8.12 The Print dialogue window for print settings.
5. Select OK to make the actual print-out of the selected window.
Fig.8.13 Print of the numeric window
_____________________________________________________________________________
BE6011-16
1314 Photoacoustic Multi-gas Monitor
LumaSense Technologies A/S
1412 Photoacoustic Field Gas-Monitor
Page 141 of 280
Chapter 8
______________________________________________________________________
Fig.8.14
Print of the graphic window.
And the statistical data for either the graphic or the numeric window
can be printed out using two cursors (see section 8.4.2)
Fig.8.15
8.9.2
Print of the cursor value window when using two cursors.
Print Monitor Measurement data.
Using the on-line program it is possible to print out the results from
the last measurement task including the Monitor settings for this
measurement task.
Note : This print-out must be made just after the measurement task
is stopped (before starting a new measurement task)
In the on-line program.
_____________________________________________________________________________
BE6011-16
1314 Photoacoustic Multi-gas Monitor
LumaSense Technologies A/S
1412 Photoacoustic Field Gas-Monitor
Page 142 of 280
Chapter 8
______________________________________________________________________
1. Pull down the Task menu bar.
2. Select Print Monitor Measurement Data (see figure 8.16)
Fig.8.16 The Task dialogue window for printing Monitor
Measurement Data.
3. The Print dialogue window is displayed.
4. Select OK to print the Monitor measurement data with the actual
settings.
_____________________________________________________________________________
BE6011-16
1314 Photoacoustic Multi-gas Monitor
LumaSense Technologies A/S
1412 Photoacoustic Field Gas-Monitor
Page 143 of 280
Chapter 8
______________________________________________________________________
8.9.3
Printing the current calibration data from the
monitor.
Whether the 1412/1314 is to be used online or as a stand-alone
instrument, the Gas Monitoring Software 7304 can be used to check
the Monitors existing calibration. All the calibration factors can be
printed out directly from the Gas Monitoring Software 7304 using the
Print Current Calibration option.
With the PC connected to the monitor and the Calibration program
running:
1. Pull down the Task menu bar. Click on new and the New Calibration
Task dialogue appears (see figure 8.17).
Fig.8.17 The Calibration Task menubar.
2. Type in the desired calibration task name and click on OK. An
extended menubar and a graphic window appears (see figure 8.18).
Fig.8.18 The New Calibration menubar.
_____________________________________________________________________________
BE6011-16
1314 Photoacoustic Multi-gas Monitor
LumaSense Technologies A/S
1412 Photoacoustic Field Gas-Monitor
Page 144 of 280
Chapter 8
______________________________________________________________________
3. Pull down the Task menu and select Print Current Calibration.
Fig.8.19 The Task dialogue window for printing Current Calibration.
4. Now a time-glass appears on the PC-screen, while the calibration
data is fetched from the Monitor.
Note this is a time consuming operation.
5. After having fetched the calibration data from the monitor a Print
window is displayed. It is then possible to change the print settings.
6.
Select OK to make a print-out of the actual calibration
data stored in the Monitor.
_____________________________________________________________________________
BE6011-16
1314 Photoacoustic Multi-gas Monitor
LumaSense Technologies A/S
1412 Photoacoustic Field Gas-Monitor
Page 145 of 280
Chapter 9
______________________________________________________________________
Chapter 9
Viewing Measurement Data – Using the
Monitor
July 2009
_____________________________________________________________________________
BE6011-16
1314 Photoacoustic Multi-gas Monitor
LumaSense Technologies A/S
1412 Photoacoustic Field Gas-Monitor
Page 146 of 280
Chapter 9
______________________________________________________________________
9.1 Displayed Monitoring Task Data
When the Monitor is switched on, but not being operated in any
mode, the screen display text identifies the data stored in its Display
Memory, by displaying the day and time of the first stored
measurement cycle of the monitoring task, as well as the day and
time of the last measurement cycle of the monitoring task. For
example:
DATA IN DISPLAY MEMORY RECORDED FROM
2004-01-16 09:50 TO 2004-01-16 10:04
If the Monitor has just been fully reset then the display will just
show the current time and report that the monitor is ready for use.
The Set-up parameters describing a monitoring task and the
measurement data collected during the task are stored as a list in
the Display Memory. You can scroll through the set-up parameters as
well as the data collected during the task by using the direction
push-buttons, T to scroll “vertically” downwards, and S to scroll
“vertically” upwards through the list. Fig.9.1 illustrates how the data
is organised:
Identification of Measurements:
This screen provides the date and time of the first and last
measurement results, which are stored in Display Memory.
Identification of Each Monitored Gas:
This display identifies the gases monitored during the task. By using
the X push-button, one can find the names of all the gases, which
were monitored during the displayed task.
Statistical Analysis of Measurement Results for Each Gas:
Using the individual measured gas concentration stored in Display
Memory, when Store Measurement History is selected, a statistical
analysis is performed which provides a summary of the stored
measurement results. The MAX (maximum), MIN (minimum) gas
concentrations are displayed, and the µ (Mean or Linear Average)
and σ (Standard Deviation) values are calculated and displayed. A
description of these statistical terms can be found in section 9.2.1.
During the performance of a monitoring task the statistical analysis is
updated constantly.
List of Individual Measurement Results:
Each of these displays provide the date and time each measurement
cycle was performed and the concentration of the gas whose name
appears on the screen. In some cases an asterisk (*) will be shown
_____________________________________________________________________________
BE6011-16
1314 Photoacoustic Multi-gas Monitor
LumaSense Technologies A/S
1412 Photoacoustic Field Gas-Monitor
Page 147 of 280
Chapter 9
______________________________________________________________________
alongside the gas/vapour concentration. When such an asterisk is
shown, press the INFO button. Text will appear on the screen to
indicate why this particular measurement has been marked.
The number which is shown on the display – between time and
concentration – is only “filled-in” after completion of a monitoring
task. The number indicates the order in which the measurements
were made. The “oldest” stored measurement is always given the
number 1 and the following measurements are numbered sequentially.
Overview of the Monitoring Task:
These displays provide an overview of the monitoring task set-up
parameters.
Start of the Monitoring Task:
The Display Memory has a finite size and therefore, if a monitoring
task runs for a long period of time, it will fill up all available memory
space, and data collected after the memory has been filled-up will
start to overwrite the data collected during the start of the
monitoring task. Some measurement results will therefore be lost
from the memory. In such a situation the date and time appearing
after MONITORING TASK STARTED….. will not be the same as the
first date and time displayed on the screen labelled 1 in Fig.9.1.
Using the direction push-buttons and the average push-button (only
valid for 1412), users can scroll through each “page” of stored data
and, in addition, average gas concentrations over a pre-defined
averaging period. The functions of the push-buttons are described
fully in Chapter 5 and can be summarized as follows (only valid for
type 1412):
AVERAGE
When this push-button is pressed the 1412 will
average the measurement results which are stored
in its Display Memory over the period of time
Averaging Period specified in the FORMAT
branch of the Set-up “tree” (see section 7.2).
When the averaging function is operative (the LED
above the push-button is lit) only averaged
measurement results are shown on the 1412’s
display. These averaged measurements may also
be printed out while the averaging function is
operative. It is important to realise that when the
averaging function is switched off the original
measurement results will be shown again on the
display. An example of averaged measurements is
given in section 7.2.
_____________________________________________________________________________
BE6011-16
1314 Photoacoustic Multi-gas Monitor
LumaSense Technologies A/S
1412 Photoacoustic Field Gas-Monitor
Page 148 of 280
Chapter 9
______________________________________________________________________
Fig.9.1 Organisation of monitoring-task data displayed on the
monitor’s screen.
_____________________________________________________________________________
BE6011-16
1314 Photoacoustic Multi-gas Monitor
LumaSense Technologies A/S
1412 Photoacoustic Field Gas-Monitor
Page 149 of 280
Chapter 9
______________________________________________________________________
X &W
Using these push-buttons users can scroll “horizontally”
through any vertical level of data. For example, if the statistical
analysis of the measurement results for water-vapour are displayed
on the screen, then by using X you can read the statistical analysis
of the measurement results for gas A, B, C etc. and then go back to
the original display (see Fig.9.1).
EVENT
T
S
(only valid for 1412)
This push-button can be
used (pressed) to mark the measurement being
performed at the time at which a special event
occurred during a monitoring task. Any such
measurement will appear on the display with an
asterisk alongside it. By pressing INFO when such
a display is seen you can display what the asterisk
indicates. Section 9.2.2 shows the display which
appears when INFO is pressed and explains all the
symbols used. Marked events are also shown on
print-outs and of monitoring task data (see section
9.2.3).
This push-button allows the user to scroll
“vertically” downwards through the list of
measurement results (see Fig.9.1).
This push-button allows the user to scroll
“vertically”
upwards
through
the
list
of
measurement results. The measurement list is a
closed loop.
The push-buttons S and T have a repetitive function, which means
that if they are pressed continuously they will allow the user to scroll
very quickly through a list.
9.1.1
Processing Measurement Data
Gas measurement data stored in Display Memory can be processed
in the following way:
•
It can be processed to produce Time-weighted Average (TWA)
concentrations of gases over any user-defined period of time.
9.1.2
Obtaining Time-weighted Average (TWA) Values (
1412 Only)
By
using
the
AVERAGE
button
Time-weighted
Average
concentrations (CTWA) of all the monitored gases can be obtained
over any user-defined period of time (T hours). The following steps
are involved:
_____________________________________________________________________________
BE6011-16
1314 Photoacoustic Multi-gas Monitor
LumaSense Technologies A/S
1412 Photoacoustic Field Gas-Monitor
Page 150 of 280
Chapter 9
______________________________________________________________________
1. Press SET-UP and S2.
2. “Enter” the period of time required for averaging – this could for
example be 8 hours if you are interested in finding out whether
the 8 hour Time Weighted Average concentration of gases are in
compliance with National Occupational Exposure Limits; or,
alternatively, the averaging period could be 15 minute TimeWeighted Average if you are interested in finding out whether the
Short Term Exposure Limit (STEL) of the gases complies with
National Occupational Exposure Limits.
3. Press SET-UP and then AVERAGE.
When steps 1 to 3 are complete, scroll through the measurement
results displayed on the screen (Display Memory). Notice that all
measurements have been averaged over the chosen averaging
period. A detailed example is given in section 7.2.
9.1.3
How Time-weighted Averages are Calculated
In order to explain how the 1412 averages gas measurements over a
fixed user-defined “averaging period”, let us suppose that a
particular gas has been monitored continuously and that its
measured concentration was C1 during the first sampling interval T1
min, C2 during the second sampling interval T2 min…. Cn during the
nth sampling interval Tn min (see Fig.9.2). Suppose that you wished
the 1412 to calculate the Time-weighted average (TWA) over a
period of time = T min.
Fig.9.2 Illustration of a monitoring task
_____________________________________________________________________________
BE6011-16
1314 Photoacoustic Multi-gas Monitor
LumaSense Technologies A/S
1412 Photoacoustic Field Gas-Monitor
Page 151 of 280
Chapter 9
______________________________________________________________________
The Time-weighted average of these measurements over the
averaging period of T min is calculated using the following
mathematical equation:
n= N
CTWA =
∑ (C )
n
= linear average of all the measurements made during
N
the averaging period.
n =1
Where:
Cn = constant concentration measured at time Tn;
N = the total number of measurements performed during
the averaging period T min.
In the situation where the total monitoring period is the same as the
averaging period then the averaged value of the last performed
measurement will be the same as the Mean Value (µ) shown on the
display screen (see 3 in Fig.9.1).
9.2 Printed Monitoring Task Data
Fig.9.1 illustrates how data from a monitoring task is displayed on
the Monitor’s screen. When monitoring task data appearing in Display
Memory is printed out, the same information appears but it is
presented in a different format. An example of a monitoring task
data print-out is shown in Fig.9.3 – Chapter 12 describes how this is
done.
_____________________________________________________________________________
BE6011-16
1314 Photoacoustic Multi-gas Monitor
LumaSense Technologies A/S
1412 Photoacoustic Field Gas-Monitor
Page 152 of 280
Chapter 9
______________________________________________________________________
Fig.9.3 Print-out of monitoring task data
9.2.1
Statistical Analysis Terms
In the statistical analysis of the measurement results for each gas
(see 3 in Fig.9.1) the following statistics appear:
The Mean Value (µ) – this is the linear average of all
measurements of a gas taken during the total monitoring period.
The calculation of “the mean value” can be expressed
mathematically as follows:
n= N
The Mean Value = μ =
Where: N
cn
=
∑ (C )
n
n =1
N
=
measurement cycles performed during the
monitoring period (T) between the cursors.
gas concentrations (where n = 1 to N)
_____________________________________________________________________________
BE6011-16
1314 Photoacoustic Multi-gas Monitor
LumaSense Technologies A/S
1412 Photoacoustic Field Gas-Monitor
Page 153 of 280
Chapter 9
______________________________________________________________________
The Standard Deviation (σ) – this is the standard deviation of a
particular gas’s measurements from the mean value (µ) of this
gas. Standard deviation can be expressed mathematically as
follows:
n= N
The Standard Deviation = σ =
Where: µ =
Cn
=
N
=
9.2.2
∑ (Cn − μ )
2
n =1
N −1
the mean value
individual gas concentrations
total number of measurements
Symbols used in Displayed Measurement Data
If an asterisk (*) appears on the display alongside any gas
concentration, it indicates that something happened during the
measurement. You can find out what the asterisk indicates by
pressing the INFO button. The following display appears for a short
period of time:
GAS X: COMMON MARK: PEOW
EVENT NO: xxxx
GAS MARK: BFA
TIME: hh:mm
“EVENT NO” will appear on the screen only if the Event Mark button
(only 1412) was used during the monitoring task. In this case the
letter “E” will also appear as a Common Mark. The symbols which can
appear after the text COMMON MARK and GAS MARK are listed
below with a short explanation of what they mean:
Common Marks:
“P”
(1) The Monitor stopped measuring due to a power
failure but has automatically re-started the
monitoring task again after regaining power;
(2) The Monitor has been “reset” either because of
a detected fault or because RESET was pressed.
“E”
The measurement has been marked by the User,
(only 1412).
“O”
This symbol indicates that an operational error was
detected during this measurement. The accuracy of
such a measurement cannot always be guaranteed.
_____________________________________________________________________________
BE6011-16
1314 Photoacoustic Multi-gas Monitor
LumaSense Technologies A/S
1412 Photoacoustic Field Gas-Monitor
Page 154 of 280
Chapter 9
______________________________________________________________________
“W”
This symbol indicates that a warning was detected
during this measurement. The accuracy of such a
measurement cannot always be guaranteed.
Gas Marks:
9.2.3
“B”
The Monitor was incapable of calculating this gas
concentration.
“F”
After this measurement the filter carousel was
found to be out of alignment. If the carousel was
only slightly out of alignment then the accuracy of
the measurement has not been affected. The accuracy of such a measurement cannot always be
guaranteed.
“A”
The gas concentration measured during this
measurement cycle was found to exceed the userdefined alarm limit for this gas.
Symbols Used in Print-outs of Measurement Data
Displayed measurements marked with the COMMON MARKS “O”
and “W”, and the GAS MARKS “A” and ”F”, are printed-out with an
“X” symbol. However, any displayed measurements marked with the
COMMON MARKS “P” and/or “E”, and the GAS MARK “B” are not
printed-out with these symbols. These measurements are marked in
a different way:.
Common Marks:
The symbol “P” is replaced by the text “1314/1412 Restarted”.
This indicates that the Monitor stopped and then started-up again
sometime between the previous sample time and the time which
appears alongside this message.
(Only 1412): The symbol “E” is replaced by the text User Event
NumberX: This indicates that the EVENT button was pressed while
this measurement cycle was being performed. The number indicates
the total number of “events” which have been marked during this
monitoring task, at the time this sample was taken.
Gas Marks:
The symbol “B” is replaced by a straight line (_______) which
indicates that the Monitor was unable to calculate the concentration
of the named gas in this sample.
_____________________________________________________________________________
BE6011-16
1314 Photoacoustic Multi-gas Monitor
LumaSense Technologies A/S
1412 Photoacoustic Field Gas-Monitor
Page 155 of 280
Chapter 9
______________________________________________________________________
Other Marks Used:
……This symbol indicates either: (1) that this gas was not measured;
or (2) that this gas was not selected to be printed out (see section
12.5).
9.3 Storage Space in the Display Memory
Table 9.1 illustrates the space, which is required to store individual
measurement results. If 5 gases and water vapour are being
measured, then 37 bytes of space are required to store
measurement results from one measurement cycle, whereas only 24
bytes of space are required if 3 gases (for example, gas A, E and
water vapour (W)) are measured. If only one gas (for example, gas
A) is being measured, then only 15 bytes of space are required to
store measurement results form one measurement cycle.
The total space available in Display Memory to store data is 64 000
bytes. If only one gas (for example, gas A) and water vapour is
measured, then data from up to
6400
measurement cycles can be stored in Display Memory,
= 3368
19
whereas if 5 gases and water vapour were measured, data from up
to only 64000 = 1730 measurement cycles can be stored in Display
37
Memory.
The time required to perform a measurement cycle is dependent
upon the number of gases/water vapour being measured.
If we take the examples given above we can work out approximately
how long the data from a monitoring task can be stored in Display
Memory:
_____________________________________________________________________________
BE6011-16
1314 Photoacoustic Multi-gas Monitor
LumaSense Technologies A/S
1412 Photoacoustic Field Gas-Monitor
Page 156 of 280
Chapter 9
______________________________________________________________________
Table 9.1 Space occupied by results from one measurement cycle
when a different number of gases is monitored
Data
being
stored
Measurement
times
Event numbers
Common flags
CRC sum
Flags for gas 1 &
gas 2
Atmospheric
pressure
Results for gas 1
Results for gas 2
Flags for gases 3
&4
Results for gas 3
Results for gas 4
Flags for gases 5
&6
Results for gas 5
Results for gas 6
Byte
s
4
2
1
1
1
2
15 bytes
4
19 bytes
24 bytes
4
1
4
4
1
4
28 bytes
33 bytes
37 bytes
4
If a measurement cycle in which gas A and water vapour are
measured takes 15s, and if sampling is continuous this means that 3
368 cycles will take 3 368 x 15 = 50 520s = 14 hours. If, however
this measurement cycle is only performed every 10 mins then data
can be stored for 3 368 x 10 = 33 680 mins = 23 days.
If a measurement cycle where 5 gases and water vapour are
measured takes 60 s, and if sampling is continuous this means that 1
730 cycles will take 1 730 x 60 = 103 800 s = 28.8 hours. If,
however this measurement cycle is only performed every 10 mins,
then data can be stored for 1 730 x 10 = 17 300 mins = 12 days.
For further information regarding measurement cycles see chapter 4.
The maximum time you can set a monitoring period to be is 7 days.
If you try to enter a greater number of days, the Monitor will
automatically change the period to 7 days. However, if you do not
set a pre-defined monitoring period, the Monitor will just store as
much data as possible before starting to overwrite the “oldest” stored
measurement results.
_____________________________________________________________________________
BE6011-16
1314 Photoacoustic Multi-gas Monitor
LumaSense Technologies A/S
1412 Photoacoustic Field Gas-Monitor
Page 157 of 280
Chapter 10
______________________________________________________________________
Chapter 10
Database Administration for PC Use
July 2009
_____________________________________________________________________________
BE6011-16
1314 Photoacoustic Multi-gas Monitor
LumaSense Technologies A/S
1412 Photoacoustic Field Gas-Monitor
Page 158 of 280
Chapter 10
______________________________________________________________________
10.1
Introduction
The Database Administration program enables you to backup, restore
and delete the databases you have stored on your hard disc. This
chapter also explains how to export data. This is achieved using the
Presentation program.
Note: database files cannot be copied or moved using Windows
Explorer. In order to copy and move files that will continue to work
with the Gas Monitoring Software 7304, follow the instructions below.
10.2
Backup Databases
This option enables you to make a backup copy of your existing
databases. There are three types of files that can be backed up here:
Measurement Tasks; Calibration Tasks; and Filter Information.
With the Database Administration program running:
1. Click on Backup and the dialogue shown in Fig.10.1 is displayed
Fig.10.1 The Backup dialogue
2. Click on the radio-button to select the type of data to be backed
up.
3. Select the correct name from the list displayed and click on OK.
4. Now define the destination where the backup should be stored
and click on OK.
_____________________________________________________________________________
BE6011-16
1314 Photoacoustic Multi-gas Monitor
LumaSense Technologies A/S
1412 Photoacoustic Field Gas-Monitor
Page 159 of 280
Chapter 10
______________________________________________________________________
A copy of the selected database is now made. If you want to use this
database again, use the Restore option.
10.3
Restore Databases
This option enables you to restore backup copies of databases, so
that they may be used again in the Gas Monitoring Software 7304.
All backup files, made using the Backup option, can be restored.
Restored databases can be restored as “read-only” files. This
prevents you from adding additional measurement data to the
database, or corrupting the existing data. This is of particular use
when restoring Calibration databases that must not be changed.
With the Database Administration program running:
1. Click on Restore and the dialogue shown in Fig.10.2 is displayed.
Fig.10.2 The Select Backup files dialogue
2. Use the standard Windows browser procedures to select the
databases to be restored.
3. If you want to restore the database(s) as a read-only file(s), click
in the Open as read-only check box.
4. Click on Open. The selected files are restored to the Gas
Monitoring Software 7304 working directory.
_____________________________________________________________________________
BE6011-16
1314 Photoacoustic Multi-gas Monitor
LumaSense Technologies A/S
1412 Photoacoustic Field Gas-Monitor
Page 160 of 280
Chapter 10
______________________________________________________________________
Click on Cancel to exit the Restore dialogue when all the desired
databases have been restored.
10.4
Delete Databases
This option enables you to delete measurement and calibration
databases from the Software working directory without disturbing the
filter information.
Note: using Explorer to delete files may result in information in
remaining databases being damaged or deleted by mistake.
With the Database Administration program running:
1. Click on Delete and the dialogue shown in Fig.10.3 is displayed:
Fig.10.3 The Delete dialogue
2. Click on the radio-button to select the type of data to be deleted.
3. Select the correct name from the list displayed and click on OK. A
warning appears, to confirm that you do want to delete the
selected database.
4. Confirm the deletion by clicking on Yes.
Click on Close to exit the Delete dialogue.
_____________________________________________________________________________
BE6011-16
1314 Photoacoustic Multi-gas Monitor
LumaSense Technologies A/S
1412 Photoacoustic Field Gas-Monitor
Page 161 of 280
Chapter 10
______________________________________________________________________
10.5
Export Databases
This option enables you to export existing databases as commadelimited ASCII files. The export function works from within the
Presentation program. The database to be exported must be open.
Note: only the data displayed, either in a numeric or graphic window
is exported.
With the desired data displayed, as described in section 8.8:
1. Pull down the Task menu and click on Export.
2. Use the standard Windows browser, which appears on screen, to
define the destination for the exported data.
3. Type in the desired file name. All files have a .TXT extension.
4. Click on Save.
_____________________________________________________________________________
BE6011-16
1314 Photoacoustic Multi-gas Monitor
LumaSense Technologies A/S
1412 Photoacoustic Field Gas-Monitor
Page 162 of 280
Chapter 11
______________________________________________________________________
Chapter 11
Storage of Data in the Monitor’s Memory
July 2009
_____________________________________________________________________________
BE6011-16
1314 Photoacoustic Multi-gas Monitor
LumaSense Technologies A/S
1412 Photoacoustic Field Gas-Monitor
Page 163 of 280
Chapter 11
______________________________________________________________________
In order to fully understand the functioning of the Monitor it is
necessary to know something about the different types of memory
the Monitor uses, the kind of data stored in each type of memory,
and how this data is affected by the various operations performed by
the Monitor.
Offline users may find the information in this chapter of interest as
their measurement data is stored in the Monitor’s memory before
being uploaded to the PC. However, any mention of selecting or
setting up active filters or filter banks in this chapter is not applicable as these are set-up or selected in the Offline Sequence
Settings dialogue.
11.1
Types of Memory in the Monitor
The Monitor has three types of memory:
1. A Read Only Memory (ROM);
2. An Electrically Erasable Programmable Read Only Memory
(EEPROM), which we have named the Source Memory;
3. A Random Access Memory (RAM) which we have named the
Working Memory.
11.1.1 Read Only Memory (ROM)
Data stored in this memory cannot be changed by the user. The
Optical Filter Factors, which describe each of the optical filters,
which are available for installation in the Monitor, are stored in this
memory. These factors are listed in a print-out of the “Calibration
Data Block” (see section 12.7).
When optical filters are installed in the carousel wheel, the Monitor
must be informed about:
•
•
Which filters have been installed in its carousel (UA numbers of
the filters);
and
Where they have been installed (position “A” – “E” of the
carousel – see section 14.3.3).
This information allows the Monitor to read the correct optical filter
factors from its ROM memory when the filter is installed. As these
factors are used in the calculation of calibration factors, it is vitally
important that this information is correctly entered before
calibration is performed.
_____________________________________________________________________________
BE6011-16
1314 Photoacoustic Multi-gas Monitor
LumaSense Technologies A/S
1412 Photoacoustic Field Gas-Monitor
Page 164 of 280
Chapter 11
______________________________________________________________________
11.1.2
Source Memory (EEPROM)
The data stored in Source Memory is not lost if A.C. mains power is
removed from the Monitor. There are three blocks of data in the
Source Memory (see Fig.11.1):
Block 1 – contains
calibration
factors
and
3
optical-filter
parameters
Block 2 – contains 3 of the 6 set-up parameters found under the
Filters branch of the set-up “tree”
Block 3 – contains all other parameters in the Set-Up Tree
Block 1 – Calibration Factors and 3 Optical-filter Parameters:
There are six different “data files” in this block. Each data file is
denoted by a letter, which indicates the position a particular optical
filter occupies in the Monitor’s carousel. Each file “A” to “E” is divided
into five sections called Filter Banks, which are numbered from 1 to
5. The water-vapour filter is only capable of measuring water-vapour
and therefore its data file (“W”) is not divided into different filter
banks.
Each Filter Bank contains the following data:
1. The name of the gas used during span calibration of the filter.
2. The molecular weight of the gas used during span calibration.
3. The alarm limits for the gas. (High Alarm Limit 1, High Alarm Limit
2).
4. A Concentration offset factor:
calibration of the filter.
obtained during zero-point
5. A Humidity gain factor:
obtained
interference calibration of the filter.
during
an
humidity-
6. A Conversion factor: obtained during the span calibration of the
filter with the gas named in point 1 above.
7. Cross-interference calibration factors: obtained during crossinterference calibration.
_____________________________________________________________________________
BE6011-16
1314 Photoacoustic Multi-gas Monitor
LumaSense Technologies A/S
1412 Photoacoustic Field Gas-Monitor
Page 165 of 280
Chapter 11
______________________________________________________________________
Fig.11.1
Schematic diagram showing the structure of the Monitor’s
memory
Before calibrating a particular filter, one of the filter’s banks is made
active (by operating the Monitor in Set-Up mode and “entering” the
chosen filter-bank number for the filter being calibrated). The filter
bank No. which is made active before the filter is calibrated, is the
filter bank where the Monitor will store calibration factors calculated
during calibration. This means that the user is able to calibrate any
particular optical filter to measure up to five different gases.
If a particular filter is to measure more than one gas, it is therefore
necessary to span calibrate it with each of the gases it is to
measure. For example, if you refer to the “Gas Detection Limits”
wall chart you will see that the filter UA 0976 can be used to measure the following three gases:
1. Sulphur hexafluoride
2. Acetic acid
3. Vinyl chloride
Suppose that filter UA 0976 is installed in position “A” of the filter
carousel to measure each of the above gases. Before this filter is
calibrated, the Monitor has to be told where to store the calibration
_____________________________________________________________________________
BE6011-16
1314 Photoacoustic Multi-gas Monitor
LumaSense Technologies A/S
1412 Photoacoustic Field Gas-Monitor
Page 166 of 280
Chapter 11
______________________________________________________________________
factors which are calculated during the calibration procedure. This is
done by selecting a FILTER BANK NO. – in the active set-up for
Filter A each time the filter is calibrated. For example, Filter Bank
No.”1” for storage of the calibration factors for sulphur hexafluoride,
Filter Bank No.”2” for acetic acid and Filter Bank No.”3” for vinyl
chloride.
After calibration of the filter UA 0976 the Monitor is able to
accurately monitor any of the three gases mentioned – but only one
of these gases during any particular monitoring task. By selecting the
correct FILTER BANK NO. in the set-up of the Monitor before a
monitoring task is started, the user determines which calibration
factors will be used during the task and therefore the kind of gas
monitored by filter A. For example, when Filter Bank No.”3” is
entered in the active set-up for filter UA 0976 in position ”A”, the
Monitor reads the calibration factors from file “A3” into its Working
Memory so that the concentration of vinyl chloride can be calculated
during the monitoring task.
Block 2 – Optical Filter Set-up Parameters:
This block contains 3 of the 6 parameters, which describe the optical
filter installed in each position of the filter carousel:
UA number of the filter;
Filter bank number;
S.I.T. information;
If any of the above-listed parameters are changed in the active setup they are also automatically changed in the Source Memory.
Block 3 – Other Set-Up Parameters:
This block of data contains all set-up parameters except the optical
filter parameters. Before leaving the factory the parameters in this
block are given factory-set values. These are the values obtained for
a parameter when the Default button is pressed.
11.1.3
Working Memory (RAM)
The Working Memory is a “volatile” memory, that is, data will be
lost from it if electric power is removed from the Monitor. When the
Monitor is not connected to a mains power supply a lithium battery in
the Monitor provides a back-up power supply to protect the data in
this memory. When this battery is no longer providing enough power
a warning BACK-UP BATTERY TOO LOW will appear on the
Monitor’s display to indicate that the battery needs to be replaced by
a new one.
_____________________________________________________________________________
BE6011-16
1314 Photoacoustic Multi-gas Monitor
LumaSense Technologies A/S
1412 Photoacoustic Field Gas-Monitor
Page 167 of 280
Chapter 11
______________________________________________________________________
There are four different blocks of data in the Working Memory (see
Fig. 11.1):
Block 1 – contains only calibration factors and 3 optical-filter
parameters from each of the active “Filter Banks”.
Block 2 – contains 2 of the 5 optical filter parameters with values
which are the same as those found in Block 2 of the
Source Memory.
Block 3 – contains all other set-up parameters (i.e. excluding the
optical filter parameters) with active set-up values.
Block 4 – this block contains measurement data, which was copied
into it from the Display Memory. This block is called
Background Memory because the data stored in it cannot
be accidentally deleted.
Block 5 – contains data collected during the performance of a
monitoring task. This data block is named the Display
Memory because this data is displayed on the Monitor’s
screen while a monitoring task is being performed.
Block 1 – Calibration Factors and 3 Optical-filter Parameters
from Each Active Filter Bank:
If, for example, 5 optical filters are installed in the Monitor and their
UA numbers have been entered in the active set-up and Filter Bank
No. 2 has been selected for filter “A”; no. 4 for filter “B”; no. 3 for
filter “C”; no. 1 for filter “D” and no. 1 for filter “E”, then only
calibration factors from filter banks A 2, B4, C3, D1, E1 and W will be
stored in this block of data (see Fig. 11.1). The name, molecular
weight and alarm limits of each gas will also be stored in this block.
Block 2 – Optical Filter Set-up Parameters:
Whenever either an optical filter’s UA number or its active Filter
Bank Number is changed, the same values are automatically read
into Block 2 of the Source Memory.
Block 3 – Other Set-up Parameters:
The active set-up values are those values, which are underlined by a
cursor on the display screen of the Monitor when it is operated in
Set-Up mode.
Block 4 – Measurement Data:
Whenever the Monitor performs any operation, which results in data
occupying the Display Memory, the data already stored there will be
deleted. To reduce the risk of accidental losing data from Display
_____________________________________________________________________________
BE6011-16
1314 Photoacoustic Multi-gas Monitor
LumaSense Technologies A/S
1412 Photoacoustic Field Gas-Monitor
Page 168 of 280
Chapter 11
______________________________________________________________________
Memory, a warning "WARNING: DISPLAY MEMORY WILL BE
DELETED” is displayed whenever a user attempts to perform an
operation with the Monitor, which will result in the deletion of data
from Display Memory.
Data in Display Memory can be copied into the Monitor’s Background
Memory (see Block 5 below) to protect it against accidental deletion.
Alternatively, the data in Display Memory can be printed out by
connecting a printer to the Monitor and transmitting data via either
the IEEE 488 or the RS 232 interface port of the Monitor (see
Chapter 12).
The storage space in Display Memory is finite. Once this memory has
been filled by data from a monitoring task any additional data
collected will start to overwrite some of the data already stored there
(see section 7.2.2 for details)
Block 5 – Stored Measurement Data:
By selecting to STORE data when the Monitor is operating in
Memory mode the user can copy data from Display Memory into
Background Memory to “protect” data against accidental deletion
from the Display Memory (see section 11.3.1 for further details).
The storage space in Background Memory is finite and is exactly the
same size as the storage space available in Display Memory (see
section 9.3 for further details).
Data which has been stored in Background Memory can be recalled
to the Display Memory. This is done by operating the Monitor in
Memory mode and selecting to RECALL data (see section 11.3.2).
When data is “recalled” to Display Memory it is not transferred from
Background Memory to Display Memory, it is only copied into
Display Memory so there is no risk of losing it. In Display Memory the
user can scroll through the data.
Data stored in Background Memory can be deleted by operating the
Monitor in Memory mode and selecting to DELETE data (see section
11.3.3).
11.1.4
Effect of a Calibration Task on the Monitor’s Memory
Before calibration of the optical filters in the Monitor the UA numbers
of each of the installed filters is “entered” into the active set-up of
the Monitor. This enables the Monitor to find a set of numerical
parameters, which describe each numbered optical filter (this
information is found in the Read Only Memory of the Monitor). These
numerical parameters are called Optical Filter Factors.
_____________________________________________________________________________
BE6011-16
1314 Photoacoustic Multi-gas Monitor
LumaSense Technologies A/S
1412 Photoacoustic Field Gas-Monitor
Page 169 of 280
Chapter 11
______________________________________________________________________
During a CALIBRATION TASK the Monitor uses these Optical Filter
Factors to calculate the calibration factors for each installed optical
filter. As explained in section 11.1.2, by “entering” a Filter Bank No.
in the active set-up before calibration of any particular filter with
any particular gas, each filter can be calibrated to measure up to five
different gases and the filter bank number tells the Monitor exactly
where (in the Source Memory) to store the calibration factors
calculated during the calibration task.
Fig.11.2 The state of the Source Memory after completion of a
CALIBRATION TASK
After completion of a calibration task the calibration factors, which
are found in the Working Memory, are entirely dependent upon the
Filter Bank No., which is active for each optical filter. If Filter Bank
No. 1 is active for filters in positions “A” to “D” and Filter Bank No. 2
is active for the filter in position “E” then calibration factors from
files A 1, B 1, C 1, D 1, E 2 and W will be found in Working Memory
(see Fig 11.2).
_____________________________________________________________________________
BE6011-16
1314 Photoacoustic Multi-gas Monitor
LumaSense Technologies A/S
1412 Photoacoustic Field Gas-Monitor
Page 170 of 280
Chapter 11
______________________________________________________________________
11.1.5
Set-up
Effect of Changing the UA number in the “Active”
WARNING!: Changing the UA number of a filter in the Monitor’s
active set-up will destroy all calibration data for the filter.
As explained in section 11.1.1, the UA No. determines the set of
Optical Filter Factors used during the calculation of calibration factors
and therefore, if the UA number of any filter is changed in the active
set-up of the Monitor, all calibration data related to the optical filter
whose number has been removed from the set-up is automatically
deleted from both the Source Memory and the Working Memory
as it is no longer valid.
Fig.11.3
Effect of changing a UA number in the “active” set-up
For example, if the UA number of the filter installed in position “A” of
the filter carousel is changed in the active set-up then calibration
factors are deleted from the active file “A” in the Working Memory
and from files A 1, A 2, A 3, A 4 and A 5 in the Source Memory of
the monitor (see Fig.11.3). The Monitor will not be able to measure
any gas with filter “A” until it has been fully calibrated, see Chapter
14 for details.
_____________________________________________________________________________
BE6011-16
1314 Photoacoustic Multi-gas Monitor
LumaSense Technologies A/S
1412 Photoacoustic Field Gas-Monitor
Page 171 of 280
Chapter 11
______________________________________________________________________
11.1.6
Effect of a Full Reset on the Monitor’s Memory
A FULL RESET of the Monitor changes the data stored in its
Working Memory as follows:
1. All data stored in Display Memory and Background Memory is
deleted.
2. Values of the Optical Filter Set-up Parameters in Block 2 of The
Source Memory are copied into Block 2 of the Working Memory.
3. The active values of the other set-up parameters in Block 3 of the
Working Memory are replaced by the factory-set values defined
in Block 3 of the Source Memory.
4. The active values of the Optical Filter Parameters in Block 2 of
the Working Memory are replaced by the values of the optical
filter parameters in Block 2 of the Source Memory. Note that
under normal circumstances the data in these blocks is the same.
However, to ensure that the data in these blocks is the same,
data is read from Source memory into the Working Memory
during a FULL RESET of the Monitor.
5. Those Filter Bank Nos. which have been made active determine
the calibration factors which will be found in Block 1 of Working
Memory after a FULL RESET of the Monitor. If, for example the
active Filter Bank No. chosen for all the filters “A” to “E” is no. 1,
then only the calibration data in files A 1; B 1; C 1; D 1; E 1; and
W will be found in the Monitor’s Working Memory after a FULL
RESET. This example is illustrated in Fig.11.4.
_____________________________________________________________________________
BE6011-16
1314 Photoacoustic Multi-gas Monitor
LumaSense Technologies A/S
1412 Photoacoustic Field Gas-Monitor
Page 172 of 280
Chapter 11
______________________________________________________________________
Fig.11.4
11.2
The state of the Working Memory after a FULL RESET
Storage of Measurement Results
While a monitoring task is being performed measurement data is
stored in the Monitor’s Display Memory. When the monitoring task is
complete the data in Display Memory is normally copied into the
Monitor’s Background Memory to prevent it from being overwritten
(and therefore lost) by measurement data stored during the next
monitoring task. The same amount of data can be stored in both the
Background Memory and the Display Memory.
Structure of the Background Memory:
The data from a maximum of 10 monitoring tasks can be stored in
the Background Memory provided the total amount of data from the
10 tasks does not exceed the total capacity of the Background
Memory. Each monitoring task stored in the Background Memory is
given a “location number” (from no. 1 to no. 10). The size of each
location is flexible and is equal to the space required to store all the
data collected during a monitoring task.
If data from a single monitoring task totally occupies the Display
Memory, then this data can be stored in Background Memory
_____________________________________________________________________________
BE6011-16
1314 Photoacoustic Multi-gas Monitor
LumaSense Technologies A/S
1412 Photoacoustic Field Gas-Monitor
Page 173 of 280
Chapter 11
______________________________________________________________________
provided that no data is already stored there. The data will occupy
only one location of Background Memory and fill all available storage
space. Therefore, it will not be possible to store any data from any
new monitoring task in Background Memory unless the data already
stored there is first deleted (see section 11.3.3).
To illustrate the variable size of each location let us suppose that the
following monitoring tasks are performed:
Task No. 1:
The data collected in Display Memory occupies
20% of the total capacity of the Display Memory. The
data can be stored in Background Memory provided that
the data already stored there occupies less than 80% of
the total capacity of the Background Memory. However,
let us suppose that the Background Memory is empty
and that we STORE the data from this monitoring task in
location 1 of Background Memory. This means that
Background Memory is now 20% full (see Fig.11.5).
Task No. 2:
The collected data occupies 30% of the total
capacity of the Display Memory. Let us suppose that we
STORE the data in location 2 of Background Memory.
This means that Background Memory is now 50% full
(see Fig.11.5).
Task No. 3:
The data occupies 40% of the total capacity of the
Display Memory. Let us suppose that we STORE the data
from this task in location 3 of Background Memory.
Background Memory is now 90% full (see Fig.11.5).
Task No. 4:
The data occupies 10% of the total capacity of the
Display Memory. Let us suppose that we STORE the data
from this task in the Background Memory – let us say it
is stored in location 4. Background Memory is now 100%
full (see Fig.11.5).
The Background Memory has now been filled-up by the data from the
four monitoring tasks described above, even though location nos. 5 –
10 (inclusive) have not been used. The user will not be able to
STORE any more data in Background Memory because there is no
space available for it. Data in Background Memory can, however, be
deleted to make space for the storage of new measurement results
(see section 11.3.3).
_____________________________________________________________________________
BE6011-16
1314 Photoacoustic Multi-gas Monitor
LumaSense Technologies A/S
1412 Photoacoustic Field Gas-Monitor
Page 174 of 280
Chapter 11
______________________________________________________________________
Fig.11.5 Storing data from 4 different consecutive measurement
tasks in the Background Memory.
Whenever the Monitor is operating in Memory mode the user can, by
pressing the INFO push-button, find out what percentage of the
Background Memory is occupied and which location numbers have
been used to store data. Fig.11.5 illustrates the status information
one can obtain from the Monitor during various stages of the four
monitoring tasks described above. Further information about the
INFO push-button can be found in section 11.3.4.
_____________________________________________________________________________
BE6011-16
1314 Photoacoustic Multi-gas Monitor
LumaSense Technologies A/S
1412 Photoacoustic Field Gas-Monitor
Page 175 of 280
Chapter 11
______________________________________________________________________
11.3
Management of Data in Background Memory
The monitor has to be operated in Memory mode by pressing the
MEMORY push-button. The following text appears on the screen:
SELECT MEMORY FUNCTION
STORE
11.3.1
RECALL
DELETE
Storing Data in Background Memory
When data is to be copied from Display Memory into Background
Memory:
Press S1
LOCATION NUMBER
1
PRESS ENTER TO CHANGE VALUE
If some data has already been stored in the Background Memory and
you cannot remember which locations have been occupied (used),
press the INFO push-button to find out which locations are occupied
and what percentage of the Background Memory has been used (see
section 11.3.4). Use the direction keys to select the desired location
number. When the chosen location number is on the screen, press
S2 to accept the position.
Press Memory to exit.
_____________________________________________________________________________
BE6011-16
1314 Photoacoustic Multi-gas Monitor
LumaSense Technologies A/S
1412 Photoacoustic Field Gas-Monitor
Page 176 of 280
Chapter 11
______________________________________________________________________
11.3.2
Recalling Data from Background Memory
To recall data stored in Background Memory to Display Memory:
1. Press Memory S2.
LOCATION NUMBER
1
PRESS ENTER TO CHANGE VALUE
2. Use the direction keys to select the correct location number. The
following text is displayed.
WARNING : DISPLAY MEMORY WILL BE DELETED
PROCEED
STOP
3. If you want to continue, press S1, and the following text is
displayed.
LOCATION NUMBER 1
ACCEPT
RECALLED
If you want to Stop, press S3, this returns you to the original
display showing SELECT MEMORY FUNCTION so that you can
STORE any data which is stored in Display Memory as explained
in section 11.3.1.
4. Press S2. If data has not been stored in the chosen location, a
message will appear on the Monitor’s display to inform the user.
Otherwise, the data from the chosen location in Background
Memory will be copied into Display Memory.
5. Press MEMORY to exit.
_____________________________________________________________________________
BE6011-16
1314 Photoacoustic Multi-gas Monitor
LumaSense Technologies A/S
1412 Photoacoustic Field Gas-Monitor
Page 177 of 280
Chapter 11
______________________________________________________________________
11.3.3
Deleting Data from Background Memory
To delete data which has been stored in Background Memory:
Press MEMORY S3.
LOCATION NUMBER 1
PRESS ENTER TO CHANGE VALUE
Use the direction keys to select the location number. After selecting
the chosen location number the display will show the starting-time of
the oldest data stored in the Background Memory:
If the starting-time of the oldest stored data to be deleted
corresponds with the starting-time shown on the display screen then
press S1 and then S2 to accept that the data will be deleted from
Background Memory.
11.3.4
Obtaining Information in Memory Mode
It is not necessary for the user to remember the numbers of the
locations in Background Memory which have been used to store data.
When the Monitor is operated in Memory mode, users can at any
time find out which locations are used, and what percentage of the
Background Memory’s total data capacity has been used by:
Pressing the INFO push-button:
LOCATION(S) USED : 1 - -3 –4 -5
-7 -9
53 % OF MEMORY USED
TIME 10 : 26
-10
The numbers appearing on the above display are those, which
contain stored data. The Monitor will show the above “Information
text” display for a short period of time and then automatically change
back to the text, which was showing on the display before the INFO
push-button was pressed.
_____________________________________________________________________________
BE6011-16
1314 Photoacoustic Multi-gas Monitor
LumaSense Technologies A/S
1412 Photoacoustic Field Gas-Monitor
Page 178 of 280
Chapter 12
______________________________________________________________________
Chapter 12
Using a Printer with the Monitor
July 2009
_____________________________________________________________________________
BE6011-16
1314 Photoacoustic Multi-gas Monitor
LumaSense Technologies A/S
1412 Photoacoustic Field Gas-Monitor
Page 179 of 280
Chapter 12
______________________________________________________________________
12.1
Introduction
This chapter informs you on how to obtain hard copies of data stored
in the memory of the monitor. This could, for example, be existing
calibration data, which you need prior to recalibrating.
Alternatively, for those of you who want to use the monitor as a
stand-alone instrument, this chapter enables you to print-out
measurement data, error-logs and data-logs. If any error occurs
during any of these operations, a warning will be displayed. All possible errors of this kind are listed in Chapter 17.
The Monitor has two interface ports on its back panel, an IEEE 488
and an RS-232. This means that any standard text printer with one
of these interfaces can be used to print-out data from the Monitor.
Data can be printed out while the Monitor is operating – using the
Data-logging facility. This means that during a monitoring task or
during a calibration task the Monitor will automatically send
measurement results to the printer as soon as they are available
(see section 12.5). Any operational errors or warnings that occur
during a monitoring task can also be automatically printed out using
the Error-logging facility. Alternatively, when the Monitor is not
being operated in any mode, data can be printed out using the
PRINT button. Data can be printed out in three different blocks:
1. Measurement: this block contains the measurement data
displayed on the Monitor screen during the printing operation – it
also provides the set-up parameters for the displayed monitoring
task (see section 9.2).
2. Set-Up: this block contains active set-up parameters.
3. Calibration: this block contains the optical filter factors,
calibration factors and all other information related to the
calibration of the optical filters installed in the Monitor.
Note: if you want to use the interface ports for data transfer other
than to a printer, or a PC equipped with the Gas Monitoring Software
7304, an Interface Manual, which explains the protocol messages in
details, is available.
12.2
Printer Cables
To connect the cables:
1. Ensure that both the Monitor and the printer are switched off at
the mains. Failure to do so may result in your equipment being
damaged.
_____________________________________________________________________________
BE6011-16
1314 Photoacoustic Multi-gas Monitor
LumaSense Technologies A/S
1412 Photoacoustic Field Gas-Monitor
Page 180 of 280
Chapter 12
______________________________________________________________________
2. Locate the desired port at the back of the monitor. The ports are
labelled “RS-232” and “IEEE”.
3. Push the cable connector on to the correct socket, and secure it
firmly using the securing screws.
4. Locate the input port on the printer.
5. Push the connector at the other end of the cable on to this socket,
and secure it firmly using the securing screws.
The instruments can be turned on at the mains now.
12.3
Setting-up Communication Parameters
WARNING!: You must perform a PARTIAL RESET of the Monitor
(press the RESET and S1 buttons) if the active value of any
parameter in this branch of the Set-Up Tree is changed. If the
Monitor is not partially reset, then, the Monitor will not up-date the
communication-parameter data which was used last time data was
transmitted via either of its interfaces. By performing a partial reset
you ensure that the Monitor has the parameters necessary to enable
it to transmit data to the attached printer.
Press SET-UP S3 S1 S3 and the following text is displayed:
SELECT COMMUNICATION SET-UP BRANCH ?
RS 232
IEEE 488
CONNECTIONS
If you are using the RS-232 interface, go to section 12.3.1. If you
are using the IEEE interface, go to section 12.3.2.
12.3.1
RS-232 Interface
A brief description of the communication parameters is given below.
A list of the parameters, together with the values available and their
factory default values are shown in Table 12.1.
The parameters in this branch decide how the Monitor communicates
via the RS232 interface.
SELECT BAUD RATE gives the rate at which data should be
transmitted from the Monitor via its RS-232 interface.
SELECT NUMBER OF STOP BITS gives the number of stop bits,
which should be used when data is transmitted from the Monitor to
other equipment.
_____________________________________________________________________________
BE6011-16
1314 Photoacoustic Multi-gas Monitor
LumaSense Technologies A/S
1412 Photoacoustic Field Gas-Monitor
Page 181 of 280
Chapter 12
______________________________________________________________________
SELECT NUMBER OF DATA BITS gives the number of data bits,
which should be used when data is transmitted between the Monitor
and other equipment.
SELECT PARITY CHECK The user chooses whether or not
transmitted data should be checked for transmission errors using the
parity checking system.
SELECT HARDWIRE MODE The user chooses which communication
line (wire) should be used to control data transmission between the
Monitor and other equipment.
SELECT HANDSHAKE TYPE The user chooses which type of
“handshake” should be used for transmission via the RS 232
interface.
Table 12.1 The available choices and the default values for each RS232 communication parameter
Display Text
SELECT BAUD RATE
SELECT NUMBER OF STOP BITS
SELECT NUMBER OF DATA BITS
SELECT PARITY CHECK
SELECT HARDWIRE MODE
SELECT HANDSHAKE TYPE
Acceptable
Values
300/600/1200/
2400/4800/960
0
1 BIT, 2 BITS
7 BITS, 8 BITS
NONE, EVEN,
ODD
Three-wire,
Switched-line,
Leased-line
None,
X-ON/X-OFF,
Hard-wired
Default
Value
9600
1 BIT
7 BITS
EVEN
Leased-line
Hard-wired
REMEMBER to partially reset your Monitor if any of the above
parameters are changed! See the WARNING at the beginning
of section 12.3.
From the top of the Communication branch of the Setup Tree
SELECT COMMUNICATION SET-UP BRANCH?
RS 232
IEEE 488
CONNECTIONS
1. Press S1.
2. Use the direction and select push-buttons to select the correct
values for the parameters.
_____________________________________________________________________________
BE6011-16
1314 Photoacoustic Multi-gas Monitor
LumaSense Technologies A/S
1412 Photoacoustic Field Gas-Monitor
Page 182 of 280
Chapter 12
______________________________________________________________________
If you are in doubt about any of the settings, refer to your printer
manual.
3. When you have been through all the parameters, the monitor
returns to the top of the Communication branch of the Set-Up
Tree.
4. Press S3 S1 and then SET-UP. This selects the RS-232 port as
the communication port for the printer.
5. Press RESET and S1 to partially reset your Monitor.
12.3.2
IEEE Interface
The parameters in this branch decide how the Monitor communicates
via the IEEE 488 interface bus.
Monitors 1412/1314’s ADDRESS 14 This enables the Monitor to
be addressed via the IEEE 488 interface. The range of acceptable
values and the factory default value of the Monitor’s address are
shown in Table 12.2.
Table 12.2
The range of acceptable values and the default value of
the Monitor’s address
Display Text
1314/1412 ADDRESS
Acceptable
Values
from 0 to 100
Default
Value
14
The other IEEE 488 communication parameter which need to be
selected in this branch of the Set-Up Tree is shown in Table 12.3
together with available choices and the factory default value.
Table 12.3
The range of acceptable values and the default value of
the IEEE 488 communication parameter
Display Text
IS 1314/1412 SYSTEM
CONTROLLER?
Acceptable
Values
NO, YES
Default
Value
YES
IS 1314/1412 SYSTEM CONTROLLER? The user chooses whether
or not the Monitor will be the system controller on the IEEE 488
interface bus.
REMEMBER to partially reset your Monitor if any of the above
parameters have been changed! See the WARNING at the
beginning of section 12.3.
_____________________________________________________________________________
BE6011-16
1314 Photoacoustic Multi-gas Monitor
LumaSense Technologies A/S
1412 Photoacoustic Field Gas-Monitor
Page 183 of 280
Chapter 12
______________________________________________________________________
From the top of the Communication branch of the Set-up Tree:
SELECT COMMUNICATION SET-UP BRANCH ?
RS 232
IEEE 488
CONNECTIONS
1. Press S2.
2. Use the direction push-buttons to select the correct values for the
parameters.
If you are in doubt about any of the settings, refer to your printer
manual.
3. When you have been through all the parameters, the monitor
returns to the top of the Communication branch.
4. Press S3 S3 and then SET-UP. This selects the IEEE port as
the communication port for the printer.
5. Press RESET and S1 to partially reset your Monitor.
12.4
Additional Parameters Required
The other output parameters which determine the format of printouts are shown in Table 12.4 together with available choices and
factory default values.
Table 12.4
Parameters which determine the format of print-outs
from the monitor
Display Text
PRINT EACH GAS?
(if print each gas is no) PRINT
GAS N*?and/or Air Pressure
SELECT TEXT LINE TERMINATOR
Acceptable
Values
No, Yes
No, Yes
CR, LF, CR-LF
Default
Value
Yes
No
CR-LF
If one chooses to PRINT EACH GAS, then all gases, which have
been measured, will be printed out. If one does not choose to PRINT
EACH GAS then the user is given the chance to choose which of the
gases (A-E) and water (W) should be printed out – PRINT GAS A?
and so on.
SELECT TEXT LINE TERMINATOR The user chooses which
character the Monitor should use as “end of text line” when data is
transmitted from the Monitor.
_____________________________________________________________________________
BE6011-16
1314 Photoacoustic Multi-gas Monitor
LumaSense Technologies A/S
1412 Photoacoustic Field Gas-Monitor
Page 184 of 280
Chapter 12
______________________________________________________________________
12.5
Data Logging Function
Setting-up the Monitor to Print a Data Log
If the Monitor is connected up to a printer, and it is set-up to transmit data to the
printer, this function enables measurement data to be printed out, automatically, as
soon as it becomes available during a measurement or calibration.
The procedure is as follows:
1. Press the following sequence: SET-UP S3 S1 S1, and the
following text is displayed:
SELECT GENERAL SET-UP BRANCH ?
CLOCK
SOUND
TESTS
2. Press S3 T S3 SET-UP. This activates the data logging
function.
12.6
Error Logging Function
Setting-up the Monitor to Print an Error Log
If the Monitor is connected up to a printer, and it is set-up to
transmit data to the printer, this function enables any warning or
error messages that are displayed, to be recorded in the printed
error log, automatically.
The procedure is as follows:
1. Press the following sequence: SET-UP S3 S1 S1, and the
following text is displayed:
SELECT GENERAL SET-UP BRANCH ?
CLOCK
SOUND
TESTS
2. Press S3 T T S3 SET-UP. This activates the error logging
function.
12.7
Printing-out Data from the Monitor
Before data can be printed out from the Monitor, the communication
parameters must be checked/changed. This is explained in section
12.3.1 for RS-232 communication and section 12.3.2 for IEEE
communication. The text line terminator must be set (see section
12.4) before printing can proceed.
_____________________________________________________________________________
BE6011-16
1314 Photoacoustic Multi-gas Monitor
LumaSense Technologies A/S
1412 Photoacoustic Field Gas-Monitor
Page 185 of 280
Chapter 12
______________________________________________________________________
It is also necessary to define the averaging period if the AVERAGE
option (only valid for 1412) is selected. Setting the Data Logging
function is described in section 12.5.
12.7.1
Starting a Print-out
Press PRINT and then one of select push-buttons S1 S2 or S3
depending on which data block you wish to print-out.
12.7.2
Stopping a Print-out which is in Progress
If a print-out is in progress and you wish to stop it, then the following steps need to be
followed:
1. Press the PRINT button on the Monitor’s front panel.
The following text will appear on the display:
PRINT ABORTING
PLEASE WAIT
The printer will stop printing data.
2. Use the Line Feed function on the printer if the paper is not
ejected automatically.
_____________________________________________________________________________
BE6011-16
1314 Photoacoustic Multi-gas Monitor
LumaSense Technologies A/S
1412 Photoacoustic Field Gas-Monitor
Page 186 of 280
Chapter 13
______________________________________________________________________
Chapter 13
Maintenance of the 1314/1412
July 2009
_____________________________________________________________________________
BE6011-16
1314 Photoacoustic Multi-gas Monitor
LumaSense Technologies A/S
1412 Photoacoustic Field Gas-Monitor
Page 187 of 280
Chapter 13
______________________________________________________________________
The only regular maintenance required for the 1314/1412 is:
Calibration – approximately every 3 months (see Chapter 14).
Changing the fine air-filter paper in the internal and external airfiltration units (see section 13.1).
Cleaning of the filter in the ventilation unit (see section 13.2).
13.1
Changing the Fine Air-filters
The monitor is equipped with an internal filtration unit.
The internal unit is mounted on the air-inlet, on the back panel. This
is shown in Fig.13.1.
Fig.13.1 The internal air-filtration unit mounted on the back panel of
the monitor.
The internal air-filtration unit can be removed simply by unscrewing
the unit by hand. The unit is shown in Fig.13.2.
Fig.13.2 The internal air-filtration unit
_____________________________________________________________________________
BE6011-16
1314 Photoacoustic Multi-gas Monitor
LumaSense Technologies A/S
1412 Photoacoustic Field Gas-Monitor
Page 188 of 280
Chapter 13
______________________________________________________________________
Inside the unit, a fine (10µm) filter-paper removes fine dust particles
and other suspended matter from air samples before they reach the
measurement chamber of the Monitor.
Whenever the Monitor needs to be calibrated, we recommend that
the fine filter-paper in the internal air-filtration unit is changed
before you calibrate. The fine filter-paper in the internal air-filtration
unit must be changed at least twice a year; and more frequently if
the environment in which the monitor is working contains large
quantities of particulate material suspended in the air.
When the monitor is making measurements, we recommend that a
length of Teflon® tubing (of up to 50 metres in length) is always
attached to the stub of the air-inlet (see Fig.13.1) and that the
special external air-filtration unit UD 5023 (optional accessory),
shown in Fig.13.3, is always attached to the free-end of the sampling
tube, by means of the small stub. An external coarse metal air-filter
prevents large particles, insects etc. being drawn into the unit, while
inside the unit is a fine (10µm) filter-paper, which prevents any finer
particles from entering the Teflon® sampling tube. The fine filterpaper in this unit must also be changed regularly – at least as
frequently as the fine filter-paper in the internal fine air-filter.
Fig.13.3 The external air-filtration unit UD5023 used with the
Monitor, (optional accessory)
Changing the fine filter-paper in both the internal and external airfiltration units is explained step by step in the following two subsections.
_____________________________________________________________________________
BE6011-16
1314 Photoacoustic Multi-gas Monitor
LumaSense Technologies A/S
1412 Photoacoustic Field Gas-Monitor
Page 189 of 280
Chapter 13
______________________________________________________________________
13.1.1
Changing the Filter-paper in the Internal Airfiltration Unit
While you do this, we recommend that you wear clean, rubber
gloves.
Tools and equipment required:
Acetone (analytically pure)
Spare fine filter-paper DS 0759
Tweezers QA 0164
Cotton buds
Clean rubber gloves
To change the filter-paper:
Switch the power to the monitor “Off” by using the AC mains power
switch on its back panel (press O), and then pull out the plug
connecting the monitor to the AC mains power supply.
Put a rubber glove on the hand, which is to hold the parts of the unit.
Unscrew the internal air-filtration unit from its mounting on the airinlet, see Fig.13.1. To do this, turn the unit anti-clockwise with your
fingers until the unit is free of the slot.
The unit is removed from the monitor. It is shown in Fig.13.2.
Use the tweezers to lift off the retaining disc and used filter-paper,
while holding the handle of the unit between your thumb and fingers.
Refer to Fig.13.4. The retaining disc has two tabs which “lock” it to
the filtration unit.
Fig.13.4 Removing the retaining disc and old filter-paper
Holding the disc with the tweezers, moisten a cotton bud with pure
acetone and use it to clean the surfaces of the disc. Place the disc on
a clean, dry surface.
_____________________________________________________________________________
BE6011-16
1314 Photoacoustic Multi-gas Monitor
LumaSense Technologies A/S
1412 Photoacoustic Field Gas-Monitor
Page 190 of 280
Chapter 13
______________________________________________________________________
Caution: Make sure that no cotton fibres remain on the mesh of the
retaining disc otherwise they could be sucked up into, and block the
measurement system when the Monitor is operated.
Hold the handle-end of the unit between your thumb and fingers.
Moisten a cotton bud with pure acetone and use it to clean the
surfaces of the unit. Refer to Fig.13.5. Place the unit, with its handleend downwards, on a clean, dry surface.
Fig.13.5 Cleaning the surfaces of the internal air-filtration unit
Notes:
Only proceed to the next step when the acetone has completely
evaporated from the air-filter retaining disc and filtration unit.
Each of the fine filter-papers DS 0759 are packed between two
pieces of packing paper. The fine filter-paper is always white in
colour.
Remove a new fine filter-paper from its packaging using the
tweezers. Hold it by its edge. Refer to Fig.13.6. Lift the filter up and
place it inside the unit.
Fig.13.6 Placing a new filter-paper in the unit
_____________________________________________________________________________
BE6011-16
1314 Photoacoustic Multi-gas Monitor
LumaSense Technologies A/S
1412 Photoacoustic Field Gas-Monitor
Page 191 of 280
Chapter 13
______________________________________________________________________
Holding the handle-end of the unit between your thumb and fingers,
pick up the (dry) retaining disc and place it over the new filter-paper.
Refer to Fig.13.7. Gently press the disc down over the filter-paper,
making sure that the disc’s locking tabs fit properly into the groove
in the unit and that the filter-paper stays in position and is not
damaged in any way.
Holding the handle-end of the re-assembled unit between your
thumb and fingers, place it back into position in the air-inlet of the
Monitor. Screw it back into its mounting. To do this, turn the unit
clockwise with your fingers to tighten until it is in position.
Fig.13.7 Refitting the retaining disc
13.1.2
Changing the Filter-paper in the External Airfiltration Unit
While you do this, we recommend that you wear clean, rubber
gloves.
Tools and equipment required:
Acetone (analytically pure)
Spare fine filter-paper DS 0759
Tweezers QA 0164
Cotton buds
Clean rubber gloves
To change the filter-paper:
Switch off the Monitor.
Put a rubber glove on the hand which is to hold the parts of the unit.
Pull the external fine air-filtration unit off the end of the Teflon®
sampling tube. Hold the stub-end of the external air-filter unit
between your thumb and fingers, and unscrew the coarse air filter
from the end of the unit. Refer to Fig.13.3.
Remove the used (old) filter-paper and the retaining disc from the
unit using the tweezers. Refer to Fig.13.8.
_____________________________________________________________________________
BE6011-16
1314 Photoacoustic Multi-gas Monitor
LumaSense Technologies A/S
1412 Photoacoustic Field Gas-Monitor
Page 192 of 280
Chapter 13
______________________________________________________________________
Fig.13.8
The parts of the external air-filtration unit UD 5023
Moisten a cotton bud with pure acetone and use it to clean the
surfaces of the unit, the retaining disc and the coarse air-filter. Refer
to Fig.13.8. Place the stub-end of the unit downwards, on a clean,
dry surface; the coarse air-filter, with its screw-end downwards on a
clean, dry surface and rest the retaining disc against it.
Caution: Make sure that no cotton fibres remain on the mesh of the
retaining disc otherwise they could be sucked up into, and block the
measurement system when the analyzer is operated.
Notes:
Only proceed to the next step when the acetone has completely
evaporated from the cleaned surfaces.
Each of the fine filter-papers DS 0759 are packed between two
pieces of packing paper. The fine filter-paper is always white in
colour.
Hold the stub-end of the unit between your thumb and fingers. Lift
the retaining disc with the tweezers and place it back into position in
the unit. Refer to Fig.13.8.
Remove a new fine filter-paper from its packaging using the
tweezers. Hold it by its edge. Carefully place the filter-paper over the
top of the retaining disc so that it is held in position by the small “lip”
on the rim of the unit.
_____________________________________________________________________________
BE6011-16
1314 Photoacoustic Multi-gas Monitor
LumaSense Technologies A/S
1412 Photoacoustic Field Gas-Monitor
Page 193 of 280
Chapter 13
______________________________________________________________________
Screw the coarse air-filter over the end of the external air-filtration
unit. Make sure that the fine filter-paper remains in its correct
position directly over the retaining disc.
13.2
Cleaning the Filter in the Ventilation Unit
A small ventilation unit is mounted on the back panel of the Monitor
(see in Fig.13.9). The ventilating fan in this unit circulates air
through the Monitor to keep it cool. To ensure that the air being
drawn into the Monitor is free of particles a filter pad is placed between the fan and grid which covers it. This filter needs to be
periodically taken out and cleaned. We recommend that this task is
done at least as often as calibration, and more frequently if the
Monitor is working in a very dusty atmosphere or an atmosphere
containing high concentrations of other particulate matter.
Use a “pozidrive” screwdriver to unscrew the two screws on the grid
cover.
Remove the filter pad from inside the grid cover. Wash the filter pad
in warm water containing some liquid soap. Rinse all the soap out of
the filter, by running clean water through it, and let it dry
thoroughly.
Place the clean, thoroughly dry, filter pad inside the grid cover.
Screw the grid cover firmly back in place over the ventilation unit.
Fig.13.9
Back panel of the 1412 showing the ventilation unit
_____________________________________________________________________________
BE6011-16
1314 Photoacoustic Multi-gas Monitor
LumaSense Technologies A/S
1412 Photoacoustic Field Gas-Monitor
Page 194 of 280
Chapter 13
______________________________________________________________________
Fig.13.10
13.3
Back panel of the 1314 showing the ventilation unit
Cleaning the Instrument
It is recommended to clean the instrument using a damped cloth.
_____________________________________________________________________________
BE6011-16
1314 Photoacoustic Multi-gas Monitor
LumaSense Technologies A/S
1412 Photoacoustic Field Gas-Monitor
Page 195 of 280
Chapter 14
______________________________________________________________________
Chapter 14
Calibration of the Optical Filters
July 2009
_____________________________________________________________________________
BE6011-16
1314 Photoacoustic Multi-gas Monitor
LumaSense Technologies A/S
1412 Photoacoustic Field Gas-Monitor
Page 196 of 280
Chapter 14
______________________________________________________________________
14.1
About the Installed Optical Filters
In collaboration with INNOVA Sales Engineers, you have chosen the
optical filters that are best suited to your measuring task. Each of
these optical filters has been installed in one of the positions marked
“A”, “B”, “C”, “D” or “E” of the filter carousel wheel in your Monitor. A
special optical filter, which is selective to water vapour, is always
installed in position “W”.
Each optical filter has to be span calibrated with the gas it is to
measure. If this span calibration is not performed the Monitor is
unable to measure accurately.
Each filter in the carousel has to be fully calibrated before the
Monitor can perform accurate gas measurements. The practical
calibration procedure is fairly simple, it involves performing
measurements with the Monitor while various gas supplies are attached to its air-inlet.
A full calibration of the water-vapour filter SB 0527 involves:
•
•
Zero-point calibration (using a zero-gas *)
Span calibration (using a known concentration of water vapour)
A full calibration of the optical filters in position “A” to “E” involves:
•
•
•
•
Zero-point calibration (using a zero-gas*)
Humidity-interference calibration (using water-vapour)
Span calibration (using a known concentration of the gas this
filter is to measure)
Cross-interference calibration (when this is necessary). If the
gas to be measured by filter “A” actually absorbs light from any of
the other installed optical filters it will interfere with the signal
measured when the other optical filters are used. If this is the
case, it is necessary to perform a cross-compensation calibration
of this filter. This involves taking measurements with all the other
installed optical filters while the span calibration is performed.
The following sections explain what a calibration is and why it is
necessary. Some of the expressions used in this chapter are also
explained, to help you understand the process.
*
A zero-gas is a gas which does not absorb infra-red light e.g. pure Nitrogen.
_____________________________________________________________________________
BE6011-16
1314 Photoacoustic Multi-gas Monitor
LumaSense Technologies A/S
1412 Photoacoustic Field Gas-Monitor
Page 197 of 280
Chapter 14
______________________________________________________________________
14.2
What is Calibration and Why is it Necessary?
In order to understand calibration, it is necessary to look at what
happens inside the analysis cell during a gas concentration
measurement. A sample of air is drawn into the cell. The cell is then
sealed off and light is sent from the infra-red source via a chopper
(to pulsate it) through an optical filter. The optical filter only
transmits light in a defined wavelength range and this light enters
the cell.
If there is a gas in the cell, which absorbs light of this wavelength, a
pressure wave is created and this is measured by the microphones
mounted within the cell. The greater the concentration of the
absorbing gas in the cell, the greater the pressure (sound) wave it
creates.
How do we measure the relationship between the measured sound
signal and the concentration of the absorbing gas in the cell? We
calibrate the optical filter.
Our description of what happens in the cell is, however, a little too
simplified. In reality, we have to take three other factors into
consideration: namely: (1) cell noise; (2) the presence of water
vapour in the sample (humidity interference); and (3) the possible
presence of other interferent gases.
Fig.14.1 High resolution absorption spectrum of water vapour
Cell Noise
When there is zero-gas in the cell (that is, a gas which does not
absorb any infra-red light) a signal is measured in the cell. This
signal is due to what is termed cell noise. Cell noise is created by
the imperfect reflection of infra-red light from the cell walls. It is
dependent upon the properties of the cell itself (for example, its
dimensions and the reflectivity of its walls) as well as the wavelength
_____________________________________________________________________________
BE6011-16
1314 Photoacoustic Multi-gas Monitor
LumaSense Technologies A/S
1412 Photoacoustic Field Gas-Monitor
Page 198 of 280
Chapter 14
______________________________________________________________________
(and thus energy) of the infra-red light which is incident on its walls.
As it is the optical filter, which determines the wavelength of light,
cell noise will depend upon the optical filter being used.
The cell-noise signal is measured during the Zero-point Calibration
of each filter. A supply of dry, zero gas is attached to the air-inlet of
the Monitor and the signal in the cell is measured with each installed
optical filter (“A” to “E”). This signal is called the concentration
offset factor for the filter. Whenever the filter is used, this signal is
subtracted from the total measured signal as it is not related to the
concentration of any gas.
Presence of Water Vapour
Water vapour is nearly always present in ambient air and it absorbs
infra-red light, to a greater or lesser extent, at nearly all wavelengths
(see Fig.14.1). This means that no matter which optical filter is
transmitting light into the cell the water vapour in the cell will absorb
some of this light and create a signal. This signal is said to “interfere”
with the signal produced by the gas we wish to measure with this
filter.
Fig.14.2 Schematic diagram showing the relative absorption of water
vapour by different optical filters
How is this interference measured? A water-vapour optical filter,
which transmits light with a wavelength, which is absorbed by very
few gases, except water vapour, is always installed in position “W” of
the filter carousel. Using this filter, water-vapour’s interference is
measured during the Humidity Interference Calibration of each
installed filter. A supply of zero gas containing a constant
concentration of water vapour is attached to the air-inlet of the
_____________________________________________________________________________
BE6011-16
1314 Photoacoustic Multi-gas Monitor
LumaSense Technologies A/S
1412 Photoacoustic Field Gas-Monitor
Page 199 of 280
Chapter 14
______________________________________________________________________
Monitor. The signal in the cell is measured with the water vapour
filter and with all the other installed optical filters.
The water vapour in the cell absorbs light from the water-vapour
filter and from the other installed filters, producing signals which are
related to water-vapour’s relative absorption of the light at the
wavelengths transmitted by the different optical filters (see
Fig.14.2). We know, however, that the ratio of the signal measured
with any one filter (e.g. “A”) and the signal measured with the watervapour filter is a constant. This ratio is related to the Humidity Gain
Factor calculated during the humidity-interference calibration of
filter “A”. For example, if the signal produced by water vapour when
using the water-vapour filter, is 160µV and using Filter “A” is 16µV,
then, if the signal measured with the water-vapour filter is found to
be 80µV, we know that this concentration of water vapour will
produce a signal of 8µV when Filter “A” is used. Measurements made
during humidity-interference calibration of the installed filters
therefore enable the Monitor to compensate any measured signal for
water-vapour’s interference.
_____________________________________________________________________________
BE6011-16
1314 Photoacoustic Multi-gas Monitor
LumaSense Technologies A/S
1412 Photoacoustic Field Gas-Monitor
Page 200 of 280
Chapter 14
______________________________________________________________________
Fig.14.3 Schematic diagram showing the absorption spectrum of gas
A and gas B. The dashed lines represent the half-power
bandwidths of the filters used to measure each gas
Presence of Other Interferents
In many measurement situations water vapour is not likely to be the
only interferent present. Suppose that you have installed an optical
filter “A” to measure a gas (A), but another gas (B) is normally found
in the ambient air you are monitoring. If gas B absorbs some light
from filter “A”, it will “interfere” with the signal produced by gas A’s
absorption of this light. This is illustrated by the lower absorption
spectrum in Fig.14.3 (“Interference from Gas B when filter A is
used”). This interference is termed cross interference.
How is this interference measured? An optical filter “B” is chosen,
which transmits light with a wavelength which is most strongly
absorbed by gas B, and less strongly by gas A, this is illustrated by
the lower absorption spectrum shown in Fig.14.3. During cross
interference calibration two sets of measurements are performed:
_____________________________________________________________________________
BE6011-16
1314 Photoacoustic Multi-gas Monitor
LumaSense Technologies A/S
1412 Photoacoustic Field Gas-Monitor
Page 201 of 280
Chapter 14
______________________________________________________________________
1. The signal in the cell is measured using filter “A” and the filter “B”
when a known concentration of gas A is in the analysis cell. The
ratio of these two signals is directly related to gas A’s relative
absorption of light at these two wavelengths (upper spectrum in
Fig.14.3). This ratio is a constant and is a measure of Gas A’s
Interference on filter “B”.
2. The signal in the cell is measured using filter “A” and filter “B”
when a known concentration of gas B is in the cell. The ratio of
these two signals is directly related to gas B’s relative absorption
of light at these two wavelengths (lower spectrum in Fig.14.3).
This ratio is a constant and is a measure of Gas B’s Interference
on filter “A”.
By measuring the ratios described above, the Monitor is able to
compensate any measurement made with filter “A” for any
interference signal produced by the presence of gas B in the cell, and
vice versa. This procedure is known as cross compensation.
14.3
Tasks Before Starting Any Calibration
Before starting any kind of calibration task there are several
operations, which need to be performed:
14.3.1
Monitor
Obtaining a Print-out of Calibration Data in the
PC Use
Whether the Monitor is to be used online or as a stand-alone
instrument, the Gas Monitoring Software 7304 can be used to check
the Monitor’s existing calibration. All the calibration factors can be
printed out directly from the software using the “Print Current
Calibration (see section 8.9.2).
Stand-alone Use
With the monitor connected to a printer (details are given in Chapter
12):
Press PRINT and then S3.
To stop printing, press PRINT again.
_____________________________________________________________________________
BE6011-16
1314 Photoacoustic Multi-gas Monitor
LumaSense Technologies A/S
1412 Photoacoustic Field Gas-Monitor
Page 202 of 280
Chapter 14
______________________________________________________________________
14.3.2
Filter
Checking the Calibration of Each Installed Optical
A print-out of the calibration data in the Monitor’s memory is useful
to have for reference. It also enables you to find out how “old”
calibration factors compare with the “new” calibration factors
calculated during re-calibration tasks, see section 14.3.1.
Fig.14.4 illustrates only part of a typical calibration data print-out. To
simplify our discussion, we will confine our discussion to the
calibration data for a single optical filter installed in position “A”. Note
that there are five different filter banks, which contain calibration
data. These banks are numbered from 1 to 5. This enables each filter
to be calibrated to measure up to 5 different gases. Before the filter
is calibrated to measure any one particular gas, you have to inform
the Monitor about where you wish to store the calibration data for
this gas. The number of the filter bank chosen when operating in
Set-Up mode is called the active filter bank (see Chapter 11).
When checking the optical filters using the front panel push-buttons,
Chapter 12 provides details of how to obtain a print-out of calibration
data using a printer with an RS 232 interface or an IEEE 488
interface.
Note that calibration data in the active filter bank is always printed
out directly after the optical filter factors data and this data is also
shown under the heading CALIBRATION DATA IN FILTER BANK
: X, where X is the number of the filter bank.
Note: all calibration factors are expressed as exponential numbers.
For example: 104.05E-3, this is the same as the number 104.05 x
10-3 = 0.10405
1. Refer to your calibration data print-out and check the following
information:
a.
Under
the
heading
GENERAL
CALIBRATION
INFORMATION FOR FILTER A: check that the UA number
of the installed optical filter is the same as the UA number
appearing on the “Calibration Chart” for the optical filter in
position “A”.
Under the headings CALIBRATION DATA IN FILTER
BANK:1; CALIBRATION DATA IN FILTER BANK:2;
CALIBRATION DATA IN FILTER BANK:3; CALIBRATION
DATA IN FILTER BANK:4; and CALIBRATION DATA IN
FILTER BANK:5 check the following information:
_____________________________________________________________________________
BE6011-16
1314 Photoacoustic Multi-gas Monitor
LumaSense Technologies A/S
1412 Photoacoustic Field Gas-Monitor
Page 203 of 280
Chapter 14
______________________________________________________________________
b.
c.
d.
e.
Zero-point calibration performed: if a date appears here
(year-month-day) this is the last time the zero-point
calibration data in this filter bank was updated.
Concentration offset factor: if a number appears here this
means that this filter bank contains calibration data obtained
during a zero-point calibration of filter “A”.
Hum. Interference Calibration performed: if a date
appears here (year-month-day) this is the last time the
humidity-interference calibration data in this filter bank was
updated.
Humidity gain factor: if a number appears here this means
that this filter bank contains calibration data obtained during
the humidity-interference calibration of filter “A”.
f. Cross Interference Calibration performed: if a date
appears here (year-month-day) this is the last time cross
interference calibration data in this filter bank was updated.
g. “Gas name” interference on Filter B, C, D, E: if a number
appears after these headings this means that this filter bank
contains calibration data collected during cross-interference
calibration for this named gas.
h. If the following three conditions are found in any filter bank:
• Gas name: if the name which appears here is the same
as the name of the gas you intend to measure with filter
“A”;
• Span Calibration performed: if a date appears here;
and
• Conversion factor: a number appears here;
then this filter has been properly span calibrated with the
named gas. The filter bank containing this calibration data
is the filter bank, which has to be made active when filter
“A” is to measure this named gas.
i. However, if the Gas name: is given as “Gas UA number” then
the filter has only been checked to see that it is functioning
correctly, it has not been span calibrated to measure the gas
you wish to measure.
2. Under the heading GENERAL INFORMATION FOR WATER
FILTER – ACTIVE CALIBRATION DATA : check the following
information:
a. Zero-point Calibration performed: if a date appears here
this is the last time the water-vapour filter was zero-point
calibrated.
_____________________________________________________________________________
BE6011-16
1314 Photoacoustic Multi-gas Monitor
LumaSense Technologies A/S
1412 Photoacoustic Field Gas-Monitor
Page 204 of 280
Chapter 14
______________________________________________________________________
b. Concentration offset factor: if a number appears here this
means that the water-vapour filter has been zero-point
calibrated.
c. Span Calibration performed: if a date (year-month-day)
appears here, this is the last time span calibration of the
water-vapour filter was performed.
d. Conversion Factor: if a number appears here this means that
the water-vapour filter has been span calibrated.
When the water-vapour filter has been zero-point calibrated and
span calibrated it is able to measure the absolute concentration of
water vapour in any gas sample in the analysis cell of the Monitor,
and it requires no further calibration.
When all installed optical filters (in positions “A” to “E”) have been
zero-point, humidity-interference, span and cross-interference
calibrated (if necessary) then the Monitor is able to perform accurate
measurements.
_____________________________________________________________________________
BE6011-16
1314 Photoacoustic Multi-gas Monitor
LumaSense Technologies A/S
1412 Photoacoustic Field Gas-Monitor
Page 205 of 280
Chapter 14
______________________________________________________________________
Fig.14.4
Part of a calibration data print-out
14.3.3 Checking and Changing Optical Filter Parameters
Before starting calibration it is always wise to check that information
about the installed optical filters has been “entered” correctly in the
active set-up of the Monitor. If the incorrect UA number is
“entered” for the optical filter in a particular position, the incorrect
optical filter factors will be used in the calculation of the calibration
factors, and calibration will therefore be useless.
The UA number can only be changed using the push-buttons on the
front panel of the monitor.
1. Press SET-UP S3 S3.
The following text appears on the screen display:
CHECK AND / OR CHANGE SET-UP FOR FILTER A
NO
YES
_____________________________________________________________________________
BE6011-16
1314 Photoacoustic Multi-gas Monitor
LumaSense Technologies A/S
1412 Photoacoustic Field Gas-Monitor
Page 206 of 280
Chapter 14
______________________________________________________________________
2. Press S3 and the following text appears on the screen display:
SELECT UA NUMBER FOR FILTER A 0984
PRESS ENTER TO CHANGE VALUE
The UA number of the filter installed in position “A” should have
already been checked (see section 14.3.2).
WARNING! If this number is changed all calibration data for this
filter – in all 5 filter banks – will be deleted (i.e. lost) and the filter
will have to be fully calibrated again before it can be used.
If the incorrect filter is selected, press ↵ and use S and T to
scroll through the UA numbers, until the correct UA number is
displayed.
The procedure divides here. PC users go to step 3. and Stand-alone
users go to step 4.
3. Only the Filter UA numbers need to be checked/changed using the
monitor’s push-buttons. All the other parameters are set when
setting up the calibration using the Calibration program.
Press ↵ and use T until the following text is displayed.
CHECK AND / OR CHANGE SET-UP FOR FILTER B
NO
YES
Repeat steps 2 and 3 until the correct UA numbers have been
entered for the fitted optical filters. Then exit the Calibration Setup by pressing SET-UP.
4. Press ↵ .
The following text appears on the screen:
FILTER BANK NUMBER 1
PRESS ENTER TO CHANGE VALUE
5. Press ↵ , and use S and T to display the number of the filter bank
(1-5) where you wish the Monitor to store the calibration factors
calculated during the span calibration of this filter using this
particular gas.
6. Press ↵ .
The following text appears on the screen:
_____________________________________________________________________________
BE6011-16
1314 Photoacoustic Multi-gas Monitor
LumaSense Technologies A/S
1412 Photoacoustic Field Gas-Monitor
Page 207 of 280
Chapter 14
______________________________________________________________________
GAS A IS “_
PRESS ENTER TO CHANGE VALUE
“
7. Press ↵ and use the direction push-buttons to enter the desired
name.
8. Press ↵ to “accept” the name you have “entered” on the display
screen. The following text then appears:
MOLECULAR WEIGHT OF GAS A 1.000
PRESS ENTER TO CHANGE VALUE
9. Press
↵ and use the direction push-buttons to “enter” the
molecular weight of the gas to be measured by filter A.
10. Press ↵ to “accept” the molecular weight you have “entered”
on the display screen. The following text appears on the screen:
FILTER A SAMPLE INTEGRATION TIME
PRESS ENTER TO CHANGE VALUE
5s
11. Press ↵ , and use S and T to display the desired Sample
Integration Time.
There are seven to choose from: 0.5s, 1s, 2s, 5s, 10s, 20s and
50s.
12. Press ↵ to “accept” the selected value.
The following text appears on the screen:
GAS A HIGH ALARM LIMIT 1 ___________mg/m3
PRESS ENTER TO CHANGE VALUE
13. Press ↵ and use the direction push-buttons to enter the
desired alarm level.
14. Press ↵ to accept the entered value. Following screen is
displayed:
GAS A HIGH ALARM LIMIT 2 ___________mg/m3
PRESS ENTER TO CHANGE VALUE
15.
Repeat step 13 and 14 to enter the desired alarm level.
_____________________________________________________________________________
BE6011-16
1314 Photoacoustic Multi-gas Monitor
LumaSense Technologies A/S
1412 Photoacoustic Field Gas-Monitor
Page 208 of 280
Chapter 14
______________________________________________________________________
All the parameters for Filter A are now set, and the display moves on
to filters B, C, D and E. Repeat steps 2 to 15, excluding step 3.
16. All the parameters for Filter W are fixed except for the Sample
Integration Time and the two high Alarm limits.
17.
Press ↵ and use S and T to display the desired Sample
Integration Time.
18.
Repeat step 13 and 14 to enter the desired alarm levels.
19. Press ↵ , this returns you to the top of the Configuration Set-up
Tree.
14.3.4 Setting-up the Monitor to Print a Data Log
This is only necessary for those of you who do not use the Gas
Monitoring Software 7304 to calibrate the Monitor.
During calibration, the calibration gas is drawn into the cell and the
microphones measure the signal produced by the gas’s absorption of
light from the infra-red light source. As soon as a measurement is
made it is displayed on the Monitor’s screen. Measurement results
are constantly updated on the display, but only one set of measurement results are displayed at a time, and no scrolling facility is
available to look at previously-displayed results. Therefore, your
Monitor should be set-up to print a “Data log” This is described fully
in section 12.5.
14.3.5 Warming Up the Monitor
The infra-red light source is very hot and the temperature in the
analysis cell thus increases as calibration measurements proceed.
Conditions within the cell tend to stabilise more quickly once the
temperature inside the analysis cell is 15°C above the ambient room
temperature. We therefore suggest that you set-up the Monitor to
sample continuously, for a period of 30 – 40 min. to warm up the
analysis cell before a calibration task is started. This will reduce the
time required for calibration.
To warm-up the Monitor you need to set-up a monitoring task and
make the Monitor perform the task for a period of time. If you are
unsure about setting up and starting a monitoring task, full
instructions are provided together with an example in section 4.3 for
PC use and section 4.4 for stand-alone use.
_____________________________________________________________________________
BE6011-16
1314 Photoacoustic Multi-gas Monitor
LumaSense Technologies A/S
1412 Photoacoustic Field Gas-Monitor
Page 209 of 280
Chapter 14
______________________________________________________________________
14.4
The Basic Calibration Set-up
The general equipment required to perform the calibration is shown
in Fig.14.5. Three different lengths of teflon tubing are connected to
a “Y”-piece. The tube attached to point 1 is connected to the air-inlet
of the Monitor; the tube attached to point 2 is attached to a gas flow
meter or similar apparatus; and the tube attached to point 3 is attached to the cylinder of gas which is to be used during calibration.
Fig.14.5
General equipment required for a calibration task
Attaching a gas flow meter serves two vital functions (see Fig.14.6):
Fig.14.6
Schematic diagram of a flow meter
_____________________________________________________________________________
BE6011-16
1314 Photoacoustic Multi-gas Monitor
LumaSense Technologies A/S
1412 Photoacoustic Field Gas-Monitor
Page 210 of 280
Chapter 14
______________________________________________________________________
•
It allows you to have a visually check that there is a net flow of
gas out of the teflon tube attached to it during the whole
calibration procedure. The “flow ball” can be seen to be bouncing
on the upward flow of air out of the meter.
If the pressure of the gas from the cylinder is too low at any time
then the “flow ball” will just remain seated at the bottom of its
tube. This condition must be avoided because atmospheric air will
be drawn into the teflon tube system via the flow meter and cause
dilution of the calibration gas. This will affect the accuracy of your
calibration.
•
It functions as an escape valve. When the pressure of the gas in
the tubing becomes greater than atmospheric pressure, gas flows
out to the atmosphere via the flow meter. This ensures that the
gas entering the analysis cell is as close to atmospheric pressure
as possible, and this prevents damage to the very sensitive
microphones in the analysis cell.
WARNING!: The analysis cell of the monitor is equipped with
sensitive microphones, and therefore NO direct connection between
the Monitor’s air-inlet and the pressure-valve on a gas cylinder is
allowed. Under NO circumstances should the pressure of the air in
the analysis cell be allowed to exceed 0.1 bar above the ambient
pressure.
1. Attach the teflon tubing to the Air Inlet Filter at the back of the
monitor. This is described in detail in section 4.2.
2.
a. Connect the free-end of the length of tubing attached to the
air-inlet to one of the branches of the “Y”-piece (see
attachment point no. 1 in Fig.14.5).
b. Cut off another 1m length of teflon tubing and connect one
of its ends to attachment point no. 2 of the “Y”-piece (see
Fig.14.5) and its other end to a flow-meter.
3. Connect a 1m length of tubing to attachment point no. 3 of the
“Y”-piece (see Fig.14.5).
14.4.1 Producing a Supply of Clean, Wet Air
When humidity-interference calibrations are performed, clean, wet
air is required. This can be produced in the following manner.
We suggest that you bubble zero-gas (e.g. pure nitrogen) through a
thermostatically-controlled water-bath to produce a supply of clean,
wet air to the Monitor during humidity-interference calibration of the
filters (see Fig. 14.7). Notice that the thermostatically-controlled
_____________________________________________________________________________
BE6011-16
1314 Photoacoustic Multi-gas Monitor
LumaSense Technologies A/S
1412 Photoacoustic Field Gas-Monitor
Page 211 of 280
Chapter 14
______________________________________________________________________
water bath is linked up to an extra “empty” flask. This is to prevent a
situation where the level of water in the controlled water-bath rises
and covers the outlet tube “A” and draws water, via the “Y”-piece,
directly into the Monitor’s analysis cell. Water will seriously damage
the cell. To avoid such a situation, we suggest that the wet air from
the water-bath outlet tube is fed into an extra empty flask before
being fed to the air-inlet of the Monitor. Note the length of the
respective tubes in the flasks. It is vitally important that any
water, which collects in the extra flask, does not cover the short
outlet tube “B”.
It is very important that the concentration of water vapour used is
below the saturated water-vapour pressure of the air in the room
where calibration is being performed, otherwise water vapour will
condense out in the analysis cell. In practical terms this means that:
•
•
The Monitor must have time to reach the ambient temperature of
the room before a calibration task is performed.
The temperature of the water bath you use should be at least 2°C
below the ambient temperature of the room where calibration is
to be performed. So, if your ambient temperature is 20°C, make
sure that the temperature of the water-bath you use is set at a
maximum of 18°C.
Fig.14.7
Schematic diagram of the equipment necessary to produce
a supply of clean, wet air.
_____________________________________________________________________________
BE6011-16
1314 Photoacoustic Multi-gas Monitor
LumaSense Technologies A/S
1412 Photoacoustic Field Gas-Monitor
Page 212 of 280
Chapter 14
______________________________________________________________________
14.5
General Settings for a Calibration – PC Use
The procedures in the following sections assume that all the
preliminary tasks described in section 14.3 and section 14.4 have
been completed.
Although there are four types of calibration, many of the procedures
for these calibrations are similar. These similarities are described
here. Things that are particular to the individual calibrations are
described in more detail in the relevant sections. The basic
calibration can be divided in to 3 stages:
•
•
•
Measuring Raw Data
Calculating Calibration Values
Downloading the Calibration Values to the Filter Banks
14.5.1 Measuring Raw Data
With the Calibration program already running and the correct tubing
attached:
Fig.14.8
Calibration Sequence Settings dialogue
1. Pull down the Task menu and click on New. If you want to use an
existing task then click on Open. The Calibration Task dialogue is
displayed.
_____________________________________________________________________________
BE6011-16
1314 Photoacoustic Multi-gas Monitor
LumaSense Technologies A/S
1412 Photoacoustic Field Gas-Monitor
Page 213 of 280
Chapter 14
______________________________________________________________________
2. Type in the desired task name, or highlight the desired name if
opening an existing task, and click on OK. A graphic window and
an extended menu-bar now appear.
3. Pull down the Task menu again and click on Units. The Units
dialogue appears.
4. Select the units you want to use in the calibration setup windows
and when entering the concentration values. The monitor
measures raw data, so these units do not affect the display data.
Click on OK.
5. Pull down the Sequence menu. Click on Settings. The
Calibration Sequence Settings dialogue is displayed, Fig.14.8.
Calibration index card
6. Click on the Calibration index-card, if it is not already at the front.
7. Click on the radio-button to select the desired calibration type.
The individual sections named below provide full details.
• Zero point – see section 14.7
• Humidity – see section 14.8
• Gas span – see section 14.11
Gas index card
8. Click on the Gas index-card, see Fig.14.9.
Fig.14.9
Gas Settings dialogue
_____________________________________________________________________________
BE6011-16
1314 Photoacoustic Multi-gas Monitor
LumaSense Technologies A/S
1412 Photoacoustic Field Gas-Monitor
Page 214 of 280
Chapter 14
______________________________________________________________________
9. If you have not uploaded the calibration, filter, gas names and
molecular weight information already, then do it now. Click on the
Reload Filter Info. soft-key. This takes several minutes, so wait
until it has finished before continuing. If you are performing a
span calibration, follow the steps given in section 14.11.1. For
zero-point and humidity calibrations follow the steps here.
10. Click in the Sample Integration Time field, and select the
desired time.
Note: the S.I.T. value should be set to the same as those used
for monitoring.
Sampling index card
11.
Click on the Sampling index card.
12. Select the desired Flushing Type. The procedure to do this is
the same as that used when monitoring, see section 7.2.
Note: the Flushing type and values should be set to the same as
those used when monitoring.
13.
When all the settings are correct, click on OK.
Starting a Calibration
1.
a.
b.
2.
Connect the free-end of the teflon tubing mentioned in section
14.4 to the pressure valve on a cylinder of calibration gas.
Gently open the pressure-valve on the gas cylinder.
Pull down the Sequence menu and click on Start.
The monitor will now begin to measure the raw data. All the gases
have the same units - µV or mV. Fig.14.10 illustrates how
measurement data is displayed.
_____________________________________________________________________________
BE6011-16
1314 Photoacoustic Multi-gas Monitor
LumaSense Technologies A/S
1412 Photoacoustic Field Gas-Monitor
Page 215 of 280
Chapter 14
______________________________________________________________________
Fig.14.10
Raw calibration data displayed on screen
Stop the calibration when you have enough raw measurement data.
Note: if you are performing a two-point span calibration, or, you
want more than one calibration type, then you can at this point stop
the calibration, change the Calibration Sequence Settings and
calibration gas, restart the measurement and collect the new raw
data for the next span concentration or optical filter. This enables
you to gather all the measurement data and then calculate all the
calibration factors in a single operation.
Stopping a Calibration Task
Pull down the Sequence menu and click on Stop.
14.5.2 Calculating Calibration Factors
Once you have measured enough raw data, you are able to calculate
the calibration factors. With the raw measurement data displayed on
screen:
1. Open the Cursor Values dialogue. Use of the cursors is described
in section 8.4.
_____________________________________________________________________________
BE6011-16
1314 Photoacoustic Multi-gas Monitor
LumaSense Technologies A/S
1412 Photoacoustic Field Gas-Monitor
Page 216 of 280
Chapter 14
______________________________________________________________________
2. Use two cursors and the statistical data are displayed in the
Cursor Values dialogue to locate a suitable range of data.
3. When you have the desired region between the cursors, pull down
the Sequence menu and click on Mark Interval.
Note: the marked interval must be the same type in the whole
interval.
The two cursors are replaced by a pair of green lines. These lines
have markings at the end of them, which show the type of
calibration data lying between the lines. The markings are:
ZP:
HS:
HI:
HIS:
calibration
SHA:
shows
shows
shows
shows
a
a
a
a
zero point calibration
humidity span calibration
humidity interference calibration
humidity interference and a humidity span
shows a Single point or Two point (High conc.)
span calibration (filter A)
SLA: shows a Two point (Low conc.) span calibration
(filter A)
4. Pull down the value menu and click on calculate
5. When the calculation(s) is complete a Calculation Finished
dialogue is displayed.
See Fig.14.11.
_____________________________________________________________________________
BE6011-16
1314 Photoacoustic Multi-gas Monitor
LumaSense Technologies A/S
1412 Photoacoustic Field Gas-Monitor
Page 217 of 280
Chapter 14
______________________________________________________________________
Fig.14.11
Calculation Finished dialogue
This dialogue informs you which calibration factors have been
calculated by placing a tick in the check box. The number of check
boxes ticked depends on the number of curves marked, and not the
number of gases measured.
14.5.3 Downloading the Calculated Values
When you are finished measuring the raw data and have calculated
the calibration factors, then you are ready to download the calculated
values to the Monitor.
NOTE: calibration factors calculated for a specific filter can not be
downloaded to filter banks of another filter.
_____________________________________________________________________________
BE6011-16
1314 Photoacoustic Multi-gas Monitor
LumaSense Technologies A/S
1412 Photoacoustic Field Gas-Monitor
Page 218 of 280
Chapter 14
______________________________________________________________________
Fig.14.12
Download dialogue
The Download dialogue, see Fig.14.12, is divided by index cards into
three calibration
types; Zero point, Humidity interference and Gas (span calibration).
The names of the calibrated gases for the different filters are listed,
and opposite each filter position are 5 check boxes. These boxes
represent the 5 filter banks for each optical filter. The check boxes
provide 4 types of information:
• The white boxes represent filter banks containing no calibration
factors – you can freely enter calibration factors here without
losing any existing information.
• The white boxes with a red shadow already contain calibration
factors – you can download the new factors to these filter
banks, but the existing information will be lost.
•
The ticked check boxes with a black shadow are the computers
suggestion as to where the new calibration factors should be
downloaded – it is normally these positions you would select
when performing a recalibration of the monitor. However, you
are free to remove the tick from the check box and place it
elsewhere, or place more than one tick for a filter. Several ticks
enables calibration factors to be downloaded to several banks
for the same filter.
_____________________________________________________________________________
BE6011-16
1314 Photoacoustic Multi-gas Monitor
LumaSense Technologies A/S
1412 Photoacoustic Field Gas-Monitor
Page 219 of 280
Chapter 14
______________________________________________________________________
• The grey boxes – these filter banks are not available –
therefore no calibration factors can be downloaded here.
When a check box is ticked, then a calibration factor will be
downloaded to the corresponding filter bank.
The Select All soft-key enables you to tick all the check boxes on
the displayed index card. This is useful for zero point and humidity
interference calibrations, where calibration factors are commonly
required for all the filters.
To download the calculated values:
1. Pull down the Values menu. Click on Download and the
Download dialogue is displayed, see Fig.14.12.
2. Depending on the calibrations performed, select the correct index
card.
3. Set ticks in the preferred check boxes.
4. Repeat steps 2 and 3 until all the desired check boxes are ticked.
Special Function – Edit Values
Warning! This option should only be used by experienced users.
Editing the calibration values here can result in the monitor
providing incorrect results.
a. If you want to edit the calibration values manually, click on
the Edit Values soft-key.
b. When you are sure that the results are correct and the correct
values and filters have been selected, click on OK. This
returns you to the Download dialogue.
5. When you are sure you have selected the correct filter bank
numbers, click on OK. The calibration factors are now
downloaded to the monitor.
14.5.4 Downloading Existing Calibration Factors
If you have made a back-up of the calibration factors present in the
monitor, using the Upload Banks from Gas Monitor option, it is
possible to reload them again without performing the calibrations
described above. This is possible using the “Download Banks to Gas
Monitor” option. You can download the values for all the filters, or
_____________________________________________________________________________
BE6011-16
1314 Photoacoustic Multi-gas Monitor
LumaSense Technologies A/S
1412 Photoacoustic Field Gas-Monitor
Page 220 of 280
Chapter 14
______________________________________________________________________
you can select single filter values to be downloaded. This is done as
follows:
1. Pull down the Bank menu, Click on Download Banks to Gas
Monitor and the Download Banks to Monitor dialogue appears.
2. Click on the desired radio-button: All Banks or Single.
If you select Single, highlight the correct filter and filter bank.
3. Click on OK.
14.6
General Settings – Stand-alone Use
Before a practical calibration task can be started, the monitor has to
be informed about the kind of calibration task you wish it to perform.
This is done using the push-buttons on the front panel of the
Monitor.
The Calibration Task Set-Up Tree is illustrated in Fig.14.13. It
should be used to help you follow the path through the different
levels of the calibration set-up. The calibration tasks are set-up while
operating in Measure mode.
Notice the following:
1. Before starting to set-up a calibration task you must make sure
that you choose the correct FILTER BANK NO. to store the
calibration factors which will be calculated during calibration (see
section 14.3.3).
2. If you answer “YES” to PERFORM ZERO-POINT CALIBRATION
?, then ALL the installed optical filters (“A” to “E”) will be zeropoint calibrated, and the concentration offset factor for each
filter will be stored in the filter bank no. which is active for that
filter during the practical calibration task.
3. If you answer “YES” to PERFORM HUM. INTERFERENCE
CALIBRATION ?, then ALL the installed optical filters (“A” to
“E”) will be calibrated for humidity interference, and the humidity
gain factor for each filter will be stored in the filter bank no.
which is active for that filter during the practical calibration task.
4. If you answer “YES” to PERFORM CROSS INTERFERENCE
CALIBRATION ?, then, during the span calibration of each filter,
when each known concentration of span gas is attached to the
Monitor’s air inlet, the signal in the cell is measured using ALL of
the installed optical filters. The factors which describe each gas’s
_____________________________________________________________________________
BE6011-16
1314 Photoacoustic Multi-gas Monitor
LumaSense Technologies A/S
1412 Photoacoustic Field Gas-Monitor
Page 221 of 280
Chapter 14
______________________________________________________________________
interference measured on the other installed filters, are stored
in the active filter bank of the filter installed to measure this gas.
5. If you answer “YES” to PERFORM GAS SPAN CALIBRATION ?,
then you can choose (1) which of the installed filters you wish to
span calibrate; and (2) whether this calibration should be a singlepoint or a two-point span calibration. The concentration
conversion factor calculated during span calibration for a particular gas using a particular filter), is stored in the filter bank no.
which is active during the calibration procedure.
14.6.1
Retaining Existing Calibration Factors
When zero-point, humidity-interference and cross-interference
calibrations are performed, all the installed filters are calibrated. In
some case, you may wish to keep the calibration factors already
present in your monitor. If this is the case, use the following
instructions.
_____________________________________________________________________________
BE6011-16
1314 Photoacoustic Multi-gas Monitor
LumaSense Technologies A/S
1412 Photoacoustic Field Gas-Monitor
Page 222 of 280
Chapter 14
______________________________________________________________________
Fig.14.13
Schematic diagram showing the calibration task Set-Up
Tree (general)
Before setting-up a calibration task, make sure that the filter banks
you make active for the filters which have already been calibrated
only contain calibration factors which need to be up-dated. In this
way you can prevent your original calibration factors
being
overwritten by the new ones. To illustrate this, imagine that filters
_____________________________________________________________________________
BE6011-16
1314 Photoacoustic Multi-gas Monitor
LumaSense Technologies A/S
1412 Photoacoustic Field Gas-Monitor
Page 223 of 280
Chapter 14
______________________________________________________________________
“A”, “B”, “C” and “D” are installed in your Monitor and have been
calibrated. Suppose the calibration data block of your Monitor
contains the information shown in Fig.14.14 (notice no filter is
installed in position E). Suppose you now install an optical filter in
position “E”. This filter has to be fully calibrated. Before performing a
zero-point and humidity-interference task one of the following filter
banks must be made active:
•
•
•
•
Filter
Filter
Filter
Filter
bank
bank
bank
bank
no.
no.
no.
no.
3,
2,
2,
2,
4 or
3 or
3 or
3, 4
5 for filter “A”;
5 for filter “B”;
4 for filter “C”;
or 5 for filter “D”.
Suppose you make filter bank no. 3 active for all the above filters
and filter bank no. 1 active for filter “E”. Then, after a zero-point
calibration the calibration data block would contain the information
shown in Fig.14.15. None of the original calibration data has been
overwritten by the newly-calculated calibration factors.
Fig.14.14 Illustration of the calibration data stored in the filter
banks of filters “A” to “D” before a zero-point calibration task
_____________________________________________________________________________
BE6011-16
1314 Photoacoustic Multi-gas Monitor
LumaSense Technologies A/S
1412 Photoacoustic Field Gas-Monitor
Page 224 of 280
Chapter 14
______________________________________________________________________
Fig.14.15 Illustration of the calibration data stored in the filter
banks of filters “A” to “E” after a zero-point calibration task
14.7
Zero-point Calibration
To calculate the concentration offset factor for a filter (during a
zero-point calibration) it is necessary to have a humidity gain
factor for the filter, and vice versa. If a humidity gain factor is not
stored in each of the filter banks, which are active during a zeropoint calibration, then it is necessary to perform a combined zeropoint and humidity-interference calibration task. The set-up of this
combined task is discussed in section 14.13.
As mentioned in the previous sections, the zero-point calibration task
is not selective. This means that you cannot choose zero-point
calibration of a single filter in the carousel (for example, when a new
optical filter has been installed). When you perform a zero-point
calibration then all the installed filters will be zero-point calibrated.
If it is only a newly-installed optical filter which needs to be
calibrated, then the same procedure used for an individual filter must
be used, see section 14.6.1. In this way you can protect your original
concentration offset factors.
_____________________________________________________________________________
BE6011-16
1314 Photoacoustic Multi-gas Monitor
LumaSense Technologies A/S
1412 Photoacoustic Field Gas-Monitor
Page 225 of 280
Chapter 14
______________________________________________________________________
14.7.1
Setting a Zero-point Calibration – PC Use
Note: the gas supply required during a zero-point calibration is a
pure gas that does not absorb infra-red light, e.g. pure nitrogen.
Note: if you want to be able to use this zero-point calibration in
connection with a span calibration of the water filter, then is vitally
important that the gas is perfectly dry.
The general equipment necessary to perform a calibration task is
described in section 14.4. Follow the procedure from step 1 to step 3
inclusive and then continue as follows:
Use the instructions in section 14.5.1. Click on the radio-button next
to Zero Point Calibration on the “Calibration” index card. Now
continue from step 8. in section 14.5.1.
_____________________________________________________________________________
BE6011-16
1314 Photoacoustic Multi-gas Monitor
LumaSense Technologies A/S
1412 Photoacoustic Field Gas-Monitor
Page 226 of 280
Chapter 14
______________________________________________________________________
14.7.2
Use
Setting-up a Zero-point Calibration – Stand-alone
Fig.14.16
Schematic diagram showing how to set-up a zero-point
calibration task (follow the arrows)
_____________________________________________________________________________
BE6011-16
1314 Photoacoustic Multi-gas Monitor
LumaSense Technologies A/S
1412 Photoacoustic Field Gas-Monitor
Page 227 of 280
Chapter 14
______________________________________________________________________
Use the Set-up Tree in Fig.14.16 to help you navigate through the
different screen displays.
Note: before starting a calibration, S.I.T (see section 14.3.3) and
Flushing Type (see section 7.2) need to be set so that they are the
same as those values used when monitoring.
1. For each installed filter, enter the no. of the filter bank where you
wish the Monitor to store the concentration offset factors
which will be calculated during the zero-point calibration task.
2. Press
MEASURE
displayed:
S3
S3
S1. The following text will be
PERFORM ZERO-POINT CALIBRATION ?
NO
YES
3. Follow the set-up of a zero-point calibration task by following the
black arrows in the schematic diagram shown in Fig.14.16.
The following text will appear on the display:
ZERO-POINT CALIB. CONNECT CLEAN, DRY AIR
AND PRESS ENTER WHEN READY
14.7.3
Use
Performing a Zero-point Calibration – Stand-alone
The general equipment necessary to perform a calibration task is
described in section 14.4. Follow the procedure from step 1 to step 3
inclusive and then continue as follows:
1.
a. Connect the free-end of the teflon tubing mentioned in step 3
to the pressure valve on a cylinder of zero gas (e.g. pure
nitrogen).
b. Gently open the pressure-valve on the gas cylinder.
c. Press ↵ .
d. Use the pressure-valve on the gas cylinder to regulate the flow
of gas so that when the Monitor’s pump is running there is a
positive flow of gas out of the flow meter. This will ensure that
the zero gas is not contaminated by atmospheric air.
The following text appears on the screen:
_____________________________________________________________________________
BE6011-16
1314 Photoacoustic Multi-gas Monitor
LumaSense Technologies A/S
1412 Photoacoustic Field Gas-Monitor
Page 228 of 280
Chapter 14
______________________________________________________________________
RESULTS NOT YET AVAILABLE
PLEASE WAIT
Once the first measurement result is available the screen text
illustrated above is replaced by a screen displaying the
measurement results – for example the following:
W: µ
: 11.3µV σ --- V
1
38.6°C
PRESS ENTER WHEN RESULTS ARE STABLE
As soon as measurement results are available they not only
appear on the display (see Fig.14.17) but are automatically
printed out on the printer, if the Monitor has been set up to print a
data log, see section 12.5. Remember to turn off the data log
when the calibration is complete.
Fig.14.17
Example of data displayed during a calibration (the text
below the display describes the displayed data)
Each time a sample of gas is drawn into the analysis cell the
signal is measured using all the installed optical filters and the
water-vapour filter (“W”) but, due to lack of space on the display,
the Monitor only displays the signal measured using the watervapour filter. You cannot scroll through the measurements. The
data-log print-out, however, shows the signal measured using all
installed filters as well as the water-vapour filter.
A maximum of 6 measurements are stored in the Monitor during
any calibration. The number (n) indicates how many
measurements are stored. When 7 measurements have been
performed the number (n) will show the number 6 because the
very first measurement is overwritten by the 7th measurement so
that only 6 measurements are still stored. When 8 measurements
_____________________________________________________________________________
BE6011-16
1314 Photoacoustic Multi-gas Monitor
LumaSense Technologies A/S
1412 Photoacoustic Field Gas-Monitor
Page 229 of 280
Chapter 14
______________________________________________________________________
have been completed the number (n) will also show 6 because the
results of the first and second measurements have been
overwritten by the 7th and 8th measurement results …and so on.
2. Let the Monitor continue measuring the zero gas until the
temperature in the cell is
stable. Look at the print-out of the
average and standard deviation measurements for (1) the watervapour and (2) all the other filters. When all these values have
stabilised calibration measurements, do not need to continue.
Continue to the next step.
3. Press ↵ .
This causes the following text to appear on the screen:
A:
µ : 5.28 µV σ : 94 nV
6
38.4°C
PRESS ENTER WHEN RESULTS ARE STABLE
These results have been shown on the data-log print-out. If they
have stabilised continue to the next Step.
4. Repeat step 3 until the signals measured with all the filters have
been displayed, stabilised and been “accepted”.
The text CALCULATION. PLEASE WAIT appears on the screen.
The Monitor only uses the last six measurement results when
calculating any calibration factor. The concentration offset
factors calculated during zero-point calibration of the filters,
are related to the cell noise measured in the cell when each of the
filters is being used.
If any calibration data is uncertain or unacceptable an error
message (marked by an asterisk) will appear on the screen after
the calibration factors have been calculated. Whenever an asterisk
is shown on the screen further information about the condition of
the Monitor can be obtained by pressing INFO.
Chapter 16 lists all the error messages connected with uncertain
calibration results and gives an explanation of their significance so
that the user can ascertain what action to take if such messages
are displayed after calibration.
14.8
Humidity Calibrations – PC Use
The water-vapour filter has two different functions. Its most
important function is to enable any measured signal to be
compensated for water-vapour interference. Its other function is to
measure the absolute concentration of water-vapour in air samples.
If you only wish to use the water-vapour filter to compensate for
water-vapour interference, then it only has to be zero-point
calibrated. If you wish to use it to measure the absolute
_____________________________________________________________________________
BE6011-16
1314 Photoacoustic Multi-gas Monitor
LumaSense Technologies A/S
1412 Photoacoustic Field Gas-Monitor
Page 230 of 280
Chapter 14
______________________________________________________________________
concentration of water vapour in air samples then it has to be zeropoint calibrated and span calibrated.
When the Humidity Calibration radio-button is selected two check
boxes appear in the Calibration Parameters field:
Perform Water Vapour Span Calibration: this is a span calibration
performed specifically on the water vapour filter installed in the
filter carousel, (position W). When you tick this check box, a
clean, wet gas with a known water concentration must be used.
This concentration must be entered in the Water Concentration
field.
Humidity Interference: this calibration is performed on all the
filters. However, like the zero point calibration, you are able to
select which filters receive the humidity gain factors when you
download them. Like the span calibration of the water filter, a
constant concentration of wet gas is required here. However, you
do not need to know the concentration of the water vapour in this
case.
These calibrations can be performed individually or both together,
which ever suits your needs.
Setting-up and performing a Humidity Calibration
Note: the gas supply required during a humidity calibration is a
clean, wet air supply, as described in section 14.4.1.
The general equipment necessary to perform a calibration task is
described in section 14.4. Follow the procedure from step 1 to step 3
inclusive and then continue as follows:
1. Follow the instructions in section 14.5.1 up to step 7.
2. Click on the radio-button next to Humidity Calibration on the
“Calibration” index card. Select one or both of the calibration
tasks.
If you select a Water Vapour Span Calibration, remember to enter
the correct water concentration value.
Now continue from step 8. in section 14.5.1.
14.9
Humidity-interference Calibrations – Standalone Use
As previously mentioned, the humidity-interference calibration task is
not selective. This means that you cannot choose humidity_____________________________________________________________________________
BE6011-16
1314 Photoacoustic Multi-gas Monitor
LumaSense Technologies A/S
1412 Photoacoustic Field Gas-Monitor
Page 231 of 280
Chapter 14
______________________________________________________________________
interference calibration of a single filter in the carousel (for example,
when a new optical filter has been installed). When you perform a
humidity-interference calibration then all the installed filters will be
humidity-interference calibrated.
If it is only a newly-installed optical filter which needs to be
humidity-interference calibrated, then the same procedure used for a
zero-point calibration of an individual filter must be used, see section
14.6.1. In this way you can protect your original humidity gain
factors.
_____________________________________________________________________________
BE6011-16
1314 Photoacoustic Multi-gas Monitor
LumaSense Technologies A/S
1412 Photoacoustic Field Gas-Monitor
Page 232 of 280
Chapter 14
______________________________________________________________________
14.9.1
Setting-up a Humidity-interference Calibration Task
Fig.14.18 Schematic diagram showing how to set-up a humidityinterference calibration task (follow the arrows)
To calculate the humidity gain factor for a filter (during a
humidity-interference calibration) it is necessary to have a
_____________________________________________________________________________
BE6011-16
1314 Photoacoustic Multi-gas Monitor
LumaSense Technologies A/S
1412 Photoacoustic Field Gas-Monitor
Page 233 of 280
Chapter 14
______________________________________________________________________
concentration offset factor for the filter, and vice versa. Note: If
a concentration offset factor is not stored in each of the filter
banks which are active during a zero-point calibration, then it
is necessary to perform a combined zero-point and humidityinterference calibration task. The set-up of this combined task is
discussed in section 14.13.
If you only wish to set-up a humidity-interference calibration task the
procedure is as follows:
1.
For each installed filter, enter the no. of the filter bank where
you wish the Monitor to store the humidity gain factors which
will be calculated during the humidity-interference calibration
task.
2.
Press MEASURE
displayed:
S3
S3
S1 then the following text will be
PERFORM ZERO-POINT CALIBRATION ?
NO
YES
3.
Follow the set-up of a humidity-interference calibration task by
following the black arrows in the schematic diagram shown in
Fig.14.18.
The following text will appear on the display:
HUM. INTERFERENCE. CONNECT CLEAN, WET AIR
AND PRESS ENTER WHEN READY
14.9.2
Performing a Humidity-interference Calibration
The general equipment necessary to perform a calibration task is
described in section 14.4 and illustrated in Fig.14.5.
The gas supply required during a humidity-interference calibration is
a supply of clean air containing a constant concentration of water
vapour.
1. Follow the procedure explained in section 14.4 from steps 1 to 3
inclusive and the continue as follows:
2.
a. Connect the outer end of the extra empty flask’s outlet tube
“B” to the teflon tubing which is connected to attachment point
3 of the “Y”-piece (see Fig.14.7).
Caution: the inner end of the empty-flask’s outlet tube “B” must
NEVER be covered by water.
_____________________________________________________________________________
BE6011-16
1314 Photoacoustic Multi-gas Monitor
LumaSense Technologies A/S
1412 Photoacoustic Field Gas-Monitor
Page 234 of 280
Chapter 14
______________________________________________________________________
b. Gently open the pressure-valve on the zero-gas cylinder.
c. Press ↵ .
d. Use the pressure-valve on the zero-gas cylinder to regulate
the flow of gas so that when the Monitor’s pump is running
there is a positive flow of gas out of the flow meter. This will
ensure that the wet, zero gas is not contaminated by
atmospheric air.
The following text appears on the screen:
RESULTS NOT YET AVAILABLE
PLEASE WAIT
The Monitor draws in the clean, wet air and measures the signal in
the cell with the water-vapour filter as well as with all the other
installed filters. Once the first measurement result is available the
screen text illustrated above is replaced by a screen displaying
signal measured using the water-vapour filter – for example the
following:
W : µ : 340 µV σ :--- V
1
39.3°C
PRESS ENTER WHEN RESULTS ARE STABLE
As soon as measurement results are available they do not only
appear on the display but are automatically printed out on the
printer, if the monitor is set up to print a data-log. Remember to
turn off the data-log when the calibration is complete.
Each time a sample of gas is drawn into the analysis cell the
signal is measured using all the installed optical filters and the
water-vapour filter (“W”) but, due to lack of space on the display,
the Monitor first only displays the signal measured using the
water-vapour filter. The data-log print-out, however, shows the
signal measured using all installed filters as well as the watervapour filter.
A maximum of 6 measurements are stored in the Monitor during
any calibration. The number (n) indicates how many
measurements are stored. When 7 measurements have been
performed the number (n) will show the number 6 because the
very first measurement is overwritten by the 7th measurement so
that only 6 measurements are still stored. When 8 measurements
have been completed the number (n) will also show 6 because the
results of the first and second measurements have been
overwritten by the 7th and 8th measurement results … and so on.
_____________________________________________________________________________
BE6011-16
1314 Photoacoustic Multi-gas Monitor
LumaSense Technologies A/S
1412 Photoacoustic Field Gas-Monitor
Page 235 of 280
Chapter 14
______________________________________________________________________
3. Let the Monitor continue measuring the clean, wet air until the
temperature in the cell is stable. Look at the print-out of the
average and standard deviation measurements for (1) the watervapour and (2) all the other filters. When all these values have
stabilised, calibration measurements do not need to continue.
Continue to the next Step.
4. Press ↵ .
This will cause the results of measurements made with all the
other installed filters to be displayed, for example:
A : µ : 19.34 µV σ : 212 nV
6
39.3°C
PRESS ENTER WHEN RESULTS ARE STABLE
These results have been printed out on the data-log printer. If
they have stabilised continue to the next Step.
5. Repeat step 4 until the signals measured with all the filters have
been displayed, stabilised and been “accepted”.
The text CALCULATING PLEASE WAIT appears on the screen.
The Monitor only uses the last six measurement results when
calculating any calibration factor. The humidity gain factors
calculated during humidity-interference calibration of the filters,
are a measure of the sensitivity of each filter to water-vapour interference.
If any calibration data is uncertain or unacceptable an error message
(marked by an asterisk) will appear on the screen after the
calibration factors have been calculated. Whenever an asterisk is
shown on the screen further information about the condition of the
Monitor can be obtained by pressing INFO.
Chapter 16 lists all the error messages connected with uncertain
calibration results and gives an explanation of their significance so
that you can ascertain what action to take if such messages are
displayed after calibration.
14.10
Cross-interference Calibrations
If any gas measured by the installed optical filters absorbs light from
more than one of the installed optical filters, then it is advisable to
calibrate for cross-interference (see section 14.1). Crossinterference calibration cannot be performed alone! It has to be
performed together with the span calibration of each of the installed
optical filters. Cross-interference calibration is not selective, that
_____________________________________________________________________________
BE6011-16
1314 Photoacoustic Multi-gas Monitor
LumaSense Technologies A/S
1412 Photoacoustic Field Gas-Monitor
Page 236 of 280
Chapter 14
______________________________________________________________________
is, if you select to perform a cross-interference calibration, then each
time a gas is supplied to the Monitor during a span calibration, the
signal in the cell is measured using each installed optical filter. You
cannot choose which filters should be calibrated for crossinterference from a particular gas.
Section 14.11 includes information about how to set up a combined
cross-interference and span calibration task.
14.11
Span Calibration
Before calculating the conversion factor for a filter (during span
calibration) a concentration offset factor and a humidity gain
factor must be in the filter bank which is selected for the filter
during span calibration. Span calibration of a filter can therefore only
be done after the filter has already been zero-point and humidityinterference calibrated.
During span calibration a supply of a particular gas (e.g. gas A1) of
known concentration is attached to the air-inlet of the Monitor and
the total signal in the cell is measured using the water-vapour filter
and the filter which is being span calibrated (for example “A”). As
filter “A” has already been calibrated for humidity interference, the
total signal (Vtotal) measured with filter “A” can be compensated for
any signal produced by water-vapour’s absorption of light from filter
“A” (VH2O) during the span calibration task. This means that your
span gas does not have to be perfectly dry. As the filter has already
been zero-point calibrated, the cell noise Voffset (when filter “A” is
used) is known, and therefore the span calibration curve can be
drawn (see Fig.14.19).
_____________________________________________________________________________
BE6011-16
1314 Photoacoustic Multi-gas Monitor
LumaSense Technologies A/S
1412 Photoacoustic Field Gas-Monitor
Page 237 of 280
Chapter 14
______________________________________________________________________
Fig.14.19
Curve showing a linear span-calibration curve
Choosing a filter bank
If a filter (e.g. “A”) has already been calibrated to measure a gas
(e.g. A1) and you wish to calibrate with gas A1 again, then select the
filter bank containing the gas conversion factor for gas A1. Online
users can do this when downloading the calibration factors. Standalone users should do this before setting-up and performing the span
calibration task. The gas conversion factor calculated during the
span calibration will then just overwrite the gas conversion factor
calculated during the previous span calibration of the filter with this
gas.
If you wish to span calibrate a filter to measure more than one gas,
then select a new filter bank each time you span calibrate with a
different gas. In this way the conversion factor for each gas is
stored in separate filter banks (for stand-alone use see Fig.14.14).
The gas conversion factor stored in the selected filter bank during
a span calibration task will be overwritten by the new gas
conversion factor calculated during the span calibration of the
filter.
_____________________________________________________________________________
BE6011-16
1314 Photoacoustic Multi-gas Monitor
LumaSense Technologies A/S
1412 Photoacoustic Field Gas-Monitor
Page 238 of 280
Chapter 14
______________________________________________________________________
Gas to be Used During Span Calibration
The gas you need to use during span calibration must be the gas you
wish to measure with the filter.
Type of Span Calibration – Single-point or Two-point?
Fig.14.20a Graph showing a non- linear span-calibration curve which can
be plotted using the signals measured during a two-point span
calibration task
Fig.14.20b Graph showing a non- linear measurement curve
_____________________________________________________________________________
BE6011-16
1314 Photoacoustic Multi-gas Monitor
LumaSense Technologies A/S
1412 Photoacoustic Field Gas-Monitor
Page 239 of 280
Chapter 14
______________________________________________________________________
The question about whether to perform a single- or a two-point span
calibration is difficult to answer, as it is dependent on how linear the
relationship is between a gas’s concentration and the signal it
produces in the cell (see Fig.14.19, Fig.14.20a and Fig.14.20b).
However, we can give you some guidelines on whether you have to
perform a single-or a two-point span-calibration.
•
Single-point calibration should be used when you wish to measure
in the linear range. We define the linear range as the dynamic
concentration range in which you can measure with an error of
5% of the real concentration (this is illustrated in Fig.14.20b). For
the most common gases, the linear range is from its detection
limit and up to 10 000 times its detection limit.
•
Two-point calibration is recommended to be used when you wish
to measure in the non-linear range and when you wish to
measure over a dynamic range of 100 000.
Gas Concentrations – Single-point Calibration
If a single-point span-calibration is performed then the span gas
should have a concentration which is at least 100 times its detection
limit and preferable not more than the highest concentration you
expect to measure.
For certain gases it can be inexpedient to use a concentration of at
least 100 times its detection limit, e.g. if you wish to measure a
poisonous gas with a high detection limit, it would be natural to use
a lower concentration. However, this means that the noise and
vibration will have a larger influence on the calibration. This must,
therefore, be taken into account when considering using a lower
concentration.
Gas Concentrations – Two-point Calibration
During a two-point span calibration, the total signal in the cell (Vlow)
is measured first with a low concentration (Clow) of span gas, and
then the total signal in the cell (Vhigh) is measured with a high
concentration (Chigh) of span gas. This enables the Monitor to
compensate for any unlinearity in the relationship between the signal
measured in the cell and the concentration of the gas in the cell (this
is illustrated, for a gas A1, in Fig.14.20a).
Here are some guidelines about the concentration of gas you should
use during a two-point span calibration:
•
The Low Concentration should be 10 to 30% of the highest
concentration you expect to measure.
_____________________________________________________________________________
BE6011-16
1314 Photoacoustic Multi-gas Monitor
LumaSense Technologies A/S
1412 Photoacoustic Field Gas-Monitor
Page 240 of 280
Chapter 14
______________________________________________________________________
If the desired measurement range is mainly within the linear
range then the low concentration should be between 1000 and 10
000 times the detection limit.
If the desired measurement range is mainly above the linear
range then the low concentration should be more than 10 000
times the detection limit.
•
The High Concentration should be 75% to 100% of the highest
concentration you expect to measure, but no higher than this.
Simple Test to Determine the Linearity
Let us assume that you wish to measure a gas over a dynamic range
from 100 ppm and 3000 ppm of a gas that has a detection limit of
0.3 ppm.
In this case, the range in which you want to measure is from 333
times to 10 000 times the detection limit. With our general
guidelines, you’re not able to decide whether you have to perform a
single- or two-point calibration. Therefore, we advise you to perform
the following test:
1. Perform a single-point calibration with a low concentration of the
gas. Use 10% of the highest expected concentration level. In this
case, use 300 ppm (1000 times the detection limit).
2. Perform a measurement with a high concentration of the gas.
Use, for example, 90% of the highest expected concentration
level. In this case, use 2700 ppm.
If the measured gas concentration differs by more than 5% from the
real concentration, then a two-point calibration with 2 gas
concentrations is recommended.
In the example in Fig.14.20b, we have measured 2400 ppm with
2700 ppm gas. This gives an error of 11% and an even greater error
at the highest concentration level.
14.11.1 Setting-up a Span Calibration – PC Use
If the span gas used during a span calibration task absorbs any of
the light from the other installed optical filters, then it is advisable to
perform a cross-interference calibration. This means that during
span calibration the signal in the cell is not only measured with the
water-vapour filter and the filter being span calibrated, but is also
measured with all the other installed optical filters. Note that crossinterference calibration cannot be performed alone, it has to be
performed together with span calibration.
_____________________________________________________________________________
BE6011-16
1314 Photoacoustic Multi-gas Monitor
LumaSense Technologies A/S
1412 Photoacoustic Field Gas-Monitor
Page 241 of 280
Chapter 14
______________________________________________________________________
The general equipment necessary to perform a calibration task is
described in section 14.4. Follow the procedure from step 1 to step 3
inclusive and then follow the instructions in section 14.5.1 up to step
7.
Calibration index card
1. Click in the Gas Span Calibration radio-button. The Calibration
Parameters group is displayed as shown, see Fig.14.21.
2. Select the filter position you want to calibrate.
If you are recalibrating the monitor, using the same filter positions
and filter banks, then the gas name displayed here is likely to be
correct. If not go to step 10.
If you are calibrating for a new gas, or an existing gas in a new
filter bank, then the gas name and molecular weight need to be
typed in. This is done via the “Gas” index card. Go to step 10.
3. If you require a Single-point calibration, go to step 4.
If you require a Two-point calibration, go to step 5.
4. Ensure that the Perform Two-point Calibration check box is empty.
_____________________________________________________________________________
BE6011-16
1314 Photoacoustic Multi-gas Monitor
LumaSense Technologies A/S
1412 Photoacoustic Field Gas-Monitor
Page 242 of 280
Chapter 14
______________________________________________________________________
Fig.14.21
Span Calibration dialogue
a. Type in the concentration of the calibration gas to be
measured.
b. If a cross-interference calibration is necessary, tick the check
box.
If you have not already set the S.I.T. values, click on the “Gas” index
card and go to step 13. If you have set all the parameters on the
“Gas” index card, return to the basic set-up instructions section
14.5.1 and continue from step 11.
5. Click in the Perform Two-point Calibration check box.
6. Click on either the High Gas Conc. or Low Gas Conc. radio-button.
7. Type in the correct gas concentration.
8. If you require a cross-interference calibration, click in this check
box when the High Gas Conc. radio-button is selected.
9. Repeat steps 6. to 8. selecting the other gas concentration.
If you have not already set the S.I.T. values, click on the “Gas” index
card and go to step 13. If you have set all the parameters on the
_____________________________________________________________________________
BE6011-16
1314 Photoacoustic Multi-gas Monitor
LumaSense Technologies A/S
1412 Photoacoustic Field Gas-Monitor
Page 243 of 280
Chapter 14
______________________________________________________________________
“Gas” index card, return to the basic set-up instructions section
14.5.1 and continue from step 11.
Gas index card
10.
Click on the “Gas” index card.
11. If you want to recalibrate using gas names already stored in
the monitor’s filter banks, click in the Gas Name fields and select
the desired gas names. Repeat this for all the loaded filter
positions.
If you want to calibrate with a new gas, select the correct filter,
pull down the Gas Name field to show all the filter banks. Click in
the desired filter bank position and type in the gas name. Type in
the correct molecular weight in the field next to the gas name.
12. Repeat step 11 until you have the correct gas names and
molecular weights displayed for all the filters.
13. Click in the Sample Integration Time field and select the
correct time.
Note: if you select Advanced, then you need to define the S.I.T.
for the individual filter positions, including the water filter. These
values should be the same as those used when monitoring.
If you are still setting up the calibration, click on the “Calibration”
index card and go to step 3.
If you have already completed the “Calibration” index card, return to
the basic set-up instructions, section 14.5.1 and continue from step
11.
Note: you need to span calibrate each filter individually. Therefore,
these instructions need to be repeated to collect raw measurement
data for each gas you want to span calibrate.
_____________________________________________________________________________
BE6011-16
1314 Photoacoustic Multi-gas Monitor
LumaSense Technologies A/S
1412 Photoacoustic Field Gas-Monitor
Page 244 of 280
Chapter 14
______________________________________________________________________
14.11.2 Setting-up a Span Calibration – Stand-alone Use
Fig.14.22
Schematic diagram showing how to set-up a span
calibration task (follow the arrows)
_____________________________________________________________________________
BE6011-16
1314 Photoacoustic Multi-gas Monitor
LumaSense Technologies A/S
1412 Photoacoustic Field Gas-Monitor
Page 245 of 280
Chapter 14
______________________________________________________________________
Fig.14.23 Schematic diagram showing how to set-up a combined
cross-interference and span calibration task (follow the arrows)
If the span gas used during a span calibration task absorbs any of
the light from the other installed optical filters, then it is advisable to
select to perform a cross-interference calibration. This means
that during span calibration the signal in the cell is not only
_____________________________________________________________________________
BE6011-16
1314 Photoacoustic Multi-gas Monitor
LumaSense Technologies A/S
1412 Photoacoustic Field Gas-Monitor
Page 246 of 280
Chapter 14
______________________________________________________________________
measured with the water-vapour filter and the filter being span
calibrated, but is also measured with all the other installed optical
filters. Note that cross-interference calibration cannot be performed
alone, it has to be performed together with span calibration.
1. For each filter being span calibrated, enter the No. of the filter
bank where you wish the Monitor to store the conversion
factors which will be calculated during the span calibration task.
2. Press MEASURE
displayed:
S3
S3
S1 then the following text will be
PERFORM ZERO-POINT CALIBRATION?
NO
YES
3.
a. If you only wish to span calibrate filters, follow the set-up of a
span calibration task by following the black arrows in the
schematic diagram shown in Fig.14.22.
b. If you wish to perform cross-interference calibration as well as
span calibration, follow the set-up of the combined calibration
task by following the black arrows in the schematic diagram
shown in Fig.14.23.
The following text will appear on the display:
CONNECT (the name of the gas appears here)
XXXXXXmg/m3
AND PRESS ENTER WHEN READY
Note: if the gas concentration on the “Analysis Certificate” is given in
ppm then the following formula can be used to convert from parts
per million units (ppm) to mg/m3:
For a gas at 20°C and at 1 atmosphere pressure:
Concentration (in mg/m3) =
Concentration (in ppm) x Molecular Weight (in g)
24,04
14.11.3 Performing a Span Calibration – Stand-alone Use
The general equipment necessary to perform a calibration task is
described in section 14.4. Follow the procedure from step 1 to step 3
inclusive and then continue as follows:
_____________________________________________________________________________
BE6011-16
1314 Photoacoustic Multi-gas Monitor
LumaSense Technologies A/S
1412 Photoacoustic Field Gas-Monitor
Page 247 of 280
Chapter 14
______________________________________________________________________
1.
a. Connect the free-end of the teflon tubing mentioned in step 3
to the pressure valve on a cylinder of calibration gas.
b. Press ↵ .
c. Gently open the pressure-valve on the
regulate the flow of gas so that when the
running there is a positive flow of gas out
This will ensure that the calibration gas is
mospheric air.
gas cylinder and
Monitor’s pump is
of the flow meter.
not diluted by at-
The following text appears on the screen:
RESULTS NOT YET AVAILABLE
PLEASE WAIT
Once the first measurement result is available the screen text
illustrated above is replaced by a screen displaying the
measurement results – for example the following:
W : µ : 5.34 µV σ : 212 nV
3
40.4 °C
PRESS ENTER WHEN RESULTS ARE STABLE
As soon as measurement results are available, they not only
appear on the display (see Fig.14.17) but are automatically
printed out on the printer, if the Monitor has been set up to print
a data log, see section 12.5. Remember to turn off the data log
when the calibration is complete.
Each time a sample of gas is drawn into the analysis cell the
signal is measured using both optical filter “A” and the watervapour filter (“W”) but, due to lack of space on the display, the
Monitor only displays the signal measured using the water-vapour
filter. The data-log print-out, however, shows the signal measured
using both the water-vapour filter and filter “A”. If crosscompensation calibration was also selected in the calibration
set-up, then the signal is measured in the cell using all the
installed filters.
A maximum of 6 measurements are stored in the Monitor during
any calibration. The number (n) indicates how many
measurements are stored. When 7 measurements have been
performed the number (n) will show the number 6 because the
very first measurement is overwritten by the 7th measurement so
that only 6 measurements are still stored. When 8 measurements
have been completed the number (n) will also show 6 because the
results of the first and second measurements have been
overwritten by the 7th and 8th measurement results … and so on.
_____________________________________________________________________________
BE6011-16
1314 Photoacoustic Multi-gas Monitor
LumaSense Technologies A/S
1412 Photoacoustic Field Gas-Monitor
Page 248 of 280
Chapter 14
______________________________________________________________________
2. Let the Monitor continue measuring the span gas A until the
temperature is stable. Look at the print-put of the average and
standard deviation measurements for (1) the water-vapour and
(2) the filter “A”. When these values have stabilised for both
filters, span calibration measurements do not need to continue.
3. Press ↵ .
This causes the following text to appear on the screen:
A: µ:
123.8 μV σ : 617 nV
6
40.4 °C
PRESS ENTER WHEN RESULTS ARE STABLE
These results have been shown on the data-log print-out. If they
have stabilised continue to the next Step.
4. Press ↵ .
The text CALCULATING CALIBRATION FACTORS – PLEASE
WAIT appears on the screen.
The Monitor only uses the last six measurement results when
calculating any calibration factor. The conversion factor (in mg/m3
per volt), which is calculated during a span calibration, is the factor
which allows the Monitor to relate the signal produced by the gas to
the concentration of gas in the cell. The cross-interference
factors, which are calculated during cross-compensation
calibration are those factors which allow the Monitor to compensate
for any interference gas A has on the other installed optical filters.
If any calibration data is doubtful or unacceptable an error message
(marked by an asterisk) will appear on the screen after the
calibration factors have been calculated. Whenever an asterisk is
shown on the screen further information about the condition of the
Monitor can be obtained by pressing the INFO button.
Chapter 16 lists all the error messages connected with doubtful
calibration results and gives an explanation of their significance so
that the user can ascertain what action to take if such messages are
displayed after calibration.
14.11.4 Use of Nafion Tubing during Span Calibration of
UA0983, UA0984 and UA0985.
A Nafion tubing (an optional accessory) is required during the span
calibration of UA0983 e.g carbon dioxide (CO2),UA0984 e.g. carbon
monoxide (CO) and UA0985 e.g. dinitrogen oxide (N2O). The Teflon
_____________________________________________________________________________
BE6011-16
1314 Photoacoustic Multi-gas Monitor
LumaSense Technologies A/S
1412 Photoacoustic Field Gas-Monitor
Page 249 of 280
Chapter 14
______________________________________________________________________
tubing connected to attachment point no. 3 of the “Y”-piece should
be cut in half and a tubing should be connected between the two cutends of the teflon tubing using the tube fittings supplied for the
purpose (Fig.14.24).
Fig.14.24 Diagram showing how to use Nafion tubing when span
calibrating with one of the following optical filters: UA0983, UA0984
or UA0985
14.12
Calibration of the Water-vapour Filter – Standalone Use
The water-vapour filter has two different functions. Its most
important function is to enable any measured signal to be
compensated for water-vapour interference. Its other function is to
measure the absolute concentration of water-vapour in air samples.
If you only wish to use the water-vapour filter to compensate for
water-vapour interference, then it only has to be zero-point
calibrated. If you wish to use it to measure the absolute
concentration of water vapour in air samples then it has to be zeropoint calibrated and span calibrated.
It is vitally important to accurately zero-point calibrate the watervapour filter as this influences the Monitor’s ability to compensate for
interference from water vapour. This demands that the zero-gas you
use during the zero-point calibration of the filter must be perfectly
dry.
_____________________________________________________________________________
BE6011-16
1314 Photoacoustic Multi-gas Monitor
LumaSense Technologies A/S
1412 Photoacoustic Field Gas-Monitor
Page 250 of 280
Chapter 14
______________________________________________________________________
14.12.1 Setting-up a Zero-point Calibration of the Watervapour Filter
If you wish to zero-point calibrate the water-vapour filter you must
zero-point calibrate all the other installed optical filters. The
concentration offset factors calculated during zero-point
calibration of the filter “A” to “E” will be stored in the filter banks,
(those active during calibration). Check, therefore, that you make
the relevant filter banks active for these filters before calibrating
them. This is discussed in more detail in section 14.3.3.
The procedure for setting-up a zero-point calibration of the watervapour filter is as follows:
1. Press Measure
displayed:
S3
S3
S1 then the following text will be
PERFORM ZERO-POINT CALIBRATION ?
NO
YES
2. Follow the set-up of a zero-point calibration of the water-vapour
filter by following the black arrows in the schematic diagram
shown in Fig.14.25.
The following text will appear:
ZERO-POINT CALIB. CONNECT CLEAN, WET AIR
AND PRESS ENTER WHEN READY
_____________________________________________________________________________
BE6011-16
1314 Photoacoustic Multi-gas Monitor
LumaSense Technologies A/S
1412 Photoacoustic Field Gas-Monitor
Page 251 of 280
Chapter 14
______________________________________________________________________
Fig.14.25 Schematic diagram showing how to set-up a zero-point
calibration task for the water-vapour filter (follow the arrows)
_____________________________________________________________________________
BE6011-16
1314 Photoacoustic Multi-gas Monitor
LumaSense Technologies A/S
1412 Photoacoustic Field Gas-Monitor
Page 252 of 280
Chapter 14
______________________________________________________________________
14.12.2 Performing a Zero-point Calibration of the Watervapour Filter
As explained in the previous section, a zero-point calibration of the
water-vapour filter has to be done together with the zero-point
calibration of the other installed optical filters. The latter task has
been fully described in section 14.7. It is worth-while to emphasise
again that it is vitally important to use perfectly dry zero-gas (that
is, zero-gas which contains 0% water-vapour) during this calibration.
Note that during the zero-point calibration of filters “A” to “E” (task
1, shown below), and during the combined zero-point calibration of
filters “A” to “E” and the water-vapour filter (task 2, shown below),
a zero-gas supply is attached to the air-inlet of the Monitor. The
Monitor measures the signal in the cell using the water-vapour filter
and all the other installed optical filters. Signals measured with filters
“A” to “E” enable the concentration offset factors for filters “A” to
“E” to be stored in the filter banks which are active during
calibration. However, the signal measured with the water-vapour
filter is used differently:
In Task 1:
The signal measured with the water-vapour filter is used to
compensate all measured signals for any interference caused by the
presence of any residual water-vapour in the zero-gas supply.
In Task 2:
The signal measured with the water-vapour filter is used to update
the concentration offset factor for the water-vapour filter. This
means that the signals measured with filters “A” to “E” cannot be
compensated for the presence of any water vapour present. This is
why it is vitally important to use perfectly dry zero-gas during
this task.
Please refer to section 14.7.3 for details about how to perform a
zero-point calibration task.
14.12.3 Setting-up a Span Calibration of the Water-vapour
Filter
Remember that span calibration of the water-vapour filter is only
necessary if you wish to measure the absolute concentration of water
vapour in air samples. If the water-vapour filter is not span
calibrated you will not be able to measure the concentration of water
vapour in gas samples during a monitoring task.
_____________________________________________________________________________
BE6011-16
1314 Photoacoustic Multi-gas Monitor
LumaSense Technologies A/S
1412 Photoacoustic Field Gas-Monitor
Page 253 of 280
Chapter 14
______________________________________________________________________
Before the water-vapour filter can be span calibrated, it has to be
zero-point calibrated, that is, a concentration offset factor for the
water-vapour filter must be stored in the Monitor’s calibration data
block.
During span calibration of the water-vapour filter it is necessary to
attach a supply of zero-gas containing a known concentration of
water vapour to the Monitor. As explained in the Humidityinterference Calibration (Section 14.9.2) it is important to use watervapour whose concentration is below the saturated vapour pressure
of water-vapour at the temperature of the room where calibration is
to be performed, otherwise water-vapour will condense out in the
analysis cell and damage it.
Before setting-up the span calibration of the water-vapour filter go
into Set-Up mode and select “Tdew” as a humidity unit. Then when
you have to enter the concentration of the water-vapour you will use
during calibration. Always use water concentrations at least 2°C
below the ambient room temperature. For example, if the ambient
room temperature is 20°C then you can ENTER WATER-VAPOUR
CONC as 18°Tdew.
The procedure for setting-up a span calibration of the water-vapour
filter is as follows:
1.
Press
displayed:
Measure
S3
S3
S1 then the following text will be
PERFORM ZERO-POINT CALIBRATION ?
NO
YES
2.
Follow the set-up of a span calibration of the water-vapour filter
by following the black arrows in the schematic diagram shown in
Fig.14.26.
The following text will appear:
CONNECT WATER-VAPOUR
18.0 Tdew
AND PRESS ENTER WHEN READY
_____________________________________________________________________________
BE6011-16
1314 Photoacoustic Multi-gas Monitor
LumaSense Technologies A/S
1412 Photoacoustic Field Gas-Monitor
Page 254 of 280
Chapter 14
______________________________________________________________________
Fig.14.26 Schematic diagram showing how to set-up a span
calibration task for the water-vapour filter (follow the arrows)
_____________________________________________________________________________
BE6011-16
1314 Photoacoustic Multi-gas Monitor
LumaSense Technologies A/S
1412 Photoacoustic Field Gas-Monitor
Page 255 of 280
Chapter 14
______________________________________________________________________
14.12.4 Performing a Span Calibration of the Water-vapour
Filter
Section 14.4.1 describes a good method of producing water-vapour
of known concentration. The directions for performing a span
calibration of water-vapour filter are similar to those for performing a
humidity-interference calibration of the other installed filters is as
described in section 14.9.2. In both calibration tasks the signal in the
cell is measured when a supply of zero gas containing a constant
concentration of water vapour is attached to the Monitor. There are,
however, two differences:
1. During a humidity-interference calibration the signal is measured
using each of the installed filters (including the water-vapour
filter), whereas during the span calibration of the water-vapour
filter the signal is only measured with the water-vapour filter.
2. During a humidity-interference calibration, it is not necessary to
know the concentration of water-vapour supplied to the cell as it
is only necessary to measure the size of each signal (with filters
“A” – “E”) relative to the size of the signal measured with the
water-vapour filter. However, during a span calibration of the
water-vapour filter it is necessary to know the exact
concentration of water-vapour supplied to the cell, because during
this calibration the conversion factor is calculated. This factor
relates the measured signal to the concentration of water-vapour
in the cell.
Follow the procedure described in section 14.9.2.
14.13
Setting-up
a
Combined
Zero-point
and
Humidity-interference Calibration – Standalone Use
We have explained in previous sections of this chapter (section 14.7
and section 14.9.1) that a zero-point calibration can only be
performed alone if a humidity gain factor is already stored in each
of the filter banks which are active during the zero-point calibration
task. Likewise, a humidity-interference calibration can only be
performed alone if a concentration offset factor is already stored
in each of the filter banks which is active during the humidityinterference calibration task.
If the necessary calibration factors are not stored in the Monitor’s
memory, a zero-point calibration task has to be performed together
with a humidity-interference calibration task.
_____________________________________________________________________________
BE6011-16
1314 Photoacoustic Multi-gas Monitor
LumaSense Technologies A/S
1412 Photoacoustic Field Gas-Monitor
Page 256 of 280
Chapter 14
______________________________________________________________________
The procedure for setting-up a combined zero-point and humidityinterference calibration task is as follows:
Fig.14.27 Schematic diagram showing how to set-up a combined
zero-point and humidity-interference calibration task (follow the
arrows)
_____________________________________________________________________________
BE6011-16
1314 Photoacoustic Multi-gas Monitor
LumaSense Technologies A/S
1412 Photoacoustic Field Gas-Monitor
Page 257 of 280
Chapter 14
______________________________________________________________________
1. Press Measure
displayed:
S3
S3
S1 then the following text will be
PERFORM ZERO-POINT CALIBRATION ?
NO
YES
2. Follow the set-up of a combined zero-point and humidityinterference calibration by following the black arrows in the
schematic diagram shown in Fig.14.27.
The following text will appear:
ZERO-POINT CALIB. CONNECT CLEAN, DRY AIR
AND PRESS ENTER WHEN READY
3. Refer to section 14.7.3 for the practical details of a zero-point
calibration task.
When the zero-point calibration task is complete, the following text
appears on the screen:
HUM. INTERFERENCE. CONNECT CLEAN, DRY AIR
AND PRESS ENTER WHEN READY
4. Refer to Section 14.9.2 for the practical details of a humidityinterference calibration task.
14.14
Setting-up any Combined Calibration – Standalone Use
Although we have separated the various calibration tasks and
described how to set them up and perform them alone, it is, of
course possible to set-up any combination of calibration tasks, for
example, that combining the zero-point and humidity-interference
calibration tasks described in Section 14.13.
After setting-up any combined calibration task, the Monitor responds
by telling you about which gas supply is required for each calibration
task.
When the combined calibration task is complete,
CALCULATING. PLEASE WAIT appears on the screen.
the
text
If any calibration data is uncertain or unacceptable an error message
(marked by an asterisk) will appear on the screen after the
calibration factors have been calculated. Whenever an asterisk is
_____________________________________________________________________________
BE6011-16
1314 Photoacoustic Multi-gas Monitor
LumaSense Technologies A/S
1412 Photoacoustic Field Gas-Monitor
Page 258 of 280
Chapter 14
______________________________________________________________________
shown on the screen further information about the condition of the
Monitor can be obtained by pressing INFO.
Chapter 16 lists all the error messages connected with uncertain
calibration results and gives an explanation of their significance so
that the user can ascertain what action to take if such messages are
displayed after calibration.
_____________________________________________________________________________
BE6011-16
1314 Photoacoustic Multi-gas Monitor
LumaSense Technologies A/S
1412 Photoacoustic Field Gas-Monitor
Page 259 of 280
Chapter 15
______________________________________________________________________
Chapter 15
Installing the Optical Filters
July 2009
_____________________________________________________________________________
BE6011-16
1314 Photoacoustic Multi-gas Monitor
LumaSense Technologies A/S
1412 Photoacoustic Field Gas-Monitor
Page 260 of 280
Chapter 15
______________________________________________________________________
15.1
Introduction
Each of the optical filters available for use with the Monitor, have a
“UA” number printed on them. The “UA” numbers run from UA 0968
– UA 0989 and UA 0936. The Monitor has a carousel wheel on which
relevant optical filters are mounted. There are six mounting holes in
the carousel. Each mounting hole is labelled with one of the following
letters: “A”, “B”, “C”, “D”, “E” and “W” (see Fig.15.1). Before leaving
the factory a special “water” filter is mounted in the position marked
“W” and user-chosen optical filters are mounted in the other
positions of the carousel. If less than 6 optical filters are installed in
the carousel, blank plates are mounted in those positions of the
carousel where no optical filter has been installed.
Fig.15.1
The filter carousel in the Monitor
_____________________________________________________________________________
BE6011-16
1314 Photoacoustic Multi-gas Monitor
LumaSense Technologies A/S
1412 Photoacoustic Field Gas-Monitor
Page 261 of 280
Chapter 15
______________________________________________________________________
Blank plates may only be removed from the carousel if they are
replaced by a chosen optical filter. Each blank plate is held in position
on the wheel by three lugs (see Fig.15.1). The blank plate can be
taken out of the mounting hole by bending the metal lugs towards
the centre of the plate using your fingernail. The chosen optical filter
is installed in the open mounting hole and “locked” into position on
the carousel with a “locking” spring.
15.1.1
Installing an Optical Filter in the Monitor.
Important! Always use gloves when handling the optical
filters.
1. Remove the top lid.
(For 1314 see section 2.3.1 and for 1412 see section 2.3.2).
2. Remove the three screws, which holds the filter-wheel pulley:
_____________________________________________________________________________
BE6011-16
1314 Photoacoustic Multi-gas Monitor
LumaSense Technologies A/S
1412 Photoacoustic Field Gas-Monitor
Page 262 of 280
Chapter 15
______________________________________________________________________
3. Remove the pulley:
4. Take out the Filter Wheel:
5. Using clean gloves lift the chosen optical filter out of its box by
holding its edge between the thumb and forefinger.
_____________________________________________________________________________
BE6011-16
1314 Photoacoustic Multi-gas Monitor
LumaSense Technologies A/S
1412 Photoacoustic Field Gas-Monitor
Page 263 of 280
Chapter 15
______________________________________________________________________
6. Insert the Optical Filters and fit the locking spring. Check that the
locking spring is fitted correctly around the groove of the optical
filter.
7. Reinsert the Filter Wheel with the mark “Face IR-Source” towards
the IR-source..
8. Note the UA number of each optical filter and its position in the
filter carousel (for example, UA 0983 in position “B”, UA 0988 in
position “D” and so on).
9. Enter the correct UA number of the optical filter installed in each
position (“A” to “E”) of the filter carousel – section 14.3.3 provides
details. This is a very important step as it determines the set of
Optical Filter Factors, which will be used during the calibration of
each optical filter. If the UA number is not correctly entered then
the filter cannot be calibrated to measure any gas accurately.
_____________________________________________________________________________
BE6011-16
1314 Photoacoustic Multi-gas Monitor
LumaSense Technologies A/S
1412 Photoacoustic Field Gas-Monitor
Page 264 of 280
Chapter 16
______________________________________________________________________
Chapter 16
Messages Related to Calibration
July 2009
_____________________________________________________________________________
BE6011-16
1314 Photoacoustic Multi-gas Monitor
LumaSense Technologies A/S
1412 Photoacoustic Field Gas-Monitor
Page 265 of 280
Chapter 16
______________________________________________________________________
All the possible error messages connected with calibration results are
discussed in this chapter. Messages fall into three calibration
categories: (1) successful; (2) uncertain and (3) invalid. An
explanation is given of each message and its significance so that the
user can ascertain what action to take if such messages are
displayed after calibration.
16.1
“Successful” Calibration Messages
The messages listed below indicate (1) that the calibration task you
have just performed has been successful, and (2) that the calibration
factor calculated during the calibration task has been stored in the
filter bank which was selected/active during the calibration task.
ZERO-POINT CALIBRATION SUCCESSFUL
HUM. INTERFERENCE CALIBRATION SUCCESSFUL
ZERO-POINT/HUM. INTERF. CALIB. SUCCESSFUL
GAS X* SINGLE-POINT CALIBRATION SUCCESSFUL
GAS X* TWO-POINT CALIBRATION SUCCESSFUL
Where Gas X is the gas used during the span calibration of the filter
installed in position “X” of the filter carousel (Where: X = “A” to “E”
or “W”).
16.2
“Successful *” Calibration Messages
The messages listed below indicate (1) that the calibration task you
have just performed is perhaps not as good as can be expected; (2)
that the calibration factor which has just been calculated has been
stored in the filter bank which was active during the calibration task;
and (3) that you will have to judge the validity of the calibration. If
you judge it to be invalid then the task will have to be repeated so
that the calibration factor stored in the filter bank can be overwritten
by a new and valid factor.
You can find out why there is uncertainty about the validity of the
calibration factor by pressing INFO.
The messages displayed when INFO is used are discussed in section
16.4.
ZERO-POINT CALIBRATION SUCCESSFUL*
HUM. INTERFERENCE CALIBRATION SUCCESSFUL*
ZERO-POINT/HUM. INTERF. CALIB. SUCCESSFUL*
GAS X* SINGLE-POINT CALIB. SUCCESSFUL*
GAS X* TWO-POINT CALIBRATION SUCCESSFUL*
_____________________________________________________________________________
BE6011-16
1314 Photoacoustic Multi-gas Monitor
LumaSense Technologies A/S
1412 Photoacoustic Field Gas-Monitor
Page 266 of 280
Chapter 16
______________________________________________________________________
16.3
“Invalid” Calibration Messages
The messages listed below indicate: (1) that the calibration factor
calculated during the calibration task you have just performed is not
valid and therefore has not been stored in any filter bank; and (2)
that the calibration task must therefore be repeated.
ZERO-POINT CALIBRATION INVALID*
HUM. INTERFERENCE CALIBRATION INVALID*
ZERO-POINT/HUM. INTERF. CALIB. INVALID*
GAS X* SINGLE-POINT CALIB. INVALID*
GAS X* TWO-POINT CALIBRATION INVALID*
16.4
Error Messages Displayed when the INFO
button is used
All “successful*” or “invalid” calibration messages are marked with
an asterisk (*) which tells you that more detailed information about
the calibration can be obtained by pressing INFO. The messages
displayed when INFO is pressed are listed and explained below.
16.4.1
“Invalid” Error Messages
MISSING MEASUREMENT DATA
This message indicates that the Monitor does not have the necessary
data to calculate absolutely valid calibration factors. This situation
could, for example, be caused by too much noise in the analysis
chamber. The calibration task will have to be repeated.
WATER VAPOUR MEASUREMENT < OFFSET
This message is associated with either (1) a span calibration of the
water-vapour filter, or (2) a humidity-interference calibration.
This message indicates that the signal measured with a particular
filter, when water-vapour of known concentration is in the analysis
cell, is less than the signal measured in the cell when zero-gas is in
the cell. This could indicate either:
•
•
That the gas used during the zero-point calibration of the filter
was not dry;
or
That the water vapour used during either the span calibration of
the water-vapour filter; or the humidity-interference calibration,
was not wet enough.
_____________________________________________________________________________
BE6011-16
1314 Photoacoustic Multi-gas Monitor
LumaSense Technologies A/S
1412 Photoacoustic Field Gas-Monitor
Page 267 of 280
Chapter 16
______________________________________________________________________
WET MEAS. < DRY MEAS. FOR WATER FILTER
and
HUMIDITY INTERFERENCE FACTOR < 0
Both these messages are associated with a combined zero-point and
humidity-interference calibration task.
WET MEAS. < DRY MEAS. FOR WATER FILTER
HUMIDITY INTERFERENCE FACTOR < 0
During the zero-point calibration task the signal is measured when
dry, zero gas is in the cell – this is a measure of the noise in the cell
when a particular optical filter is used. This measurement allows the
concentration offset factor for the particular filter to be calculated.
During the humidity-interference calibration task the signal in the cell
when a particular optical filter is used is measured when wet, zero
gas is in the cell – this signal is compared with the signal measured
with the water-vapour filter to give the humidity gain factor. The
above message is given if the humidity gain factor is found to be
less than zero. This could indicate that the zero-gas you used during
the zero-point calibration was not dry, or alternatively that the
concentration of water-vapour you used during the humidityinterference calibration was too low.
GAS X: CALIBRATION FACTOR LESS THAN 0
This message is associated with a single-point span calibration task.
The gas conversion factor calculated during the single-point span
calibration task is found to be less than zero. This could indicate that
the concentration of gas used during the calibration was too low.
GAS X: LOW MEAS. > HIGH MEAS.
GAS X: MEAS. INDICATES LINEAR COHERENCE
GAS X: MEAS. DOES NOT FIT NON-LINEAR CURVE
GAS X: CALIBRATION IMPOSSIBLE: MAX ITER.
All these messages are associated with a two-point span calibration
task.
During a two-point span calibration the signal (Vhigh) is measured
when the gas concentration Chigh is in the cell, and the signal (Vlow) is
_____________________________________________________________________________
BE6011-16
1314 Photoacoustic Multi-gas Monitor
LumaSense Technologies A/S
1412 Photoacoustic Field Gas-Monitor
Page 268 of 280
Chapter 16
______________________________________________________________________
measured when the gas concentration Clow is in the cell (see section
14.11).
Fig.16.1
Curve illustrating the two points measured during a twopoint span calibration task
GAS X: LOW MEAS. > HIGH MEAS.
This message indicates that the signal measured in the cell when the
gas concentration was low is found to be greater than the signal
when the gas concentration was high.
The above message could indicate that the span gas concentrations
were incorrectly “entered” when the task was set-up (that is, the
“entered” low gas concentration was actually greater than the
“entered” high gas concentration). Alternatively, it could indicate that
the concentration of the gas supplied to the Monitor during the
measurement of Vlow was actually the high concentration (Chigh) and
vice versa.
The signals Vhigh and Vlow have to be corrected for water-vapour
interference and cell noise, that is:
Vhigh – Voffset – VH2O = Vh;
and:
Vlow – Voffset – VH2O = Vl
These two points (Vh, Ch) and Vl, Cl) can then be plotted on a graph
(see Fig.16.1).
_____________________________________________________________________________
BE6011-16
1314 Photoacoustic Multi-gas Monitor
LumaSense Technologies A/S
1412 Photoacoustic Field Gas-Monitor
Page 269 of 280
Chapter 16
______________________________________________________________________
When the two signals have been measured, the Monitor then finds
the value δ = 1% of Vh and finds out the relationship between the
measured values:
If there is a perfectly linear relationship between the points Clow, Vlow
and Chigh, Vhigh then:
Vlin = ( Ch / Cl ) * Vl
GAS X: MEAS. INDICATES LINEAR COHERENCE
This message will be given in the status display if Vl lies between the
values Vlin – δ and Vlin + δ. This indicates that the two gas
concentrations you have chosen lie in the linear region of the
calibration curve. If the high concentration of gas you used (Chigh) is
equal to or greater than the highest concentration you expect to
measure, then it is not necessary to use a two-point span calibration,
a single-point span calibration using Chigh as the concentration of
span gas used will be sufficient to give you a good calibration result.
However, if the high concentration of gas you used is less than the
highest gas concentration you expect to measure, the two-point span
calibration task should be repeated using a high concentration which
is equal to or greater than the highest concentration you expect to
measure. There will therefore be a better chance to find a point in
the non-linear region of the span calibration curve so that any nonlinearity can be plotted.
GAS X: MEAS. DOES NOT FIT NON-LINEAR CURVE
This message will be given in the status display if Vl is less than Vlin –
δ. This message indicates that a two-point span calibration cannot be
performed.
If Vl is found to be greater than Vlin + δ then the Monitor will try to fit
the two measured points onto a curve, whose shape has been predetermined by INNOVA, by an iterative process. The iterative process
involves scaling on the concentration and signal axes until the two
points fit the curve within certain tolerances.
GAS X: CALIBRATION IMPOSSIBLE: MAX ITER.
If after 255 iterative processes, the two points cannot be fitted onto
the curve within tolerance limits, this message is displayed.
This could indicate that the wrong concentration has been “entered”
in the set-up of the span calibration task (which does not relate to
the measured signal). Alternatively, it could indicate that there is a
linear relationship between the gas signal in the cell and the
_____________________________________________________________________________
BE6011-16
1314 Photoacoustic Multi-gas Monitor
LumaSense Technologies A/S
1412 Photoacoustic Field Gas-Monitor
Page 270 of 280
Chapter 16
______________________________________________________________________
concentration of the gas (in which case only a single-point span
calibration is required).
SPAN CALIBRATION IMPOSSIBLE
This message is associated with the span calibration of the watervapour filter.
The above message indicates that the Monitor cannot calculate the
gas conversion factor. This could indicate that the concentration of
water-vapour used during the calibration was too low – this could
either be due to an incorrectly “entered” water-vapour concentration
in the set-up of the span calibration or that the concentration of
water-vapour used was not the same as that which was “entered” in
the set-up.
16.4.2
“Successful*” Error Messages
WATER VAP. MEAS. < OFFSET MEAS
This message is associated with one, or more, of the following
calibration tasks: (1) the one- or two-point span calibration of an
optical filter; (2) the cross-interference calibration of the installed
optical filters ("A” to “E”); (3) the zero-point calibration of all the
installed optical filters (“A” to “E”).
During all the above-listed calibration tasks, the signal in the cell is
measured using the water-vapour filter: this enables the Monitor to
compensate for any interference signal produced by the presence of
any water-vapour in the span gas being used. If the signal in the cell
using the water-vapour filter is found to be less than the concentration offset factor for the water-vapour filter, the above message
is sent.
This could indicate that the zero gas you used, during the zero-point
calibration of the water-vapour filter, was not perfectly dry.
SPAN MEASUREMENT TOO LOW
This message is associated with the span calibration of one (or more)
of the filters.
The above message indicates that the signal measured in the cell
during span calibration is less than 3µV and therefore cannot be used
to obtain a good calibration. This means that the concentration of
your span gas is too low.
SIGNIFICANT CHANGE IN CALIB. FACTORS
_____________________________________________________________________________
BE6011-16
1314 Photoacoustic Multi-gas Monitor
LumaSense Technologies A/S
1412 Photoacoustic Field Gas-Monitor
Page 271 of 280
Chapter 16
______________________________________________________________________
This message is associated with the span calibration of one (or more)
of the filters.
The above message indicates that the Conversion factor calculated
during span calibration of a particular filter deviates more than 15%
from the Conversion factor calculated during the last span
calibration of this filter. If you are absolutely sure that the previous
span calibration of this filter was correctly performed then this
message could indicate:
1.
That you have “entered” the wrong concentration for the spangas in the span calibration set-up.
2.
That the concentration of your span gas is not correctly quoted
on its “Analysis Certificate”.
3.
That there is a leak in the tubing/fittings in your calibration
equipment, which alters the concentration of the span gas
reaching the cell.
NO CROSS INTERFERENCE FOUND
This message is associated with a combined cross-interference and
span calibration task.
The above message indicates that the signal measured with a
particular filter (for example “A”) when a certain gas (for example
“B”) was in the cell is less than 1.5μV. This indicates that there is
effectively no signal contribution from gas “B” when filter “A” is used,
i.e. gas “B” does not interfere with measurements made with filter
“A”. In this case the factor “Gas B’s” Interference on Filter “A”
listed in the calibration data bank (see section 14.3.2) will be seen to
be zero.
HIGH CONC. SPAN MEASUREMENT TOO LOW
This message is associated with a two-point span calibration task.
The above message indicates that the signal measured during span
calibration, when the high concentration of span gas is in the cell, is
less than 15µV. This means that the “high” concentration of span gas
is too low.
LOW CONC. SPAN MEASUREMENT TOO LOW
This message is associated with a two-point span calibration task.
The above message indicates that the signal measured during span
calibration, when the low concentration of span gas is in the cell, is
_____________________________________________________________________________
BE6011-16
1314 Photoacoustic Multi-gas Monitor
LumaSense Technologies A/S
1412 Photoacoustic Field Gas-Monitor
Page 272 of 280
Chapter 16
______________________________________________________________________
less than 3µV. This means that the “low” concentration of span gas is
too low.
_____________________________________________________________________________
BE6011-16
1314 Photoacoustic Multi-gas Monitor
LumaSense Technologies A/S
1412 Photoacoustic Field Gas-Monitor
Page 273 of 280
Chapter 17
______________________________________________________________________
Chapter 17
Warning and Error Messages
July 2009
_____________________________________________________________________________
BE6011-16
1314 Photoacoustic Multi-gas Monitor
LumaSense Technologies A/S
1412 Photoacoustic Field Gas-Monitor
Page 274 of 280
Chapter 17
______________________________________________________________________
When the Monitor is switched on, and while it is being operated, the
Monitor regularly performs a series of self-tests, which check that the
various mechanical, electrical and electronic components of the
Monitor are functioning correctly. These self-tests are described in
more detail in Chapter 5. You can select to disable the regular selftests if desired (see section 5.4.3). If any component is found to be
functioning outside of its specifications either a “Warning” or a
“Operating-error” message will appear on the gas monitor’s screen.
Please note: A “Warning” and/or “Operating-error” message will
only be displayed once. If the fault is still found to be present during
the next regular self-test the message will not be displayed again.
Messages are only displayed when a fault is first detected. If the fault
corrects itself and then is later found to be faulty the message will be
displayed again. It is therefore important to note the message before
pressing the INFO button, which will cause the error message to be
removed from the display.
Although the message is removed from the screen, any gas
measurements performed while the fault is still present will be
marked with an asterisk (*). By pressing INFO when such a
measurement is displayed, the Common mark “O” and/or “W”,
and in some cases, the Gas Mark “F” and Gas Mark “A” will be
shown on the display.
On the following pages, all possible “Warning” messages are listed;
all possible “Operating-errors” messages are listed; and all possible
“Interface-error” messages are listed. There is a description of each
fault as well as the possible cause(s) of each fault. The user must
evaluate the significance of each message. As long as the fault is
detected, all measurements will be marked by an asterisk. Some
“faults” are easily corrected.
_____________________________________________________________________________
BE6011-16
1314 Photoacoustic Multi-gas Monitor
LumaSense Technologies A/S
1412 Photoacoustic Field Gas-Monitor
Page 275 of 280
Chapter 17
______________________________________________________________________
Warning and Error Messages
The following table gives most of the error and warning messages
contained in the test Hierarchy of the Monitor. There is a description of
each fault as well as the possible cause of each fault. The user must
evaluate the significance of each message.
Error / Warning Message
AIR FLOW TOO LOW
AIRWAY-SYSTEM BLOCKED
ALARM LIMIT EXCEEDED
NO INDEX MARK FROM FILTER
CAROUSEL
Description of Fault
The air pressure difference
created by the pump in the
pneumatic (airway) system
(tubes and/or analysis cell)
is too low. This means that
the tubing and/or analysis
cell cannot be properly
flushed out and the sample
in the analysis cell is
therefore not necessarily
“new”
The air pressure difference
created by the pump in the
pneumatic ( airway)
system ( tubes and/or
analysis cell) is too high
Possible Cause
1. The length of
the sampling
tube attached to
the Monitor’s
inlet has been
incorrectly
entered.
2. Either the
external or
internal
pneumatic
system is not
air-tight
3. The pump is
defective
1. The length of
the sampling
tube attached to
the Monitor’s
inlet has been
incorrectly
entered.
Either the external
or internal
pneumatic system is
not air-tight
The Monitor has measured
a concentration of gas
greater than the alarm
limit concentration entered
The Monitor cannot
determine the position of
its filter carousel
1. The motor that
drives the filter
carousel is not
working
2. The optical
detector that
checks the
movement of
the carousel is
not working
3. The filter
carousel has not
been properly
mounted
_____________________________________________________________________________
BE6011-16
1314 Photoacoustic Multi-gas Monitor
LumaSense Technologies A/S
1412 Photoacoustic Field Gas-Monitor
Page 276 of 280
Chapter 17
______________________________________________________________________
CLOCK SET TO DEFAULT ERROR
DETECTED IN CLOCK SETTINGS
FACTORS SET TO DEFAULT ERROR
DETECTED IN CALIBRATION
FACTORS
MEMORY SET TO DEFAULT ERROR
DETECTED IN BACKGROUND MEMORY
MEMORY SET TO DEFAULT ERROR
DETECTED IN DISPLAY MEMORY
MEMORY SET TO DEFAULT ERROR
DETECTED IN INTERNAL MEMORY
MEMORY SET TO DEFAULT ERROR
DETECTED IN SOURCE MEMORY
PARAMETERS SET TO DEFAULT
ERROR DETECTED IN
CONFIG:/FORMAT PARAMETER
PARAMETERS SET TO DEFAULT
ERROR DETECTED IN THE TASK
SET_UP PARAMETER
The Monitor’s internal
clock was found to be
incorrectly set so these
values have been set to
their default values
An error has been found in
the data stored in the
Calibration Factor part of
the Monitor’s memory, so
these factors have been
set to their default values
An error has been detected
in the Monitor’s
Background Memory, so
the Monitor automatically
deletes all data stored in
this Memory
An error has been detected
in the Monitor’s Display
Memory, so the Monitor
automatically delete all
data stored in this
memory.
An error has been found in
the data stored in the
Monitor’s internal memory.
data stored in this memory
cannot be read or altered
by the user, so the Monitor
automatically corrects any
errors found in this
memory
An error has been found in
the data stored in the
Monitor’s source memory,
so the Monitor
automatically give stored
parameters default values.
An error has been found in
the value parameters
stored in the Configuration
and/or Format branches of
the Monitor’s set-up tree,
and therefore the Monitor
has automatically given
these parameters default
values
An error has been found in
the value parameter stored
in the Monitoring Task
branch of the Monitor’s
set-up tree, and has
automatically given these
parameters default values.
A new battery has
been installed
1. A defective
back-up battery
2. A defective
Working Memory
(RAM) or Source
Memory
(EEPROM)
3. A Software fault
1. A defective
back-up battery
2. A defective
Working
memory ( RAM )
3. A software fault
1. A defective
back-up battery
2. A defective
Working Memory
( RAM )
3. A software fault
1. A defective
back-up battery
2. A defective
Working Memory
( RAM)
3. A software
fault.
1. A defective
back-up battery
2. A defective
Source Memory
( EEPROM)
3. A software fault
1. A defective
back-up battery.
2. A defective
Working Memory
(RAM)
3. A software fault.
1. A defective
back-up battery
2. A defective
Working Memory
(RAM)
3. A software fault.
_____________________________________________________________________________
BE6011-16
1314 Photoacoustic Multi-gas Monitor
LumaSense Technologies A/S
1412 Photoacoustic Field Gas-Monitor
Page 277 of 280
Chapter 17
______________________________________________________________________
A/D INTERRUPT FAILED
AIR SHUNT BLOCKED. SAMPLE
ABORTED
CHOPPER FAILED
INTERNAL TEMPERATURE OUT OF
RANGE
IR-SOURCE TEMPERATURE OUT OF
RANGE
MICROPHONE TEST FAILED
PUMP TEST FAILED
MODULE STATUS ERROR DETECTED
A/D converter was not able
to collect the necessary
number of signal
measurements to ensure
an accurate concentration
measurement.
The pressure of air in the
analysis cell is too high.
The microphones risk
being damaged by
exposed to such pressure.
The chopper wheel is not
running.
The temperature in the
analysis cell is either too
high or too low. As the
Monitor is operating outside its temperature
specifications, accurate
measurements can not be
guaranteed.
The temperature of the
infrared light source is
either too high or too low.
As the IR-source is operating outside its
temperature specifications
accurate measurements
cannot be guaranteed.
The signal received from
the microphone during the
self-testing procedure is
out of range.
The pump cannot build up
the necessary pressure
during the self-testing
procedure.
At least one of the
modules is not functioning
as expected.
The analogue card
is defective.
The air shunt valve
is either defective or
blocked.
1. The chopper
motor is not
working
2. The optical
sensor which
checks the
chopper ‘s
movement is not
working.
1. The ventilation
fan is defective.
2. The ambient air
temperature is
either too high
or too low.
3. The temperature
sensor is
defective.
The infra-red light
source is defective.
1. The analogue
card is defective
2. A microphone
(s) is defective.
1. The pump is
defective.
2. The internal
pneumatic
system is not
airtight.
1. Module
hardware error.
2. Fault in
communication
cable
3. Wrong module
version
4. Fault in the data
configuration of
the module
_____________________________________________________________________________
BE6011-16
1314 Photoacoustic Multi-gas Monitor
LumaSense Technologies A/S
1412 Photoacoustic Field Gas-Monitor
Page 278 of 280
Chapter 17
______________________________________________________________________
IEEE CONTROL TIMEOUT
WARNING: X-ON/X-OFF HANDSHAKE
CONFLICT
TIMEOUT. DEVICE NOT CONNECTED
WARNING :
TIMEOUT. DEVICE NOT READY
The Monitor wishes to send
data to a printer via IEEE
interface, but the Monitor
is not the system
controller.
The Monitor receives the
handshake signal from the
RS232 CTS ( clear to send)
line, but it has not been
set-up to use this CTS line
There are no other “
controllers” on the
IEEE bus, so the
Monitor should be
made the controller.
The Monitor and
RS232 device (
printer ) do not
agree about which
handshake signal
they should use.
Perhaps the wrong
interface cable has
been used.
Monitor wishes to send
data
( print , data-log
or error-log ) via the IEEE
interface, but there is no
response from the device
with the address entered
in the Monitor set-up
1
Monitor wishes to send
data
(print , data-log or errorlog )
but after the start of data
transmission , the device
stops receiving data.
1. The device is
“off-line “ ( it
can not receive
data).
2. The device is not
able to receive
data fast
enough.
3. The device is no
longer
connected to
Monitor.
2
No device is connected to the
Monitor
The device
address has
been entered incorrectly in the
Monitor’s set-up.
_____________________________________________________________________________
BE6011-16
1314 Photoacoustic Multi-gas Monitor
LumaSense Technologies A/S
1412 Photoacoustic Field Gas-Monitor
Page 279 of 280
1314
1412
LumaSense Technologies A/S
Energivej 30
DK-2750 Ballerup, Denmark
Tel.:(+45) 44 20 01 00
Fax: (+45) 44 20 01 01
http://www.lumasense.dk