1
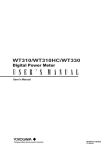
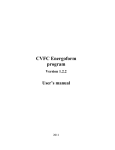
Fig. 3.1.10
“Tools” menu
Options of the “Tools” menu (pictured above) are as follows:
Limits Settings;
Object names;
Nominal values;
Export data tables to MS Excel, including:
o Power Quality Parameters;
o Averaged Network Parameters;
o Oscilloscope Data (otherwise called “Oscillogram”);
o Dips and swells;
Export PQ report to MS Excel.
“Limits Settings”
This item, when selected from the “Tools” menu, opens its specific window that covers various sets of Power Quality Limits (NPL and UPL).
Fig. 3.1.11
32
“Limits Settings” window