1
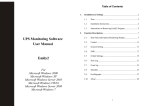
SOFTWARE PACKAGE “OSCILLOSCOPE” Energomonitoring Software Family Version 3.0.1.4 User's Manual 2012 1 Table of Contents Table of Contents ......................................................................................... 2 General......................................................................................................... 3 System requirements ................................................................................... 4 Installation procedure .................................................................................. 5 Initiating the run of the Program .................................................................. 8 De-installation .............................................................................................. 8 Main menu ................................................................................................. 10 “File” menu ................................................................................................ 10 Load from device ..................................................................................... 10 Graph display modes ............................................................................ 11 Selection of time period to be displayed .............................................. 11 Export data to MS Excel........................................................................... 11 Close all documents ................................................................................ 12 Exit .......................................................................................................... 12 “View” menu .............................................................................................. 13 Document list window............................................................................. 13 Image settings window............................................................................ 14 Toolbar .................................................................................................... 15 Status line................................................................................................ 15 “Settings ” menu ........................................................................................ 16 Settings ................................................................................................... 16 Tabbed window ”Triggering type (PQP Energotester only)” ............... 17 Licence .................................................................................................... 21 “Help” menu .............................................................................................. 22 Manual .................................................................................................... 22 About program… ..................................................................................... 22 Technical support ....................................................................................... 23 2 General PC-oriented software package named “Oscilloscope” was conceived as an aid to the users of the following instruments available from Mars-Energo: - Energomonitor 3.1K (EM 3.1K) supplied as multipurpose reference standard and power quality analyzer; - Energomonitor 3.3T1 (EM 3.3T1) - portable reference standard, power quality analyzer, comparator and oscillograph; - PQP Energotester – another portable instrument from Mars-Energo that can be of use to the experts who conduct power certification and PQP audit on a regular basis. NOTE: Oscilloscope software was developed to process the data accumulated in Mars-Energo instruments while their logging function operates in “oscillogram mode”. From this point of view, generic name “the logging Device” or “the Device” may be used throughout the manual in reference to any of aforesaid instruments compatible with the software, without specifying their model name. The software (hereinafter referred to as the Program) originates from Energomonitoring Software Family and makes it possible: - to acquire oscillogram data from logging devices via serial interface; - to store and maintain the acquired data on PC hard disk; - to plot voltage and current waveforms on PC display, much like an oscilloscope does; - to conduct user-friendly browsing through previously acquired data; - to export the results as MS Excel spreadsheets. The Program follows generally recognized model of Windows-based user interface. After the installation of the Program, its destination directory has “usbdriver” subdirectory in it that contains device-specific drivers. Make sure proper driver is installed before you open connection for the first time between the Program and particular type of logging Device. Oscillograms are stored in “Data” subdirectory within destination directory of the Program. This subdirectory remains intact when Windows control panel is correctly used to deinstall the Program. 3 System requirements The Program is compatible with a number of operating systems: MS Windows 98, 2000, XP, Vista, Windows 7 (32-bit version). Support of Cyrillic characters is required. Basic hardware requirements: - - Processor: Pentium 133 or more powerful; Memory: at least 32MB; Consumed disc space: At least 20 MB for installation; Adequate disc space for logs and output reports. Video adapter shall be of 1024x768 resolution and 32-bit colour depth; CD drive for software installation; Mouse or compatible pointing device; At least one port (RS 232, USB, or Ethernet, or their combination) for occasional data exchange with a logging Device. The user may want to work with more powerful PC, to feel comfortable when the Program grinds a great body of data in a single pass. 4 Installation procedure 1. Insert the installation disk into CD drive. 2. Make sure no Windows application is running on your PC. If there are some, arrange for them to quit. Then start Installer.msi residing on installation CD. 3. Follow on-screen instructions as they are issued. The Installer.msi performs in Wizard’s style. It guides you through a suite of Windows dialog boxes with questions, instructions, or menus in them. Each box is associated with some actions or decisions for you to take. When done, the user typically presses “Next” button to go further. Alternatively, he may click on “Back” to undo his actions and repeat the step, or force “Cancel” to discontinue the installation. The installation procedure starts by displaying the following screen: Default path to the Program’s ultimate destination is “C:\Program Files\MarsEnergo\Energomonitoring\ADC Viewer\”, however the user may want to select another path by pushing “Review” button on the screen pictured below. 5 6 At the completion of program installation, its icon will be placed on your desktop, and similar item will be included in the Start menu. 7 Initiating the run of the Program There are three ways of launching the Program. It is your choice to do one of the following: – run “Oscilloscope.exe” file from the directory where the Program was installed; – double-click on the icon “Oscilloscope” on the desktop; – select the item “MarsEnergo\Energomonitoring\Oscilloscope” in the “Start” menu. This will bring you into the main window (pictured below) of the software “Oscilloscope”. De-installation To remove the Program, open the Windows Control Panel, select “Add/Remove Programs”; choose “Oscilloscope 2.0.0.0” and click on the “Remove” button. The de-installation program performs in Wizard’s style as well. 8 De-installation procedure will not remove the archived logs residing in the same directory where the Program was. They will be accessible by the Program in case you reinstall it. 9 Main menu Main menu of the Program contains the following items: File, View, Settings, Help. “File” menu The commands available are: Load from device…; Export data to MS Excel; Close all documents; Exit. Load from device By this command the user can obtain the oscillogram recorded in a logging device. Alternatively, the command can be activated by pushing its button on the toolbar: . Oscillogram logs are uploaded via a serial port supporting interfaces RS-232 or USB (as the case may be). While using RS-232, the user must connect RS-232 port of the logging Device to the corresponding serial port of the computer. Then the logging Device shall be instructed (via its “Settings” menu) to use its RS-232 port and proper data rate for communication. In case of USB the only thing for the user to do is installing the communication cord between two USB ports. Data link maintained between the Program and the logging device connected to it is specified in status line displayed at the bottom of Program’s main window. 10 Error messages can appear in the status line each time an error is detected in the course of data exchange. Graph display modes Number of samples simultaneously displayed on the screen is limited by its size and resolution. Therefore the areas of document window were designed to display graphs in one of two modes: selective sampling and full sampling. Selective sampling mode displays only a part of samples selected at the predefined intervals. In this case the envelope shall be considered just the approximation of the real waveform. Full sampling mode displays every sample belonging to a certain time period. The switching between the modes is made automatically, depending on the scale. Selective sampling mode displays graphs against shadowed background. Full sampling mode uses white background and displays each sample as a horizontal segment of its specific height. The multitude of segments builds up the entire graph. Selection of time period to be displayed The time period is specified by highlighting some part of upper or lower diagram on the screen. This is done by dragging the mouse with its left button depressed. Having released the button, the user will see the desired time period displayed on the lower diagram. Upper diagram will display marker to indicate the location of the selected interval within the entire range of samples. The Program memorizes time periods selected by the user. By pushing buttons pictured below the user can skip in both directions from one selected time period to another: , , , Buttons «--» and «++» navigate to the earliest and the latest time period of the sequence, respectively. Buttons «-» and «+» skip to previous or next time period, as they are positioned in the sequence. As the user navigates within the sequence of selected time periods, the lower diagram positions its markers to indicate next and last time periods. Export data to MS Excel Respective command of “File” menu makes it possible to convert data the way to create *.xls data file compatible with MS Excel application. Instead of selecting “Export…” command from “File” menu, the user can activate it by pushing button on the toolbar. Before data can be exported, corresponding time period shall be selected using the diagram named “Scaling”. Data export command produces several fines, each containing up to 50000 sampled values. Note that only common part of file names is specified in “Save as…” dialog window. Unique file names are generated by appending sequential numbers and total number of exported files. 11 Exported document appears in its window as pictured below: Close all documents This command clears Program’s working area by removing all oscillograms and initializing the list of files available. Exit This command arranges for the Program to quit, its current settings being saved in the configuration file. 12 “View” menu The commands available are: Document list window; Image settings window; Toolbar; Status line. Document list window By selecting this item the user displays the list of oscillograms known to the Program. The list is arranged to contain the following information on each oscillogram file: Type of logging device; Its serial number; Object name; Starting date/time; Ending date/time; Circuit connection; Date/time of file creation; File size. General view of the window is pictured below 13 Instead of selecting “Document list…” command from “View” menu, the user can activate it by pushing its button on the toolbar. Image settings window This menu item initiates the selection of colours used for displaying the graphs. In “Image settings” window pictured below, highlight “Colours used for graphs” in its option list. Then use dropdown lists to select specific colours for each graphical component of the diagram. In this mode, you may want to define colour more precisely. This is done by rightclicking the mouse to open colour edit window which offers the choice of much more hues of the colour under review: Instead of selecting “Image setting…” command from “View” menu, the user can activate it by pushing its button on the toolbar. 14 Toolbar By selecting this item the user displays toolbar in upper part of Program window: Icons/buttons of the toolbar correspond to the following commands described above: Load from device; Export data to MS Excel; Document list window; Image setting window. Status line By selecting this item the user displays status line at the bottom of Program window. The status line shows what type of logging device is communicating with the Program, the interface used, and reflects the progress of data transfer. 15 “Settings ” menu The following commands are on offer: Settings; Licence. Settings “Settings” window of the program has two active tabs: General Triggering type (PQP Energotester only) Tabbed window named “General” contains radio buttons and fields that define modes and characteristics of data exchange between PC and logging Device connected to it. One more field can be set to select user interface language. When radio button is set to activate RS-232 port (COM), this port shall be further configured in terms of its name and data rate. 16 The following interface types are available, depending on what logging Device communicates with the Program: Energomonotor-3.3T1 can be connected via COM-port or using USB. When setting radio button to select interface type, check to see if your selection corresponds to both physical connection and interface option activated in settings menu of the logging Device. If you decided to communicate via COM-port, ensure that one and the same data rate be set on both ends of communication line. PQP Energotester can only be connected physically via USB cord, data rate being 3000000. However, COM-port shall be selected as interface type in the tabbed window named “General”. To define port number, ensure PQP Energotester is connected and proceed as follows. Navigate to “Device manager” of your PC via context menu of “My computer” icon on your desktop. In the subdivision entitled “COM and LPT1 ports” open its dropdown list. In the item of this list named “USB Serial Port (COM xx)” you will find “COMxx” as the number of COM- port connected to the logging device: Energomonotor-3.1K can only be connected via COM-port. When setting radio button to select interface type, check to see if your selection corresponds to both physical connection and interface option activated in settings menu of the logging Device. Ensure that one and the same data rate be set on both ends of communication line. Tabbed window ”Triggering type (PQP Energotester only)” Current version of the Program makes it possible to obtain from PQP Energotester its settings specified for “Oscillogram mode”. This is done by pushing “Read from device” button. The program can go about it the other way round: settings defined in the Program can be downloaded into the logging device using “Load to device” button. Tabbed window “Triggering type…” is activated each time “PQP Energotester” is selected as “Device type” in tabbed window “General”. You can use “Triggering type…” window (pictured below) to specify logging parameters to be downloaded immediately into PQP Energotester: 17 The following options can be selected in this window: Triggering type can be manual, time-driven, or event-driven. “Manual” means that logging Device starts recording the oscillogram at any moment when proper command is issued by its operator. “Time-driven” triggering is used to start and stop the recording at predefined moments of time, as specified in PQP Energotester itself. In case of “Event-driven” triggering the logging Device starts recording the oscillogram when certain condition is satisfied. The condition can be of the desired type (greater than, less then, greater by modulus, less by modulus) and relevant to specific parameter selected in three lines at the bottom of the window. The user can select parameters such as frequency, positive sequence voltage, negative sequence voltage, positive sequence current, negative sequence current, etc… The selection of manual or time-driven triggering type disables all fields of the window relevant to event-driven triggering. 18 However, the entire set of options becomes accessible as soon as “Event-driven” triggering is selected. Event type field offer the choice between “by measurements” and “voltage drops/swells”. In case of “by measurements” three lines are activated at the bottom of the window, each containing drop-down lists for the following: parameters available, triggering condition, settings for parameter values. The user can assign values for the settings and define permissible conditions for parameter measurement: <, >, |<|, |>|. There are two more settings to define in case of “by measurements” type of event. These are time settings named “Time before event” and “Time after event”. Each of them shall be integer number 1 to 12 seconds, which guarantees that the duration of the entire oscillogram never exceeds 12 seconds. 19 The following shall be specified when “voltage dip/swell” type of event was selected for event-driven triggering: “Time before event” and “Time after event”; these settings mean the same as in case of “by measurements” type of event; “Type of voltage dip/swell” which can be “voltage dips only”, “voltage swells only”, or “voltage dips/swells”; Two quantitative characteristics of the event named “voltage dip depth” and “voltage swell height”, both being ratios within the range of 1% to 20%. 20 Licence Before issuing “Read from device” command the user have to ensure that serial number of the logging Device was registered with this particular copy of the Program. If it is not, registration shall be initialized by navigating to Licence command of Settings menu. Registration procedure involves licence file typically supplied with the logging Device. 21 “Help” menu Two items are on offer: Manual; About program... Manual “Manual” opens the entire contents of this User manual as *.pdf file. Adobe Acrobat Reader (version 5.0 or above) must be installed for “Manual” option to operate as intended. About program… The command opens a window containing brief information about the Program along with the list of logging Devices registered with it. 22 Technical support Should any questions arise while installing or using the Program, try first of all to find the answers in the documentation available. Commonly faced problems may well be solved by visiting Technical Support section of our Web site www.mars-energo.ru. Should you still need help after reviewing all of the available materials, contact us by Email [email protected] or by phone: +7 (812) 327-2111. We would greatly appreciate your providing our Technical Support group with the following information: Contact person (Name and Surname); Company's name; Phone (Fax, E-mail); Software version number (see the menu Help/About program); Name and serial number of the logging Device; Description of the problem, including the complete text of error message (if there was any); Type of your PC; Windows OS version; Other information that you consider to be important. OOO Mars-Energo Address: V.O. 13 Line, 6–8, office 41H, St. Petersburg, Russia, 199034 Tel/Fax: 812 327-21-11 Tel/Fax: 812 309-03-56 E-mail: [email protected] www.mars-energo.ru 23