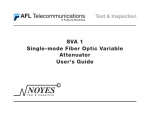
1
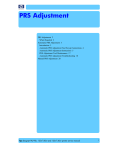
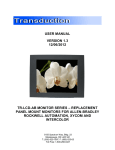
Reports
QEA Image Analysis System
Qualitative Analysis
Patrick Lichty
F L AAR RE P O RT S
A Qualitative Analysis
Quality Engineering Associates, Inc.
Personal Image Analysis System
Patrick Lichty
Report
2004
FLAAR Digital Imaging Resource Center
QEA Personal Image Analysis System
Introduction
One of the most important concerns for any print operation is that of consistency and quality control.
QC is one of the foundations of creating a uniformly solid product, maximizing customer satisfaction.
However, a great deal of Image Quality Assurance is done by ‘eyeballing’ print quality, which is
invariably subjective in nature. To assure quality, output is usually sent to labs specializing in the
objective (quantitative) analysis of the print image. But for facilities who frequently check their
output quality, or for companies who wish consistently quick turnaround of
Topics
lab results, in-house solutions might be more cost effective or attractive.
Installation
QEA’s Personal Image Analysis System combines a high-quality digital
microscope, powerful image analysis software, and an embedded PocketPC
with synchronization capability with Microsoft Office. This hardware/
Features
software combination allows for detailed analysis of inkjet and electrostatic
Tech Support
printing, including tests for dot, line, text, and area quality, tone reproduction,
Overall Evaluation
and print defects. Instead of using subjective means for judging the quality
of a given print, the IAS allows for the precise measurement of print quality
using established ISO (International
Standards Organization) criteria. The IAS will be able to inform the
print operator not only when a printer is creating a properly formed
print, more importantly, it will tell the operator when the print is
being executed properly.
Accessories
A representative from QEA meets
with BGSU professor Chuck
Spontelli and Large Format Lab
Manager Brent Cavanaugh.
© Copyright 2004 by FLAAR, 111 Saddlemire, Bowling Green, Ohio 43403
FLAAR is a non-profit educational and research institute that nurtures the global market for large format digital
imaging, by providing objective information to help consumers select products and use them more effectively,
and by facilitating the development of new technologies, which will better serve the needs of consumers.
3
FLAAR Digital Imaging Resource Center
QEA Personal Image Analysis System
Platforms Supported
to a PC through the USB port, although screen updates
to the PC can take up to 10 seconds.
The Image Analysis System is a self-contained unit
incorporating a fully-featured PocketPC, powerful
digital microscope, and image analysis software bundle.
However, if the user wishes to download image samples
and test data, they can transfer this information to MS
Office through Active Sync software. In addition, live
test information can be presented through connection
Interfaces:
USB 1.0
Installation
For those familiar with the operation of a Pocket
PC, and a Casio Cassiopeia E-125 in particular,
the installation of the QEA software is easily done
through the use of a Flash RAM cartridge. An Adobe
Acrobat version of the manual, as well as backups
of the IAS software, which can be installed through
Microsoft ActiveSync, is available on the companion
CD. Again, even though the IAS is a standalone unit,
users not familiar with the basic operation of Pocket
PC’s would benefit greatly in familiarizing themselves
with the PPC’s functions and Active Sync. The user
would then be able to benefit more fully from the use
of the Pocket PC at the heart of the system as well as
the analyzer, thus greatly enhancing the value of the
system.
4
FLAAR Digital Imaging Resource Center
QEA Personal Image Analysis System
Documentation
The IAS comes with two copies of the User’s Manual,
one hardcopy, and another on the Companion CD. In
addition, the IAS comes with a set of reference images
to help the user familiarize themselves with the unit.
associated tutorials. The rest of the manual covers a
brief introduction to Pocket PC operation, customizing
the IAS, and appendices on troubleshooting and
explanations of print standards.
The manual is straightforward; the basic operations
of the IAS are covered in a concise thirty pages,
and the rest of the manual consists of discussions of
the various Image Quality Analysis (IQA) tests and
Accessories
Features
The IAS comes with a lens cleaning cloth, power supply,
USB hookup cable and reference images, as well as the
manual and Companion CD.
The IAS offers a wide variety of functions for the objective
(quantitative) analysis of print quality. This includes
dot, line, area quality, etc. The tests that the IAS offers
focus on inkjet and
electrostatic (tonerbased) printers,but
could be used in
some offset print
applications.
QEA being represented at the
TIARA Conference.
5
FLAAR Digital Imaging Resource Center
QEA Personal Image Analysis System
Additional Features
Features (cont.)
•
•
•
•
•
•
•
Dot quality
Diameter
Perimeter
Area
Circularity
•
•
•
•
•
•
Line quality (uses ISO-13660 methods)
Line width
Line density
Blurriness
Edge raggedness
Contrast
Fill
Area quality (uses ISO-13660
methods)
Reflectance
Visual Density
Color Density (Status T, Status A,
DIN, DIN-NB)
Color (HSI and L*a*b*)
Uniformity (graininess and mottle)
Tone reproduction
Reflectance and density
% area coverage
Dot gain
Graininess and mottle
Image defects
Intercolor bleed
Satellites
Voids
Extraneous marks
Background
Text quality
Stroke width and density
Edge raggedness
MTF (modulation transfer function)
Region of Interest-based analysis from live
or stored image
Two-point distance measurement
Auto/manual color plane selection
Auto line orientation detection
Indication of Pass/Fail tolerances
Statistics and graphical plots
ActiveSync with laptop or PC
The IAS test results can also be transferred as database
or text files for later review or incorporation into
reports. Captured images used in analysis can be saved
as well.
Tech Support
Although the manual recommends trying to resolve
any issues by working through its Troubleshooting
appendix first, QEA does offer technical support from
their Boston offices. The Technical Support number is
not toll-free, and hours are not listed on the website.
6
FLAAR Digital Imaging Resource Center
QEA Personal Image Analysis System
Usage Notes
it is reasonable to assume that a new user could sit
down in an afternoon, or at most a day, and become
familiar with the IAS.
The author of this report was able to pick up the IAS,
read the manual, and begin to do some initial testing
of the supplied reference sheets within three hours.
However, the embedded Casio E-125 PocketPC is
the exact same model in the author’s possession,
and he had been making cursory examinations of the
machine and materials for a couple weeks. From this
Overall Evaluation
actual meaning of the data had not been defined. At
a list price of $9,995, it’s assumed that the technician
using the IAS would be very familiar with ISO and
ANSI print standards, but perhaps a couple pages
in the manual
on
evaluation
methods would be
helpful for junior
The IAS is a relatively easy device to learn, and is
a snap to work with, especially for those who are
familiar with Pocket PC’s using Windows CE. It has
an intuitive interface, offers quick image analysis
that can be transferred to most Windows machines
as databases and image captures. The software also
plots image histograms (which are explained clearly
in the manual) that give a quick, intuitive overview
of print quality regarding line sharpness, text quality,
satellites (dot spatter), and many other Image Quality
Analysis print criteria.
technicians.
Chuck Spontelli and Brent
The IAS uses Cavanaugh test the IAS on
a Casio E-125 sample media.
Pocket PC as
the heart of its system. This particular system uses
Windows CE as its operating system, and the latest
version of the PPC windows platform is currently
PocketPC2002. The E-125 is a capable PDA, and
users will be able to share analysis data with all their
Microsoft Office software. However, users wishing
to run some of the newer PPC programs may not be
However, the IAS also assumes that the user is familiar
with print quality standards, and “knows what they’re
looking for”. In this case, the author, with no prior
knowledge of these standards, was able to learn basic
principles of many of the tests from the documentation.
In addition, relative baselines for other quantitative
print standards were determined from working with
the device and the reference sheets, although the
7
FLAAR Digital Imaging Resource Center
QEA Personal Image Analysis System
able to do so if they are PPC2002-specific. QEA does
not plan to go to PPC 2002 in the near future, and
most users will most likely not use the embedded PDA
outside of its dedicated use in the IAS. Therefore, the
use of Windows CE should not present any problems,
but is worthy to note.
The IAS was easy to use, intuitive, and very flexible in
terms of numbers
of tests available
to the user. For
facilities wishing
to monitor their
print production FLAAR employee demonstrates
quality assurance the usability of the interface on
the IAS.
in their inkjet
and electrostatic
equipment without hiring outside labs for costly QA
testing, the IAS could pay for itself quickly in terms
of print consistency (customer satisfaction), as well
as costly lab outsourcing. Although QEA’s Image
Analysis System does not completely replace the
functions of a lab for quality control analysis, it can
perform most testing functions for the monitoring of a
facility for a reasonable price.
8
FLAAR Digital Imaging Resource Center
QEA Personal Image Analysis System
Case Study with QEA
Image Analysis System
Product Specifications
Purpose
To create a report that compares the print quality
of the Epson Stylus Pro 7600 to the HP Designjet
130nr using quantitative measurements from the
QEA Personal Image Analysis System (IAS) and
qualitative using reference images in both Black &
White and Color.
Epson Stylus Pro 7600
• Ink:
7 Color UltraChromeTM
Pigment
•
Printhead:
Micro Piezo DX3TM
•
Speed:
Production Quality 87ft2
per hour
Assignment
•
Resolution: Maximum 2880x1440 dpi
First, ensure both printers are reasonably color
calibrated and aligned. Use a similar surface media
in both printers, but use branded media. Print out
the QEA Target PDF on both printers. Use the QEA
Personal IAS to measure the targets. Report results
and compare performance.
•
Media Input: Up to 24” Width Roll or
Sheet
•
Media Used: Epson Premium Luster
Photo Paper
•
Standard EPSON ESC/P Raster
Photographic Driver
Hewlett-Packard Designjet 130nr
Second, select 5 representative images, including
black & white and color photographs, and print on
both printers. Compare performance in quality and
speed.
Write a report detailing your procedures and
findings.
9
•
Ink:
6 Color Dye Based
•
Printhead:
HP Thermal Inkjet
•
Speed:
Production Quality 4
pages per minute
•
Resolution: Maximum 2400x1200 dpi
•
Media Input: Up to 24.6” x 69.3” Sheet,
24” Roll
•
Media Used: HP Premium Plus Photo
Satin
•
HP Designjet 130 Software RIP
FLAAR Digital Imaging Resource Center
QEA Personal Image Analysis System
Introduction
Results
Like many of today’s printing technologies, Inkjet
manufacturers have continued to develop new or
improved ways of increasing speed, quality and overall
color reproduction that are directed toward individuals
or small businesses. Two printers currently on the
market that have been labeled as such are the Epson
Stylus Pro 7600 and the Hewlett-Packard Designjet
130nr. Both of these printers are large format
printers stated by their manufacturers to have the best
photographic reproduction in their product category.
The major areas of testing were done with Dot
Circularity and Consistency, Line Width, Contrast and
Density and the Modulation Transfer Function (MTF).
These tests are all outlined in the QEA Personal
Image Analysis System User’s Guide. Text clarity
was also evaluated using a visual comparison. The
User’s Manual states that the dot is the most elemental
building block for all high level image content. By
testing these dots, we are able to see the quality of
the image. The basic dot analysis can be used to
record many other image quality attributes. I used
this Dot Analysis, along with the other tests to record
our findings. The quantitative data will then help us
understand the qualitative data better.
Epson claims that the Stylus Pro 7600 can “produce
incredibly sharp text and line art that rivals a final
press sheet.” Another claim by Epson states you can
see “no signs of ink jet technology.”
According to the User’s Manual Dot Analysis, the
Circularity of the image should (ideally) be 1. If
the circle is in a different shape, the measurement is
greater than 1, but if the circle is small, the test may be
inaccurate and register with a measurement less than 1.
To test the dots, you should at least take a sample size
of 9 dots; any less may not give accurate information.
These dots should
be small enough
to fit on the screen
and big enough to
register using the
Above is a sample image taken
QEA Personal IAS. from the QEA IAS during the
To select the Region testing of the HP and Epson
printers.
of Interest (ROI),
you can use the touch screen or just select Full Size
ROI in the options menu. It is best to use the full
view when testing dots and the MTF because it can
Meanwhile, Hewlett-Packard is taking the position of
long-lasting, fade-resistant photo quality. The new
ink technology used in the HP 130nr is stated to have
almost doubled the life of the print. The combination
of HP media and new inks should give prints a life
up to 70 years in normal lighting conditions. HP also
promotes their printer has a high color stability, as
well as consistency. In addition, by using their HP
printer specific media, the prints should have a uniform
gloss.
By performing these evaluations and reporting my
findings, I hope to be able to determine which printer
is better, based solely on the data analyzed and images
produced. Of course, one printer may meet the user’s
needs better than the other, but my research will choose
the overall better printer based on its performance.
10
FLAAR Digital Imaging Resource Center
QEA Personal Image Analysis System
of the lines. I chose to measure the 1pt. line. A 1pt. line
is approximately .357mm in width. The calculations
done by the QEA Personal IAS read that the HP 130nr
had a horizontal line width of .457mm, one tenth of
a millimeter larger than of an actual 1pt. line. The
HP 130nr line was also very crisp and clear with very
minimal blurring or raggedness. In relation to the
Epson 7600, the HP 130nr has 20% less blur and half
the amount of ragged edges. If you take a close look
at the pictures, you can see that the lines are similar in
size, but due to the blurring of the Epson line, the actual
line width was measured at .321mm, less than the size
of a 1 pt. line. As you can also see by the illustration,
the line density, or darkness of the line, is far greater in
the line produced by the HP 130nr than the Epson 7600.
Because this line is much darker, the contrast of the HP
130nr line is also greater than that of the Epson 7600.
pick up more data in a larger area. Once you have
selected and measured the dots, the data needs to be
interpreted. Circularity should be tested first. From
the results, the HP 130nr has an average circularity
of 1.59 and a standard deviation of .09. This means
that the dots produced by the HP 130nr are very close
to printing out in a circular shape. Also, by recording
a value of .09 as a standard deviation, it tells us that
the dots are very similar in shape and size. The low
standard deviation and the similarity of the size and
shape of the dots show us that the dot reproduction is
consistent. As you can clearly see by the illustration,
the screen capture of the dots printed using the HP
130nr look very much like circles. These dots are
.4mm in diameter.
On the other hand, the Epson 7600 reproduced the
dots with a Circularity Measurement of 2.98 and a
standard deviation of .98. It was very hard for the
QEA device to measure these 9 dots accurately.
The screen capture kept selecting the satellites and
measuring them as dots. (Satellites are extraneous
marks around the dots or other printed defects that
can cause inaccurate measurements.) However, I
was able to increase the minimum measurable dot
size to eliminate these errors. The data recorded by
the QEA Personal IAS shows that the .4mm dots are
oddly shaped and inconsistently reproduced. You
can see in the image that the Epson 7600 dots are
much less circular and a lot more blurry than those
of the HP 130nr dots.
The MTF Test displayed very similar results to the
Line Analysis. The MTF tests are used to quantify the
resolution of the printer. The User’s Manual states
that by measuring the contrast in patterns of lines
printed at various frequencies, in lines per millimeter,
the QEA Personal IAS can evaluate special details in
an image. To test, there are two methods, the standard
formula and the QEA formula. The QEA formula was
chosen for this evaluation because it depicts the actual
average contrast between the printed lines and the
paper on a 100% reflectance scale. Also, when using
the QEA formula, the MTF values are more sensitive
to the deterioration of resolution as line frequency
increases. When comparing the graphs produced by
the MTF results, the results showed that the printers
were very close. I found this to be very surprising
The next quantitative test performed was the Line
Analysis, measuring the width, contrast and density
11
FLAAR Digital Imaging Resource Center
QEA Personal Image Analysis System
The final quantitative test was done by a visual
comparison of text clarity. The reason for testing this
way is the fact that any text printed smaller than 8 point
on the Epson 7600 was unable to register using the
QEA Personal IAS. When taking a look at the screen
captures made by the QEA Personal IAS, you are able
to see that the text is almost illegible on the Epson but
very readable on the HP 130nr. If you have good eye
sight, you are even able to read the 2 pt. font off of
the HP paper without a magnifying glass and have the
text decipherable. Any text printed under 8pts. on the
Epson 7600 would be unrecognizable to the naked eye.
Even with the magnification of the QEA device, it was
because the images
looked nothing alike.
Again, with the
Epson 7600 lines,
they appeared to be
Above is a sample image taken
thinner than the HP from the QEA IAS during the
130nr lines due to MTF testing of the HP and
Epson printers.
the blur and ragged
edges. With that, the Epson had much more surface
reflectance between lines when the line frequency
was low, while, as the other results have shown the
HP 130nr out performed the Epson when it comes
to the finer details. The HP 130nr had better results
as the line frequency increased, while at lower line
frequencies, the Epson 7600 performed better than
the HP 130nr. As you can see by the screen captures,
the HP 130nr lines are consistent, which is what the
Epson 7600 has been lacking in the previous tests.
These screen captures were taken from the 3rd highest
hard to read the ragged text.
line frequency.
CLICK HERE TO ACQUIRE FLAAR REPORTS
Digitizing
Scanning
Color Managing
RIPing
Printing
Laminating & Trimming
Please realize that all reports are in Adobe Acrobat PDF format. The reader software is free from www.adobe.com/products/acrobat/readstep2.html
PDF files are intended to be read on your computer monitor. Naturally you can print them if you wish, but if the photographic images within the reports were high
enough dpi for a 1200 dpi laser printer it would not be possible to download them. So the images are intended to be at monitor resolution, naturally in full color.
FLAAR itself makes the files available only in PDF format because that is the international standard. We have no mechanism to print them out and mail them.
Obviously if you have downloading problems we will try to help, but please realize that we assume you have a 56K modem (or better) and capabilities to handle a
basic PDF file.
Copyright 2002-2005 Nicholas Hellmuth-FLAAR First issued 2002. Updated September 2003, Most recently updated January 2005.
12