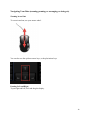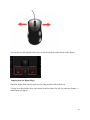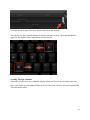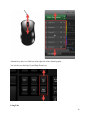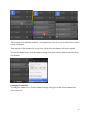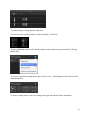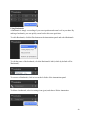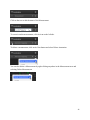
1
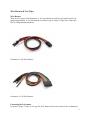
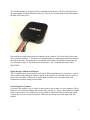
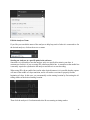
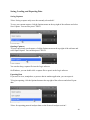
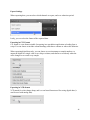
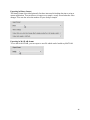
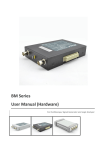
Saleae Logic Software Users Guide
Updated December 29, 2014
Contents
Wire Harness & Test Clips ................................................................................................................ 2
Logic Software - Installation.................................................................................................................. 6
Collecting Data & Device Settings ......................................................................................................... 8
Navigating Your Data (zooming, panning, re-arranging, re-sizing etc) ............................................... 12
Measurements, Timing Markers, and Bookmarks .............................................................................. 20
Using the Trigger ................................................................................................................................. 26
Using Protocol Analyzers .................................................................................................................... 29
Saving, Loading, and Exporting Data................................................................................................... 34
Keyboard Shortcuts ............................................................................................................................. 37
Connecting to your Circuit .................................................................................................................. 38
Protecting Against Ground Loops ....................................................................................................... 39
1
Wire Harness & Test Clips
Wire Harness
There are two types of wire harnesses. A 1x9 wire harness is used by Logic and Logic16 (1st
generation products). A 2x4 wire harness is used by Logic 4, Logic 8, Logic Pro 8, and Logic
Pro 16 (2nd generation products).
Generation 2, 2x4 Wire Harness
Generation 1, 1x9 Wire Harness
Connecting the 2x4 harness
If you have Logic 4, Logic 8, or Logic Pro 8/16, then you have one or more 2x4 wire harnesses.
2
The four black leads are ground, and these should be on the bottom. The four colored leads are
the signal inputs, and they should be on the top. There is also an indication of this orientation on
the back side of the device.
Note that the test lead color matches the channels in the software. The colors reflect the resistor
color code for numbers 0-7. The numerical channel number is written on the white heat shrink at
the ends of the leads. The lead ends are terminated with a Molex 0016020086 crimp connector
for connection to typical .100-inch spaced headers/pins. The 2x4 plastic housing is Molex
0022552081.
Signal Integrity with the 2x4 Harness
The 2x4 harness has a ground lead for each signal. When signal integrity is a concern -- such as
when working with high speed digital or analog in the presence of cross-talk sources, connect a
ground for each signal. Connect noisy digital inputs to leads as far as possible from leads
connected to sensitive analog measurements.
Connecting the 1x9 harness
If you have the original Logic or Logic16, then you have one or more 1x9 wire harnesses. These
harnesses are colored according to the resistor color code for 0-7. These colors match the channel
colors in the software. The ground wire is grey and has a GROUND label on white heat shrink.
Turn the device over for a ground symbol - and make sure the grey test lead aligns with this
symbol.
3
Signal Integrity with the 1x9 Harness
When using Logic16 with more than 8 inputs, we recommend connecting the second ground line
- especially if using higher voltages (5V). This will help reduce cross-talk during any
simultaneous switching events.
Test Clips
All Logic products come with enough test clips for every test lead. These test clips have two
metal pins that can be inserted into the connector at the end of each test lead.
4
Connecting to headers
If your PCB has .100-inch headers that break out signals you need to examine, you can connect
the test leads to these pins directly.
Ultra-fine pitch and other difficulties
In many situations it may be difficult to connect Logic directly to your signal. Generally in these
situations you'll want to solder a wire (typically wire-wrap wire) to an exposed pin, trace, or via,
and then use Logic's test clip to connect to that wire.
5
Logic Software - Installation
Downloading the Latest Software
The latest Logic software can be found at https://www.saleae.com/downloads. You can install
this software on as many machines as you like.
Note: beta software may also be available, and this can also be found
at https://www.saleae.com/downloads
Checking if You Have the Latest Version
With the Logic Software open, click the Options button at the top right of the software. There is
a menu item, 3rd from the bottom, containing update availability information.
Installing for Windows
Simply download and run the installer - it is the same as other software you have installed in the
past. During the installation, you will be prompted if you want to trust software from Saleae (you
do). This is because we install a driver for the Logic hardware.
Installing for Mac
Simply download, double click, and drag the Logic software into the Application Folder - the
same as you would when installing other Mac software.
6
Installing for Linux
Download the zip file and extract it. The software will run from this folder. You can leave this
folder on your desktop, or more it anywhere you like that has write permissions Launch the
Logic software my opening the folder and double-clicking the Logic executable. You may wish
to make a shortcut to this executable for more convenient access.
Installing for Linux - Driver
Before using the software with the Logic hardware, you'll need to give the application
permission to access the device (otherwise you'll have to launch the application with sudo). To
do this, unplug any attached Logic device(s), and from the command line, navigate to the Driver
folder and run the script install_driver.sh.
7
Collecting Data & Device Settings
Demo Mode
When no Logic device is connected, the software will work in a demo mode - which is virtually
identical to how it will function when a device is connected. This way you can become familiar
with the software before your Logic device arrives.
Collecting Data
To start collection data, just press the big Start button. After the capture has started you can stop
it before it finishes if you like - this will retain the data to that point.
Device Settings
To access the device settings, click the up/down arrow next to the Start button.
8
Speed (Sample Rate)
9
The sample rate drop-down lets you select how fast to sample data - how many times per second
your signal is measured. The available options depend on your device, the channels being used,
and the performance level selected. Digital data is compressed - no additional memory is used
when sampling faster. Rather, memory usage is proportional to the number of transitions in the
digital data. Analog data is not compressed, and consumes roughly 4 bytes/sample. At 50Msps,
this is 200MB per second, per channel.
Duration
The duration text box allows you to enter the duration of your capture.
Channels
The channels controls lets you quickly enable and disable the channels you would like. You can
click and drag over the control to change a number of channels at the same time.
10
Using fewer channels uses less memory and allows for faster sampling.
Voltages
For devices that support it, you can edit the voltage level of your digital signals. This affects the
voltages at which an input is considered a one or a zero.
Performance
Not all computers / USB host controllers will be able to capture at top speed. If this happens you
can throttle back the performance setting with this control. This will update the sample rates that
are available.
Device
If you have more than one Logic attached, you can toggle between them here. You also can
control the LED color here - just click the gear icon.
Closing the Device Settings Popover
To close the Device Settings, click on something outside the popover.
11
Navigating Your Data (zooming, panning, re-arranging, re-sizing etc)
Zooming in and Out
To zoom in and out, use your mouse wheel.
You can also use the up/down arrow keys, or the plus/minus keys.
Panning Left and Right
To pan right and left, click and drag the display.
12
You can also use the right/left arrow keys, or use the scroll bar at the bottom of the display.
Jumping between Digital Edges
Sometime digital data comes in packets, with long periods of idle in between.
To jump over idle periods, move your mouse to the far right or far left of a particular channel - a
jump button will appear.
13
Click this button to jump to the next digital transition on that channel.
You can also use the keyboard shortcuts N and P (next and previous). The keyboard shortcut
applied to the channel whose jump button was last pressed.
Scrolling Through Channels
Sometimes you may have more channels displayed than can fit on the screen at the same time.
Move your mouse over the channel labels on the left side of the software, and scroll up and down
with your mouse wheel.
14
Alternatively, there is a slider bar at the right side of the channel graphs.
You can also use the Page Up and Page Down keys.
Using Tabs
15
After you've captured some data, the Capture tab at the bottom left of the screen will have a
button with a double-arrow on it.
Click this arrow to move the data into its own tab. To capture more data, go back to the Capture
tab.
To edit the text shown on a tab, click the text.
Re-Arranging Channels
To re-arrange channels, drag them by their grip icon at the far left of the channel.
To drag more than one channel, select the first channel by clicking anywhere in the channel label
area.
16
Then control-click additional channels - selecting them as well. You can use shift-select to select
a range of channels.
Then drag one of the channels by its grip icon - all the selected channels will move together.
To reset the channel order, click the channel settings icon (gear) on any channel and select Reset
All Channels.
Changing Channel Size
To change the channel size, click the channel settings icon (gear) on the desired channel and
select a new size.
17
To change multiple channels to the same size, select them (control-click) and then set one of the
selected channel's size. All the selected channels will change their size.
To select all channels, select one, and then press CTRL-A.
Hiding Channels
18
To hide a channel, click the channel settings icon (gear) and select Hide Channel.
You can hide multiple channels at the same time be selecting multiple channels and then
selecting Hide Channel on one of them.
To restore this and other hidden channels, click on on channel's settings icon and select Reset All
Channels.
19
Measurements, Timing Markers, and Bookmarks
Digital Measurements (temporary)
To see digital measurements, place your mouse over pulses in the waveform.
To edit the measurements shown, right-click to get a menu. For advanced measurements, see
Using Measurements (persistent) below.
Analog Measurements (temporary)
To see analog measurements, place your mouse over the analog waveform.
To edit the measurements shown, right-click to get a menu. For advanced measurements, see
Using Measurements (persistent) below.
20
Using Annotations
All annotations are listed in the Annotations sidebar at the top right of the software. By default,
the Annotations sidebar will contain a Timing Marker annotation.
Using Timing Markers
Timing markers can be used to measure elapsed time between any two locations in your data. By
default, the Annotations sidebar will contain a Timing Marker annotation.
To place a timing marker, first press the A1 or A2 buttons.
Move your mouse to the desired location, and click to place the marker.
21
To cancel placing a timing marker, right-click.
You can also place timing markers with the keyboard 1 and 2 keys.
To place additional markers, click the Plus button on the Annotations panel and select Timing
Marker Pair.
To zoom to a particular timing marker pair, click its icon -- which appears at the left side of the
Annotation panel.
To delete a timing marker, select its settings icon (gear) and choose Delete Annotation.
22
Using Bookmarks
A Bookmark is simply a recording of your exact position and zoom level in your data. By
making a bookmark, you can quickly zoom back to this area again later.
To add a Bookmark, click the Plus button on the Annotations panel and select Bookmark.
To edit the name of the bookmark, click the Bookmark's label (which by default will be
'Bookmark').
To zoom to a Bookmark, click its icon at the left side of the Annotations panel.
To delete a bookmark, select its settings icon (gear) and choose Delete Annotation.
23
Using Measurements (persistent)
Adding a Measurement allows you to add a permanent annotation to your data, for later
reference. In addition, Measurement Annotations allow for more sophisticated computations than
the temporary measurements that always appear at the mouse cursor. For example, you can
compute the average duty cycle across thousands of pulses. On analog channels, you can
compute the RMS voltage of a given selection.
To add a Measurement Annotation, click the Plus button on the Annotations panel and select
Measurement.
Use your mouse to click the starting point of your measurement.
Next, click the desired ending point.
To change which measurements are displayed, right click anywhere inside the measurement area.
The Measurement appears in the Annotations side bar at the right of the software.
24
Click on the text to edit the name of the Measurement.
To zoom in on the measurement, click its icon on the left side.
To delete a measurement, click on its Gear button and select Delete Annotation.
You can also delete a Measurement by right-clicking anywhere in the Measurement area and
selecting Delete Measurement.
25
Using the Trigger
Using the Trigger
The trigger can be used to start capturing data after a specified digital event occurs.
Two types of trigger are supported: Trigger on Edge, and Trigger on Pulse Width.
Triggering on an Edge
To trigger on on an edge (high to low, or low to high digital transition), click the +Trigger button
on the desired channel, and select the positive or negative edge.
After setting the trigger, you can press the start button to begin searching for the trigger. If and
when the trigger condition is identified, data collection will start.
If desired, you can also require other channels to be either high or low during a the previously
selected edge. After selecting an edge, note that other channels will display a button with an 'X'.
'X' indicates 'don't care'.
To require a high or low, click this button and select high or low.
26
Triggering on a Pulse Width
You can also trigger on a pulse width condition - where a particular channel is high or low for a
specified amount of time.
To add a pulse width trigger, click the +Trigger button on the desired channel, and select the
positive or negative edge. Next, enter the desired time range to search for.
If desired, you can also require other channels to be either high or low during a the previously
selected pulse. After selecting an edge, note that other channels will display a button with an 'X'.
'X' indicates 'don't care'. To require a high or low, click this button and select high or low.
Searching with a Trigger
After data has been collected, you can search for events within the data using the trigger. The
trigger can be added or modified after data has been collected.
After the trigger has been set up (see above), and data has been collected, left and right arrows
will appear next to the trigger button on the channel used for the edge or pulse width condition.
Click these arrows to advance to sections of the data that satisfy the trigger condition.
27
Turning off the Trigger
To remove the trigger, deselect the trigger type button.
28
Using Protocol Analyzers
Protocol Analyzers decode data that has been encoded according to a particular protocol, such as
SPI or I2C. The Logic software currently offers 23 different protocol analyzers.
Adding Protocol Analyzers
To add a Protocol Analyzer, click the Plus button on the Analyzers sidebar on the right of the
software.
Analyzer Settings
Different Analyzers require different settings.
All protocol analyzers require you to specify which channels should be used for specific inputs
used by the protocol.
If, after running a protocol analyzer, you notice that it doesn't work or doesn't display correctly,
you may want to try editing the settings. For example, the SPI Analyzer must be set up to match
the data exactly for correct decoding.
To edit the settings for an existing analyzer, find that analyzer in the Analyzers panel on the right
of the software. Click the Gear button, and select Edit Settings.
29
After editing your analyzer settings, the analyzer will re-run against any data you have collected,
and will update all results.
Changing the Global Radix (Hex, Decimal, etc)
By default, all protocol analyzers will use the global radix settings.
To change the global radix, click the Options button at the top right of the software, and then
click the desired radix: Ascii, Ascii & Hex, Binary, Decimal, or Hexadecimal.
You can also use the keyboard shortcuts CTRL-A, CTRL-B, CTRL-D, or CTRL-H for Ascii,
Binary, Decimal or Hexadecimal respectively.
Changing Analyzer-Specific Radix (Hex, Decimal, etc)
Sometimes you need to specify a different radix for different analyzers. To do this, locate the
analyzer you would like to change in the Analyzers panel on the right of the software. Click the
Gear button and select the desired radix button.
30
Edit the Analyzer Name
If you like you can edit the name of the analyzer to help keep track of what it is connected to. On
the desired analyzer, click on the text to re-name.
Starting an Analyzer at a specific point in the software
Sometimes it is desirable to start the analyzer only at a specified location in your data. A
common use for this is if you are using SPI without an enable line. A transition on the enable line
is normally required to synchronize the analyzer and allow it to start decoding.
When using SPI with no enable line (and in other desired instances) it is possible that the capture
will start in the middle of a byte transition, and it will not have a means to properly find the
beginning of a byte. In this case, you can manually set the starting location by first setting the A1
timing marker at the desired starting location.
Then click the analyzer's Gear button and select Re-run starting at timing marker.
31
Viewing Protocol Analyzer Results
When a protocol analyzer successful decodes data, colored regions will appear above the digital
waveform where a byte or other bit-field is transmitted. Be sure to zoom in far enough to see the
transitions making up a particular byte or bit-field.
In addition to displaying results over the digital waveform (in context), results are displayed in a
list in the Decoded Protocols panel on the right of the software.
Clicking an individual item in this list will zoom to that location in the digital waveform.
Searching Analyzer Results
To search for a specific result, type the exact text you would like to match. For example, if you
would like to find transactions involving the I2C address 0x42, type '0x42' -- assuming the
display radix is hexadecimal.
32
Exporting Analyzer Results
To export the results of a particular protocol analyzer, click the Gear button on that analyzer and
select Export as text/csv file.
To export more than one protocol analyzer, or a only results that match your search, click the
Gear button on the Decoded Protocols panel and select Export search results.
33
Saving, Loading, and Exporting Data
Saving Captures
*Note: Saving a capture only saves the currently selected tab*
To save your current capture, click the Options menu on the top right of the software and select
Save Capture. You can also press CTRL-S.
Opening Captures
To open a previously saved capture, click the Options menu on the top right of the software and
select Open Capture. You can also press CTRL-O.
You can also drag a capture file into the Logic software.
On Windows, you can double-click a capture file to open it in the Logic software.
Exporting Data
If you need to view, manipulate, or process data in another application, you can export it.
To begin exporting, click the Options button at the top right of the software and select Export
data.
*Note: for exporting protocol analyzer data see the Protocol Analyzer section.*
34
Export Settings
When exporting data, you can select which channels to export, and over what time period.
Lastly, you can select the format of the exported data.
Exporting in CSV Format
Csv format is a text format suitable for opening in a spreadsheet application or loading from a
script. You can choose to include column headings, and choose commas or tabs as the delimiter.
When exporting digital data only, you can choose to use timestamps or sample numbers, to
output the digital as a single value or as a bit per column, and choose to record only when the
value changes or to record every sample.
Exporting in VCD format
VCD stands for value change dump, and is a text-based format used for saving digital data (it
can't be used with analog data).
35
Exporting in Binary format
The binary format is provided primarily for those interested in loading data into a script or
custom application. You can choose to export every sample, or only record when the value
changes. You can also select the number of bytes used per sample.
Exporting in MATLAB format
To use data in MATLAB, you can export a .mat file which can be loaded my MATLAB.
36
Keyboard Shortcuts
Start a Capture: CTRL-R
Stop a Capture: ESC, or Enter (presses the Stop button)
Move right/left: Right/Left arrow Keys (Add CTRL to move faster.)
Zoom in/out. Up/Down Arrow Keys (Add CTRL to move faster.)
Place timing markers: All numbers 1=A1, 2=A2, 3=B1, and so on.
Save Session: CTRL-S
Open Session: CTRL-O
Export Data: CTRL-E
Change Radix: CTRL-A (Ascii) CTRL-H (Hex) CTRL-B (Binary) CTRL-D (Decimal). Note
that this changes the global radix.
Jump left/right to next edge: N (Next), P (Previous). Note that this apples to the channel where
you last clicked the Next/Previous button (appears at the beginning/end of a channel).
Scroll Channels Up/Down: Page Up/Page Down. Note this applies when more channels are
viable than fit vertically on the screen.
37
Connecting to your Circuit
Logic comes with a wire harness and a set of nine plastic micro-grippers (clips). Logic16 comes
with two pairs of both.
The micro-grippers are best used for connecting Logic to large IC pins, discrete components,
metal pins and test points.
If you're fortunate enough to be connecting to 0.1" male pins or a header, you can connect the
wire harness without the clip directly to your pins.
If you don't have test points, and either the pins on the parts you're looking at are too small for
the micro-grippers or there are no other accessible contact points large enough for the clips, you
will need to take extra steps to connect Logic. We recommend soldering wire-wrap wire (#30
gauge) to an exposed trace or pin, and then connecting that wire to a micro-gripper clip.
In the best case, you can design in a 1x9 0.1" pitch male header, and then purchase a 1x9 header
accessory from us to directly connect your Logic or Logic16.
Connect Logic to the PC before connecting it to your device. When Logic is not connected to
a USB port, its inputs will load any device you connect them to. While this loading will not
damage Logic or your device, it may cause issues with its operation. This can interfere with the
operation of I2C buses and other open drain interfaces. Logic16 does not have as strong of an
effect.
38
Protecting Against Ground Loops
The Saleae Logic & Logic16 User's Guide contains more information about the potential dangers
of ground loops when using test and measurement equipment. See the section titled "Safety and
Equipment Protection."
http://downloads.saleae.com/Logic+Guide.pdf
Ground loops are situations where there is more than one path between the grounds of two
electric circuits.
It is important to keep in mind that Logic and Logic16 are NOT electrically isolated from the
host PC or the device under test. This means that Logic or Logic16 share the same ground
reference, and that there is a low impedance path between the grounds of the three components.
It's considered best practice to make sure that the ground wire on Logic is the only ground path
between it and the device under test.
This way, when Logic's ground wire is removed, there is no more current return path between
the devices.
However, it is possible for there to be another ground connection between the device under test
and Logic. In most cases, this is through earth ground, or mains ground. Most desktop and laptop
PCs will connect their grounds to earth ground through their power supply. Depending on how
your device under test is powered, it might also share earth ground. In this case, even if you
remove the ground pin between Logic and your device, there is still a ground return path
between them.
The most important thing to note in this case is that Logic's ground and your device's ground are
at the same potential level, even when disconnected. If you accidentally touch Logic's ground
wire to a voltage rail on your device, it will create a short circuit – using Logic and your host PC
as the ground return path.
Logic's ground connection to the USB port includes a re-settable fuse; however, this may not tip
fast enough to prevent damage.
If you can, avoid creating a secondary ground path between your device and Logic.
If you need to operate under conditions were a ground loop is present, keep it in mind and use
extra care when connecting or removing the ground pin.
See the user's manual for more information.
39