1
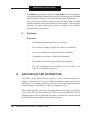
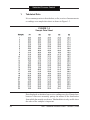
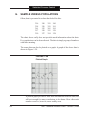
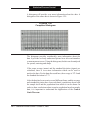
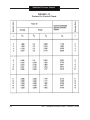
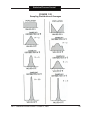
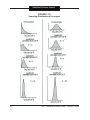
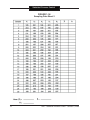
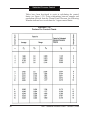
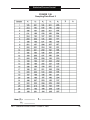
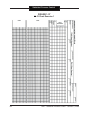
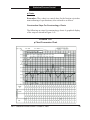
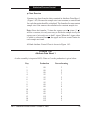
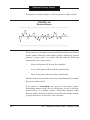
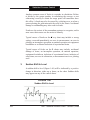
Statistical Process Control
2.
Sample Versus Population Exercises
For the 125 data points on Sample Data Sheet 2 (Figure 1-34),
calculate:
1. The average and standard deviation of the 125 values.
2. The sample average and range of the 25 subgroups of 5 values
each.
3. The average of the averages from Step 2 and the standard
deviation of the subgroup average. Compare them to the values
calculated in Step 1.
4. Construct histograms of the individual values and of the sample
averages using the blank graph paper provided with Figure 134). Note the similarities and differences between the two.
(Note: A histogram of the individual values was done in Section D on
the Display/Distribution of Data.)
H. CONTROL CHARTS
The Control Chart is one of the most important tools of SPC. Control charts
are simple, yet powerful tools for checking the stability of a process over
time, as well as verifying the results of any improvement actions taken.
Remember: The measured quality of any manufactured product is subject
to a certain amount of variation as the result of chance. A stable “system
of chance causes” is inherent in any scheme of production and inspection.
This variation is unavoidable as long as the production and inspection system
remain unchanged. However, causes of variation outside this stable pattern
can be discovered and corrected.
The power of the control chart is in its ability to separate these assignable
causes of quality variation from inherent, unavoidable causes.
AIDT - Statistical Process Control - October 5, 2006
71