1
PRECISE 82RB INFUSION SYSTEM FOR CARDIAC PERFUSION MEASUREMENT
USING 3D POSITRON EMISSION TOMOGRAPHY
by
Ran Klein B.A.Sc
A thesis submitted to the
Faculty of Graduate and Postdoctoral Studies
in partial fulfillment of the requirements for the degree of
Master of Applied Science
in Electrical and Computer Engineering
Ottawa-Carleton Institute for Electrical and Computer Engineering
School of Information Technology and Engineering (Electrical & Computer Engineering)
Faculty of Engineering
University of Ottawa
February, 2005
©2005, Ran Klein, Ottawa, Canada
82
Rb Elution System Control
Ran Klein, University of Ottawa
Credits
I wish to extend my gratitude to Robert deKemp and Andy Adler for guiding me
through this project. Their mentoring, support, and friendship have made this a memorable
experience.
ii
82
Rb Elution System Control
Ran Klein, University of Ottawa
Abstract
Introduction: Quantitative myocardial perfusion measurements using positron
emission tomography (PET) can be improved by introducing diagnostic tracers at a constant
rate of activity. 82Rb can be produced cost effectively by eluting a 82Sr/82Rb generator with
saline; however, it exhibits an undesirable, but reproducible, activity rate variation.
Previously, a threshold-comparison algorithm controlled saline flow through either generator
or bypass line using an on/off valve, to simulate constant-activity elutions. Methods: In this
work a mechanical system and control software is developed to control tracer infusion. The
valve is cycled at 5Hz and its duty-cycle controlled by a predictive-corrective algorithm in
order to reduce measurable activity rate fluctuations. Results: Precision increases (RMS
error improves from >40% to ~14%) as does the range of relative activities that can be eluted
from the generator. Conclusion: The proposed method demonstrates superior precision and
flexibility. However, further tests must be conducted to ensure that the precision of the
system does not deteriorate over time.
Key Words: Rubidium-82, 82Sr/82Rb generator, cardiac, perfusion, positron emission
tomography, PET, predictive control.
iii
82
Rb Elution System Control
Ran Klein, University of Ottawa
Table of Contents
Credits
........................................................................................................................................................ii
Abstract
.......................................................................................................................................................iii
Table of Contents.................................................................................................................................................. iv
Table of Figures.................................................................................................................................................... vi
Table of Tables ...................................................................................................................................................viii
List of Acronyms .................................................................................................................................................. ix
List of Variables .................................................................................................................................................... x
Introduction ........................................................................................................................................................ 1
Chapter 1: Introduction to Molecular Imaging and Dynamic PET ................................................................... 4
1.1 Positron Emission Tomography ................................................................................................................ 4
1.2 82Sr/82Rb Generator – a Cost-effective Tracer Source............................................................................... 7
Sr Breakthrough............................................................................................................................................. 9
1.3 82Rb Elution Profiles ............................................................................................................................... 10
1.4 Constant-Activity Elution for Quantitative Perfusion Measurement in the Left Ventricle of the Heart . 11
1.5 Quantitative Perfusion Measurements Using 82Rb .................................................................................. 14
Chapter 2: The Second Generation 82Rb Infuser – a starting point................................................................. 16
2.1 The Daily Protocol and Elution Types .................................................................................................... 17
2.2 Hardware Description ............................................................................................................................. 19
2.3 Prototype Performance............................................................................................................................ 25
2.4 Further Development of the 82Rb Elution System (RbES) ...................................................................... 26
Chapter 3: System Design and Conceptual Understanding ............................................................................ 28
3.1 Requirements........................................................................................................................................... 28
Functional Requirements ............................................................................................................................. 28
Non-Functional Requirements..................................................................................................................... 29
Other Requirements ..................................................................................................................................... 30
3.2 Initial Design Considerations .................................................................................................................. 32
Safety........................................................................................................................................................... 32
Process Monitoring...................................................................................................................................... 33
Hardware Modifications .............................................................................................................................. 34
Software packages ....................................................................................................................................... 36
3.3 Flow Hardware Layout Justification ....................................................................................................... 39
Pump Speed Variation ................................................................................................................................. 40
Bypass Ratio Control................................................................................................................................... 41
3.4 Design of Physical Processes .................................................................................................................. 43
Run sequence............................................................................................................................................... 44
Calibration ................................................................................................................................................... 45
Breakthrough Activity Measurement........................................................................................................... 50
Elution Tests ................................................................................................................................................ 52
3.5 Software Design ...................................................................................................................................... 53
Pre-Run Stage and the GUI-Sequence......................................................................................................... 53
Post-Run Stage ............................................................................................................................................ 55
Real-Time Sequence.................................................................................................................................... 56
Physical Sequence ....................................................................................................................................... 58
3.6 Error Detection........................................................................................................................................ 64
Pressure Errors............................................................................................................................................. 66
Pump Communication and Operation Errors............................................................................................... 66
Computer Resources.................................................................................................................................... 67
Positron Detector Errors .............................................................................................................................. 67
iv
82
Rb Elution System Control
Ran Klein, University of Ottawa
Dose Calibrator Communication Errors ...................................................................................................... 67
Maintenance................................................................................................................................................. 67
Software Errors............................................................................................................................................ 68
Warnings...................................................................................................................................................... 68
Outlier Highlighting .................................................................................................................................... 68
3.7 System Refinement ................................................................................................................................. 69
Dose Calibrator Spike Removal Algorithm................................................................................................. 69
3.8 Summary ................................................................................................................................................. 70
Chapter 4: Elution Profile Control.................................................................................................................. 71
4.1 Threshold Comparison Algorithm with Auto-tuning Hysteresis Correction (HC-TC) ........................... 73
4.2 Variable Flow Control............................................................................................................................. 74
Cycling Valve Control................................................................................................................................. 74
Transient State Control ................................................................................................................................ 74
Implementation of the Variable Flow Control............................................................................................. 75
Valve Response Measurements ................................................................................................................... 76
Modeling of Valve Response....................................................................................................................... 79
PWM Valve Life Span................................................................................................................................. 80
4.3 Variable Flow Control Algorithms.......................................................................................................... 81
PID Control.................................................................................................................................................. 82
Forgetful PID Controller.............................................................................................................................. 85
Predictive Control........................................................................................................................................ 85
Predictive Corrective Control ...................................................................................................................... 88
Initial Error Removal................................................................................................................................... 89
Setting the Saline Flow Rate........................................................................................................................ 90
Automatic Parameter Tuning....................................................................................................................... 91
Summary...................................................................................................................................................... 96
Chapter 5: Testing and Characterization......................................................................................................... 98
5.1 Safety Testing.......................................................................................................................................... 98
The Worst Case Scenario............................................................................................................................. 99
5.2 Test Cases.............................................................................................................................................. 100
User Interface Testing................................................................................................................................ 102
Functional Testing ..................................................................................................................................... 102
Error Handling Testing .............................................................................................................................. 103
5.3 Testing in a Routine Clinical Setting..................................................................................................... 103
Computer Crash Issue................................................................................................................................ 104
5.4 Calibration Characterization.................................................................................................................. 106
Calibration Constant vs. Flow Rate ........................................................................................................... 107
Summary of Calibration Analysis.............................................................................................................. 109
5.5 Analysis of the Self-Tuning Model ....................................................................................................... 110
Variation in Valve Model Parameters with Requested Elution Parameters............................................... 112
Analysis of Tuned Valve Response ........................................................................................................... 114
5.6 Elution Tests.......................................................................................................................................... 116
Range of Relative Activities as a Function of Elution Duration................................................................ 120
5.7 Generator Life Span .............................................................................................................................. 121
Breakthrough Sr Activity........................................................................................................................... 122
Activity Curves.......................................................................................................................................... 123
5.8 Benefits of 82Rb Constant-Activity Elutions ......................................................................................... 124
Comparison of 82Rb and 13N-ammonia for Measurement of Perfusion in 3D PET ................................... 124
Optimized Perfusion Measurements .......................................................................................................... 126
5.9 Critical Analysis and Future work......................................................................................................... 127
Chapter 6:
Conclusion .................................................................................................................................. 130
List of References.............................................................................................................................................. 133
Appendix A: Test Cases ................................................................................................................................... 137
v
82
Rb Elution System Control
Ran Klein, University of Ottawa
Table of Figures
Figure 1-1 – Positron emission tomography......................................................................................................... 5
Figure 1-2 – 82Rb uptake images for measurement of myocardial perfusion. ...................................................... 6
Figure 1-3 – 82Sr/82Rb decay sequence. ................................................................................................................ 8
Figure 1-4 – 82Rb activity during recharging of a generator............................................................................... 10
Figure 1-5 – Generator activity/volume curves with different flow rates and at different times. ....................... 11
Figure 1-6 – Dynamic 82Rb imaging of a canine heart. ...................................................................................... 12
Figure 2-1 – Daily protocol flow chart. .............................................................................................................. 19
Figure 2-2 – Hardware component diagram of RbES......................................................................................... 19
Figure 2-3 – Photograph of the assembled RbES and its components................................................................ 24
Figure 2-4 – Photograph of top cover of the RbES............................................................................................. 24
Figure 2-5 – Elution of 50% bolus activity within 30 s using a simple threshold comparison algorithm. ......... 25
Figure 3-1 – Electro-optic level switch operation............................................................................................... 35
Figure 3-2 – Response of transport of activity through a fixed volume line at a fixed flow rate........................ 40
Figure 3-3 – Flow control through generator using a bypass line maintains a constant flow rate through all
other lines. .................................................................................................................................................. 41
Figure 3-4 – Flow control through the generator using a variable pinch valve on the generator line................. 42
Figure 3-5 – Flow control through the generator using a double sided pinch valve on the bypass line and
generator line. ............................................................................................................................................. 43
Figure 3-6 – Schematic of the activity counter relating some of the factors that contribute to its efficiency
measure....................................................................................................................................................... 46
Figure 3-7 – Dose calibrator chamber measurement diagram. ........................................................................... 47
Figure 3-8 – Sample calibration run results........................................................................................................ 48
Figure 3-9 – Aperture response of the dose calibrator as a function of distance along the saline line from
the vial. ....................................................................................................................................................... 49
Figure 3-10 – Example of a constant-flow test run without (top) and with (bottom) a Gaussian aperture
correction. ................................................................................................................................................... 50
Figure 3-11 – Opening message screen. ............................................................................................................. 53
Figure 3-12 – Various screenshots...................................................................................................................... 54
Figure 3-13 – Sequence, data, and control, flow and structure diagram of software.......................................... 56
Figure 3-14 – The Hardware_Interface model.................................................................................................... 57
Figure 3-15 – Flow Chart for all elution types. .................................................................................................. 59
Figure 3-16 – Inputs to the Physical_Sequence M-file S-Function block. ......................................................... 62
Figure 3-17 – Calibration results with and without the dose calibrator peak removal algorithm. ...................... 70
Figure 4-1 – Elution of 50% bolus activity within 30 s using a simple threshold comparison algorithm. ......... 72
Figure 4-2 – Pulse-width-modulation control of a solenoid valve to simulate a variable pinch valve. .............. 74
Figure 4-3 – Activity vs. time curves as measured with the generator valve cycling at 15 Hz at various
generator valve duty-cycles. ....................................................................................................................... 76
Figure 4-4 – Valve response curves at υvalve = 2, 5, 15, and 100 Hz................................................................... 77
Figure 4-5 – Elutions at valve flow ratio ≈ 50% produced by cycling the generator valve at 2, 5, and
15 Hz. ......................................................................................................................................................... 78
Figure 4-6 – Valve response (υvalve = 5 Hz) with the swapped axes, allows to determine the duty-cycle
needed to achieve a desired valve flow ratio. ............................................................................................. 79
Figure 4-7 – Closed loop controlled system using a PID controller. .................................................................. 83
Figure 4-8 – Affects of PID controller parameters on system response. ............................................................ 83
Figure 4-9 – Sample simulation results of a PID controlled elution................................................................... 84
Figure 4-10 – Modified PID correction implementing a “forgetful” proportional component........................... 85
Figure 4-11 – Block diagram of the predictive-corrective control of a PWM valve. ......................................... 88
Figure 4-12 – Simulation of perfect control with erroneous activity concentration prediction due to a
slight volume shift. ..................................................................................................................................... 89
Figure 4-13 – Analyzed errors of a constant-activity elution with flow ratios spanning a large range. ............. 93
Figure 4-14– Analyzed errors of a constant-activity elution with flow ratios only in the lower range. ............. 93
Figure 4-15 – Demonstration of an elution in which the entire bolus activity has been eluted. ......................... 95
Figure 5-1 – Sample test case layout. ............................................................................................................... 102
Figure 5-2 – Calibration constant over the course of a generator life............................................................... 106
vi
82
Rb Elution System Control
Ran Klein, University of Ottawa
Figure 5-3 – Correlation of calibration constant to generator activity.............................................................. 107
Figure 5-4 – Calculated calibration constant over the range of flow rates. ...................................................... 108
Figure 5-5 – Calibration constant dependence on flow rate in the case of a high flow resistant generator
column. ..................................................................................................................................................... 109
Figure 5-6 – Progress of accelerated self-tuning of the valve response model over three successive
elutions at 30% over 30 s.......................................................................................................................... 111
Figure 5-7 – Evolution of parameters G and L during self-tuning through repeated runs of 30% relative
activity over 30 s....................................................................................................................................... 112
Figure 5-8 – Parameters G and L evolving during a 30% relative activity over 30 s training session. ............ 112
Figure 5-9 – Example activity rate error measurements used for valve response model parameter tuning
that could lead to conflicting adjustments based on how the data is treated............................................. 113
Figure 5-10 – Adaptation of parameter L over a repeated sequence of 50% relative activity over 30 s
elutions revealed that the adaptation law is flawed................................................................................... 114
Figure 5-11 – Valve response correction curve used to determine the PWM duty-cycle required to achieve
a desired valve flow ratio.......................................................................................................................... 115
Figure 5-12 – Comparison of performance measures of elutions [n=10] over 30 s at 10, 30, 50, and 70%
relative activity. ........................................................................................................................................ 118
Figure 5-13 – Activity rate at patient outlet calculated based on the activity counter readings and dose
calibrator readings. ................................................................................................................................... 119
Figure 5-14 – Range of relative activities that can be achieved using the HC-TC method and the PCCPWM method without significantly influencing the precision. ................................................................ 121
Figure 5-15 – Breakthrough ratio progression over time.................................................................................. 122
Figure 5-16 – Normalized activity rate vs. time curves measured during calibration runs over the life span
of a generator. ........................................................................................................................................... 123
Figure 5-17 – Example of 82Rb and 13N-ammonia blood curves. ..................................................................... 126
vii
82
Rb Elution System Control
Ran Klein, University of Ottawa
Table of Tables
Table 1-1 – Commonly Used Positron-Emitting Isotopes [1] .............................................................................. 6
Table 2-1 – Minimum PC Requirements ............................................................................................................ 20
Table 3-1 - Software Environment ..................................................................................................................... 38
Table 3-2 – Elution parameter values for each run type. .................................................................................... 60
Table 3-3 – Physical_Sequence states and their termination conditions. As long as a termination condition
is not met, the state is maintained unchanged............................................................................................. 63
Table 3-4 - Detectable errors and their corresponding flags............................................................................... 65
Table 4-1 - Comparison of elution time accuracy using the threshold comparison algorithm with (HC-TC)
and without hysteresis correction. .............................................................................................................. 74
Table 4-2 - Parameters used by the prediction algorithm. .................................................................................. 92
Table 5-1 – Canadian Standards Association (CSA) field evaluation for electro-medical equipment results
for two RbES systems................................................................................................................................. 99
Table 5-2 - Test classification codes and their descriptions. ............................................................................ 101
Table 5-3 - List of global structures and their contents. ................................................................................... 105
Table 5-4 – Typical constant-activity elution profiles for various relative activities and over 30 s. ................ 117
Table 5-5 - Comparison of Performance measures for HC-TC and PCC-PWM 30 s Elutions [n=10]............. 118
Table 5-6 - Dynamic scan time frame durations for 82Rb and 13N-ammonia perfusion measurements. ........... 125
Table 5-7 – Rest study results comparing perfusion measurements in a dog at varied 82Rb constantactivity elution time durations and activities show that similar results are obtained regardless of these
elution parameters..................................................................................................................................... 127
viii
82
Rb Elution System Control
Ran Klein, University of Ottawa
List of Acronyms
DAQ
DLL
FDG
FOV
GUI
HL
K
Kr
LCD
LOR
MSE
MRI
NI
PET
PID
PWM
QA
Rb
Sr
UPS
UOHI
Data Acquisition Card
Dynamically Linked Library
Fluorodeoxyglucose
Field of View
Graphical User Interface
Half Life
Potassium
Krypton
Liquid Crystal Display
Line of Response
Mean Squared Error
Magnetic Resonance Imaging
National Instruments
Positron Emission Tomography
Proportional Integral Derivative
Pulse Width Modulation
Quality Assurance
Rubidium
Strontium
Uninterruptible Power Supply
University of Ottawa Heart Institute
ix
82
Rb Elution System Control
Ran Klein, University of Ottawa
List of Variables
a(d)
A82Rb, A82Sr, A85Sr
ACal
ÂBreakthrough
ÂP(t)
AP(t)
AReq
&
A
P
&
A
Dose calibrator aperture response
Activity of delivered 82Rb, 82Sr, 85Sr (MBq)
Activity eluted during calibration run (MBq)
Activity measured at dose calibrator for breakthrough calculation (MBq)
Measured activity at point P at time t (MBq)
Activity at point P at time t (MBq)
Requested activity (MBq)
Desired activity rate at point P (MBq/s)
Desired activity rate at activity counter (also referred to as the set point) (MBq/s)
ˆ&
A
C (t)
~
& (t)
A
C
CC(v)
ĈMCMN̂ Det (t)
nLow, nHigh
DPQ
f
F
G
H
k
K
KA
L
O
p
r (t), r̂(t)
rt
Π(t)
Πmin, Πmax
s(t)
T̂corr
TPQ
TReq
T̂Elution
Tierm
VPQ
V̂Corr
γH
γR
γL
γS
α
λ
φ
υvalve
υclk
∆ς
Measured activity rate at activity counter (MBq/s)
C
Activity rate error at activity counter (MBq/s)
Activity concentration vs. eluted volume curve measured at calibration (MBq/ml)
Measured activity concentration just prior to the merger (MBq/ml)
Predicted activity concentration just prior to the merger (MBq/ml)
Measured raw count rate at the activity counter (detector) (cps)
Counts for low, high output of the square wave generator
Decay during transport between points P and Q (unitless)
Flow rate (ml/min)
Sigmoid factor for valve response model
Sigmoid horizontal factor for valve response model
Hysteresis of the generator valve
Activity counter intrinsic efficiency (cps/Bq)
Activity counter calibration constant (10-6cps/ml·Bq)
Average activity counter calibration constant (10-6cps/ml·Bq)
Linear slope of valve response model
Constant offset of valve response model
Count rate set point (counts/s)
Desired, measured flow ratio at time t
Threshold desire flow ratio at which dΠ/dr=2·L
Valve duty-cycle (ratio) at time t
Valve lower and upper bounds of duty-cycle
Ratio of 85Sr to 82Sr isotopes at time t since manufacturer measurements, s0
Measured time shift correction of dose calibrator curve (s)
Transport delay between points P and Q (s)
Requested Elution Time (s)
Measured Elution Time (s)
Time delay of initial error removal mechanism (IERM) (s)
Volume of lines between points P and Q (ml)
Measured correction to eluted volume (ml)
Hysteresis learning factor
Valve response upper limit learning factor
Valve response linear slope learning factor
Valve response sigmoid scaling learning factor
Dose calibrator aperture response time constant (1/ml2)
Decay constant (1/s) 0.0091 for 82Rb
Forgetting factor in modified PID controller
Valve cycling frequency (Hz)
Counter clock frequency (Hz)
Range of correction during saturation
x
82
Rb Elution System Control
Ran Klein, University of Ottawa
Introduction
This work describes the development of a Rubidium-82 (82Rb) infusion system for
use in positron emission tomography (PET). The system is based on a
82
Sr/82Rb generator,
which produces 82Rb activity continuously. The system is aimed at administering the activity
to patients in a precise and controlled manner.
82
Rb is used as a PET tracer for measurement of myocardial perfusion (blood flow) in
a non-invasive manner. Conventionally,
82
Rb perfusion imaging has allowed measurement
only of the relative perfusion, with healthy regions of the myocardium serving as the
standard to which reduced perfusion can be compared. However, in cases of globally reduced
perfusion, no healthy standard is available, which may lead to misdiagnosis. Quantitative
perfusion measurements aim to solve this problem. It is believed that in order to improve
their robustness, the 82Rb activity should be introduced at a constant rate of activity. The goal
of this project is to develop a system that is capable of eluting
82
Rb at a constant rate of
activity from a 82Sr/82Rb generator for use in a clinical and experimental setting.
The first chapter begins by introducing PET and its applications. In particular the
chapter focuses on perfusion measurements in the left ventricle heart muscle. The focus then
shifts to perfusion tracers and how they are produced. Once the need for 82Rb is justified, the
functioning, history, and application of 82Sr/82Rb generators are described.
The second chapter introduces the second generation
82
Rb elution system (RbES),
built as part of this thesis work, following an overview of the literature with regards to
similar systems. This overview clarifies the work to date and the incremental contribution of
the RbES. The main topic in this chapter is a description of the RbES prototype, which
served as a starting point for this project. Final notes discuss the performance of the
prototype system, and issues that needed to be addressed in order to complete its
development.
The subsequent chapters discuss the contributions of this thesis. Initially, the system
requirements are identified (chapter 3) as well as guidelines for the development process. A
discussion of the system model follows in order to justify the layout of the elution hardware
that is inherited from the RbES prototype system.
1
82
Rb Elution System Control
Ran Klein, University of Ottawa
This chapter continues by describing the incremental development of the RbES.
Some hardware modifications for improvement of the usability and safety of the system are
discussed, but the main focus is on the new software. This includes all aspects of the
software with exception of the activity rate control system, which is left for chapter 4.
Special attention is given to the physical sequence that constitutes a complete elution
sequence.
The fourth chapter focuses on the single topic of improving the precision of constant
activity rate elutions. The use of an on/off valve as opposed to a variable flow valve is
justified. The justification is partially through the ability to simulate variable flow by cycling
the valve between its two states at a constant rate and modulating the duty-cycle (pulse width
modulation). This leads to modelling of the valve response and developing a control
algorithm.
A combination of varying activity concentrations from the
82
Sr/82Rb generator, long
transport delays, and short elution times render non model based control systems inadequate.
This problem is resolved using predictive-corrective control; a prediction algorithm is
developed to compute the activity concentration from the generator based on the volume
eluted through it. This is made possible by the good reproducibility of the activity
concentration vs. volume curve from the generator which is measured using a daily
calibration run. The eluted volume and any transport delays can also be computed with
sufficient accuracy, making prediction of the valve control possible. A corrective mechanism
driven by a conventional feedback loop is also included. The resulting control algorithm is
referred to as a predictive-corrective control of a pulse width modulated valve (PCC-PWM).
Chapter five attends to two topics: testing of the complete RbES as a final product
and comparing PCC-PWM performance with a simple threshold comparison (TC) control
algorithm included in the prototype system. Testing of the system demonstrates that the
system is matured for clinical and experimental use. Comparison of the two control
algorithms indicates that PCC-PWM is better for precision elution of
82
Rb activity at a
constant rate. As a result of the comparison studied in the chapter, the system performance is
well characterized.
2
82
Rb Elution System Control
Ran Klein, University of Ottawa
The final chapter draws conclusions from this project. These conclusions are related
to the achievements as well as to the limitations of the design. Future work is suggested in
order to overcome these limitations or achieve incremental results.
This work has resulted in the following publications:
•
R. Klein, A. Adler, R. S. Beanlands, R. A. deKemp, “Precision Control of Eluted
Activity from a 82Sr/82Rb Generator for Cardiac Positron Emission Tomography”,
Proceedings of the IEEE EMBS 26th Annual International Conference, 2004, Vol 1,
pp. 1393-96.
•
R, Klein, N. Epstein, A. Benelfassi, R.S. Beanlands, R.A. deKemp, “A Rubidium-82
Infusion System for Quantitative Perfusion Imaging with 3D PET”, Proceedings of
the 3rd Annual Imaging Network Ontario Symposium, pp. 98, 2004.
•
R. Klein, R.A. deKemp, N. Epstein, “RBES – Rb82 Elution System”, Copyright
1016208, Unpublished, November 14, 2003.
3
82
Rb Elution System Control
Ran Klein, University of Ottawa
Chapter 1: Introduction to Molecular Imaging and Dynamic PET
With the ability to image the physiological distribution of specific molecules within
the body in a non-invasive manner, nuclear medicine imaging has become a leading
diagnostic tool. A compound labelled with a radioactive isotope is introduced to the patient,
usually by injection, and its location in the body is later imaged using a scanner sensitive to
the emitted radiation. The compounds, referred to as radiolabelled tracers, are designed to
interact within the patient so that they collect in a region of interest by participating in a
biochemical process of interest. Over time, the radioactive label in the tracer decays resulting
in emission of radiation.
Given a closed system containing radioactive material, an exponential decrease of
activity is observed as time progresses. The rate of decay is a characteristic property of the
radioactive isotope, and is measured as a statistical average of the time that passes until half
the original activity remains. This measure is referred to as one half-life, T1/2, and can vary
from split seconds to countless years depending on the isotope. In molecular imaging, one
would like to use an isotope that lasts long enough to perform the measurement, but short
enough to minimize exposure to the patient. A short half-life also carries the benefit of
reducing the time between repeated scans of the same subject. Typical imaging applications
use isotopes with a half-life ranging from several seconds to several hours.
When imaging the patient, objects containing a high concentration of the tracer
radiate strongly, contrasting with the surroundings. A scanner that measures the radiation
from the patient can reconstruct tomographic images through the region of interest. The
concentration of activity is dependent on the interaction of the tracer within the body and is
therefore indicative of a corresponding biochemical and physiological processes within the
body, in contrast to anatomical images produced by modalities such as conventional x-ray
computed tomography (CT) and magnetic resonance imaging (MRI).
1.1
Positron Emission Tomography
Positron Emission Tomography (PET) is the leading nuclear imaging modality in
terms of precision and ability to make quantitative measurements. The radioactive label is an
isotope that decays by positron emission. In the nucleus, a proton is converted into a neutron
4
82
Rb Elution System Control
Ran Klein, University of Ottawa
and excess positive charge is ejected in the form of a positron (positively charged electron).
The positron travels a few mm through the surrounding medium and eventually interacts
with an electron resulting in a mutual annihilation. The combined mass of the electron and
positron is converted into two equal energy (511keV) collinear photons. These high energy
photons travel through the body and can be detected by dense scintillating crystals coupled to
photomultiplier tubes.
A typical PET scanner consists of planar rings of detectors. Since the two photons
formed during a decay are created at the same time and travel in opposite directions at the
speed of light, they should be detected almost simultaneously (i.e. coincidence) by detectors
on opposite sides of the event. If two coincident photons are detected by the scanner it can be
assumed that the decay occurred along the line of response (LOR) connecting the two
detectors. These collected coincidence counts can be processed through various
mathematical algorithms, such as filtered back projection, to reconstruct a tomographic
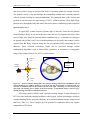
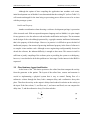
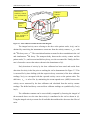
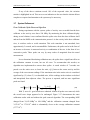
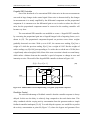
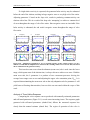
image of the scanner field of view (FOV) as shown below.
511keV
γ-ray
Coincidence
Detector
Isotope
Nucleus
Electron
511keV
γ-ray
Figure 1-1 - Positron emission tomography. The positron discharge followed by annihilation with an
electron producing two collinear photons (γ-rays) on the left. The projected line of response based on a
detection of coincident events by the scanner is shown on the right. The image is a cross-section of the
chest with red depicting tracer uptake in the heart muscle. A transmission image is fused in gray,
showing the lungs and arms for anatomical reference.
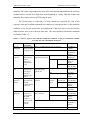
PET tracers must be labelled with a positron-emitting isotope. A major advantage of
PET over other molecular imaging modalities is that oxygen, carbon, and nitrogen, which are
common building blocks in organic chemistry, have positron-emitting isotopes with practical
half-lives (Table 1-1). These isotopes give the potential to synthesize almost any organic
compound as a PET tracer.
5
82
Rb Elution System Control
Ran Klein, University of Ottawa
Various tracers have been developed to image different organs and tissue. Increased
glucose consumption, for example, is used for detection of cancerous tumours [2,3,4] and
distinguishing between hibernating (live) and necrotic (dead) tissue in the heart using
18
Fluorodeoxyglucose (FDG) [5,6,7]. In neuroscience FDG has been used to locate
hypoactive and hyperactive regions in the brain to diagnose disease such as epilepsy [8,9].
Another application used PET imaging to asses the integrity of the blood brain barrier [10]
using 82Rb as a tracer.
Table 1-1 – Commonly Used Positron-Emitting Isotopes [1]
Isotope
Cyclotron
Produced
Generator
Produced
15
O (oxygen-15)
13
N (nitrogen-13)
11
C (carbon-11)
18
F (fluorine-18)
82
Rb (rubidium-82)
68
Ga (gallium-62)
Half Life (T1/2) [min]
2.1
10.0
20.3
110
1.27
67.8
Mean distance to annihilation [mm]
1.1
0.72
0.56
0.35
2.4
1.1
Blood flow (perfusion) studies are of interest in cardiac medicine as they can indicate
vascular stenosis; a clogging of the arteries due to plaque build-up that restricts the flow of
blood. Perfusion measurement can be achieved by introducing a cationic tracer that is similar
(analogous) to potassium, K. All living cells have mechanisms that extract potassium
through the cell membrane referred to as ionic pumps. If a potassium analogue is injected to
a patient, the tracer will be taken up by the heart muscle cells, while the activity level in the
blood reduces over time. Several minutes later the PET image shows retained activity in the
heart contrasting with the low activity of the blood (as demonstrated in tomographic images
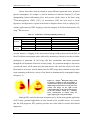
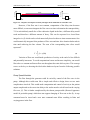
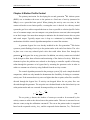
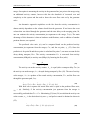
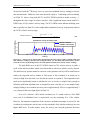
in Figure 1-2).
Figure 1-2 - Sample 82Rb uptake images used
to measure perfusion in the myocardium. A
normal heart is shown on the left depicting the
elliptic shape characteristic of a long axis cross
section. The image on the right reveals
reduced blood flow to the septal wall and apex
of the left ventricle, shown by a relatively
lower concentration of activity along the
upper right region of the partial ellipse.
Although FDG scans for detection of tumours are by far the most popular application
of PET today, potential applications are only limited by the available tracers. As research
into the field progresses PET promises powerful new tools both for research and clinical
diagnostics.
6
82
Rb Elution System Control
1.2
Ran Klein, University of Ottawa
82
Sr/82Rb Generator – a Cost-effective Tracer Source
The half-life of the radioactive isotope dictates how much time can pass between
production and scanning. After six half-lives we tend to treat the tracer as completely
decayed as only 1.6% of the original activity remains. As a result, the proximity of the
scanning facility to the tracer production facility is limited. If the tracer is sufficiently long
lived it can be transported between facilities, however if the tracer half-life is less than
several hours the tracer must be produced on-site.
Many of the PET isotopes are created using a cyclotron. This highly specialized and
expensive piece of equipment accelerates protons for bombardment of a specific target. The
nuclear interactions during the bombardment can form desired isotopes. In many cases these
isotopes are then passed on for synthesizing the tracer molecule through a series of chemical
processes. Due to the complexity and expenses involved in operation of a cyclotron, much
research has focused on finding simpler and more cost effective alternatives for PET tracer
production. This would be especially useful in regions of low population density (common in
a country like Canada) where the cost of a cyclotron cannot be supported.
Rubidium-82 (82Rb) has been identified as a suitable tracer for perfusion
measurements and can be readily produced using a 82Sr/82Rb generator (described below). As
a 1st column element in the periodic table, Rubidium is a reactive cation, which is
physiologically similar to potassium (K) [11]. Potassium (and rubidium) exhibits avid uptake
in certain tissues in the human body such as the myocardium. When 82Rb decays by positron
emission it is transformed into stable Krypton (82Kr) which is a noble element and is
therefore non-reactive and non-harmful (Figure 1-3). When a patient is at rest approximately
50% of the 82Rb is taken up from arterial blood into myocardial tissues over the course of a
single blood cycle through the tissue. Observation of 82Rb uptake enables the assessment of
myocardial perfusion. In 1989 the United States Food and Drug Administration (FDA)
approved the use of rubidium-82 chloride (82RbCl) from a
82
Sr/82Rb generator system
developed by Squibb Diagnostics for clinical use [12,13].
The relatively short half-life of
82
Rb (76 seconds) is both an advantage and a
disadvantage. The fast decay means a short exposure time for the patient, which thus
minimizes the health risks involved with radiation exposure. In addition repeated scans can
be carried out after only 10 minutes as almost no radiation remains from the previous dose.
7
82
Rb Elution System Control
Ran Klein, University of Ottawa
On the other hand, the fast decay shortens the maximum scan time and thus reduces the
quality of the scans. An added difficulty is that the
82
Rb must be produced on site and
directly infused into the patient [14].
82
Rb is the product of
82
Sr decay. In this context
82
Sr is referred to as the parent
isotope, while 82Rb is referred to as the daughter isotope. For this application, it implies that
a batch of 82Sr can be used to continuously generate 82Rb activity. As 82Rb decays into stable
82
Kr the decay process ends as is demonstrated by Figure 1-3.
82
Sr (T1/2 25.5d)
Figure 1-3 – 82Sr/82Rb decay
sequence. Half-lives are in
parentheses.
82
Rb (T1/2 76s)
Kr (stable)
82
Sr is produced using large cyclotrons, capable of creating high energy protons
(~80MeV), for beaming on metallic Rb or RbCl solutions [14]. Only a few specialized
organizations, such as the Los Alamos Research Labs and the TRIUMF cyclotron operated
by MDS Nordion, are capable of producing 82Sr. However, high yields and the long half-life
of
82
Sr makes the production manageable and cost-affective. As a side product
85
Sr
(T1/2=64.8 days) is also produced, but is not beneficial for 82Rb production and is difficult to
separate from 82Sr. The manufacturer includes a measure of the ratio of 85Sr to 82Sr (typically
~1:1 ratio) with each production.
82
Rb can be supplied using a 82Sr/82Rb generator at a relatively low cost, as there is no
need for an onsite cyclotron. The generator consists of a tin-oxide (SnO2) ion-separation
column which strongly binds Sr isotopes. The generator must be loaded roughly every two
months with Strontium-82 (82Sr), which has a half-life of 25.5 days [15]. As the 82Sr decays
to
82
Rb, its chemical properties change due to the shift from a column-two element to a
column-one element on the periodic table. Rb binds to the tin-oxide column much more
weakly than Sr. When the column is flushed with a solution, such as 0.9% NaCl saline, the
Rb is displaced by Na (sodium) and the 82Rb is eluted in the form of 82RbCl (eluate). For this
reason the generator is referred to as an ion-exchange column.
Various vendors [Bracco, 2004, formerly Squibb] and research teams have
manufactured 82Sr/82Rb generators that are all similar in design. A shielding casing made of
depleted uranium [TRIUMF, 1993], lead [Bracco, 2004], or tungsten is used to absorb
8
82
Rb Elution System Control
Ran Klein, University of Ottawa
radiation produced by decay in the generator, thus reducing exposure to patients and
personnel.
During loading, 82Sr (and 85Sr impurity) is pumped into the column through the input
line, resulting in binding of most of the Sr within the first few mm of the tin-oxide column.
After numerous quality assurance tests of the eluate for pyrogens, sterility, and metal
breakthrough, the generator can be used clinically. In addition, these runs ensure that the
82
Rb yield is sufficiently high.
Once the
82
Sr decays to levels that cannot yield sufficient amounts of
82
Rb, the
generator must be reloaded or replaced. A typical life span of a generator is 1-2 months, and
is primarily determined by the amount of 82Sr that was loaded and the 82Rb activity required
for imaging. The activity is often measured compared to the generator production capability.
If a complete generator flush will yield 2000 MBq and an injected activity of 500 MBq is
desired, one would refer to 25% relative activity. Over time the relative activity needed for
imaging will increase as the generator decays and the administered activity remains constant.
Sr Breakthrough
As saline is flushed through the generator, some Sr detaches from the column and
appears in the eluate. For this reason the column is made sufficiently long (~2cm) to bind
any loose Sr [16]. Over time, migration of Sr occurs along the column.
82
Sr and
85
Sr
“breakthrough” can result if the generator is used indefinitely. In high quantities these
compounds may have ill effects on health, as Sr is absorbed in bone which surrounds the
bone marrow. As cells in the bone marrow are continuously dividing to produce red blood
cells, the marrow is susceptible to genetic mutation due to radiation. In severe cases this
could lead to increased risk of cancer.
Although no action can be taken to reduce breakthrough once it has started, Sr levels
can be monitored in the eluate. Since the half-lives of both
82
Sr and
85
Sr are much longer
than that of 82Rb, a measurement of the activity of a flushed solution after sufficiently long
time should yield the quantity of Sr eluted. Health Canada guidelines dictate that
85
82
Sr and
Sr breakthrough not exceed 20 Bq/MBq and 200 Bq/MBq respectively of the eluted
82
Rb
activity. In order to take breakthrough measurements, one should ensure that sufficient time
passes for the
82
Rb in the sample to decay below the regulation limits - approximately 20
9
82
Rb Elution System Control
Ran Klein, University of Ottawa
minutes. If after 20 minutes the remaining activity is greater than the designated limit, this is
an indication of excessive Sr breakthrough and elution to patients should be avoided.
82
1.3
Rb Elution Profiles
The generator continuously produces
the generator “recharging” occurs, as the
82
82
82
Rb isotopes. If saline is not flushed through
Sr continues to decay and the concentration of
Rb in the generator volume increases. The total
82
Rb activity stabilizes within
approximately 10 minutes as parent-daughter equilibrium is reached as a function of 82Sr and
82
Rb decay rates (Figure 1-4). The level of equilibrium is dependent on the amount of
82
Sr
activity in the column.
Activity
82
Sr Activity
Figure 1-4 – 82Rb activity during
recharging of a generator. An
asymptotic rise is observed up to the
level of 82Sr activity.
82
Rb Activity
0
10 min
Time
If saline is pumped through the generator the amount of
82
Rb inside the generator
decreases to a new asymptote as the effect of the flushing takes its role in the equilibrium.
The
82
Sr decay is the contributing factor, while the
82
Rb decay and the flushing are the
reducing factors of the overall amount of 82Rb of in the column.
Previous research [17,18] successfully modeled the eluted activity during constant
flow rate flushing of the generator using variations of (1). The parameters C1, C2, C3 [MBq],
R1, and R2 [1/ml] are determined by fitting to empirical data. The parameter f represents the
flow rate [ml/min] of the flush and t is the time since the flush start.
A(t ) = C1 + C 2 exp( R1 ⋅ f ⋅ t ) + C3 exp( R2 ⋅ f ⋅ t )
The curve has a characteristic peak that is reached as the
(1)
82
Rb from the column
volume is flushed, referred to as the bolus stage. As time progresses, the activity decays to a
lower asymptote as equilibrium with the saline flow is reached [19]. This is referred to as the
continuous stage. The activity vs. volume curve is nearly independent of flow rate at the
bolus stage [18] and the peak activity is proportional to the amount of
10
82
Sr attached to the
82
Rb Elution System Control
Ran Klein, University of Ottawa
column. The asymptote magnitude relative to the peak activity is dependent on the saline
flow rate alone.
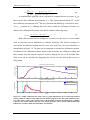
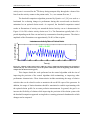
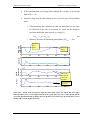
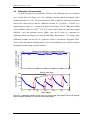
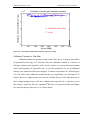
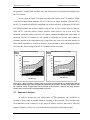
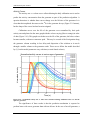
Figure 1-5 demonstrates activity concentration (MBq/ml) curves at various constant
flow rates through the generator measured ten days apart [20]. The activity was measured on
the generator output line using a positron counter while the flow rate was kept constant using
a peristaltic pump (Harvard Apparatus). The later curve (April 2, 2001) has a lower overall
magnitude than that of March 23, 2001 due to the decay of the
82
Sr; however the general
curve shapes are identical. The continuous stage asymptote is higher for the low flow rates
(10 ml/min). Although one might expect an initial step to maximum activity, the initial rise is
a result of
82
Rb diffusion in the saline solution and the spatial response of the activity
counter.
Figure 1-5 Representative
generator
activity/volume
curves with different
flow rates at different
times [20] (from
reference).
1.4
Constant-Activity Elution for Quantitative Perfusion Measurement in the
Left Ventricle of the Heart
Diagnosis of cardiac patients and optimization of their treatment is highly dependent
on the measurement of perfusion in the left ventricle (LV) heart muscle. As demonstrated in
Figure 1-2 the uptake images of a potassium analogue radioisotope can be used to assess
perfusion. However, these images only indicate the relative perfusion with the region of
highest uptake serving as the baseline to which all other regions are compared. The baseline
11
82
Rb Elution System Control
Ran Klein, University of Ottawa
is assumed to be a region with normal (healthy) perfusion. Therefore a uniform uptake image
is interpreted as a healthy subject.
In some cases, such as diabetes or multi-vessel coronary artery disease, the uptake
may be reduced throughout the entire LV, thus resulting in uniform images. These cases can
be misdiagnosed as healthy when in fact they experience a global reduction in perfusion [21].
To address this issue the need for quantitative perfusion measurements has arisen.
By dividing the imaging time into frames, one can image the tracer distribution as a
function of time. This is referred to as dynamic imaging and enables to measure the rates at
which a process of interest develops. In the case of quantitative perfusion measurement,
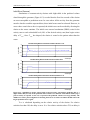
dynamic images can be used to capture the rate of tracer uptake from the blood into the
myocardium. A tracer kinetic model is fit to this uptake rate in order to estimate perfusion in
absolute units (ml/min/g) [22].
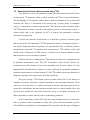
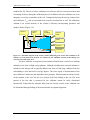
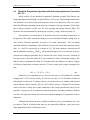
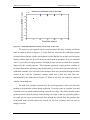
RV
RA
LV
LV blood
pool
LA
RV blood pool
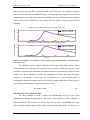
Figure 1-6 - Series of dynamic 82Rb images of a dog heart. Just after injection 82Rb is in the RV blood
pool (F3,F4). Subsequent images show the LV (F4,F5) and the LV blood pool (F5,F6), dispersion through
the body (F7-F11), and the resulting retention in the heart muscle (F12-F17) with most of the activity in
the LV (horseshoe shape).
To demonstrate this idea, a study on a dog performed at the University of Ottawa
Heart Institute (UOHI) using a 82Rb dynamic PET scan is shown in Figure 1-6. A series of
sequential images (non-uniform time frames) shows the tracer entering the right-ventricle
12
82
Rb Elution System Control
Ran Klein, University of Ottawa
blood pool (RV) (F3). The activity is then carried through the right atrium to the lungs and
back to the left ventricle (LV). The LV blood pool is visible in the next frame (F6) followed
by dispersion in the body and myocardial uptake and clearing of the blood pool (F7-10).
Once much of the activity has been removed from the blood pool the retained activity is left
visible in the LV heart muscle (P12-17). Relative perfusion non-uniformities can be easily
visualized from retention images (P14-17), however in cases of diabetes and multi-vessel
disease the entire region can exhibit decreased flow, which could lead to false diagnosis that
perfusion is normal.
In order to achieve quantitative measurements, one must first know how much
activity was introduced to the patient during the injection [20,23,24,25] and its distribution
over time. The quantitative measurements that are provided by dynamic PET can be used to
determine the absolute perfusion. This process is equivalent to determining a system
response based on a known input function (controlled elution profile) and a measured output
function (dynamic PET images). The ability to measure perfusion quantitatively implies
improved diagnostic ability over other modalities [26].
The ideal tracer would be a positron-emitting isotope that is freely diffused and
completely retained and with a practical half life – however none exists. 13N labelled (T1/2 =
10 min) ammonia (NH3) has been used as the clinical standard for quantification of
myocardial perfusion, while
82
Rb has been recognized as a cost-effective alternative.
13
N-
ammonia is produced using a cyclotron and is then administered using a syringe pump over a
fixed interval (e.g. 30 seconds). This procedure results in a rectangular elution profile, which
is well matched with PET technology [27]. The detectors on the scanner experience a
significant dead-time after detection of an event. If the activity in the FOV is too high, many
counts could be lost resulting in a saturation of the measurements, or even a reduction in the
number of detected counts. The technologists, who administer the tracer and operate the
scanner, try to maximize the activity while avoiding saturation of the detectors. To facilitate
this optimization we would like to spread the activity evenly throughout the elution time,
which is ideally a rectangular elution profile [18,28]. The short-coming of
82
Rb is that
constant flow elutions (as shown in Figure 1-5) are not rectangular and therefore not ideally
suited for quantitative perfusion measurement.
13
82
Rb Elution System Control
1.5
Ran Klein, University of Ottawa
Quantitative Perfusion Measurements Using 82Rb
Two alternative tracers for quantitative cardiac perfusion measurement in PET have
been discussed; 13N-ammonia, which is widely accepted, and 82Rb as a potential substitute.
The disadvantage of 13N-ammonia is that it must be produced using an on-site cyclotron and
chemistry lab. Since it is introduced to the patient using a syringe pump, a rectangular
activity vs. time profile is created during injection. 82Rb which can easily be obtained using a
82
Sr/82Rb generator is cheaper to produce than ammonia, but has a characteristic activity vs.
volume profile that is not optimized for PET in general and quantitative perfusion
measurement in particular.
To achieve the benefits of both tracers we would like to produce an elution system
that can control the flow through the 82Sr/82Rb generator to achieve a rectangular activity vs.
time profile during injection to the patient. It is expected that if this is achieved, perfusion
measurements using both
13
N-ammonia and constant-activity
82
Rb elutions could yield
82
similar results. Constant-activity Rb, however, would serve as a cheaper solution to centers
that do not have access to an on-site cyclotron.
It follows that once constant-activity 82Rb elutions are achieved, a comparison study
of perfusion measurements with
Constant-activity
82
82
Rb and
13
N-ammonia would precede clinical use.
Rb elutions will serve the immediate need for such a study. It is also
anticipated that constant-activity elutions are vital to achieving a reproducible quantitative
perfusion measurements in a clinical setting [25]. The 82Rb elution system must therefore be
designed to meet the strict requirements for routine clinical use.
The goal of using a
82
Rb elution system in routine clinical PET work dictates an
emphasis on accuracy, robustness, minimal maintenance, and operational simplicity. These
criteria are set by the nature of a system that interacts directly with human patients and is
operated by technologists that must perform multiple tasks in a timely fashion. Since this
system is most suitable for centers that do not have access to a cyclotron, robustness is of
utmost importance to ensure that the center is continuously productive.
In the United States, mobile PET units have been providing services to rural areas.
Since a cyclotron cannot be mounted on a truck, these services have been limited to tracers
with sufficiently long half-lives to be transported. This not only limits the types of diagnosis
14
82
Rb Elution System Control
Ran Klein, University of Ottawa
that can be obtained, but also significantly increases the costs of operation. 13N-ammonia is
too short-lived for transportation, therefore excluding perfusion measurements from the
services offered. Generator produced isotopes such as 82Rb could serve as an ideal substitute
as a perfusion tracer.
The price and complexity of installing, maintaining, and running a cyclotron have
limited accessibility to PET to only the wealthiest regions. With the development of costeffective radionuclide delivery systems such as a constant-activity 82Rb elution system, state
of the art quantitative perfusion PET scans can be offered to regions of low population
density as well as to less wealthy communities.
15
82
Rb Elution System Control
Ran Klein, University of Ottawa
Chapter 2: The Second Generation 82Rb Infuser – a starting point
This chapter discusses previous work in the development of systems to infuse
82
Rb
tracers, at the UOHI and elsewhere. Capabilities and limitations of these systems are
discussed, and the motivation for the present work is given.
In 1981 Yano et al. [29] described a
82
Rb elution system which could be used
clinically to achieve constant flow rate elutions over a prescribed time (constant-flow
elution) by controlling a stepping motor coupled to a specially designed syringe pump. This
system included no feedback mechanism for monitoring, data collection, or testing.
Gennaro et al., 1987 [19] described the use of a positron counter mounted on the
generator output to measure the activity vs. time curves. In addition, Gennaro et al.
developed a method of automatically calibrating the positron counter for efficiency
(geometric and intrinsic) based on an ion chamber dose calibrator. The positron counter
readings were convolved with the
82
Rb decay function and corrected for time delay to
simulate the elution to the dose calibrator. The ratio of the dose calibrator reading and the
convolution resulted in the calibration constant. Gennaro et al. was then able to measure the
activity vs. time curves from the generator.
The first generation
82
Rb elution system developed at the UOHI was described by
Alvarez-Diez et al., 1999 [30]. This system included a positron counter used to monitor
clinical elutions as well as recording the elution profile (the rate of activity delivered during
the elution sequence). A generator bypass line was added to allow flushing of the lines to the
patient at the end of the elution, thus ensuring that no activity remains as background that
would be detected by the PET scanner. The operator entered a desired activity dose and
elution time, which the system used to estimate an elution flow rate for the peristaltic pump.
The activity vs. volume curve recorded during the daily calibration run (Figure 1-5) was
integrated to determine the volume that needs to be eluted from the generator in order to
achieve the requested activity dose. The flow rate was determined by factoring this volume
by the requested elution time. Feedback from the positron counter was used to stop the
elution when the activity was reached. These elutions are referred to as constant-time
elutions.
16
82
Rb Elution System Control
Ran Klein, University of Ottawa
The 82Rb infuser was based on an industrial PC running MS-DOS coupled to a LCD
touch-screen. The software ensured that the daily protocol (discussed below) is followed and
generated a recording of each elution. In addition some rudimentary error detection was
included. The system contained all the necessary components in a single cart, but had to be
calibrated manually at a single flow rate (same flow rate as the elutions that would follow)
by monitoring an external dose calibrator during the calibration run. The system was used in
a routine clinical setting over 3 years, however it proved difficult to upgrade to include new
functionality.
In [18] Epstein et al., 2004 simulated a feedback controlled system that varied the
ratio of flow between the generator and the bypass line to achieve a constant-activity rate
(constant-activity elutions). A prototype was constructed based on the same proven design as
the first generation system, which was intended to add constant-activity functionality and
improve usability. A simple threshold comparison algorithm was used to compare the
instantaneous activity rate to a set point. Although the simulations used a three-way variable
pinch valve to control the flow between the generator and its bypass line, the prototype used
a 2-way solenoid on/off pinch valve. The system was experimental and used to demonstrate
the feasibility of the concept.
This system was the prototype of the second generation rubidium elution system
(RbES). The RbES had to ensure the same functionality as the first generation system, while
adding constant-activity elution capability, improved user interface, and additional
automation to reduce radiation exposure to the operator and patients. The system was based
on the hardware design of the first generation system but had an updated computer system,
user interface, and operating system which enabled more advanced developments.
2.1
The Daily Protocol and Elution Types
The daily protocol was first described during the development of the first generation
system and is intended for routine system maintenance, system diagnostics, and clinical
preparation of the system. The aim of the protocol is to ensure that the system is in full
operational order, calibrated, and meets all guidelines to ensure patient and operator safety.
The protocol consists of a system flush and a calibration run. Although the outline remains
17
82
Rb Elution System Control
Ran Klein, University of Ottawa
unchanged, the protocol was slightly modified to remove operator intervention where
automation was introduced.
The daily protocol begins with replacement of the saline supply and of the patient
line and emptying of the waste container. A flush run is initiated by the operator to flush and
prime all lines with 0.9% NaCl saline. The generator is then flushed with 50 ml saline in
order to remove air bubbles and any Sr breakthrough from the system. The generator is then
allowed to completely recharge by stopping saline flow for at least 10 minutes.
A calibration run follows to recalculate the calibration constant of the activity
detector and measure the activity vs. volume curve of the generator. Calibration is performed
by eluting at a constant flow rate (15ml/min) over 60 seconds to an external dose calibrator,
which serves as a reference. The activity in the dose calibrator is registered 30 minutes after
the end of the elution to compute the breakthrough
82
Sr and
85
Sr activity. Only after a
calibration run with low Sr breakthrough has been successfully completed can patient
elutions be carried out. The calibration constant is a measure of the positron counter’s
efficiency and is therefore not expected to change significantly. Monitoring of the calibration
constant can be used to detect problems in the system.
Once the daily protocol has been completed successfully, patient elutions are enabled
until the end of the day. Refer to Figure 2-1 for a flow chart of the daily protocol. Three
patient elution modes are of interest:
Constant-Flow elutions allow the user to specify the flow rate and duration of the
elution. This elution is identical to early elutions as described by Yano [29].
Constant-Time elutions allow the user to specify the desired activity and time for the
elution. The flow rate is automatically calculated based on the activity vs. volume curve
measured during calibration. This mode offers the same functionality as the first generation
system [30].
Constant-Activity elutions allow the user to enter the desired activity and duration of
the elution. The system automatically estimates a flow rate and controls flow through the
generator or a bypass line by a threshold comparison algorithm to achieve fluctuations
around the desired set point.
18
82
Rb Elution System Control
Ran Klein, University of Ottawa
Daily Flush
>10 min wait
Calibration
At midnight
>10 min wait
Patient Elution Runs
>10 min wait
2.2
Figure 2-1 - Daily protocol flow chart.
At the start of each day a flush and
calibration run must performed prior
to patient elution runs. At midnight
the calibration and flush expire. A
minimum of 10 minutes must pass
between elutions.
Hardware Description
The second generation elution system focused on improving usability, automation,
and precision. The primary goal was implementation of a constant-activity elution mode.
Since the first generation elution system has been proven as a reliable design, it served as a
basis for the second-generation infuser. The hardware remained almost unchanged, while the
software was completely rewritten using Matlab/Simulink.
Saline IV
Interface
Module
Pressure
Sensor
Peristaltic
Pump
Patient
Valve
Generator
Valve
Activity
Counter
82
Sr/82Rb
Generator
Waste
Container
Dose
Calibrator
Figure 2-2 – Hardware component diagram of the RbES prototype [18] was not altered.
The system is based around a PC which interfaces with the various sensors and
actuators. Based on the mode of operation and measured data, the real-time software controls
the pumps and valves. These in turn affect the flow of saline through the generator or its
bypass line to the patient, dose calibrator, or waste container. The system acquires data from
a pressure sensor, activity counter, pump, and the dose calibrator which is used to monitor
the process and control the elution. Figure 2-2 shows the overall design of the secondgeneration 82Rb infuser.
19
82
Rb Elution System Control
Ran Klein, University of Ottawa
Computer
The PC was modified to allow interfacing with other system components. An
additional RS232 serial port was added through a PCI board. The data acquisition card was
installed on a second PCI slot. In order to power the buffer board, a 12VDC power cord was
spliced from the floppy drive power cable. Table 2-1 lists the specifications of the PC that
was installed. A mini-tower case was selected due to the physical restrictions of the cart.
Table 2-1 – Minimum PC Requirements
Component
CPU
RAM
Hard Drive
CD-ROM Drive
USB Ports
RS232 Serial Ports
Case
PCI slots
Power Supply
Specification
Intel Pentium III 1200 MHz
256 MB
40 GB
1
4
1 + 2 added with a PCI interface board
Mini-tower
2 – serial port and data acquisition board
350 W
An important advantage of using a PC to control the system is the wide range of
applications and devices that are readily supported. This included off-the-shelf user interface
devices, as well as machine interfaces and data acquisition devices. In addition a wide range
of operating systems and development environments could be chosen from. Simply said, PCs
offer a good performance to price ratio in a flexible package.
User Interface Medium
The user interface was designed to meet the following requirements:
•
Interface with the user must to be simple and intuitive.
•
The technologists must be able to monitor the progress of the elution even
from a distance, so as to reduce radiation exposure.
•
The technologist must be able to operate the system with a single gloved
hand.
•
The input device must be resistant to small amounts of liquid and easy to
clean.
20
82
Rb Elution System Control
Ran Klein, University of Ottawa
A 17-inch liquid crystal display (LCD) resistive touch screen was chosen (3M M/50).
Large buttons as part of the graphical user interface (GUI) allow easy operation, while a
simple display allows viewing from across a room. Connections to a PC through a standard
VGA cable for display and a D-type 9 pin RS232 serial cable for touch screen inputs.
Included in the package are the drivers required for manipulating the mouse cursor via the
touch screen. Although the screen is not waterproof, it will withstand a few droplets.
Data Acquisition Board (DAQ)
The National Instruments PCI-6035E data acquisition board is used to both acquire
readings from sensors and control actuators. National Instruments has a good reputation in
the field of data acquisition and is widely supported by development platforms. Both
Matlab/Simulink and Labview have drivers integrated into their packages without the need
of further purchase. The PCI-6035E boasts a variety of input and output capabilities
including:
8 Digital I/O Channels
8 Analog Inputs, 16 bit, 160 kHz A/D converter
2 Analog Outputs, 16 bit, 160 kHz D/A converter
2 General Purpose 24 bit Counters/Timers
Flow Control Valves
The flow control valves are solenoid-powered pinchers that squeeze the silicon tubing
to a seal. They are controlled by an operating signal of 0 or 12 VDC (polarity does not
matter). Each valve is a double pincher allowing flow through one tube, while blocking flow
through a second. These valves are manufactured by Angar Scientific and were chosen for
their proven reliability.
Buffers
To supply the required current to the flow control valves the need for buffers arose.
The control signals were fed directly from the data acquisition board digital I/O and
amplified using solid-state relays (Crydom). The buffer mounting board (also manufactured
by Crydom) was modified by exchanging the pull-up resistors with pull-down resistors. This
modification was conducted as a safety precaution to ensure that the valves fail to a safe
21
82
Rb Elution System Control
Ran Klein, University of Ottawa
position (flow through the bypass to the waste container) should control lines become
inactive.
Activity Counter
Some of the positrons emitted during decay are absorbed in a fluorescent optical
fibre1 (scintillator) and converted into photons. A photon detector (Hamamatsu H7155)
coupled to the optical fibre is used to count these photons. For each recorded event a 30ns
TTL pulse is sent through a coax cable to the DAQ on board general purpose counter/timer
(GPCTR).
The photon counting head is a single package containing a high voltage power supply
and a high-speed photon counting circuit. 5 VDC powers the photon counting head and a
coax TTL cable supplies one output pulse for each photon, counting up to 1.5 million counts
per second.
It is important to note that although not all the emitted positrons are captured in the
fibre, and not all the photons in the fibre reach the counting head, the resulting TTL count
rate is proportional to the activity and can therefore be factored by a calibration constant.
Pump
An off-the-shelf peristaltic rotary pump head and control board manufactured by
Harvard Apparatus were used. The control board was mounted in an interface box, while the
pump head was mounted on the cart top to form an aesthetic installation. Communication
between the pump and the PC is achieved through RS-232 serial communication. Control
messages include setting the elution volume and flow-rate, while feedback includes the pump
status. Continuous pump status-checking ensures both synchronization between the computer
and the pump as well as fault detection.
Pressure Sensor
A typical medical pressure sensor is attached to the saline lines immediately down
stream from the pump. This pressure is continually gauged to detect blockages in the line
through an increase in line pressure. Blockages are caused primarily by air-bubbles that can
22
82
Rb Elution System Control
Ran Klein, University of Ottawa
block the filters and are normally fixed by replacing the filter. However, blockages can also
occur as a result of crystallization in the lines and pinched lines.
The sensor is supplied with 5 VDC from the DAQ board and returns a ±0.05 V
analogue signal which is proportional to the line pressure. Since pressure in liquid is
uniform, readings can be calibrated using an external pressure gauge connected to the same
line. The pressure is constantly monitored and can lead to program termination if the
pressure rises above a set threshold (25-30 psi) for a prolonged period of time.
Dose Calibrator
A Capintec CRC-15 (Ramsey, New-Jersey) series2 dose calibrator is supported as an
external device for calibration purposes. This dose calibrator is the gold standard throughout
the nuclear medicine industry and is a common tool in medical radiation labs. The CRC-15 is
composed of an ionization chamber, which is used to detect ionizing radiation, and a console,
which powers and monitors the chamber as well as provided a user interface.
Communication between the PC and the dose calibrator is achieved through RS-232 polling
by the PC.
The dose calibrator is utilized in the system for both calibration and testing. During
calibration the dose calibrator readings are used as a reference to which activity counter
readings are compared. During test runs the calibrator readings are used to verify the
expected results.
Assembly
All the components are assembled in a stainless steel cart shown in Figure 2-3. The
generator was placed in the cart and surrounded by lead rings to provide maximum radiation
shielding. All the saline lines were mounted on a modified top cover for easy access and
monitoring (Figure 2-4). A high density plastic lid covers the lines to reduce positron
exposure. Finally the LCD touch screen was mounted on an adjustable support arm, so that
the operators can adjust its angle for ideal height and visibility.
1
2
Bicron BCF-10, blue scintillator optimized for diameters > 250µm
Both the CRC-15R and CRC-15PET models were tested and used during this research.
23
82
Rb Elution System Control
Ran Klein, University of Ottawa
LCD Touch
Screen
Dose
Calibrator
Interface
High Density
Plastic Lid
Dose
Calibrator
Ionization
Chamber
Saline Bag
Shielded
Waste
Container
Shielded
Generator
Personal
Computer
Printer
Figure 2-3 - Photograph of the assembled 82Rb elution system and its components.
Patient
Line
Waste
Line
High Density
Plastic Lid
Pressure
Sensor
Saline Line
Patient
Valve
Shielded
Activity
Counter
Generator
Peristaltic
pump Head
Generator
Valve
Generator
Access Lid
Figure 2-4 - Photograph of top cover of the 82Rb elution system.
24
82
Rb Elution System Control
Ran Klein, University of Ottawa
The PC, printer, and power isolation transformer were mounted on the lower tray. An
interface box was constructed for mounting below the top cover and included the pump
interface board, valve driver circuitry, and DAQ I/O connector block. Finally the waste
container was mounted on the top shelf inside a lead container with a lid.
2.3
Prototype Performance
In [18] Epstien et al. presented initial results with the RbES. The reported results
include simulation data as well as elution measurements. Elutions in the range of 10-70%
generator bolus activity (relative activity) were justified as a reasonable range for clinical
applications. A newly loaded “hot” generator should have about 2000 MBq3 bolus activity
(first 15 ml eluted) and would decay to approximately 785 MBq within 5 weeks. At the
UOHI Cardiac PET Center, a typical dose is 550 MBq while a small dose is 200 MBq. A
small dose on a hot generator corresponds to 10% activity while a cold generator and a large
dose corresponds to approximately 70% generator activity. Typical elutions are 30 seconds
long and were therefore used in these measurements.
Instantaneous Activity at Patient Outlet
16
14
Activity Rate (MBq/s)
12
10
8
6
4
2
0
0
10
20
30
Time (s)
40
50
60
Figure 2-5 - Elution of 50% bolus activity within 30 s using a simple threshold comparison algorithm as
described in [18]. The actual activity rate at the patient outlet (blue) since the beginning of the elution is
compared to the desired result (green).
3
Bq are physical units that measure the number of nuclear disintegrations per second. In our case, we use MBq
referring to one million positron emissions per second.
25
82
Rb Elution System Control
Ran Klein, University of Ottawa
Using a threshold comparison approach, Epstein et al. reported fluctuations around
the set activity rate of about 40% (as demonstrated in Figure 2-5). These fluctuations were
believed to be caused by a delay in the activity measurement due to the real-time system
refresh rate 50 ms and some activity spill over. However, we believe that most of the
overshoot is a result of transport delay between the merge point (of the generator and bypass
line), and the activity counter.
2.4
Further Development of the 82Rb Elution System (RbES)
The primary motivation for developing the RbES is to develop an infusion system
capable of eluting a given activity at constant rate over a prescribed time period from a
82
Sr/82Rb generator independent of generator age, so long as sufficient amounts of activity
can be provided by the generator. The system is required to operate in a clinical setting and
therefore must be reliable, easy to operate, and above all, safe. The prototype that was
developed prior to the work of this thesis was incomplete with the following issues still
needing attention:
•
Precise constant-activity elutions were not achieved. Fluctuations around the
set point needed to be significantly reduced through an improved control of
flow through the generator.
•
Only a few error detection mechanisms were implemented. Of those that were
implemented, the report to the user was uninformative.
•
There was no means for the operator to manually terminate an elution if a
problem was noticed during the elution.
•
A key requirement of this system is to reduce radiation exposure to the
technologists by automating the system and allowing monitoring from a
distance. Although this goal was mostly achieved in the prototype system,
breakthrough activity measurement remained a manual function.
•
The interface lacked sufficient real-time feedback to the technologists about
the state of the system.
•
Although the electronic reports and logs of the elutions were mature, a paper
report which is needed to be filed in patient charts was not available.
26
82
Rb Elution System Control
•
Ran Klein, University of Ottawa
The system contained no measures to avoid electrical ground leakage. This
issue had to be addressed especially since the cart is made of stainless steel,
contains electrical equipment, and connects to the patient with saline, which is
conductive.
•
No protection against overflow of the waste container was implemented in the
prototype system. If overflow was to occur, this could potentially lead to
damaging of the system components, or developing of a shock and fire
hazard.
The hardware design of the prototype system addressed many of the prototype system
requirements and could therefore be used as a platform for further work. The software, on the
other hand, was in an incomplete state with many requirements left unaddressed. The
prototype system served as a starting point from which the state of the art could be
understood, and as a reference to which future developments could be compared. The
remainder of this document describes the research, development, and testing that was carried
out to bring the system from a prototype stage to a mature system fully ready for clinical use.
27
82
Rb Elution System Control
Ran Klein, University of Ottawa
Chapter 3: System Design and Conceptual Understanding
Development of the RbES described in this work was started from the research
prototype that was already partially functional (as described in the previous chapter).
Although this meant less flexibility in the overall design of the system, it provided a starting
point that could save much time and effort in the development process. The hardware was
based on the first generation elution system [30], which had been routinely used over three
years in a clinical setting and had proved to be reliable.
The software, on the other hand, was in an unfinished state and proved to be unstable.
The constant-activity control algorithm, described in [18], was simplistic and left much room
for further improvement. Therefore, it is the software that would undergo the most
development, with few minor additions/revisions to the hardware. Before commencing the
development the prototype design had to be understood and the project had to be defined.
3.1
Requirements
The 82Rb infuser was destined for human use from the start. This dictated tight safety
requirements that must be considered throughout the design process. Safety considerations
focused both on the patient and the system operator and included mechanical, electrical, and
radiation exposure risks. The main goal of this project was to design and implement a system
capable of providing a constant and controlled rate of 82Rb activity over elution times in the
range of 15 to 60 seconds for clinical PET scans in humans. In addition, the system had to be
capable of reproducing elution profiles that were tested and understood in the literature – the
constant-flow and constant-time elutions.
Functional Requirements
Functional requirements relate to the functionality and features that the system must
provide in order to justify its existence.
•
The system must identify faults during run-time and provide meaningful
messages to the operator.
•
Once an elution from the generator is started, the system must be fully
automated so as to minimize exposure to the operator.
28
82
Rb Elution System Control
•
Ran Klein, University of Ottawa
The system must at all times display the status to the operator in a fashion that
is readable from at least three meters from the device.
•
The system must be capable of producing constant-flow, constant-time, and
constant-activity elutions as well as respective tests with respect to an external
standard.
•
A record must be kept of all completed elutions for analysis and filing.
•
The system must ensure compliance with the daily protocol described in the
previous chapter. A flush followed by a calibration run and successful
breakthrough measurement must be completed in order to enable patient
elutions for the remainder of the day. The system should delay at least 10 min
between runs.
Non-Functional Requirements
The non-functional requirements are additional constraints on the design that define
desirable behaviour or design of the system. These requirements do not define the
functionality that the system must provide.
•
The system must not pose a health risk to patient, operator, or any other
person under any circumstance.
•
The system must react in a predictable and controlled manner at all times.
•
Any detectable error will result in a controlled termination of the elution with
all actuators in a safe mode:
o Patient valve set to waste
o Generator valve set to bypass
o Pump stopped
•
Between each run the application will be completely re-initialized so as to
prevent the chance of any data being carried over to the next run.
•
The system must be self contained with an interface to an external activity
measurement standard for calibration and testing purposes.
29
82
Rb Elution System Control
Ran Klein, University of Ottawa
Other Requirements
Performance
Since the
82
Rb elution system is designed as a real-time application, it must meet
performance requirements that are suited for the task at hand.
As with the prototype system, the most crucial sensor for the control algorithm is the
activity counter as it is the sole sensor participating in the feedback loop. In order to measure
activity in the line, positron counts must be collected over sufficiently long time. However,
one must account for the limited counter capacity (24 bits) to avoid counter overflow.
Assuming a detector efficiency of 1 and a measurement of 30 MBq the counter would
overflow in just over half a second. To avoid counter overflow readings are taken at 20 Hz.
Jitter must be avoided in order to ensure that the activity measurements are accurate. This
frequency provides the base refresh rate of the real-time application.
The real-time user interface and the physical sequence state machine could run at a
slower refresh rate, but not less than 1 Hz. A refresh rate of 1 Hz was chosen to reduce
processing overhead as much as possible, while still maintaining a reasonable refresh rate of
the GUI.
In order to meet these criteria both hardware and software performance and services
should be considered. An operating system capable of providing real-time scheduling
services must be chosen. The combination of software packages and hardware must ensure
that the processes can be executed within a reasonable time and minimal jitter to the realtime scheduling.
User Interface
The user interface must be informative, allow the operator to control all the features
of the elution system, but also limit the user input to ensure validity. The elution system
software may run as an application leaving access to all other features of the operating
system so as to enable the system manager to conduct maintenance and collect data. The
interface must be solely through the touch screen which will display a keypad and exit
button. Other buttons and radio-buttons must be added only at relevant states and
30
82
Rb Elution System Control
Ran Klein, University of Ottawa
immediately removed at the end of each state. Prior to initiating an elution, all the parameters
set by the user must be displayed for confirmation.
The real-time graphics display must include a system diagram with updated
information about the state of the system. This includes the current activity rate reading, flow
rate, valve status, and expected accumulated activity at the patient outlet. In addition,
progress bars must be included for each stage of the elution so as to facilitate monitoring of
the system. An emergency stop button must be enabled throughout the elution and take
immediate effect to bring the system to the safe mode.
At the end of an elution, reports must be generated based on the type of elution and
its mode of completion. If an error is detected, a red screen including details of the error and
recommendations to resolve the issue must be displayed. If the emergency stop button is
pressed, a yellow screen must contain an appropriate message. On successful completion a
grey screen must list statistics relevant to the elution. In addition, a separate window must list
a comprehensive display of all statistics in addition to activity curves relating to the activity
rate, and the integrated activity at the patient outlet.
Test Runs
For each of the patient elution types (constant-flow, constant-time, and constantactivity) a test mode must be offered as well. These modes are identical to the patient elution
modes but include data logging from the external dose calibrator. These data are used to
confirm that the actual activity as delivered to the patient outlet is similar to the expected
activity. These modes can be used to test the system.
Elution Recording and Reports
Data logging for analysis and recording is at 1 Hz regardless of other measures and
will include a log from the start of the elution until its termination. For all elutions the
elapsed time, activity counts, line pressure, and generator valve open-time must be logged. In
the case of calibration runs and elution tests, the dose calibrator reading and the serial
communication delay must also be logged. In addition the elution settings and event times
must be recorded.
31
82
Rb Elution System Control
3.2
Ran Klein, University of Ottawa
Initial Design Considerations
Safety
A first concern with any system that interacts with humans is safety, and even more
so when the system is used clinically and interacts directly with the patient’s body. The
design must have multiple robust mechanisms to ensure that in any case of failure, the
patient is not at risk. The following safety requirements were set and tightly followed:
1) Under no circumstances may any electric current leak through the saline line.
Saline is essentially water with dissolved salts to ensure pH and salinity similar to that of the
blood. Due to these solutes, saline conducts electricity quite well. Even the smallest current
directly through the body can cause discomfort or pain. It is for this reason that the saline in
the system is electrically isolated. Throughout the system, saline is enclosed in silicon or
PVC tubing with plastic connectors.
2) Only a limited amount of saline may be infused to the patient, and at a limited rate.
Even in the case of a software crash the flow and quantity must be controlled and limited.
The off-the-shelf and reliability proven peristaltic pump is programmed with a desired
(maximum) volume and flow rate, and runs autonomously. However, the computer monitors
the pump’s status and issues a stop command if the pump does not terminate within the
prescribed time limit.
3) The pressure in the line must not exceed 20 PSI (138 kPa). This is to ensure the
accuracy of the effective flow rate and to reduce the risk of line bursting. The pump head is
rated to 30 PSI (207 kPa). In the event that the pressure limit is exceeded for more than 3
seconds, the elution is immediately terminated.
4) The activity delivered to the patient must not exceed the requested dose as to
reduce saturation of the PET scanner sensors and needless exposure to the patient. The
activity readings from the counter are used to monitor the progress of the elution. The elution
is terminated once the requested dose is reached regardless of how much time has elapsed.
5) The activity delivered to the patient should not exceed the dose set by Health
Canada guidelines (2200 MBq). This issue is handled in part by safety issue 4, but is also
ensured by the limited activity in the generator (~2000MBq) and the use of an autonomous
pump that is programmed with a finite elution volume. The worst case scenario is thus the
32
82
Rb Elution System Control
Ran Klein, University of Ottawa
possibility where the elution system software does not respond, the valves do not fail to a
safe mode, the autonomous pump continues running indefinitely, and a hot generator is being
used. In assessing the worst case scenario we have concluded that no more than the total
generator activity, could be eluted. In such a case it is expected that the technologist
monitoring the elution system would notice that the PC no longer responds and would take
action by resetting the system.
6) The amount of Sr breakthrough activity must be strictly limited to the Health
Canada guidelines. This issue is addressed by daily breakthrough tests as part of the daily
protocol ensured by the system.
These safety concerns are of utmost importance and were addressed at all levels of
the development and testing.
Process Monitoring
Monitoring of the flow of activity to the patient is critical as a safety feature as well
as a means of precision control. The delivered activity is dependent on the activity leaving
the generator, and on the flow rate to the patient outlet. The flow rate is set by the software
and controlled by the autonomous peristaltic pump. However pressure in the lines must
remain within pump manufacturer specifications to ensure that the flow rate is accurate. If
the pressure is above 30 PSI (207 kPa) backwash of fluid through the rotor head can result
leading to an effective flow rate that is lower than expected.
The pressure sensor is used to sense high pressure in the saline lines due to blockage.
This mechanism also prevents bursting of the lines as pressure increases. The pressure sensor
is located downstream of the pump head and before the generator valve. This position allows
monitoring the pressure in the lines regardless of the state of the valves. Since the lines are
filled with liquid the pressure is equal in all parts of the line. If pressure above 20 PSI (138
kPa) is measured for 3 seconds, the elution is stopped and an appropriate message is
displayed to the user.
Activity measurements are vital for monitoring the delivery to the patient. The
accumulated activity is used to stop the elution when the requested dose is reached. In
addition, the activity counter can be used as feedback to the controller to achieve constant-
33
82
Rb Elution System Control
Ran Klein, University of Ottawa
activity elutions. The activity counter measures the activity in the volume in its field-of-view.
Since the volume is flowing, these measurements represent activity delivery rate (MBq/s).
Equation (2) relates the measured counts, N̂ Det (t) , and flow rate, f (ml/min), to the activity
rate at the detector Aˆ& C (t) (MBq/s) where V is the volume in the FOV and k (cps/Bq) is an
efficiency measure of the detector [19]. The efficiency and volume are combined into a
single constant, K, which is measured during the calibration process as explained later.
f [ml / min] Nˆ det [cps ]
1
MBq
Aˆ& C
=
⋅
⋅
10 6
s k[cps / Bq ] ⋅ V [ ml ] 60[ s / min]
(2)
MBq f [ ml / min] ˆ
⋅ N det [cps ]
= K
⋅
ml ⋅ cps 60[ s / min]
Accurate activity counting and accurate flow rate generation are vital to ensure that
the measurement of activity rate is accurate.
Hardware Modifications
Waste Overflow Level Switch
The waste container is located on the top shelf inside the cart and is contained within
lead shielding to minimize exposure to the operator. The prototype system did not include a
mechanism to avoid overflow. If overflow occurs the saline could drip to the lower shelf
which contains electronic devices such as the UPS, PC, and printer. Therefore it is desirable
to incorporate an overflow prevention mechanism.
It was decided to include a level switch that could be used to prevent further elutions
and generate a warning to the user. A wide variety of level switches are available based on
various technologies. However, our requirements eliminated many of these technologies.
•
The sensor must be completely electrically isolated from the saline to avoid
shock hazard
•
The sensor should not have any mechanically moving parts as the saline can
leave crystallization which could interfere with the mechanism
•
The sensor should be easy to clean to keep the system sterile.
34
82
Rb Elution System Control
•
Ran Klein, University of Ottawa
The sensor must be small enough to fit in the lead shielding and permit a large
enough amount of volume to accumulate in the waste container before being
activated.
•
The sensor must fail in a way that would indicate overflow.
•
The total purchasing and integration cost should be kept low.
With these considerations the ELS-1100 (Gems Sensors, Connecticut, USA) Electrooptic Level Switch was chosen from a wide range of possibilities. It uses an optical
transceiver to determine the existence of a surrounding liquid through a change in light
refraction as is shown in Figure 3-1. The choice of an optical level switch was due to its
small size, simplicity and lack of mechanical moving parts. The main disadvantage is the
need to keep the lens clean from saline droplets and crystallization. However the sensor can
easily be cleaned by wiping with a wet paper towel. If a droplet does form on the switch, it
will signal an overflow, resulting in a fail safe system.
LED
Prism
Photoreceptor
Diffracted light
Coded light
signal from
LED
No liquid contact
Reduced
reflected light
intensity
Submerged sensor head
Figure 3-1 – Electrooptic level switch
operation to prevent
waste overflow.
The ELS-1100 requires 10-28 VDC operating power and returns an open collector
capable of drawing up to 40mA. In the case of TTL digital logic, as is used on the DAQ
board, a straight connection to a digital input line without the use of a pull-up resistor is
adequate. 12 VDC were supplied directly from the PC power supply, which also powers the
solenoid valve buffer board. The sensor casing is screw threaded so that it can be screwed
into the lid and adjusted for height. Since no additional hardware was necessary, only the
purchase cost of the sensor was incurred.
If the level switch is tripped the current elution continues to completion, but a new
run is not permitted. A warning message is displayed at the end of the run. If a new run is
attempted without emptying the waste container, an error is produced and the elution does
not proceed until the waste container is emptied and the elution is restarted.
35
82
Rb Elution System Control
Ran Klein, University of Ottawa
Isolation Transformer
To meet Canadian Standards Association requirements, the equipment had to pass
electrical safety tests. These include current leakage to ground tests, and surge tests. This is
especially true since the stainless steel cart and the saline to the patients are both conductors.
To meet these requirements, an isolation transformer through which all the electronic
components in the cart are powered was added.
Uninterruptible Power Supply
As the cart must be moved around the PET imaging room and time constraints can be
tight, the system needed to remain powered while unplugged. This problem was easily
resolved by connecting the PC, pump, and touch screen display to an uninterruptible power
supply (UPS). The system is plugged into a wall socket at all times and only needs several
minutes of battery power while being moved. An off the shelf UPS rated for 800 V·A was
purchased (Belkin F6C800-UNV). This allows approximately 10 minutes of disconnected
time with the all the components powered but no elution in process.
High Density Plastic Lid
Although the generator and waste container are shielded by lead, the saline lines are a
source of radiation during elutions. To minimize exposure the personnel and patients, a high
density ¼ inch plastic lid was added to cover all the lines on the top of the cart. This cover
absorbs most of the positrons, but only a small fraction the gamma radiation which is also of
concern. Distance is the most effective shielding for gamma radiation [31] which is the
reason for automation of elutions. The lid was hinged to allow access when maintaining the
system and replacing the patient line.
Software packages
Selection of a proper software environment is a crucial decision and should be
addressed up front. Although many considerations should be taken into account, a few
dominant aspects made this choice clear. We were looking for a simple and mature operating
system which would be compatible with all our hardware and provide many services so as to
reduce the development time. In addition we wanted to work with a flexible environment
36
82
Rb Elution System Control
Ran Klein, University of Ottawa
which would allow future development as needed. Finally the realization that a familiar
environment would eliminate the initial learning curve brought forth the decision to use a
Microsoft Windows operating system to complement the PC platform.
Debate over the development environment (RT Rational Rose, National Instruments
LabView, and Matlab/Simulink) was easily resolved based on our extensive experience with
Matlab and the wide features it supports. The development environment of choice was
Matlab with a real-time windows target for Simulink. Simulink allows drawing real-time
applications through an extremely high level language of connecting blocks. Combined with
the optional real-time windows target (RTWT) one can compile the program to executable
code for optimized performance. Matlab is a high level interpreter language that provides
powerful mathematical and graphical tools. The computational overhead incurred with an
interpreter language could potentially be overcome by later compiling the scripts into stand
alone executable programs using an optional package.
To compile the Simulink models to executable code, a supported C compiler must be
provided. The Watcom C compiler is an accepted and proven compiler that is available
without charge. In addition, this compiler is continually being developed and is supported by
Matlab.
The RTWT runs as a CPU ring zero application (same privileges as the operating
system (OS) kernel) and is driven by the PC hardware clock for accurate timing. The RTWT
is triggered by a hardware timed interrupt and handles the application before triggering the
OS kernel. As a result, compiled applications are guaranteed execution in a real-time fashion
with the highest processing priority possible [32]. However, higher level services such as
graphics rendering and higher level interpreters are still provided by the operating system.
A debate over which Windows version to use arose within our group. On the one
hand, we had a long and relatively good experience with Windows 98. However, this
operating system suffers from a reputation of being unstable and having poor real-time
capabilities. Due to licensing issues, our alternative was windows 2000, which is based on
NT™ technology and is supposed to address the above mentioned concerns. After
experimenting with both operating systems and an ongoing correspondence with Mathworks’
technical support team, we concluded that Matlab RTWT had a compatibility issue with
37
82
Rb Elution System Control
Ran Klein, University of Ottawa
Windows 2000. It was finally decided to continue the development in a Windows 98
environment with the hope that the application would later be compatible with other
operating systems.
Windows 98 was designed as a general purpose operating system that shares
resources, including processor time, amongst all running tasks. As a consequence it does not
meet the requirements of a real-time operating system in which tasks are handled with tight
time constraints [33]. However, this is not a limitation in our case as the RTWT operates as a
second kernel parallel to that of the operating system and is triggered directly by hardware
events. As a result the real-time model is handled by a real-time kernel while higher level
services are handled in a less timely constrained fashion by the operating system.
During the development cycle Matlab and Simulink were used as a development
environment. The Simulink model was compiled to run on the RTWT. The remaining
components were implemented in Matlab, including the interface and high-level control of
the real time functionality. In this manner the real time components were guaranteed proper
time management, while the less critical higher layers could be developed with less
consideration for system resources.
Table 3-1 - Software Environment
Software Type
Operating System
Development
Environment and
Emulator
Company and Product
Microsoft Windows 98
Mathworks Matlab 6.5.1
(Release 13)
C++ Compiler
Watcom C++ Compiler
Components and Version
Windows 98 SE
Matlab 6.5.1
Simulink 5.0
Real-Time Workshop 5.0
Real-Time Windows Target 2.2
Watcom C++ Compiler 11.0c
Minimum PC requirements
As with any computer controlled real-time application it is a combination of software
and hardware that determine the overall performance. Although the application does not
initially indicate the need for much processing power, further inspection reveals some issues
of concern. Matlab versions 6 and above are implemented in Java, and therefore are executed
by a real-time interpreter (Java Virtual Machine). This interpreter translates Java code into
machine code and therefore entails a processing overhead. Similarly, Matlab is an interpreted
language as well, and therefore adds an even larger overhead of its own.
38
82
Rb Elution System Control
Ran Klein, University of Ottawa
Although the option of later compiling the application into machine code exists,
initial development was in Matlab. It was determined that the existing PC (refer to Table 2-1)
will remain unchanged for the time being as processing power did not seem to be an issue
with the prototype system.
Intellectual Property
Another consideration when choosing a software development package is protection
of the invested work. With an exposed interpreter language such as Matlab, it is quite simple
for any person to view the software code and make modification and copies. The investment
in the design of the code although protected by copyright contains intellectual information
that is the property of the developer. However, in practice it is difficult to prove the theft of
intellectual property. One means of protecting intellectual property in the form of software is
to compile it into machine code. Although reverse engineering could potentially be used to
decode the software, the inherent difficulty is enough to deter most. This reason in itself is
sufficient to justify compiling of the software prior to providing the system to a third party;
however, it was decided to defer this problem to a later stage if wider interest in the RbES is
expressed.
3.3
Flow Hardware Layout Justification
At the heart of the 82Rb elution system are the saline lines that transport the activity
from the generator to the patient. The layout of the saline lines, sensors and actuators is
crucial to implementing a physical system that is easy to control. During flow of a
radioactive volume through the lines, both a transport delay and a radioactive decay take
place. Therefore the activity at the output is delayed and reduced in relation to the activity at
the input. If the line volume, V, and flow rate, f, are known and fixed, one can compute the
delay time, T, and the radioactive decay, D as shown below.
T=
V
f
(3)
D = e − λT
(4)
39
Rb Elution System Control
Ran Klein, University of Ottawa
Activity
Flow
Activity
82
τ
Time
Time
Figure 3-2 – Response of transport of activity through a fixed volume line at a fixed flow rate.
However, if the flow rate is not constant, computation of the delay time becomes
more difficult, as one must integrate the flow rate over time to determine the transport delay,
T. For each infinitely small slice of the radioactive liquid in the line, a different delay would
result and therefore a different amount of decay. This can be expressed in a closed form
integral as in (5) which can be solved numerically based on discrete time measurements. One
could numerically integrate finite products of flow rate and time slice duration backwards in
time until achieving the line volume. The sum of the corresponding time slices would
represent T.
T
V = ∫ f (t − φ )dφ
(5)
0
Variation of flow rate would make prediction of activity at the end of a line difficult
and potentially inaccurate. To avoid computational errors and increase simplicity, one would
like to have a constant and known flow rate throughout the entire delivery time. This concept
serves as the key to choosing the ideal saline hardware layout from the following possible
solutions.
Pump Speed Variation
The flow through the generator could be varied by control of the flow rate via the
pump. Although this would seem like a simple and effective design, there are two main
complications involved. This would make computation and control of activity at the patient
output complicated as the exact time delay to the outlet must be solved based on the varying
flow rate, (5). This is further complicated by the chosen pump module (Harvard Apparatus
model 66 peristaltic pump) which does not support changing of flow rate on the fly. A stop
command must be issued and a new start command must follow resulting in finite and
varying pauses in the flow.
40
82
Rb Elution System Control
Ran Klein, University of Ottawa
Bypass Ratio Control
The above problems can be resolved by setting a constant flow rate at the start of the
elution process and controlling the ratio of the saline that flows through the generator (point
G in Figure 3-3). The remaining portion of the saline would flow through the generator
bypass line. The two lines would then be merged (point M) upstream from the activity
counter (point C). Thus, the flow in the combined line remains constant. This allows
computing of the transport delay from the counter to the patient outlet (point O). The flow
rate only varies in the line volume connecting the generator to the merger, VGM, based on
flow ratio, r. In order to reduce the variability in transport delay and decay this line volume
must be kept to a minimum.
Flow - F
Ratio
switch
(1-r)F
Switch
r·F
Point G
Generator
Output
Point M
Merging
Stopcock
Point C
Activity
Counter
Point P
Patient
Valve
Waste
Point O
Patient
Outlet
Figure 3-3 - Flow control through generator using a bypass line maintains a constant flow rate through
the other lines (M-O). Variation in flow rate is only in section G-M
As a result of the layout an overshoot of activity may be expected due to the volume
between point M and point C. If the elution is terminated based on accumulated activity
measured by the activity counter, this overshoot of activity must be taken into account.
Therefore the stopping threshold should be reduced to the requested dose minus the expected
overshoot. The overshoot of activity can be derived from the activity curve measured during
the day’s calibration run and is dependent on the eluted volume and the overshoot volume,
VMC.
The ratio between the two lines can be controlled through various valve types.
Variable Pinch Valve
It is expected that with a variable pinch valve an exact flow ratio through the
generator can be controlled. Ideally this would allow absolute control of the amount of
activity that can be extracted from the generator. Similar to Kirchhoff’s law in electricity, the
41
82
Rb Elution System Control
Ran Klein, University of Ottawa
pinch on one line increases the resistance, thus forcing more current through the alternative
route.
Various implementations of such valves exist. A common valve implementation
includes a stepping motor coupled to a screw thread which moves the pinchers. In order to
vary the pinch to a large extent, the motor must be rotated over many steps. This results in a
long response time. In addition, steps can be missed necessitating a feedback mechanism.
Early experimentation in our lab [18,20] was conducted with a variable pinch valve
with a one-sided pincher and position feedback. The problems mentioned above did surface,
leading us to conclude that a variable valve (at least of this type) was not suitable for our
application. As a result, other alternatives were sought.
On/Off Pinch Valve
The use of a solenoid on/off valve overcomes the complications involved with the
variable pinch valve. In addition the solenoid mechanism is far simpler, leading to a lower
price, simpler implementation, faster response, and increased reliability. These benefits come
at the expense of precision as the solenoid can only achieve two positions – fully open and
fully closed.
Figure 3-4 – Flow control
through the generator
using a variable pinch
valve on the generator
line.
(1-r)F
F
r·F
F
One must place a pinch valve on the generator line, with the spring set to stop flow.
This is intended to achieve a fail safe state where the generator flow is blocked if no power is
supplied to the solenoid. When the valve is open, saline flows through both the generator and
the bypass line at rates that are dependent on the relative resistance in each path (Figure 3-4).
When the valve is open, it is hoped that the majority of the flow will be through the generator
line. This assumption, however, is unrealistic since the compressed tin-oxide column of the
generator resists the flow of saline. A more advanced solution is necessary.
Double Sided On/Off Pinch Valve
Flow ratio control was achieved using a single two sided solenoid actuated pinch
valve on the bypass line and generator line (Figure 3-5). The valve allows flow through one
line at a time. This is equivalent to having an on/off pinch valves on each line operating
42
82
Rb Elution System Control
Ran Klein, University of Ottawa
opposite to one another. The valve is spring loaded to ensure failure to the bypass
open/generator closed position. This valve is referred to as the generator valve and is the
liquid flow control equivalent of a selector or demultiplexer.
Figure 3-5 – Flow control
through the generator
using a double sided
pinch valve on the bypass
line and generator line.
3.4
0/F
F
F/0
F
Design of Physical Processes
Prior to the daily clinical use of the system, certain maintenance measures must be
carried out as dictated by the daily protocol. These include flushing of all the lines in order to
remove Sr breakthrough and air bubbles that could accumulate during hours of standby. In
addition, the Sr breakthrough must be measured and a complete system test must follow. The
daily protocol was designed to include the following elutions with a minimum of 10 min
period between runs for the generator to recharge.
1.
Flush Run – flushing of all the lines in the system as well as a 50 ml flush
of the generator at 15ml/min. Ensures flushing of air bubbles in the saline
and Sr breakthrough from the generator.
2.
Calibration Run – flushing of the generator at 15 ml/min over 60 seconds
into the dose calibrator. The integral activity recorded from the dose
calibrator is used to calibrate the activity counter and verify that the
calibration constant is within tolerance from previous records. If the dose
calibrator sensitivity is sufficiently high, breakthrough measurements are
conducted after 20 minutes from completion of the elution. If the dose
calibrator is not sufficiently sensitive to measure breakthrough, the activity
can be entered manually after measurement in a more sensitive device. In
addition, the pump flow rate (ml/revolution) can be calibrated by manually
entering the actual eluted volume.
3.
Patient Elutions – Over the remainder of the day elutions to the patients can
be carried out in three modes:
43
82
Rb Elution System Control
Ran Klein, University of Ottawa
a. Constant-Activity – a prescribed dose is eluted over a prescribed time at a
constant-activity rate.
b. Constant-Time – The generator is flushed at a constant rate to achieve a
prescribed dose within a prescribed time.
c. Constant-Flow – The generator is flushed at a prescribed flow rate until a
prescribed dose is reached.
The 82Rb infusion system software must ensure that the protocol is followed (i.e. that
each run is enabled only after the prerequisites have been completed successfully). All the
above elutions are similar in sequence and only vary in parameters, therefore a single
physical process was implemented.
Run sequence
All elution types follow the same general set of events. These events are designed to
keep the lines primed at all times and to ensure flushing of all activity in the lines to either
the waste container or the patient outlet. No activity should remain in the patient line at the
end of an elution, in order to provide the prescribed dose to the patient and reduce
background activity. The following sequence is common to most elutions.
1. Flush Bypass-to-Waste - The volume in the lines from the pump head to the
patient valve (Point P) is flushed through the bypass to the waste container in
order to remove air bubbles and activity that may remain from a previous run.
2. Priming of the Patient Line - When a new patient line is connected, it must be
primed prior to elution to the patient. This is done by eluting the volume of
the line, filter and needle with saline through the bypass. A slow drip session
follows, allowing completion of the priming and connection of the line to the
patient. The dripping state is performed at a low flow rate to avoid squirting
of excess saline from the open ended needle.
3. Waiting for Threshold Activity - The generator flush is commenced while the
activity counter readings are monitored. If a minimum threshold activity is not
reached within a given time, the elution sequence is aborted and an error
44
82
Rb Elution System Control
Ran Klein, University of Ottawa
instructing to check for blockage is reported. Once the threshold activity is
reached, the elution follows.
4. Elution - This state is the actual elution of activity from the generator to the
patient. Two types of elution states are used, depending on the elution run
type:
Wait for Cumulative Activity – Elution until the requested dose minus an
anticipated overshoot activity is reached, or the allowed time expires.
Wait for Cumulative Time – Elution for a given time, regardless of the
amount of activity eluted.
At this stage the patient valve is switched to the patient outlet as needed. This
switch is delayed in time to account for the transport delay from the counter to
the patient valve. As a result, only the volume past the threshold activity is
eluted to the patient outlet, while the initial rise is sent to the waste container.
5. Bypass-to-Patient Flush - The final state flushes saline through the bypass to
the patient outlet in order to push the activity in the lines to the patient outlet.
The volume of the patient line plus an extra volume (2 ml) are flushed to
ensure that no activity remains in the line. The extra flush volume can be
modified to simulate more closely the sequence followed during injection of
13
N-ammonia.
6. Dose Calibrator Recording - In the case of calibration or test runs, additional
readings must be recorded from the dose calibrator. These reading must be
over at least the duration of the elution (2 x elution times in total). To ensure
that sufficient readings are always taken, data logging continues for 360
seconds following the elution stage.
Calibration
The calibration procedure is primarily intended to calculate the calibration constant,
K in (2), for the activity counter. This constant gives physical meaning to the events that are
counted by the detector. Since this number is dependent on many parameters which cannot
all be calculated, an alternative has been proposed to calibrate the counter to an external
45
82
Rb Elution System Control
Ran Klein, University of Ottawa
standard [19,20]. The use of a dose calibrator as a reference calls for conversion of units and
accounting for decay during the calibration process. In addition, the dose calibrator acts as an
integrator, as activity accumulates in the vial. Transport delay from the activity counter to the
dose calibrator, TCO, and its associated decay must be accounted for as well. The calibration
constant is an overall measure of the counter’s efficiency incorporating geometric and
intrinsic factors (Figure 3-6).
Detector
Optical
Fiber
Lead
Shielding
Positron
Paths
Saline
Aperture
Line Wall
Figure 3-6 - Schematic diagram of the activity counter illustrating some factors that contribute to its
efficiency. Not all positrons in the FOV are captured by the scintillator and not all the tubing cross
section is necessarily in the FOV.
The dose calibrator is composed of an ionization chamber that is sensitive to ionizing
radiation in the form of high energy photons. Although shielding from external radiation is
included in the design, and is typically added in the form of lead rings, radiation from the
surroundings is also detected to varying degrees. The exact region of measurement of the
dose calibrator is unknown, and dependent on its geometry. Measurements are taken not only
of the contents in the vial, but also of a portion of the line leading to the vial. The exact
portion of the line that is measured by the calibrator cannot be easily determined
theoretically. Empirically the transport delay from the activity counter to the calibrator can
be determined through shifting of the measurements for optimal alignment.
46
82
Rb Elution System Control
Ran Klein, University of Ottawa
Measurement
Sensitivity Contour
(for demonstration
only)
Calibrator
Chamber
Patient
Line
Vial
Portion of Patient
Line Included in
Measurement
Figure 3-7 - Dose calibrator chamber measurement diagram.
The integral activity curve referring to the dose at the patient outlet, AO(t), can be
obtained by convolving the instantaneous count rate from the activity counter, N̂ Det (t) , with
the 82Rb decay curve, e-λt. The convolution function accounts for the accumulation in the vial
and simultaneous
82
Rb decay. The transport delay between the activity counter and the
patient outlet, TCO, and its associated delivery decay, are also accounted for. Finally, the flow
rate is factored to convert the units as shown in the denominator of (6).
Early detection of activity by the dose calibrator has been noted and results from
detection of activity in the line prior to reaching the vial as demonstrated in Figure 3-7. This
is corrected for by time shifting (with the respective decay correction) of the dose calibrator
readings, ÂO(t), to correspond with the expected activity curves at the patient outlet. The
shift time, T̂corr , is solved for by minimizing the mean-squared-error (MSE) between the
activity curves measured by the dose calibrator and calculated from the activity counter
readings. The shifted and decay corrected dose calibrator readings are symbolized by Âcal(t)
in (6).
The calibration constant can be most reliably computed by factoring the integral of
the measured doses over the time that activity is contributed to the vial as shown in (6).
Using the integral activity accounts for all available data and therefore decreases the effect of
noise.
47
82
Rb Elution System Control
K=
Ran Klein, University of Ottawa
∑ Aˆ
∑A
cal
(t )
O (t )
=
∑ Aˆ
O
(t − Tˆcorr ) ⋅ e − λTcorr
ˆ
(6)
∑ ( Nˆ Det (t − TCO ) ⊗ e −λτ ) ⋅ f ⋅ e −λTCO
A complimentary approach can be carried out to compute the activity counts, Ndet(t),
based on the dose calibrator measurements, Acal. This requires deconvolution (⊗-1) of the
dose calibrator measurements with 82Rb decay function and shift/decay correction for time –
TCO+ T̂corr as shown in (7). Although this curve can be useful for verification of results, it is
undesired for calibration calculation as the deconvolution is inherently noisy.
N det (t ) =
Acal (t − (Tcorr − TCO )) ⊗ −1 e − λτ − λ (Tcorr −TCO )
e
K⋅ f
(7)
Both calibrator and detector readings are recorded over the course of a one minute
flush at 15ml/min and an additional two minutes following. The detector readings are
converted to the calibrator readings and vice versa. As a result, four, curves are obtained as is
demonstrated in Figure 3-8. The pairs can be compared to calculate the calibration constant.
Calculation of the calibration constant based on the area under the calibrator readings and
their estimate from the detector improves accuracy through the use of all available data.
These areas can be calculated by integrating the activity over the interval that activity is
being eluted.
Integral Activity at Patient Outlet (Vial)
Integral Activity (MBq)
20
Detector: Convolved
Calibrator: Delayed
15
10
5
0
0
20
40
60
80
100
120
Time (s)
Instantaneous Activity at Patient Outlet
140
160
Activity Rate (MBq/s)
1.5
180
Detector: Delayed
Calibrator: Deconvolved
1
0.5
0
0
20
40
60
80
100
Time (s)
120
140
160
180
Figure 3-8 - Sample calibration run results. The top graph demonstrates the recorded and estimated
activity at the dose calibrator after calibration. The bottom graph shows the actual and estimated activity
rate at the activity counter. The cyan line refers to the beginning of elution (threshold activity = 0MBq/s
is passed). The red line indicates the end of the elution (generator valve is closed) while the black line
indicates the overshoot volume that is flushed to the calibrator.
48
82
Rb Elution System Control
Ran Klein, University of Ottawa
The calibration process was validated over various flow rates and showed close
correlation of the integral activity curves. However, at low flow-rates larger variations were
noticed. This is partially explained by the aperture response of the dose calibrator
demonstrated in Figure 3-7. As activity enters the aperture, the sensitivity increases. The
shape of the response is unknown, but was estimated to be Gaussian at the edges as
demonstrated by Figure 3-9b. The prototype system assumed the aperture to be a step
response to the line distance (Figure 3-9a). Once the activity is in the chamber the sensitivity
is highest and is assumed equal throughout. The undetermined distance that relates to the
region of full sensitivity is depicted by the flat portion of Figure 3-9a and right and is
accounted for by solving for T̂corr .
(a)
Full Sensitivity
in chamber
(b)
Sensitivity
Sensitivity
0
Distance from vial
along saline line
0
Gaussian
response at edge
of aperture
Distance from vial
along saline line
Figure 3-9 - Aperture response of the dose calibrator as a function of distance along the saline line from
the vial as assumed initially (a) and corrected for aperture response with an estimated Gaussian edge (b).
The chamber aperture sensitivity is estimated as a Gaussian of the line distance as
shown in (8). Since the line cross-section is uniform and the flow rate, f (ml/s), is constant,
distance is proportional to time, t (s), for any given elution. A single constant, α (1/ml2), was
used to describe the sensitivity response of the chamber over distance. The response does not
need to be normalized as at distance zero it represents a sensitivity of 1 while it decreases to
an asymptote of zero as the distance from the chamber increases. This is an accurate
description of the assumed aperture sensitivity response.
2
a (t ) = e −α ( ft ) where t ≥ 0
(8)
The parameter α was determined empirically from calibration runs at flow rates
ranging from 5 to 25 ml/min. Parameter α was set to 0.7 (1/ml2) which corresponds to a 50%
drop in sensitivity over 1.17 ml line volume. This volume translates to several centimetres
from the dose calibrator’s point of maximum sensitivity. As can be seen from (8) the
aperture correction becomes closer to a step response (in time) as the flow rate increases,
49
82
Rb Elution System Control
Ran Klein, University of Ottawa
which explains why this effect is more noticeable at low flow rates. An example of constantflow test run at 5ml/min is included in Figure 3-10 depicting the integral activity with and
without aperture correction. This improved modeling of the dose calibrator aperture response
allows more accurate comparison of the expected activity profile to those measured by the
calibrator.
Integral Activity (MBq)
Integral Activity (MBq)
Integral Activity at Patient Outlet (vial) - No Aperture Correction
15
15
Detector: Convolved
Calibrator: Delayed
10
5
0
0
50
100
150
200
Integral Activity at Patient Outlet (vial) - With Aperture Correction
Detector: Convolved
Calibrator: Delayed
10
5
0
0
50
100
Time (s)
150
200
Figure 3-10 - Example of a constant-flow test run without (top) and with (bottom) a Gaussian aperture
correction (α=0.7).
The calibration process must be carried out daily as part of the daily protocol. This is
intended to not only to fine tune the system, but also to ensure a complete system test. Some
variation is expected in the calibration constant as a result of errors and noise. If the variation
is above 10% from a cumulative average, the calibration run does not pass and a warning is
generated to the operator. The average, as is calculated in (9), may gradually adapt to
accommodate long term changes in the system while rejecting random errors. The average is
used as the actual calibration constant for successive runs.
KA = 0.9·KA + 0.1·K
(9)
Breakthrough Activity Measurement
The dose calibrator is used to detect the breakthrough activity as part of the
calibration test through measurement of
high proportion of
82
82
Rb activity. Once elution to a vial is complete, a
Rb isotopes are present. This activity decays exponentially over time.
After ten minutes approximately 0.42% of the activity should remain in the vial. However, as
50
82
Rb Elution System Control
Ran Klein, University of Ottawa
time progresses, an asymptotic equilibrium of activity that is greater than zero may result due
to the contribution of 82Rb isotopes from 82Sr decay in the vial.
The Sr solution that is loaded onto the generator column is composed of mostly 82Sr,
but also contains a large amount of 85Sr. The manufacturer provides the ratio of 82Sr to 85Sr
in the sample as was measured in the factory, s0. The half-lives of 82Sr and 85Sr are 25.5 and
64.8 days respectively allowing calculation of their ratios, s(t), at the elapsed time, t, since
measurement by the manufacturer using (10).
s (t ) = so
e − ln( 2) t / 25.5
= so e ln( 2) t (1 / 64.8−1 / 25.5)
− ln( 2 ) t / 64.8
e
(10)
The breakthrough of each isotope, A82Sr/A82Rb and A85Sr/A82Rb, is calculated as a
relative activity ratio of Sr activity to 82Rb activity delivered as demonstrated in (11), below.
Aˆ Breakthrough
A82 Sr 1 + 0.48s (t )
=
A82 Rb
A82 Rb
and
A85 Sr
= s (t ) ⋅ A82 Sr
A82 Rb
(11)
The dose calibrator is sensitive to the radiation of 82Rb decay which is a consequence
of
82
Sr decay. The
82
Sr activity is not measured directly. ÂBreakthrough is the measured
breakthrough activity by the dose calibrator after sufficient time has passed for the initial
82
Rb activity, A82Rb, to decay. The equation corrects for the dose calibrator sensitivity to the
different isotopes, their decay sequence and their abundance.
If the generator is reloaded with Sr, the 82Sr/85Sr ratio, s(t), becomes unknown, since
there is contribution from both the remaining Sr isotopes on the column, and the new amount
that is loaded. The breakthrough is calculated based on the assumption that all the
breakthrough activity measured is contributed by 82Sr. The 85Sr breakthrough is calculated as
a ratio of the calibrator sensitivity. This implicitly assumes is that all the activity is resulting
from 82Sr activity and that a corresponding amount of 85Sr isotopes are also present. The bias
in this estimate is intended to err on the safe side.
A82 Sr S
=
A82 Rb R
and
A85 Sr
A82 Sr
=
A82 Rb 0.48 ⋅ A82 Rb
51
(12)
82
Rb Elution System Control
Ran Klein, University of Ottawa
Health Canada guidelines dictate that breakthrough ratios must be less than 2x10⁻⁴
and 2x10⁻⁵ for
85
Sr and
82
Sr respectively [34]. In order to confirm that the breakthrough is
less than these ratios, the 82Rb dose must be given enough time to decay below these levels,
which corresponds to 19.8 minutes of decay to reach 2x10⁻⁵ of the original activity. This is
the minimum time that must pass until the breakthrough measurement can be taken.
The ability to accurately measure the breakthrough depends on the sensitivity of the
dose calibrator. The Capintec CRC-15R (Capintec Inc., New-Jersey) that was used during
the development of the
82
Rb Elution System is rated to a sensitivity of 0.002 MBq [35]. In
-5
order to measure 2x10 of the initial activity, the flushed dose during calculation must be at
least 0.002/2x10-5 = 100 MBq. In a clinical setting, the generator must be capable of eluting
at least 500 MBq to ensure good quality scans. If the eluted
82
Rb activity is insufficient to
accurately measure breakthrough, the automatic measurement is skipped. The operator may
manually enter the breakthrough activity from a more sensitive instrument.
Elution Tests
The system behaviour must be tested to confirm that the supplied activity is accurate.
During routine patient elution runs, confirmation of the output activity is based at the activity
counter which is upstream from the patient outlet. If modeling of the system is accurate, then
the activity at the patient outlet can be precisely determined based on readings from the
activity counter. The system model was confirmed through testing of elutions.
As part of the design, test runs had to be implemented for all patient elutions. These
runs execute the exact sequence of the corresponding patient run but include data collection
from the dose calibrator. A data analysis follows the elution by producing activity rate and
integral activity graphs as is done with calibration runs. A correspondence between the sets
of theoretical and measured curves is the ultimate indication of accurate modeling of the
system. If the curves agree, it can be deduced that the model of the system reliably
determines the activity profile injected to the patient.
Elution tests can be treated as a cross between a calibration run, and a patient elution.
Data collection from the dose calibrator and analysis reports are identical to calibration,
however, the calibration constant is not recalculated. The elution sequence dictated by the
elution parameters should be identical to regular patient elutions.
52
82
Rb Elution System Control
3.5
Ran Klein, University of Ottawa
Software Design
A complete run sequence is composed of three main stages; pre-run, real-time
sequence, and post-run. The real-time sequence stage was the main focus of the development
and therefore will be covered in greater detail, while the other two stages will be briefly
explained and demonstrated.
Pre-Run Stage and the GUI-Sequence
The pre-run stage is controlled by the GUISequence function which runs through a
series of steps to interact with the user and collect relevant information to initiate the elution.
The only interaction with external hardware is to test communication and status.
The opening screen displays a timer countdown until the next elution can be started
(Figure 3-11a). This accounts for the minimum 10 min interval required between elutions.
The countdown can be skipped if desired by pressing the skip button. Once the countdown
completes the timer is replaced with an appropriate message as shown in Figure 3-11b. The
screen can then be pressed to initiate the GUISequence function. If errors are detected during
the initial testing an appropriate message is displayed and the program is halted as is
demonstrated by Figure 3-12a. The sequence will not continue until all errors are resolved. In
the case of a warning to the user, a dialogue is displayed and the sequence will continue upon
acknowledgement (Figure 3-12b).
(a)
(b)
Figure 3-11 - Opening message screen with generator recharge countdown timer (a) and without (b).
The generator information screen is displayed first, which gives information as to the
state of the generator activity and history. Following is a prompt for a user ID code, which is
useful for avoiding tampering by unauthorized personnel as well as enabling test runs, which
were commonly used during the development cycle, but have no clinical application. The
user is then prompted to select a run type (Figure 3-12c). The options presented to the user
53
82
Rb Elution System Control
Ran Klein, University of Ottawa
(a)
(b)
(c)
(d)
(e)
(f)
(g)
(h)
Figure 3-12 - Various screenshots of the GUI. (a) Error message. (b) Warning. (c) Data entry. (d) Out of
range data. (e) Confirmation. (f) Elution results. (g) Elution graphs. (h) Elution stage and progress.
54
82
Rb Elution System Control
Ran Klein, University of Ottawa
vary depending on the user ID, expiry of the generator, time since last flush, and time since
last calibration. These considerations are aimed at ensuring that the generator is not used for
clinical applications if it has expired. In addition it ensures that the daily protocol is
followed, including a flush and calibration (including a test of breakthrough activity) at the
start of each day.
Depending on the chosen run-type, the user is prompted for additional information
such as patient number, dose activity, elution time, flow rate, priming of the patient line, etc.
At all stages the input is checked for validity and warnings are presented to the user with
detailed explanations (Figure 3-12d). If a calibration or test run is chosen, the Capintec dose
calibrator is tested for communication and proper settings. Finally a confirmation screen
(Figure 3-12e) is displayed with all the inputs for the user to review. After confirmation the
real-time sequence is initiated with the proper settings set as global variables.
Post-Run Stage
Although chronologically the real-time sequence follows, the post-run stage is
discussed first due its relative simplicity. On termination of the real-time sequence one of
three possible scenarios exists:
1. A successful run has terminated and the elution results must be presented.
2. An error has occurred during the real-time process and a proper message must
be reported to the user.
3. The elution was aborted by the user using the Emergency Stop button, in
which case an appropriate message screen should be displayed.
In the case of a successful run, the information presented to the user will vary based
on the run-type (Figure 3-12f). With the exception of daily-flush runs, a view toggle button is
presented on the bottom bar which enables to toggle between text results and a graphical
report (Figure 3-12g). Two graphs are included of the instantaneous activity rate at the
patient outlet and of the integral activity at the patient outlet as discussed in the calibration
section.
55
82
Rb Elution System Control
Ran Klein, University of Ottawa
If the termination of the real-time sequence was a result of an error or an emergency
stop a window coloured red (Figure 3-12a) or yellow respectively is displayed. Error
messages are as specific as possible given the available information. The messages include a
description of the error and suggestions on how to resolve the issue.
After the post-run message has been displayed to the user the option of restarting the
program is displayed. The program is completely restarted after each run through a call-back
function which clears the entire workspace and restarts the software for the next operation.
Real-Time Sequence
The real-time process is started by confirming the elution settings by the user. The
Hardware_Interface model is loaded to the RTWT, initialized with all the relevant
parameters, and started. Once the start command is issued to the RTWT, the GUISequence
terminates. On completion of the real-time process, a termination function is called which
executes the post-run operations.
Hardware_Interface
GUISequence
Physical_Sequence
Result Screens
• FinalElutionScreen
• Emergency_Stop
• Error_screen
Program
Sequence
Data_Log
Sensors
Legend:
Sequence
Actuators
Data
Control
Figure 3-13 - Sequence, data, and control, flow and structure diagram of software.
The Hardware_Interface model consists of several layers. At the lowest layer the
Hardware_Interface itself communicates with the hardware sensors and actuators. At the
next layer the Physical_Sequence model controls the sequence of elution steps acting as a
state machine. At the topmost layer, the Data_Log stores data from the Hardware_Interface
to global variables. These data are used for computations in the Physical_Sequence, saving
56
82
Rb Elution System Control
Ran Klein, University of Ottawa
of records to file, producing elution reports as part of the post-run stage, and calibration of
the system. Figure 3-13 demonstrates the flow of control, data, and sequence of a full elution
sequence.
Hardware Interface
The Hardware_Interface (shown in Figure 3-14) is a wrapper for the entire Simulink
model which runs the real-time sequence. The model collects readings from the activity
counter, pressure sensor, overflow switch, and elapsed time (green blocks). These readings
are processed to control the actuators such as valves (magenta blocks), pump, and GUI.
Internal variables (light blue blocks) are used for control of the Hardware_Interface by the
Physical_Sequence block. In addition to the Hardware_Interface models, the model consists
of the Software_Interface model and the Valve_Control model. The Valve_Control block
controls the valves through real-time control to achieve constant-activity elutions, and is
discussed in depth in Chapter 4:Elution Profile Control. The Software_Interface block is a
wrapper of the Physical_Sequence block and collects the input data to a structured array.
Data transfer to Matlab workspace
Analog
Input
Analog Input
National Instruments
PCI-6035E [auto]
Pressure
Average
580
mV to psi
Pressure Average
12:34
Time
RunTime
Pressure
Digital
Input
Overf lowSens
Digital Input
Counts
National Instruments
PCI-6035E [auto]
0
Counter
Input
Counter Input
National Instruments
PCI-6035E [auto]
Counter
Sum
0
Counter Sum
ValveOpen
Patient Valve
PatientValve
Generator Valve
ValveOpen
PredictionRatio
PredictionRatio
ValveCorrection
ValveCorrection
GeneratorValve
Error
Counts
Error
ValveControl
0
ExpectedActivity
ExpectedActivity
PWM
Control_Valves
Counter Reset Timing
Digital
Output
Digital Output2
Trigger Timing for Signal Tracing
Pulse
Generator1
Software_Interface
National Instruments
PCI-6035E [auto]
Signal Tracing Trigger
DutyCycle
ValveVibratorDriver
Figure 3-14 - The Hardware_Interface model.
57
82
Rb Elution System Control
Ran Klein, University of Ottawa
The DAQ general counter 1 (GPCTR1) is configured to accumulate on each input
rise. This input is connected to the activity counter through TTL over coax cable. Over a
typical elution the 24 bit counter can easily overflow, leading to data errors. To avoid this
problem it is desirable to reset the counter after each reading by the software; a feature that is
not supported by the Simulink drivers. In the prototype system this issue was elegantly
solved by connecting the counter external reset to a digital output on the DAQ. The
Hardware_Interface periodically resets the counter in synch with reading of the counter
value.
Other sensors are straightforward to interface; the pressure sensor is read by an A/D
converter and the overflow switch is a binary input. The pressure and counter readings are
both conditioned through an averaging filter. This is achieved through a simple delay line
and averaging of all the readings over the past second. Since each is read at 20 samples per
second, the averaging is over 20 samples. The pressure sensor readings are converted to PSI
units through multiplication by a calibration constant (determined to be 580 through
empirical calibration with an external gauge). Recalibration after 1 year showed no
significant change in this calibration constant.
Physical Sequence
All the elution types comprising the daily protocol are composed of similar physical
steps as shown in Figure 3-15. A single physical sequence that is controlled by the
parameters of each elution is desirable. The parameters in Table 3-2 dictate the physical
sequence of the elution.
58
82
Rb Elution System Control
Flush
Ran Klein, University of Ottawa
Calibration
Patient Elution
Test Elution
Initialization
Initialization
Initialization
Initialization
Wait for Pump
Start
Wait for Pump
Start
Wait for Pump
Start
Wait for Pump
Start
Flush Bypass-toWaste
Flush Bypass-toWaste
Flush Bypass-toWaste
Flush Bypass-toWaste
Option
Prime Patient
Line?
Yes
No
Option
Prime Patient
Line?
Yes
No
Option
Prime Patient
Line?
Yes
No
Option
Prime Patient
Line?
Yes
Prime Patient
Line
Prime Patient
Line
Prime Patient
Line
Prime Patient
Line
Cumulative Time
Waiting
Slow Drip Bypass
to Patient
Slow Drip Bypass
to Patient
Slow Drip Bypass
to Patient
Bypass-to-Patient
Flush
Start Elution
Start Elution
Start Elution
Exit
Cumulative Time
Waiting
Waiting for
Threshold
Waiting for
Threshold
Bypass-to-Patient
Flush
Cumulative
Activity Waiting
Cumulative
Activity Waiting
Extra Calibrator
Data
Bypass-to-Patient
Flush
Bypass-to-Patient
Flush
Wait for
Breakthrough
Reading
Exit
Extra Calibrator
Data
Termination
Termination
No
Exit
Exit
Termination
Termination
Figure 3-15 - Flow Chart for all elution types. The similarity in form justifies the implementation of a
single physical sequence state machine.
59
82
Rb Elution System Control
Ran Klein, University of Ottawa
Table 3-2 – Elution parameter values for each run type.
Paramete
r
Flush
Calibratio
n
Constant
-Activity
Constant
-Time
Constant
-Flow
Prime
patient
line
Elution
Activity
Elution
Flow Rate
U.D.
U.D.
U.D.
U.D.
∞
∞
U.D.
15
ml/mi
n
50 ml
15ml/min
Maximum
15 ml
Elution
Volume
Elution
200 s
60 s
Time
Elution
∞
∞
Set Point
Threshold
0
0
Activity
Rate
Overshoot 0
0
Volume
Calibrated ‘no’
‘yes’
run
‘no’
‘yes’
Calculate
Calibratio
n Constant
Legend: Calc. – Calculated
U.D.
Constant
-Activity
Test
U.D.
Constant
-Time
Test
U.D.
Constant
-Flow
Test
U.D.
U.D.
U.D.
U.D.
U.D.
U.D.
Calc.
Calc.
U.D.
Calc.
Calc.
U.D.
30 ml
15 ml
30 ml
30 ml
15 ml
30 ml
U.D.
U.D.
60 s
U.D.
U.D.
60 s
∞
∞
∞
∞
Calc.
0.5
MBq/s
0
Calc.
0.5
MBq/s
0
0.075 ml
0.25 ml
0.25 ml
0.075 ml
0.25 ml
0.25 ml
‘no’
‘no’
‘no’
‘yes’
‘yes’
‘yes’
‘no’
‘no’
‘no’
‘no’
‘no’
‘no’
Calc.
Calc.
U.D. – User Defined
The real-time sequence is based on a state machine composed of eleven discrete
states (Figure 3-15), not including the initialization and termination of the component. The
Physical_Sequence was implemented as an M-file S-function, which is a Simulink block that
is implemented in Matlab code. Although execution requires an interpreter at real-time
(adding a significant processing overhead), it greatly simplifies development. Matlab
provides services to compile the M-file S-function into executable code (DLL file),
providing improved performance and better protection of intellectual property. Compilation,
however, requires some customization of the Matlab code and is a fairly involved process. It
was therefore decided to use the interpreter during the development stage.
M-file S-functions
The Matlab and Simulink framework dictates a strict yet flexible template for all
Simulink blocks implemented through Matlab code. The framework describes a complete
60
82
Rb Elution System Control
Ran Klein, University of Ottawa
state machine through two main stages that are executed each iteration. The Update stage
checks conditions to change state and is also used to initialize the upcoming state. The
Output stage conducts the operations associated with the current state, such as recalculating
outputs and updating a display. In addition, an initialize stage is called when the object is
loaded and a terminate stage is executed just prior to closing the object. The RTWT manages
the current stage (Initialize, Update, Output, or Terminate) to the M-file S-function by
passing a stage parameter on each S-function call.
Parameters are passed to the physical sequence through global variables, while the
real-time collected data are passed through the Simulink block inputs. These inputs include
the various sensor data, elapsed run time, accumulated generated flush time, and other
measures of the valve control block. The simplicity through which this block can be
integrated in the Simulink implementation raises an important question: which functionality
should be implemented in Simulink, and which should be programmed as part of the Sfunction? As a general guideline it was decided to leave only the sensors data, real-time
clock, and any results of the real-time valve control block as inputs to the Physical_Sequence
block for the sake of simplicity. All the computational, graphical, and data collection
functionality is implemented through the Physical_Sequence S-function.
The inputs to the Physical_Sequence function were collected and structured by the
Software_Interface block within the Hardware_Interface. The Physical_Sequence function is
called through the use of a function call block within the Simulink model. The
implementation is shown in Figure 3-16 where the long vertical bar acts as a multiplexer and
combines all the inputs into a single array. The zero-order holds are all run at the same rate,
which is set by a local parameter Ts = 1 s, and are intended to convert all inputs to the
function’s sampling rate.
61
82
Rb Elution System Control
Ran Klein, University of Ottawa
1
Elapsed Time
Time
4
Zero-Order
Hold10
Activity Counter Readings
Counts
2
Zero-Order
Hold2
Pressure Readings
Pressure
5
Zero-Order
Hold3
Flow Ratio Readings
ValveOpen
3
Zero-Order
Hold4
Overflow Sensor State
OverflowSens
0
CapAcqTime
5.5233
CapActivity
NaN
pumpCode
6
Zero-Order
Hold5
Capintec Acquisition Time
physical_sequence
S-Function2
Zero-Order
Hold6
Capintec Reading
Zero-Order
Hold7
Pump Status Code
Zero-Order
Hold8
Flow Ratio Set By Prediction
PredictionRatio
7
Zero-Order
Hold1
Flow Ratio Correction
ValveCorrection
8
Zero-Order
Hold9
Activity Rate Error
Error
Zero-Order
Hold11
Figure 3-16 - Inputs to the Physical_Sequence M-file S-Function block.
The Physical Sequence
The Physical_Sequence code utilized the Update and the Output stages of the M-file
S-function for separate tasks. The Update stage determined the state for the next iteration
based on the current state, the type of elution run, and the accumulated data. When a state
transition is initiated, the next state is initialized by preparing the GUI for the next state,
computation of variables, and sending commands to the actuators. The Output stage
performs updating operations within the current state. This includes updating the actuators
and GUI while performing real-time data gathering and computations. The Update and
Output stage tasks overlap only in the sense that the Update stage performs Output tasks only
as an initialization of a stage that should occur at a single instance of stage transition. In
62
82
Rb Elution System Control
Ran Klein, University of Ottawa
summary, the Update stage updates the state of the state machine and initializes the next step
(routines that are carried out a single time at the beginning of a state), while the Output state
maintains the actuator states and GUI during the state.
The Update stage is composed of a large switch-case statement for each of the
sequence states and condition statements for transition to subsequent states. If the transition
condition is met for the current state an initialization of the next state is executed and the
function return value is set to the next state code. The states and their termination conditions
are listed in Table 3-3.
Table 3-3 – Physical_Sequence states and their termination conditions. As long as a termination condition
is not met, the state is maintained unchanged.
State Name
Wait for
Pump Start
Flush Bypassto-Waste
Prime Patient
Line
Slow Drip
Bypass to
Patient
State
Description
Wait until pump
driver is loaded
and pump starts.
Termination Condition
Next State
Pump is running after less than 2 restart tries
Flush Bypass
to Waste
Error is set
(Termination
follows)
Option Prime
Patient Line
Slow Drip
Bypass to
Patient
Cumulative
Time Waiting
Cumulative
Time Waiting
Else
Bypass route
(from pump to
patient
stopcock) is
flushed to the
waste.
Enough time has
elapsed to prime lines
Patient line
(from patient
cock-stop to
patient) is
flushed to the
patient.
A slow drip to
the patient line
until the
continue button
is pressed.
Enough time has
elapsed to prime
patient line
Prime Patient Line?
Else
Flush run?
Else
Continue button is
pressed
Flush run?
Else
Threshold
activity
exists
Slow Drip
Bypass to
Patient
Calibration
or flush run
Else
Else
Waiting for
Threshold
Cumulative
Elutes from
generator to
waste until the
threshold
activity is
reached, or the
time has
expired.
Elute activity
Threshold activity
rate is reached
Calibration or flush run?
Else (elution or test)
Threshold not reached – timed out
Requested time has passed
63
Cumulative
Time Waiting
Cumulative
Activity
Waiting
Waiting for
Threshold
Cumulative
Time Waiting
Cumulative
Activity
Waiting
Error is set
(Termination
follows)
Bypass Patient
82
Rb Elution System Control
Time Waiting
Cumulative
Activity
Waiting
Bypass-to Patient Flush
Extra
Calibrator
Data
Wait for
Breakthrough
Reading
Exit
from the
generator for a
given time.
Elute the
activity until the
required dose is
reached or time
expires.
Flush the
remaining
activity in the
line to the
patient.
Gather
additional data
from dose
calibrator for
convolution
comparison.
Wait for decay
to read
breakthrough
from dose
calibrator.
Dummy State
indicating that
sequence was
gracefully
completed.
Ran Klein, University of Ottawa
Flush
Requested dose reached
Requested dose not reached – timed out
Enough time has
elapsed to flush
activity from lines
Enough measurement
time has elapsed
Flush or patient run
Else (calibration or elution
test)
Calibration run
Else
Enough time has elapsed or user has aborted
measurement
Bypass Patient
Flush
Error is set
(Termination
follows)
Exit
Extra
Calibrator
Data
Wait for
Breakthrough
Reading
Exit
Exit
Physical_Sequ
ence
termination
function
The Output is implemented using an identical switch-case statement determining the
operations during the current state. However, there are additional functions that are carried
out regardless of the current state. One such task is error detection, which is carried out
through a series of tests on the input data. Another common task is data logging
(implemented by Data_Log function), which is enabled once actual elution from the
generator is started. Finally, the real-time system diagram is updated by rewriting the current
measurements and calculations to the GUI fields.
3.6
Error Detection
A variety of error detection mechanisms have been included in the software to handle
hardware malfunctions as well as software errors. Error trapping is included in all phases of
the program and leads to immediate termination of an elution with an error message which
guides the operator towards resolution of the error. Table 3-4 lists the errors that the system
may detect and their corresponding internal error flag. At the beginning of the application the
64
82
Rb Elution System Control
Ran Klein, University of Ottawa
error flag is set to zero. If at any point the flag changes to a value other than zero, the elution
will terminate with the error message screen.
Table 3-4 - Detectable errors and their corresponding flags.
Error Code
Message
Pressure
10001
High pressure encountered. Check bypass and waste lines.
10002
High pressure encountered. Check bypass and patient lines.
10003
High pressure encountered. Check generator and waste lines.
10004
High pressure encountered. Check generator and patient lines.
10005
High pressure encountered while pump should be stopped. If the problem persists contact the developer.
Pump – communication
20001
Pump communication error. Check pump control cable and power and restart the elution.
20002
Pump version mismatch detected. Contact the developer.
Pump – operation
30001
Pump stalled. Check proper line position in pump head and ensure that there are no obstructions.
30002
Pump should be running and is not. Restart the elution. If the problem persists contact the developer.
30003
Pump should be stopped and is running. Restart the elution. If the problem persists contact the developer.
30004
Pump failed to start. Restart the elution. If the problem persists contact the developer.
Computer Resources
40001
Time has stalled during run. Contact the developer if problem persists.
40002
Error while backing up calibration file. Restart the system.
40003
Error while writing calibration file. Restart the system.
40004
Error while writing elution file – extension exceeds limit. Use a new patient number.
40005
Error while writing elution file. Restart the system.
40006
Error while loading INI file. Restart the system.
40007
Error while loading CAL file. Restart the system.
40008
Error while loading elution file. Restart the system.
40009
No calibration file found for today. Conduct calibration run before proceeding.
Positron Detector
50001
No counts read by positron detector. Check wiring to interface box.
50002
Threshold activity not reached. Check plumping for air bubbles and blockage and ensure that the generator
is properly connected.
50003
Threshold activity could not be found in calibration curve. Recalibration may be necessary.
Capintec Dose Calibrator
60001
Communication error with Capintec dose calibrator encountered during elution. Check connection between
computer and calibrator and restart the elution.
Maintenance
70001
Waste container full. Empty container and restart elution.
Software
90000
Unexpected procedure step encountered. Contact the developer.
90001
Unpredicted termination of Physical_Sequence. Contact the developer.
90002
Unexpected Run_Type value detected. Contact the developer.
90003
Real-time processes not responding on clean up. Contact the developer.
90004
Illegal desired pump state passed. Contact the developer.
Otherwise
Unknown error code reported. Contact the developer.
User Intervention
Error Code
Meaning
-1
Termination of elution and exit issued by operator
-2
Emergency stop button pressed
0
No error reported and no user intervention.
65
82
Rb Elution System Control
Ran Klein, University of Ottawa
The error flag may receive two identifiers relating to user intervention. Error flag
code -1 (negative one) relates to termination and exiting of the software by the operator. The
software will abort the elution, set all actuators to their safe mode, and display the exit
screen. Error flag code -2 (negative two) corresponds to the user pressing the emergency stop
button during an elution. The program will likewise terminate and set the actuators to their
safe modes, and finally present a yellow screen indicating the operator has terminated the
elution.
Pressure Errors
Pressure errors are included only for cases when the pressure rises above a threshold
(20 PSI, 138 kPa) for a prolonged period of time (over 3 seconds). High pressure is an
indication of a blockage or pinched line and could result in backwash through the pump head
or rupturing of the saline lines. When backwash occurs, the effective flow rate is lower than
expected, introducing error to the transport delay and control algorithms.
Each pressure measurement at the physical sequence level corresponds to an average
of 20 hardware readings over the previous one second. This mechanism is included to reduce
the effect of outliers, which could lead to false error detection. An appropriate message is
generated based on the state of the valves at the time of error detection. This message is
intended to guide the operator to the problematic lines.
Pump Communication and Operation Errors
Pump communication is over an RS-232 serial connection with a software
implemented polling algorithm (every 400 ms). Loss of communication to the pump is a
critical error and it is therefore important to set the valves to their safe modes, so that elution
to the patient does not continue if the pump fails to stop. The pump software version is also
verified on initialization as an additional safety measure.
As the pump is polled, its status is verified to ensure that it correlates with the
physical sequence stage. Timing windows of 3 seconds have been included to allow
sufficient time for communication and response. The pump is also capable of reporting
stalling of the pump head due to increased mechanical resistance.
66
82
Rb Elution System Control
Ran Klein, University of Ottawa
Computer Resources
Errors relating to the computer and software are abundant. File access errors are
checked and reported throughout the software. In addition time stamps are checked during
the real-time application. If time stamps are lost, the software can no longer reliably control
the real-time process. This issue has come up at the prototype system, where computer
resources were over consumed. This test is still included mostly as a diagnostic tool for the
developers.
Positron Detector Errors
Errors corresponding to the activity (positron) counter exist on two levels. The first
ensures hardware functionality by verifying that some counts (background activity) are
always being detected. Background activity is unavoidable and should result in some counts.
If the counter value is unchanged over 5 consecutive seconds, an error is reported. At a
higher level the software ensures that a threshold activity is reached within a given time
window. This tests that sufficient activity is eluted from the generator as expected.
Dose Calibrator Communication Errors
Although the dose calibrator is tested prior to every calibration or test run for proper
settings, it is also tested for communication errors during the elution. This is intended to
ensure that it is not unplugged or turned off during the calibration or test resulting in false
readings.
Maintenance
This test includes testing of the waste container overflow switch. If the waste
container is found to be full in the first 5 seconds of the elution, the elution is aborted with a
proper message. This is to avoid overflow of the waste leading to a spill inside the cart and
onto the printer, PC, UPS, or power cords on the lower shelf. If overflow is detected during
the elution, but after the first 5 seconds, a warning message is displayed at the end of the
elution and the next elution will not start until the waste container has been emptied.
However, the elution continuous without interruption to avoid aborting an elution needlessly
(a sufficiently large reserve is present in the waste container to complete the elution).
67
82
Rb Elution System Control
Ran Klein, University of Ottawa
Software Errors
As a final measure, error mechanisms are included to test the software itself. If an
invalid physical sequence stage or a run type is set, then an error code is set. If the real-time
sequence stops prematurely (before the exit stage of the physical sequence), this is an
indication that an error has been detected by the real-time kernel. Finally, if the pump
communication driver does not terminate and clear in time (within 1.5 s) this too is reported
as a software error. All these errors are intended for the developer for diagnostic purposes
and are indication of errors in the software itself.
Warnings
Warning messages (Figure 3-12b) are intended as important messages that should be
addressed immediately, but are not critical to the success of an elution. The list below
indicates the warnings that may be generated:
•
Total volume eluted through the generator is above (90%) the specification
volume for clinical use.
•
Calibration constant has varied more than 10% from the evolving average.
Outlier Highlighting
As the system is redundant in design, certain measurements can be tested by
comparing to expected values. One such measurement is the calibration constant for the
activity counter which is computed in each daily calibration run. The calibration is computed
based on the daily run, but is then compared to an evolving average to ensure variations less
than 10%. Similarly the activity eluted during calibration and flush runs is compared with the
activities of the previous day. These activities are corrected for
82
Sr decay which results in
lowered activity as the generator ages.
Patient elution and test runs are tested for discrepancy with the expected values of
eluted activity and eluted time. Although eluted activity is monitored as a stopping criteria
for all runs, variations can occur due to response time, overshoot, or if the total activity is not
reached. Variation between the requested time and actual elution time for constant-time and
constant-activity elutions is an indication of the accuracy of the flow rate prediction and
control algorithm respectively.
68
82
Rb Elution System Control
Ran Klein, University of Ottawa
If any of the above variations exceed 10% of the requested value, the variation
statistic is highlighted in red. This serves as an indication to the user that the elution did not
complete as expected and attention to the system may be necessary.
3.7
System Refinement
Dose Calibrator Spike Removal Algorithm
During experiments with the system, spikes of activity were recorded from the dose
calibrator as the activity rose above 500 MBq. By monitoring the dose calibrator display
during several elutions it was confirmed that the spikes arise from the dose calibrator itself
and not from the RbES or the communication protocol. As the activity in the dose calibrator
rises, it switches scales to avoid saturation. This scale transition is not smoothed, lasts
approximately 5 seconds, and is uncontrollable. Furthermore, the peaks can be in the form of
an increase or decrease in measured activity or combination of the two in the form of two
consecutive peaks. These peaks can vary by many orders of magnitude from the actual
measurement.
It was determined that during calibration runs, the spikes have a significant effect on
the calibration constant in some, but not all cases. To accommodate this artefact, an
algorithm was implemented to remove these spikes. A search window of 7 seconds was
passed over the entire curve to locate the ratio, rp[i], between the center activity and the
average of the two extreme readings. If the maximum ratio in the entire series is considered
significant by (13) where Tp is a threshold ratio, all the readings in the window are deleted
and interpolated from adjacent values. The process is repeated, until no more significant
peaks are found.
2 ⋅ Acal [i ]
max log(rp [i ] = max log(
(13)
> Tp
A
i
A
i
[
−
3
]
+
[
+
3
]
cal
cal
With Tp set to 0.1 good results were obtained. Almost all peaks were removed, while
{
}
the overall curve shape appeared to be unchanged. Figure 3-17 demonstrates the same
calibration results with and without the peak removal algorithm. The corresponding MSE
changed from 39,959 MBq2 to 1084 MBq2 and the calibration constant changed from
3.679·10-4 to 3.724·10-4 which is substantially closer to the average calibration constant
(3.777·10-4).
69
82
Rb Elution System Control
Ran Klein, University of Ottawa
Figure 3-17 – Calibration results with and without the dose calibrator peak removal algorithm.
3.8
Summary
The 82Rb elution system (RbES) was based on experience with the first generation
system and took into account decisions made when developing the prototype of the second
generation system. The requirements were identified and served as a guideline throughout
the development process. These requirements focused primarily on safety and reduced
exposure to both the operator of the system and to the patient. The complete framework
handled all aspects of the daily protocol, physical sequence, error detection, and user
interface.
All requirements were met with the exception of improved constant-activity control.
The design of the system ensured enough flexibility to continue development of the control
system at a later stage and with no significant change to the existing infrastructure. Both the
Hardware_Interface and Physical_Sequence models allowed for modification as necessary
while maintaining the software design. The development of the constant-activity control is
described in the following chapter.
70
82
Rb Elution System Control
Ran Klein, University of Ottawa
Chapter 4: Elution Profile Control
The primary motivation for developing the second generation
82
Rb elution system
(RbES) was to introduce the tracer to the patient at a fixed rate of activity (measured in
MBq/s) over a prescribed time period. When plotting the activity rate over time, in this
context referred to as an elution profile, a rectangular curve is desired. As with any control
system the goal is to achieve output behaviour as close as possible to a desired profile. In the
case of a constant output, one can compute a set-point (detector count rate) that corresponds
to an ideal output. One must then attempt to minimize the deviation between this set point
and actual output. Typically output error is kept to a minimum by including feedback
mechanisms which the control algorithm manipulates to control the actuators.
A generator bypass line was already included in the first generation
82
Rb elution
system to permit flushing of activity to the patient outlet at the end of an elution. The valve
in place was a two-way solenoid pinch valve that could either direct flow through the
generator or the bypass line at any given time. In addition, an activity counter was included
in the design to allow data collection and monitoring of the elution of activity. With these
elements in place the problem was reduced to developing a controller capable of directing
saline through the generator or its bypass line by actuating the generator valve in order to
achieve a constant rate of activity using feedback from the activity counter.
The control algorithm presented in the prototype system [18] used a simple threshold
comparison, which was only intended to demonstrate the feasibility of eluting at a constantactivity rate. If the measured activity rate was higher than the set point, saline flow would be
directed through the bypass line. If activity rate dropped below the set point, flow was
directed through the generator. The set point was calculated based on the desired activity rate
at the patient outlet and was corrected for transport delay as is shown in (14).
V
CO
1 ARe q −λ f
p= ⋅
⋅e
(14)
K TRe q
The set point, p, denotes the number of counts per second to be measured by the
activity counter to achieve the desired rate at the patient outlet. This rate is converted to raw
detector counts, using the calibration constant K. The rate at the patient outlet is computed
based on the requested activity, AReq, and the requested elution duration, TReq. The desired
71
82
Rb Elution System Control
Ran Klein, University of Ottawa
activity rate is corrected for the 82Rb decay during transport delay through the volume of the
lines from the activity counter to the patient outlet, VCO, at a constant flow rate, f.
The threshold comparison algorithm presented by Epstein et al. [18] was used as a
benchmark for evaluating changes in performance during this research and was therefore
maintained as an optional elution mode. As expected, the threshold comparison control
results in fluctuations of activity rate around the desired activity rate as is demonstrated in
Figure 4-1 for 50% relative activity elution over 30 s. The fluctuations typically had a 2-4 s
period depending on the flow rate and activity concentration from the generator. The relative
amplitude of the fluctuations was approximately 30-40% of the set point.
Activity Rate (MBq/s)
Instantaneous Activity Rate at Patient Outlet
6
RMS = 52.6257
4
2
0
10
15
20
25
30
35
Time (s)
40
45
50
55
Figure 4-1 - Elution of 50% bolus activity within 30 s using a simple threshold comparison algorithm as
described in [18]. The actual activity rate at the patient outlet (blue) since the beginning of the elution is
compared to the desired result (green).
This chapter details the work performed on the control algorithm with the aim of
improving the precision of the control algorithm while maintaining, or improving, other
performance characteristics. These characteristics include maximizing the range of relative
activities that can be eluted in order to maximize the useful life span of the generator. In
addition, the range of elution durations should be maximized to enable experimenting with
the optimal elution profile for accurate perfusion measurements. In general, the goal is to
increase the flexibility of elutions while improving the precision of the elution system with
the threshold comparison approach serving both as a starting point and a benchmark to which
changes can be compared.
72
82
Rb Elution System Control
4.1
Ran Klein, University of Ottawa
Threshold Comparison Algorithm with Auto-tuning Hysteresis Correction
(HC-TC)
Initial analysis of the threshold comparison algorithm revealed that elutions ran
longer than requested indicating a reduced effective activity rate. The prolonged elution time
was assumed to be a direct result of the hysteresis of the valve. Hysteresis refers to a system
behaving differently depending on the direction of change of an input parameter [36] usually
due to delayed response. In this case, the valve opening and closing latencies differ. The
hysteresis was accommodated by factoring the set point, p, using a hysteresis factor, H.
The hysteresis correction factor, H, describes the on/off switching characteristic of
the generator valve and is expected to change over time with material fatigue, tubing wear, or
other factors. Therefore parameter H needs to be tuned continuously. The auto-tuning
algorithm adjusts H depending on the difference between the actual and requested elution
time, T̂Elution and TReq respectively as is shown in (15). The time variation is factored with H
and an adaptation constant γH. With γH chosen small enough (0.01 in our case) the system is
ensured to not change significantly due to outliers but evolve slowly over time. Factoring of
H is not crucial in this case where H≈1, but is intended to ensure incremental changes, ∆H,
that are orders of magnitude less than H. To further reduce the influence of outliers, changes
to H that are larger than a tolerance interval (5%) are rejected with a proper warning to the
user.
∆H = γ H ⋅ H ⋅ (TˆElution − TRe q )
(15)
Parameter H was manually set to 1 and over the course of 20 random 30 s elutions
ranging from 10-70% relative activity, H evolved to a value of 1.09. Parameter H showed
little change over the next 30 elutions, however it was noticed to vary slightly with repeated
runs at extreme relative elutions (<20% or >60% relative activity). Variation of H at extreme
relative activities is likely due to other limitations in the system (insufficient activity in the
generator, varying activity concentrations from the generator, and others) making it difficult
to achieve the requested elution; the hysteresis mechanism attempts to compensate for these
limitations.
Although this hysteresis factor resulted in smaller accuracy error numbers, the t-test
(p-values in Table 4-1) indicates that these are not statistically different - partly due to the
large standard deviation of elution time errors.
73
82
Rb Elution System Control
Ran Klein, University of Ottawa
Table 4-1 - Comparison of elution time accuracy using the threshold comparison algorithm with (HCTC) and without hysteresis correction.
Relative activity
[n=10]
10%
30%
50%
70%
Flow Rate
(ml/min)
5
11.67
18.33
25
Time Accuracy (%)
No hysteresis correction
Hysteresis correction (HC-TC)
2.3±4.2 %
-1.0±2.3
-1.7±2.3 %
-1.7±2.3
3.3±4.7 %
3.0±5.1
11.0±4.5 %
9.0±4.7
p-value
0.062
1
0.88
0.37
Although the hysteresis compensation may slightly improve the elution time
precision, it does not reduce the activity rate fluctuations. To overcome the fluctuations a
completely different approach was investigated.
4.2
Variable Flow Control
To overcome the fluctuations inherent in the simple threshold comparison algorithm,
the on/off valve had to be modified to a variable valve. As explained in the previous chapter
the use of a variable valve was abandoned following earlier studies due to complexity, poor
reliability, and mostly due to slow response characteristics. Instead, the solenoid control
signal could be modified to simulate a variable valve in two ways.
Cycling Valve Control
An on/off valve that periodically cycles between the two states can be used to
simulate an analogue valve. The valve is set to open and close at a constant frequency, but
the time that it is open is varied by changing the width of the control pulse. Pulse Width
Modulation (PWM) can be regarded as varying the average time that that valve is open to the
generator path and therefore varying the ratio of flow between the two paths (Figure 4-2). In
effect, setting the pulse width varies the duty-cycle of the control signal in the range of 0100% where 100% corresponds to a full saline flow through the generator and 0%
corresponds to full flow through the bypass line.
Figure 4-2 - Pulse-width-modulation
control of a solenoid valve to
simulate a variable pinch valve. Flow
through the generator increases as
the duty-cycle is increased.
Transient State Control
Theoretically, by further increasing the frequency of the valve control, the valve can
be forced to “hover” in a transient position [37]. The valve behaves as a low pass filter of the
74
82
Rb Elution System Control
Ran Klein, University of Ottawa
control signal and the actual magnetic field generated by the solenoid is less than the full
operating field strength. Precise tuning of the duty-cycle can force the solenoid and spring
applied forces to cancel out with the resulting plunger position in a transient state. As with
the cycling valve, varying the duty-cycle controls the valve position. The exact signal
frequency is not critical, so long as it is higher than the valve’s natural frequency and low
enough that it can be generated by the driving circuitry.
Implementation of the Variable Flow Control
Both approaches are identical in implementation and vary only in PWM frequency.
While transient state actually implements a variable valve, the cycling valve only simulates
variable control through time integration. Therefore, the transient state is advantageous if it
can be implemented successfully.
Implementation of the PWM valve was achieved using one of two general purpose
counter/timers (GPCTR) included in the DAQ. The GPCTR can be operated in several
modes to serve different purposes. One such mode is an externally triggered counter as was
used for the activity counter. Another mode is a continuous rectangular pulse generator. The
counter is triggered by an internal 100 KHz clock while two registers are set to indicate the
number of counts generating a high output and the number of counts generating a low input.
The output of the counter was routed to the generator valve buffer (Crydom solid-state relay)
which generates the current needed to actuate the valve.
To set the registers the counter must be stopped, initialized, and restarted using a
dynamic-link library (dll) provided by National Instruments. A Matlab-Simulink driver was
written that accepts the cycling frequency as a parameter and the duty-cycle as a continuous
input and sets the registers whenever the duty-cycle is updated. The counter register values
are computed using (16) and (17) where υclk represents the counter clock frequency (100
KHz), υvalve is the valve cycling frequency and Π is the duty-cycle of the valve’s actuating
signal.
nHigh = υclk/υvalve·Π
(16)
nLow = υclk/υvalve·(1-Π)
(17)
75
82
Rb Elution System Control
Ran Klein, University of Ottawa
Valve Response Measurements
In order to accurately control the effective flow ratio, the valve response had to be
measured for various cycling frequencies. It is desirable that the cycling be fast enough to
produce undetectable fluctuations in the activity leading to smooth activity curves. In
addition, the valve flow ratio response to duty-cycle should be controllable throughout the
entire range (0-100% valve flow ratio). To test the transient response a frequency of 100 Hz
was used, while 2, 5, and 15Hz frequencies were used to measure the response in the valve
cycling range.
Activity curves at various generator valve duty-cycles (υvalve = 15 Hz)
18
1
0.995
0.99
0.9885
0.988
0.9875
0.987
0.9865
0.986
0.985
0.98
0.95
16
14
Activity (MBq)
12
10
8
6
4
2
0
0
20
40
60
Time (s)
80
100
120
Figure 4-3 - Activity vs. time curves as measured with the generator valve cycling at 15Hz at various
generator valve duty-cycles. The rise time was estimated as the interval between initial rise and peak
activity.
A series of calibration elutions was conducted for each cycling frequency with the
duty-cycle, Π, varied to sample the dynamic range of the response (as shown in Figure 4-3
for cycling at 15 Hz). The calibration runs were identical to a regular calibration run (15
ml/min saline flow rate), except that the generator valve was set to cycle at a given frequency
and duty-cycle rather than remaining fully opened. In addition, the elution was performed
over 120 s instead of the standard 60 s so as to measure the longer rise times. The rise time
for each elution was measured as the interval between initial rise and peak activity. The rise
76
82
Rb Elution System Control
Ran Klein, University of Ottawa
time of a regular calibration run (duty-cycle set to 100%) was used as the reference to which
all other rise times were compared. The ratio of rise time for a given duty-cycle and the
reference rise time indicates the effective ratio of saline that flows through the generator,
referred to as valve flow ratio (r). The valve flow ratio vs. duty-cycle curves for the set of
cycling frequencies were plotted in Figure 4-4. The inverse of these curves allow one to
determine the duty-cycle needed to achieve an effective flow ratio.
Comparison of Valve Response to υvalve
Valve Flow
Ratio (r)1
0.9
2Hz
0.8
5 Hz
0.7
15Hz
0.6
100Hz
0.5
0.4
0.3
0.2
0.1
0
0
0.2
0.4
0.6
0.8
1
Duty-Cycle (Π)
Figure 4-4 – Valve response curves at υvalve = 2, 5, 15, and 100 Hz indicate the valve flow ratio, r, resulting
from PWM duty-cycle, Π.
As the cycling frequency is increased, the valve response becomes less linear and
more similar to a step function. In the case of 100Hz cycling frequency the flow ratio
changed from fully opened to fully close in a very small duty-cycle interval (less than 1%).
Although in [37] Imaizumi demonstrates a linear response of a solenoid valve using a
transient state control, these results could not be reproduced. It is possible that the
discrepancy in results is due to the valve’s mechanics. In our application the return spring
applies a large force so as to pinch the tubing when no current is fed through the solenoid.
Imaizumi used a single pincher valve, and therefore had no need for such a powerful return
spring. Due to this undesired response, the transient control approach was not explored
77
82
Rb Elution System Control
Ran Klein, University of Ottawa
further, leaving the cycling valve approach as the choice alternative to emulate a variable
flow valve.
The PWM response at 2 Hz seems to be the best choice of the set demonstrated in
Figure 4-4 since it presents the mildest slope leading to the largest dynamic range of dutycycles; thus small variation in duty-cycle have less effect on the effective valve flow ratio.
However, examination of the activity vs. time curves at approximately 50% valve flow ratio
(Figure 4-5) revealed that the low cycling frequency introduces substantial fluctuations in
activity. These fluctuations are greatly reduced with the cycling frequency increased to 5 Hz
while the response remains manageable. At 15 Hz cycling frequency the response is a very
steep slope throughout the entire dynamic range; meaning that small errors in duty-cycle, Π,
will result in very large errors in the valve flow ratio, r.
Activity curves at various valve cycling frequencies (Valve flow ratio≈ 50%)
1.2
15 Hz
5 Hz
2 Hz
Normalized Activity
1
0.8
0.6
0.4
0.2
0
0
20
40
60
Time (s)
80
100
120
Figure 4-5 – Elutions at valve flow ratio ≈ 50% produced by cycling the generator valve at 2, 5, and 15
Hz and corresponding Π from Figure 4-4. The activity vs. time measurements with valve cycling
frequency set to 2 Hz reveal that the low cycling frequency introduces measurable fluctuations in
activity.
With all the above issues considered, it was determined that a cycling frequency of 5
Hz provided a balance between smooth activity vs. time curves and a manageable valve flow
ratio response curve. Over the flow ratio range of 0-30% the slope is mildest making it the
most favourable working range while the 30-100% range should be avoided due to the sharp
response slope; however, this is not always possible if one wants to elute high relative
activities.
78
82
Rb Elution System Control
Ran Klein, University of Ottawa
Modeling of Valve Response
The valve response is important for achieving good flow ratio control. Although the
collected data demonstrated in Figure 4-4 can be used to calculate the duty-cycle needed to
achieve the desired valve flow ratio, this would entail measuring of the exact valve response
of each system. In addition, recalibration of the response due to changing dynamics of the
valves would involve a long and complicated process. Developing a model of the response
with few free parameters, would allow tuning of the valve response more easily. For flow
control we show the response graph (Figure 4-4) with swapped axes (Figure 4-6), as we wish
to set the duty-cycle to achieve a desired valve flow ratio.
Valve Response (υvalve = 5 Hz)
Duty-Cycle
(П)
1
0.99
0.98
0.97
Measured
0.96
Model
0.95
0.94
0.93
0.2
0.4
0.6
0.8
1
Valve Flow Ratio (r)
Figure 4-6 – Valve response (υvalve=5 Hz) with the swapped axes, allows determination of the duty-cycle
needed to achieve a desired valve flow ratio. Measured response (solid) and model (dashed) fitted in the
useful range (20-100%) with model parameters Πmax=0.997, Πmin=0, L=0.004, and G=16.
A few models were considered, leading to a combination sigmoid and linear function (18). The
sigmoid accounts for the response in the lower flow ratio range (0-50%), while a line models the mild slope in
the higher range (50-100%). Equation (18) converts the desired valve flow ratio, r, to valve duty-cycle, Π. The
79
82
Rb Elution System Control
Ran Klein, University of Ottawa
parameters F, G, O and L, can be tuned to fit the measured response. Parameter G scales the sigmoid to match
the lower ratio range, while the slope L accounts for the slope of the higher ratio range. Parameters F and O can
be computed through (19) and (20) respectively based on the maximum and minimum effective duty-cycles
(Πmax and Πmin). The consideration for using Πmax and Πmin is to use measures that have physically significant
meaning – upper and lower saturation duty-cycles respectively.
F
+ O + L ⋅ r (t )
1 + e −G⋅r (t )
Π −Π −L
F = max−G min
e − 0.5
O = Π min − F / 2
Π (t ) =
(18)
(19)
(20)
The measured data reveals that at duty-cycles higher than Πmax=0.997 the valve is
effectively fully open to flow through the generator (upper saturation point). Similarly, at
duty-cycles below Πmin=0.25 the valve is effectively closed (lower saturation point). A
manual model fit of the curve was estimated with Πmax=0.997, Πmin=0, L=0.004, and G=16
and plotted with dashed lines in Figure 4-6. The useful range of valve flow ratios (20-100%)
is well represented by the sigmoid-linear model where the sigmoid accounts for the “knee”
shape of the response curve and the line models the higher range (50-100%). The extremely
low response range (r<20%) is not used and was ignored during the fit.
Modification of the free parameters of the model allows improving the fit in one
region, potentially at the expense of other regions. Further effort on manually improving the
fit proved to be difficult. It was expected that an algorithm could be developed to optimize
the fit based on the actual valve flow ratio range used. Although great care was taken to
estimate the effective flow ratio data in Figure 4-6, it is inevitable that manual measurements
have some error. In addition, the valve response may change over time due to material
fatigue, wear, and other unknown factors. An automated model parameter tuning process
using measures from many elutions would be used to estimate the model parameters.
However, before this could be achieved, a control algorithm based on this valve response
model was developed.
PWM Valve Life Span
Cycling of the valve between states may accelerate the wearing of the mechanical
mechanism, thus potentially shortening its life span. The valve model chosen for the RbES
80
82
Rb Elution System Control
Ran Klein, University of Ottawa
(Asco 37312830) does not have any reliability information published by the vendor.
However, since elutions are short (~30 s) and the time between elutions is at least ten
minutes, over heating is not a significant risk. A routine work day includes as many as
twelve elutions, translating to 1800 cycles if the valve is cycled at 5 Hz. Since a typical valve
reliability measure is at the very least 106 valve cycles, a life span of several years can be
expected in the worst case. Asco is a reputable actuator manufacturer recognized as meeting
the highest quality standards. However, only long term experience will clarify this reliability
issue.
4.3
Variable Flow Control Algorithms
Even with an ideal actuator in place, an appropriate controller must be designed. The
goal of the controller is to monitor the progress of the process and make proper adjustments
to the actuator in order to reduce the output error. Development of a controller must take into
account the nature of the system being controlled, the desired results, and the limitations of
the design. Several key points to be considered during the development of the RbES
controller are listed below.
1. Typical elution times are short (30-60 seconds), leaving little time for
conventional feedback controls to stabilize.
2. Feedback to the system has a relatively long inherited delay due to the time
required for activity to flow from the generator to the activity counter and the
need to accumulate counts.
3. The feedback delay is not constant due to variation in flow rates.
4. The activity concentration in the saline flowing from the generator varies as
the elution progresses, but the activity concentration vs. eluted volume
relationship is constant [18].
5. Most of the activity from the generator is contained in the initial bolus phase.
One would like to make use of this activity (rather then pass it to the waste) to
achieve high relative activity elutions.
81
82
Rb Elution System Control
Ran Klein, University of Ottawa
These considerations served as guidelines throughout the control system development
process. The intermediate development steps are discussed in order to clarify the difficulties
involved with this control problem and to justify decisions.
PID Control
Conventional approaches typically use proportional-integral-differential (PID)
controllers driven by feedback measurements to drive the actuators so as to minimize the
output error. The dynamics of the controller are intended to compensate for the dynamics of
the mechanical system (plant) in order to achieve a more favourable overall system response.
PID controllers are well established and serve as a default approach in many applications.
Three scalars (P, I, and D in (21)) must be tuned to optimize the control signal, C, to the
plant response. In theoretical models, controller optimization can be achieved through statespace modeling and optimal control calculation techniques. In practical situations, where
modeling of the plant is either too difficult or too time consuming, the controller may be
tuned through trial and error.
t
dE (t )
C = P ⋅ E (t ) + I ∫ E (τ )dτ + D
123
dt
0
Proportional
1
424
3
14
2
4
3
Differential
Integral
(21)
The three parameters of a PID controller correspond to factors of the error, its
integral, and its proportional differential to produce a control signal to the actuator (Figure
4-7). The output error is the difference between the desired plant output (set point) and the
actual output. Properly tuned, the controller will affect the plant actuators to reduce the
output error over time. The proportional factor serves to quickly adjust the actuator based on
current errors. If the proportional gain is too small, the error will decrease slowly, however,
if it is too large overshoots can occur, leading to oscillations around the set point. The
integral component serves to reduce steady state errors and speed up the reduction of error.
The derivative component serves to reduce overshoot due to over correction by the
controller. Refer to Figure 4-8 for an example of these affects.
82
82
Rb Elution System Control
Ran Klein, University of Ottawa
Controller
P
Input
(Desired
Output)
+
-
Output
Error
∫ dt
I
d
dt
D
+
Control
Signal
Output
Plant
Feedback
Figure 4-7 - Closed loop controlled system using a PID controller.
Output
t
Overshoot
C = PE (t ) + I ∫ E (τ )dτ
0
t
C = PE (t ) + D
Desired
Output
(set point)
dE (t )
+ I ∫ E (τ )dτ
dt
0
C = PE (t )
Steady state error
Time
Figure 4-8 - Affects of PID controller parameters on system response.
In the case of the RbES, building of a state space model is complicated by the
changing feedback delay for different flow rates. Even if this were accomplished a linear PID
type controller cannot model (and therefore correct for) a pure feedback delay [38,39,40]. In
addition, the activity curve continuously changes making a pure feedback control system
inadequate, as it will always lag in response. These assumptions were confirmed through a
series of simulations of a PID feedback loop controlling the flow ratio (ideal valve response).
The transport volume from the valve to the activity counter was set to 0.13 ml and the
controller rate was set to 20 Hz, which are characteristic values. The PID parameters were
tuned through trial and error. Parameter D was always set to zero (PI controller) since it
resulted in amplified activity fluctuations. Three sample results are included in Figure 4-9.
83
Rb Elution System Control
Ran Klein, University of Ottawa
Constant Activity Elution with PID Control (70% R. Act. over 30 s)
0.04
P=-0.2
I=-0.004
D=0
0.03
0.02
0.01
0
0
5
10
15
20
25
30
35
Time (s)
Constant Activity Elution with PID Control (30% R. Act. over 30 s)
40
0.02
0.015
P=-0.17143
I=-0.0017143
0.01
D=0
0.005
0
0
Normalized Activity Rate (%)
Normalized Activity Rate (%)
Normalized Activity Rate (%)
82
6
5
10
15
20
25
30
35
40
Time (s)
-3
x 10Constant Activity Elution with PID Control (10% R. Act. over 30 s)
45
P=-0.005
I=-0.0007
D=0
4
2
0
0
10
20
30
Time (s)
40
50
60
Figure 4-9 - Sample simulation results of a PID controlled elution with an activity transport delay from
the valve to the activity counter (0.3 ml) and a high controller refresh rate (20 Hz).
Even in the best case scenario, the simulations demonstrate some shortcomings of
using a PID controller. The activity curves vary throughout the elution due to lagging behind
the change in activity concentration. This is especially noticeable in the 10% relative activity
elution (bottom) where delay is longest due to the slow saline flow rate. In all the cases
overshoot is noticeable in the first few seconds of the elution as the activity concentration
changes fastest in the early bolus volume. Testing of this implementation on the system
revealed far worse results probably due to poor modeling of the valve response at the time,
slower controller refresh rates, and random noise in the feedback.
84
82
Rb Elution System Control
Ran Klein, University of Ottawa
Forgetful PID Controller
One of the drawbacks of a conventional PID is that noise in the error measurements
can result in large changes in the control signal. Since noise is characterized by fast changes
in measurements it is mostly amplified by the differential component and the proportional
component. It is common to set the differential gain to zero in order to reduce the effect of
noise, but the proportional component cannot be removed as the resulting controller will
become very slow.
The conventional PID controller was modified to create a “forgetful PID” controller
by converting the proportional gain into a forgetful integral with a forgetting factor φ as is
shown in (22). The proportional component depends on previous errors whose weights
gradually decreased over time. With φ set to 0.995, the current error reading, E[n], has a
weight of 1 while the previous reading, E[n-1], has a weight of 0.995. But the weights of
earlier readings, say E[n-100] (corresponding to 5 s earlier due to refresh rate of 20 Hz) have
a significantly reduced weight (0.606). Most of the error correction is based on recent history
which strikes a balance between the controller’s speed of response to change in error and
immunity to noise. The model of the forgetful PID controller is shown in Figure 4-10.
S[n] = E + ϕ ⋅ S[n − 1]
Corrective
Controller
S
+
P
1
s
φ
Error
(22)
∫ dt
I
d
dt
D
+
Correction
Figure 4-10 - Modified PID correction implementing a “forgetful” proportional component.
Predictive Control
The critical disadvantage of feedback control is that the controller response is always
delayed. In this case the delay is relatively long compared to the total elution time. This
delay combined with the varying activity concentration from the generator makes a simple
feedback controller inadequate [39,40]. To avoid delayed response, one would like to predict
the activity concentration at point M (Figure 3-3) where the bypass and generator flows
85
82
Rb Elution System Control
Ran Klein, University of Ottawa
merge. One option is measuring the activity in the generator line just prior to the merge using
an additional activity counter, however this has the drawback of increased cost and
complexity to the system and the need to know the exact flow ratio set by the generator
valve.
An alternative approach capitalizes on the fact that the activity concentration is
almost entirely dependent on the volume eluted from the generator. If one knows the exact
volume that was eluted through the generator and the time delay to the merging point, M,
one can estimate the activity concentration just upstream to the merge, ĈM-(t). The main
advantage of this alternative is that no hardware modifications, such as addition of another
positron detector, are required.
The predicted valve ratio, r(t), can be computed based on the predicted activity
concentration just upstream from the merger, CM-, and the set point, A& C (23). Since the
prediction is for point M and the set point is calculated for point C, one must account for the
decay during transport, DMC. The activity concentration CM- is converted from activity
concentration (MBq/ml) to activity rate (MBq/s) by factoring the flow (ml/s).
r (t ) =
A& C
DMC ⋅ f ⋅ CM − (t )
(23)
The activity rate at the activity counter, Aˆ& C , is equal (after a transport delay TMC) to
the activity rate at the merger, Aˆ& M , decayed during transport by DMC (24). The rate of activity
at the merger, Aˆ& M , is a product of the actual activity concentration, ĈM-, and the flow rate
through the generator path, f· r̂(t) .
(24)
A&ˆ C (t + TMC ) = DMC ⋅ A&ˆ M (t ) = DMC ⋅ f ⋅ Cˆ M − (t ) ⋅ rˆ(t )
With ideal valve response the actual flow ratio is equal to the predicted flow ratio,
r̂(t) = r(t). Similarly, if the activity concentration just upstream from the merger is
successfully predicted then ĈM- = CM-. Substituting (23) into (24) reveals that the activity rate
at the counter, A&ˆ C , is the desired activity rate A& C and perfect control is obtained as shown in
(25).
Aˆ& C (t + TMC ) = DMC ⋅ f ⋅ CM − (t ) ⋅ r (t ) = A& C
86
(25)
82
Rb Elution System Control
Ran Klein, University of Ottawa
The prediction algorithm estimates ĈM- based on the activity vs. volume curve
obtained during the calibration run of the same day, Cc(v). The predicted activity
concentration at the merger, CM-, is interpolated from CC(v) based on the volume that was
eluted through the generator since the beginning of the elution as shown in (26). The eluted
volume is obtained by integrating the flow ratio, r(t) from the beginning of the elution and
multiplying by the saline flow rate, f. The integrated volume is corrected through a volume
shift (VMC) since the measurements during calibration relate to the counter position rather
than that of the merge. The activity concentration, ĈM-, is estimated as the mean activity
concentration over the next sample period, S, using (26).
t
DGM (t )
ˆ
C
⋅
C f ∫ r (τ ) dτ − VMC + VCorr
cal
DGC
τ =0
C M − (t ) =
(26)
During the transport from the generator to the merger, significant time can pass if low
flow ratios are used. The transport time from the generator to the merging stopcock, TGM(t),
is calculated by integrating the flow through the generator over VGM using (27). The
transport time, TGM(t), is used to estimate the 82Rb decay between the generator and merger,
DGM(t) in (26) and (27). However, the decay from the generator to the activity counter during
the calibration run,
cal
DGC must be backwards corrected, since the generator outlet is the
point of reference for the
82
Rb decay. To clarify the concept, one must remember that the
activity in the line changes as transport time passes, therefore both the time shift and its
corresponding decay must be corrected to any given reference point (the estimated generator
outlet).
DGM (t ) = e − λTGM (t ) where VGM = f ⋅
t
∫ r (τ ) ⋅ dτ
(27)
τ =t −TGM ( t )
The volume shift, V̂Corr , included in (26) improves alignment of the prediction activity
curve with the actual elution curve. This adjustment is crucial for compensating for delays in
pump start response time and any other introduced delays. During the beginning of the
elution the valve is fully opened which allows reproducing the initial rise of the activity vs.
volume curve measured during calibration. When significant activity, but less than the set
point activity, is measured, the activities vs. volume curves are aligned through a volume
shift to minimize the MSE. The optimized volume shift, V̂Corr , serves to fine tune the activity
prediction in (26).
87
82
Rb Elution System Control
Ran Klein, University of Ottawa
Predictive Corrective Control
For accurate prediction, two conditions must be satisfied:
1. The activity concentration just prior to the merger, ĈM,- must be accurately
predicted.
2. The valve response must be accurately modeled.
In practice, perfect prediction is impossible due to measurement errors and imperfect
modeling. A corrective mechanism should be integrated to complement the prediction by
driving the output error to zero. A PID loop, or variation of it, can be used for this correction.
While the predictive algorithm accommodates fast changes in the activity concentration
eluted from the generator, the corrective mechanism serves to refine the valve control to
reduce long term errors. The corrective mechanism must compensate for all the errors and
inaccuracies such as activity concentration prediction errors and imperfect actuation of the
generator valve.
Predicted
Activity Rate
Prediction
Algorithm
Activity Rate
Set Point
Measured
Activity Rate
Valve
Response
Correction
+
Valve PWM
Duty-Cycle
Correction
Scaling
Corrective
Algorithm
Figure 4-11 - Block diagram of the predictive-corrective control of a PWM valve.
The corrective mechanism included in the RbES is a modified PID loop with a
forgetful proportional component as shown in Figure 4-10. In addition, the correction must
be scaled to account for non-linear sensitivity of the valve in the predicted duty-cycle range
(Figure 4-11). A small change in duty-cycle in the high range will result in a much larger
change in flow ratio than in the lower range of duty-cycles. The scaling is performed by
multiplying the correction signal from the modified PID by the differential of the valve
response at the desired flow ratio (dΠ(r)/dr). As a result, when the valve is supposed to be
wide open, the scaling is small, corresponding to the high sensitivity of the valve in this
range. It is important to include this scaling since without it the correction will become over
amplified as the valve is opened over the course of the elution.
88
82
Rb Elution System Control
Ran Klein, University of Ottawa
Initial Error Removal
Simulations of constant-activity elutions with slight shifts in the predicted volume
eluted through the generator (Figure 4-12) revealed that the first few seconds of the elution
are most susceptible to prediction errors. In cases where all the activity from the generator
must be eluted to reach the requested dose, these initial errors must be tolerated. However, in
cases where a much lower dose is requested, the initial errors can be avoided by diverting the
elution to the waste container. The initial error removal mechanism (IERM) waits for the
activity rate to reach a threshold level (90% of the desired activity rate) then begins a time
delay of Tierm. Once Tierm has elapsed, the elution is routed to the patient rather than the
waste.
Constant Activity Elution with Volume Prediction Shift of -0.1 ml
Activity Rate
2
1.5
1
0.5
0
0
Activity Rate
2
10
Constant Activity Elution with No Volume Prediction Shift
15
Volume (ml)
1.5
1
0.5
0
0
2
Activity Rate
5
5
10
Constant Activity Elution with Volume Prediction Shift of 0.1 ml
15
Volume (ml)
1.5
1
0.5
0
0
5
10
15
Volume (ml)
Figure 4-12 - Simulation of perfect control with erroneous activity concentration prediction due to a
slight volume shift (±0.1 ml). If the predicted eluted volume is less than the actual eluted volume (top) a
peak of activity is expected. A slow rise is expected if the predicted volume is too large (bottom). The
middle curve shows perfect alignment. Truncating the first few seconds of an elution should remove the
largest prediction error regions.
Tierm is calculated depending on the relative activity of the elution. For relative
activities less than 10% the delay is set to 10 s. For relative activities above 70% no delay is
89
82
Rb Elution System Control
Ran Klein, University of Ottawa
used. Intermediate relative activities are assigned a delay through linear interpolation
between these limits. The end result is a truncation of initial errors to improve the elution
profile significantly, but without affecting the range of activities that can be eluted from the
generator.
Setting the Saline Flow Rate
In order to minimize sensitivity to flow ratio error, one would like to use a large
range of the valve flow ratios during any given elution. In addition one would like to avoid
using extreme flow ratios as the valve may saturate. Finally, the lower range of flow ratios is
less sensitive to control error and is therefore the preferred range to use. Since the effective
activity rate is a product of activity concentration, valve flow ratio, and saline flow rate, the
range of flow ratios that will be used during an elution is directly influenced by the saline
flow rate. The flow rate must be set at the beginning of an elution based on the desired
activity rate in relation to the generator activity, referred to as relative activity rate (%/min).
When conducting a low relative activity elution, a low flow rate is desired so that the
flow ratios used during the elution are not near the lower saturation point. On the other hand,
the flow rate should not be too low as to avoid long transport delay, and 82Rb decay. When
conducting high relative activity elutions, higher flow rates are desirable so that the generator
bolus activity is eluted and minimal 82Rb decay occurs en route the patient.
The reproducible flow rates in the
82
Rb elution system are in the range of 5-
25ml/min. At the lower limit, 5 ml/min flow rates were used for 20%/min relative activity
rate elutions (corresponding to 10% relative activity over 30 s). At the upper limit, 25ml/min
flow rate is used for 140%/min relative activity rate elutions (corresponding to 70% relative
activity over 30 s). Intermediate flow rates are obtained by linear interpolation between these
limits.
The flow rate is computed prior to starting of the elution using (28) and is maintained
until all the activity has been eluted and flushed from the lines. AReq corresponds to the
desired activity, while TReq is the requested duration. The relative activity is computed using
AReq factored by the calibration activity, ACal, while the time ratio 60/TReq converts the
measure into relative activity rate.
90
82
Rb Elution System Control
Ran Klein, University of Ottawa
25 − 5 ARe q 60
f =
⋅
⋅
+ 1.667
1.4 − 0.2 ACal TRe q
(28)
Automatic Parameter Tuning
Accurate prediction of activity concentration depends on accurate modeling of the
system and accurate valve flow ratio. The prediction algorithm makes the assumption that
the valve response is accurately modeled and that the desired flow ratio is always achieved.
Since we have confidence in the modeling of the system, we must focus on fulfilling this
assumption through good modeling of the valve response.
The valve response model parameters that were estimated manually to achieve a good
fit (Figure 4-6) do not necessarily ensure the best elution performance in practice. In
addition, the valve response may change over time. For these reasons one would like a selftuning algorithm that adjusts the model parameters in order to decrease the error in elution
profiles. These parameters should be adjusted through small increments in order to reduce
the effects of problematic elutions on the parameters. In addition, small adjustments allow
convergence to nominal values without exaggerated overshooting. On the other hand if the
adjustments are too small convergence may be too slow.
The predictive corrective control of the pulse width modulated valve (PCC-PWM)
was designed so that the only free parameters are in the valve response model. These
parameters, listed in Table 4-2, can be tuned based on the activity rate errors measured over
the course of a constant-activity elution. The algorithm for tuning these variables is detailed
below.
91
82
Rb Elution System Control
Ran Klein, University of Ottawa
Table 4-2 - Parameters used by the prediction algorithm.
Parameter
Sigmoid scaling
(G)
Linear slope
(L)
Valve upper bound
(Πmax)
Valve lower bound
(Πmin)
Manually
tuned value
16
Converged
value
26.5
0.004
0.0067
0.997
0.9975
0
0
Affects
Sharpening of the “knee” in the response
- Response at low valve flow ratios (r<rt)
Slope of linear range
- Response at high valve flow ratios (rt<r)
Threshold when valve response is equivalent to
full open
- If too large peaks will occur at beginning and
end of elution profile
Overall error trend
- Activity too high (elution too short) – bound
needs to be lowered
- Activity too low (elution too long) – bound
needs to be raised
Sigmoid Scaling (G)
The sigmoid component of the valve response model (18) was added to account for
the increased slope in the low flow ratio range. The input to the sigmoid is scaled using
parameter G which can be tuned to control the slope of the response in the lower range.
Since the sigmoid function has an asymptote to 1 as the input tends to infinity, the higher
range of flow ratios is almost unaffected by this parameter.
To tune parameter G the activity rate errors corresponding to valve position in the
lower flow rate region (0<r<rt) are selected and a linear fit to the error vs. flow ratio is
conducted as shown in Figure 4-13 and Figure 4-14 by a solid line. The slope of this line is
represented by SL in (29) which computes the change to the G parameter, ∆G. If the slope is
negative for example, the activity rate error decreases as the valve is opened. This is
corrected for by decreasing the scaling on the sigmoid, as a result the duty-cycle on the lower
region of flow ratio will be decreased. The goal is to have no change in activity rate error as
the flow ratio is modified.
∆G = γS·G·SL
(29)
The upper limit of the lower flow ratio range, rt, is computed as the flow ratio at
which the slope of the valve response model (Figure 4-6) is twice the linear slope,
dΠ/dr=2·L. At flow ratios above this point, the significance of parameter G is diminished,
while at the range below this point the sigmoid shape is dominant.
92
Rb Elution System Control
Duty-Cycle (Π)
82
Ran Klein, University of Ottawa
Valve Response
1.02
1
r
t
0.98
0.96
0.25
0.3
0.35
0.4
0.45
0.5
0.55
0.6
0.65
0.6
0.65
Variation in Error v.s. Valve Flow Ratio
Error (%)
20
SH
0
-20
SL
-40
-60
0.25
0.3
0.35
0.4
0.45
0.5
0.55
Desired Flow Ratio (r)
Duty-Cycle (Π)
Figure 4-13 – Analyzed errors of a constant-activity elution with flow ratios spanning a large range. The
slope of the error points relating to the valve flow ratio lower range (r<rt), SL is used to adjust parameter
G, while the slope of the error points relating to the higher valve flow ration range (rt<r<0.95), SH, is used
to adjust parameter L.
Valve Response
1
r
0.95
0.9
0.2
0.25
0.3
0.35
0.4
t
0.45
0.5
0.45
0.5
Error (%)
Variation in Error v.s. Valve Flow Ratio
20
SL
0
-20
EL
-40
0.2
0.25
0.3
0.35
0.4
Desired Flow Ratio (r)
Figure 4-14 – Analyzed errors of a constant-activity elution with flow ratios in the lower range.
Parameter G is tuned based on SL in the same manner as elutions that span into the higher valve flow
ratio range. The mean error across all points associated with r<rt, EL, is used to adjust parameter L.
93
82
Rb Elution System Control
Ran Klein, University of Ottawa
Linear Slope (L)
The linear slope is corrected in one of two ways based on the available data. If
sufficient error measurements are available for the region (rt<r<95%) then a linear fit is
produced and its slope, SH, serves as a correcting factor (dashed line in Figure 4-13), referred
to as the slope rule. However, if not enough data points are present, as in the case of Figure
4-14, the mean error in the lower range, EL, is used as the correcting factor, referred to as the
mean error rule. This combination of corrections is expressed in (30). In the later case, the
linear slope is adjusted so that the average error in the lower range (0<r<rt) is driven to zero.
This logic is important to include, otherwise low relative activity elutions may evolve to a
state where the error in the lower range is uniform across all valve flow ration (due to
adjustment of G), but this error may not be zero.
More than 4 data points, − γ L ⋅ L ⋅ S Η
∆L =
γ L ⋅ L⋅ΕL
Otherwise,
(30)
Valve Upper Bound (Πmax)
The valve upper bound, Πmax, is defined as the duty-cycle at which the valve response
saturates in an open position. For Π≥Πmax the effective flow ratio, r, is 100% (i.e. complete
flow through the generator). Adjusting this parameter can only be achieved if relevant error
data are measured during the elution. The predicted activity concentration from the generator
near the end of the elution must be insufficient to achieve the desired activity rate. Since the
predicted activity rate is less than the set-point the valve flow ratio will be set to 100%. If the
measured activity rate is less than the set-point the corrective algorithm will attempt to
further increase the duty-cycle beyond Πmax up to duty-cycle Π=1. If Πmax is set too low, the
activity rate may increase while the correction algorithm increases the duty-cycle. Otherwise,
further correction will not result in an increased activity rate. The following algorithm is used
to adjust Πmax:
•
Keep all the data past the minimum flow ratio – avoid confusion with early
part of elution.
•
Keep all the data where predicted flow ratio was one – keep only the saturated
region at the end of the elution.
94
82
Rb Elution System Control
•
Ran Klein, University of Ottawa
If the remaining data set is empty do not change Πmax as there is no relevant
data (∆ Πmax = 0).
•
Otherwise keep only the data relating to rise of activity up to the maximum
point.
o If the remaining data contains more than one data point, use the slope
of a linear fit of the error vs. correction, SS. Factor for the change in
correction during this time interval, ∆ς, using (31).
∆ Πmax = γR·SS·(1-Πmax )·∆ς
(31)
o Otherwise decrease the saturation point slightly (∆ Πmax = -10-5).
Predicted
Flow Ratio
Minimum
Flow
Ratio
1
Saturated
Region
0.5
Activity
0
0
Valve
Correction
0
20
40
60
80
100
0
-3
x 10
20
40
60
80
100
80
Duty-cycle
increased by
100
correction
algorithm
5
5
0
-5
0
20
40
60
Error
2
0
-2
Error diverges
from zero
0
20
40
60
80
100
Figure 4-15 – Results from an elution in which the entire bolus activity was eluted. The valve upper
bound parameter, Πmax, can be adjusted based on the region where the valve is fully opened and the
correction algorithm attempts to further increase the duty-cycle. In this case, the activity does not rise
further so Πmax will be slightly decreased.
95
82
Rb Elution System Control
Ran Klein, University of Ottawa
Valve Lower Bound (Πmin)
As opposed to the other model parameters, the lower bound duty-cycle was found to
have little significance on measured error. This can be reasoned through observation that the
predicted flow ratio never falls below 20%. As a result, modeling in the range 0-20% need
not be optimized, and in fact cannot be optimized since relevant data cannot be measured. It
was decided to avoid the automatic tuning of this parameter and fix it to zero. This
corresponds to zero duty-cycle to achieve zero flow through the generator.
Summary
In an effort to develop a control system capable of delivering a constant rate of
activity from a
82
Sr/82Rb generator various considerations had to be taken into account.
These include the decay of activity during transport in the lines, the variation in activity
concentration from the generator during an elution, and the slow response in feedback,
especially in comparison to typical elution times. These difficulties were addressed through
the development of a predictive-corrective control algorithm that attempts to predict the
activity concentration at the merger of the generator and bypass lines. The predicted activity
concentration is used to control the ratio of saline that flows through the generator versus to
the bypass line.
The prediction algorithm uses an activity concentration vs. volume curve measured
during a daily calibration run and the history of the elution to accommodate fast changes in
activity concentration. A corrective feedback algorithm consisting of a modified PID loop
corrects the valve control signal to drive errors in the measured activity rate to zero.
The flow ratio of saline through the generator is actuated using a solenoid two-way
pinch valve cycling at a constant frequency (5Hz) with a controlled duty-cycle. As the dutycycle is increased, a higher ratio of saline is routed through the generator, thus increasing the
activity rate at the merger of the two lines. The valve flow ratio response to duty-cycle is
highly non linear and was modeled using a combination sigmoid and linear function.
For the valve response model to remain accurate over time, a self-tuning algorithm
was developed. This algorithm continuously adjusts the model parameters by small
increments through analysis of the activity rate error as a function of the flow ratio collected
96
82
Rb Elution System Control
Ran Klein, University of Ottawa
during each elution. It is expected that over many elutions, the model parameters will be
adjusted so as to reduce the error in the eluted activity profiles.
With this implementation of the RbES completed, performance can be compared to
the prototype system which employed a simplistic but reliable control system. The ultimate
decision is whether any of the control modes (hysteresis corrected threshold comparison
(HC-TC), and predictive-corrective control of PWM valve (PCC-PWM)) are sufficient for
both clinical and experimental quantitative perfusion measurements using 82Rb in PET. The
characteristics of both approaches should be compared to determine the advantages of
disadvantages of each approach.
97
82
Rb Elution System Control
Ran Klein, University of Ottawa
Chapter 5: Testing and Characterization
Due to the clinical application of this system, it was important to conduct a thorough
testing of the system in order to uncover any possible errors or unaddressed requirements of
the system. These tests included both hardware and software aspects. Hardware safety
considerations mainly concerned electrical safety, mechanical robustness, and failure to a
safe mode. Although an elution is permitted to fail, it must do so gracefully without threat to
the well being of the patient or the operators. The test scenarios were designed to confirm
that the system behaves in a predictable manner not only in routine situations, but also when
anomalies such as hardware failure and unexpected measurements occur.
Full characterization of the system’s capabilities is also important. This includes
confirmation of the physical model and the activity counter calibration constant. The selftuning algorithm was scrutinized to ensure convergence to nominal values as well as
stability. Finally, the constant-activity capabilities of the system were characterized. The
range of relative activities that can be eluted from the system at different durations is of
particular interest as it indicates the operating range of the system.
Characterization of the predictive corrective control of a pulse width modulated
cycling valve (PCC-PWM) was analysed by comparison of results to the hysteresis corrected
threshold comparison control (HC-TC). The testing and characterization phase allowed
determination of whether PCC-PWM is a preferred alternative to HC-TC as a control method
for the
82
Rb elution system. In addition, these tests help validate the readiness of RbES for
routine clinical use.
5.1
Safety Testing
Safety to operators and patients is the most important requirement of the design. As
demonstrated in the design process of chapter 3, much emphasis was placed on reducing the
chance of both current leakage and radiation exposure.
To ensure electrical safety, a CSA4 certification was obtained for both the
development and clinical system. Certification was obtained through testing by a third party
4
Canadian Standards Association – a non-for-profit self-governing organization which tests and certifies
equipment in order to ensure compliance with safety standards.
98
82
Rb Elution System Control
Ran Klein, University of Ottawa
(Entela, Toronto, Ontario). The test includes electrical leakage, proper grounding, power
isolation, and power consumption. These tests ensure general safety from electrocution, fire
hazard, and surge protection. The measurements obtained for certification are listed in Table
5-1.
Table 5-1 – Canadian Standards Association (CSA) field evaluation for electro-medical equipment
results for two RbES systems.
Test
Electrical Rating
Line to chassis surge (1000V)
Chassis to ground polarity with
ground open (normal [Reverse])
Chassis to ground polarity with
ground closed (normal [Reverse])
System 1
1.19A @ 120V(60Hz)
Pass
<1 (Pass)
System 2
1.19A @ 120V(60Hz)
Pass
<1 (Pass)
<1 (Pass)
<1 (Pass)
Although most of the fail-safe mechanisms were implemented in software, the
hardware design also handled some of these aspects. Test cases, including hardware failure
tests, are described in Appendix A. These are intended to ensure that the patient is not
exposed to more than the radiation dose set in health regulation guidelines. Hardware
malfunction scenarios were tested such as a computer crash, power outage, disconnected
control lines, etc.
The Worst Case Scenario
Even after much emphasis on developing a robust system that can identify and handle
potential errors, there is always the risk of overlooking some erroneous scenarios. An
additional cause for concern is that there may be situations when errors cannot be detected.
In order to clarify the level of risk, the following worst-case scenario was developed:
The generator has recently been loaded with 82Sr and morning flush and calibration
runs pass successfully with 6800 MBq and 3400 MBq measured activities respectively. A
large patient is to be imaged so an elution is started with a high dose (1500 MBq) over 30 s.
The elution volume is limited by the maximum elution volume parameter (30 ml), which the
autonomous pump is set to deliver. The elution begins normally, the threshold activity is
passed, and patient valve is opened. As the activity concentration from the generator is still
relatively low, the generator valve is set wide open. With the valve fully open, all the activity
from the generator is routed to the patient. At this point, the operating system stops
responding which prevents the software application from controlling the RbES. The
99
82
Rb Elution System Control
Ran Klein, University of Ottawa
actuators remain in their previous state since the hardware is unaffected – the generator valve
and patient valves are open and the pump is running.
Although the technologist should be monitoring the system at this point, he/she may
be distracted by an urgent call of the patient. The system continues routing activity to the
patient. The autonomous pump continues to run until the prescribed volume (30 ml) is
reached. Although the valves remain in an open position the stopped pump prevents further
flow of
82
Rb to the patient. When the technologist returns to monitor the system, she/he
notices that the user interface is not responding (or updating). In response, the computer is
switched off, which cuts power to the DAQ and buffer boards and the valves return to their
safe positions.
It is unlikely that the pump will continue eluting past the preset volume (30 ml). The
pump chosen for this application is reputed for its reliability and accuracy due to the use of a
stepping motor to actuate the peristaltic head. In terms of reliability the use of a stepping
motor indicates that the pump controller must remain operational in order to actuate the
pump. If the controller locks-up, the actuator by design will stall, thus limiting the
deliverable volume to the prescribed dose.
This is considered the worst case scenario since it results in a maximal dose to the
patient. The cycling signal is produced by a hardware counter on the DAQ, even when the
computer stops responding, the signal is still generated. During this time it is expected that
most of the bolus activity will be eluted to the patient, resulting in an eluted activity as high
as 4000 MBq depending on the generator activity. Health regulation guidelines5 permit
activity doses as high as 2200 MBq per scan, but scans may be repeated as needed. Typically
two scans (rest and stress) are conducted at any one session meaning that the guidelines
permit routine exposure to 4400 MBq. Thus, this analysis concludes that this worst case
scenario will result in radiation exposure that is within the guidelines, and thus of no
significant risk to the patient’s health.
5.2
Test Cases
In addition to testing during general use of the system, test cases were written to
validate the design requirements and test for bugs. The cases were written at an early stage of
100
82
Rb Elution System Control
Ran Klein, University of Ottawa
the development process with the requirements in mind and later updated as the
implementation details became finalized. No formal test approach was used, but in order to
ensure thoroughness, the tests attempted to exercise as many the software branches as
possible - including creating/simulating errors. As stated above, the test cases also include a
hardware testing aspect in the form of malfunction detection testing and actuator response
verification.
The tests were all carried out manually by the tester. Manual testing was necessary
because testing included monitoring of the system display and actuators in a way that could
not be easily automated. In addition, due to the real-time nature of the system, it was
undesirable to further consume system resources with automated testing software. Finally,
vials must be changed between elutions, which cannot be automated without the use of
elaborate manipulators. Considering these complications and that the entire system could be
tested within two work days, it did not seem worthwhile to set up an automated testing
environment.
The tests were organized in a MS Access database for easier management and
editing. Each of the 49 tests was classified under one of three groups as shown in Table 5-2.
The cases are implemented in such a manner so as to test as many software branches as
possible in order to shorten testing time. An example case is included in Figure 5-1 while the
complete test list is included in Appendix A.
Table 5-2 - Test classification codes and their descriptions.
Test Code
E
F
Test Type
Error Handling
Functionality
U
User Interface
5
Description
Tests relating to error detection, handling, and reporting mechanisms.
Tests relating to the functioning of the application – such as functionality of
elutions and functions triggered by user input.
Tests relating to the user interface – such as handling of invalid inputs,
operation.
University of Ottawa Heart Institute [82Rb] Rubidium Chloride Injection Investigator Brochure.
101
82
Rb Elution System Control
Ran Klein, University of Ottawa
Figure 5-1 - Sample test case layout.
User Interface Testing
To reduce the chance of operator error the GUI is simple in design and all inputs are
validated. An important aspect of this is limiting the user intervention to relevant
functionality through a step-by-step menu. The touch screen interface displays only the
information relating to the specific step in the menu, collecting a single input at any given
time. Buttons that are not relevant to the specific step are disabled or removed from the
screen entirely. In addition, each operator input is verified to be within a valid and reasonable
range. If this is not the case, the operator is either asked to confirm the entered value or
correct it. As a final measure the user is asked to confirm all the elution settings prior to
starting of the automatic sequence.
To test the user interface, each software branch is executed by at least one of the 11
test cases. The tests guide the tester to perform specific actions and to observe certain
behaviour of the user interface (such as disabling of buttons and appearance of messages). In
addition, the final results screen, graphs, and printouts must be scrutinized for mismatches
and errors.
Functional Testing
This category applies to testing of the overall functionality of the system and its
features. These 15 tests include ensuring the elutions proceed in correct sequence and that the
hardware actuators perform correctly. During each elution sequence the cases call for visual
monitoring of the display and actuators by the tester. Final elution results are analyzed to
102
82
Rb Elution System Control
Ran Klein, University of Ottawa
ensure that the actual elution statistics fall within the tolerance range. Finally all record files
are scrutinized for correct formatting and data.
Error Handling Testing
As a requirement, the system software was designed to detect malfunctions at the
earliest possible stage and take action to avoid escalation to the worst case scenario or
spoiling of the clinical test. In most cases the system copes with malfunctions by
immediately stopping the elution in a controlled manner, setting the actuators to their safe
mode, and generating a meaningful message to the operator. Each message includes the
reason for failure and suggestions to resolve it.
The 23 error handling tests verify that errors are detected, proper action is taken by
the system, and that the errors are reported in a meaningful manner. Of the 25 detectable
errors, all but 3 errors are tested for proper handling. The remaining errors cannot be easily
simulated and are unlikely to occur.
5.3
Testing in a Routine Clinical Setting
Monitoring of the system during routine clinical use was intended to assess the
reliability of the system and to uncover any overlooked bugs and requirements. Two
identical RbES were built, one of which was put into clinical use at the UOHI Cardiac PET
Centre in January 2004 after passing the test cases, having obtained CSA certification, and
being approved by the Medical Devices Institutional Review Committee. This system
implemented all the design requirements except for the improved constant-activity control
algorithm discussed in the previous chapter (PCC-PWM). The system was capable of all of
the previously published elution capabilities including constant-flow, constant-time, and
constant-activity using the hysteresis corrected threshold comparison algorithm (HC-TC).
While the clinical system was being used routinely, development of the control system
continued on the second system.
The RbES replaced the previous elution system [30] which was only capable of
conducting constant-time elutions. As the technologists adopted the new system for routine
use, their feedback was used to resolve issues and bugs as they were exposed. In addition,
bug reports were used to assess the robustness of the system. The data collected during
103
82
Rb Elution System Control
Ran Klein, University of Ottawa
clinical use were used to characterize some aspects of the RbES. The data included in this
report relate to clinical trials over a nine-month period (from March 2004 to December
2004). During this time the generator was reloaded five times with 3700 MBq of 82Sr. The
RbES was flushed and calibrated at the beginning of every work day whether or not scans
were scheduled. During the trial period 667 patients underwent 82Rb rest and stress perfusion
scans. Of those patients, 653 were scanned with the usual constant-time elutions and 14 were
scanned using the HC-TC constant-activity mode.
Computer Crash Issue
During clinical use, a chronic problem of random computer crashes during the real-
time sequence (2.3% of reported clinical elutions [n=925]) was observed. The crashes were
manifested through total lock-up of the operating system, forcing a reboot the computer. This
situation made analysis of the problem very difficult. Although the source of these crashes
was not absolutely determined, it was suspected that system resources were mishandled and
over-consumed. To address this possibility the software was altered with the following points
of emphasis:
•
Global variables – The software that was inherited from the prototype system
used over one hundred global variables to communicate data between scripts
and functions. The declaration of these variables in each function was carried
out through the global_declare script. Since Matlab is an interpreted
language, the repetitive calling of this script adds significant overhead To
reduce this overhead, two concepts were enforced throughout the software:
o Function based design – where possible, scripts were replaced with
functions to which the variables could be passed as parameters during
the function call. This completely removed the need to declare the
global variables in the function.
o Global variable structure – individual global variables were unified
under several data structures (Table 5-3). This enabled declaring only
a few global variables as needed rather then calling an entire script
file.
104
82
Rb Elution System Control
Ran Klein, University of Ottawa
Table 5-3 - List of global structures and their contents.
Structure
Name
parametersINI
parametersCAL
runS
calS
logS
GUIS
•
Content Description
Parameters loaded from the initialization file.
Parameters loaded from the calibration file such as
generator information, daily protocol history, and
calibration parameters for the system.
Parameters structure defining the current elution run
(created before the elution begins)
Calibration information calculated prior to the elution run.
Log structure created during the elution containing all
records pertaining to the actual sequence of events during
the elution.
Structure containing all parameters related to the GUI. In
addition a list handles to all dynamic graphic objects is
included.
Improved graphic object management - the software was modified to better
manage graphic objects through deletion of unused objects or updating of
object parameters rather than overwriting them as was inherited from the
prototype system.
•
Pump driver – the prototype system communicated with the pump through a
polling
algorithm
included
in
the
physical_sequence
model.
The
communication protocol with the pump dictates a delay of 300-500 ms
between the query and answer by the pump. This was handled in the
prototype system through a delay loop until the query and answer was
completed. Since the physical_sequence is refreshed at 1 Hz this delay added
significant overhead (30-50%). To reduce this overhead, a communication
driver was written. The driver runs as a separate task and is triggered by an
interrupt event whenever data are received on the port. The data are read,
tested for errors, and updated directly in the real-time model before a new
query is sent to the pump. If a reply from the pump is not received within 500
ms the query is repeated. Thus the overhead was substantially reduced
leaving more system resources available.
The new implementation was not transferred to the clinical trial, but software crashes
were not experienced during 6 months of use on the development system. Once the new
software is subjected to routine clinical use, experience should reinforce confidence in the
robustness of the new software.
105
82
Rb Elution System Control
5.4
Ran Klein, University of Ottawa
Calibration Characterization
Over the life-span of five generators (284 days), 189 calibration runs were conducted
at 15 ml/min flow rate (Figure 5-2). The calibration constant appears unchanged with a
standard deviation of 2.16%. Closer inspection revealed a small but significant correlation
between the eluted activity and the calibration constant, K, (p=0.0044, r2=0.0585) as is
demonstrated by Figure 5-3. A linear fit revealed a small slope, 2.59·10-9 MBq/ml/cps/MBq
(95% confidence interval [1.09·10-9, 4.09·10-9]) in the relation between calibration constant
(MBq/ml / cps) and generator activity (MBq). Over the life span of a generator the
calibration activity can change by as much as 2500 MBq. This results in ~1.7% change in the
calibration constant over the life of a generator, which is considered a negligible effect.
These results show that the calibration process is both reproducible and is relatively constant
Calibration constant
(MBq/ml / cps)
throughout the entire range of useful activities.
4
x 10
-4
Variation in calibration constant over time
3
2
1
0
0
50
100
200
250
300
250
300
Activity over time
4000
Activity (MBq)
150
Generator
reloaded
3000
2000
1000
0
0
50
100
150
200
Date (days)
Figure 5-2 – Calibration constant over the course of a generator life (top) and the 82Rb activity from the
generator during calibration over the same time period (bottom).
106
82
Rb Elution System Control
-4
Calibration Constant (MBq/ml / cps)
4
Ran Klein, University of Ottawa
Correlation of activity and calibration constant
x 10
3
2
K = 0.00036805+2.5878e-009A
r2 = 0.0585
1
0
0
500
1000
1500
2000
2500
3000
3500
Activity (MBq)
Figure 5-3 - Correlation of calibration constant to generator activity.
Calibration Constant vs. Flow Rate
Calibration elutions are performed with a saline flow rate of 15 ml/min, but elutions
are performed in the range of 5-25ml/min. Since the calibration constant is a measure of
efficiency (intrinsic and geometric) of the activity counter it is expected that this constant
remain valid regardless of elution flow rate. To test this assumption, five sets of calibration
elutions were conducted at flow rates ranging 5-25 ml/min at increments of 5 ml/min (Figure
5-4). The value of the calibration constant did not vary significantly over the range 10-25
ml/min., however a slight decrease was noted at 5 ml/min flow rate. This reduction may be
due to longer transport times to the dose calibrator than expected due to inaccuracy in the
line volumes. At this low flow rate, significant 82Rb decay is experienced, while at the higher
flow rates the delivery time error is 2 to 5 times shorter.
107
82
Rb Elution System Control
Calibration constant (MBq/ml / cps)
-4
x 10
Ran Klein, University of Ottawa
Variation in calibration due to flow rate
3.5
3
2.5
2
1.5
1
0.5
0
0
5
10
15
20
25
30
Flow Rate (ml/min)
Figure 5-4 – Calculated calibration constant over the range of flow rates.
The same test was repeated with a second generator, this time revealing a different
trend in results as shown in Figure 5-5. As the flow rate increased, the calibration constant
decreased almost linearly. Further investigation revealed that the line pressure was increasing
linearly with the flow rate up to 20 ml/min at which point it saturated (10-25 psi compared
with 7-15 psi in the previous generator). This high pressure was due to saline flow resistance
imposed by the second generator. This resistance generated a high pressure resulting in
backwash through the peristaltic pump head leading to a flow rate lower than expected. If
calibration constants were corrected for the measured flow rate (measured through the saline
volume in the vial) the calibration constant would have varied less with flow rate,
demonstrated by the dashed line in Figure 5-5. However, the flow rate cannot be measured
with the current hardware.
The high flow resistance introduced by the second generator is due to the tin-oxide
packing of the generator column during production. Tin-oxide comes in a powder form and
is filtered twice to exclude particles outside a specific size range. The filtered powder is then
packed to remove large air pockets. If the packing is too tight, or the size of powder grains is
too small one can expect restricted saline flow through the column. Once the generator has
been loaded with
82
Sr and released for clinical use, the flow resistance does not seem to
change over time.
108
82
Rb Elution System Control
-4
Calibration Constant (MBq/ml / cps)
x 10
Ran Klein, University of Ottawa
Calibration Constant vs. Flow Rate (high flow resistance)
3.5
3
2.5
2
1.5
Measured Calibration Constant
Corrected Calibration Constant
1
0.5
0
0
5
10
15
20
25
30
Flow Rate (ml/min)
Figure 5-5 - Calibration constant dependence on flow rate for generator column with high flow
resistance.
Variation in elution characteristics, including flow resistance, is expected between
generator models. In this study two generators of the same model were used. Both were
custom made at UOHI [30]. It is expected that a single generator model be used in any single
facility in order to promote reliability and inter-changeability.
To address backwash through the pump-head resulting from increased flow
resistance, two courses are suggested for future work. It is preferable for future applications
that flow resistance be tested after the building of the column and before loading of 82Sr to
ensure that the saline pressure at the generator input remains below 20 psi at flow rates in the
range of 5-25 ml/min. In addition it is suggested that the pump head rotor be replaced with a
model that can sustain higher back pressure without backwash.
Summary of Calibration Analysis
The calibration results helped validate the accuracy of the model of the physical
process from the activity counter to the patient outlet. This ensures that the physical process
during transport of the activity from the activity counter to the patient outlet (or dose
calibrator) is well understood and can be modeled over the entire range of flow rates. This
means that one can predict the activity profile at the patient outlet accurately based on
measurements from the activity counter. This result is valid as long as the line pressure
remains sufficiently low to avoid backwash through the pump head and a false flow rate.
109
82
Rb Elution System Control
5.5
Ran Klein, University of Ottawa
Analysis of the Self-Tuning Model
The control algorithm was designed in such a way that manual adjustment of the
system should not be needed. To achieve this, the system needs to self-tune the valve
response model parameters to nominal values so as to reduce the activity rate errors over
time. Although it is desirable that the valve response adapt quickly to changes in the system,
it is more important that the self-tuning algorithm be robust. Poor measurements due to
malfunctions or errors must not cause the model to diverge significantly from its nominal
parameters. For example, if the saline supply line is pinched during an elution, no activity
will be drawn from the generator, leading to low activity rate measurements, but this is not
an indication that the valve response has changed. In practice the dynamics of the system are
not expected to change very quickly and therefore some robustness can be maintained using
small learning coefficients as demonstrated in chapter 4.
In order to assess the stability and robustness of the self-tuning algorithm, both
analytical and empirical analyses were performed. The first was included in the design
process and is described in the previous chapter. At the characterization stage, the
performance of the self-tuning algorithm was assessed by monitoring the elution profiles and
the associated model parameters.
In order to speed up the tuning process for demonstration purposes, the learning
parameters, γL, γS, and γR listed in (29), (30), and (31) respectively were increased by an
order of magnitude (X10). Figure 5-6 shows the activity rate vs. time (bottom) and error vs.
valve flow ratio (top) for three successive elutions (30% relative activity over 30 s). The
linear slope and sigmoid scaling are adjusted based on the lower range of valve duty-cycle
(r<rt). As the parameters converge, their adjustments decrease in magnitude. The
improvement in precision can be both noticed visually as a decrease in error slope and by the
gradual decrease in root-mean-square (RMS) elution error from 24.5 to 14.7.
110
Rb Elution System Control
Ran Klein, University of Ottawa
Variation in Error v.s. Valve Flow Ratio
20
20
20
0
0
0
-20
∆Πmax = 0
∆L = -0.00013404
∆G = 0.72043
-60
0.3
0.35
0.4 0.45 0.5
Desired Flow Ratio
0.55
-60
Activity Rate (MBq/s)
0.5
0
0
20
40
Time (s)
60
80
∆L = -2.4034e-005
∆G = 0.56796
0.3
0.32 0.34 0.36 0.38 0.4
Desired Flow Ratio
-60
0.42
RMS = 16.1288
1
0.5
0
0
20
40
Time (s)
60
-20
∆Πmax = 0
∆L = 1.0082e-005
∆G = 0.10833
-40
0.3
0.32 0.34 0.36 0.38
Desired Flow Ratio
0.4
Instantaneous Activity Rate at Patient Outlet
1.5
Instantaneous Activity Rate at Patient Outlet
1.5
Instantaneous Activity Rate at Patient Outlet
1.5
RMS = 34.285
∆Πmax = 0
-40
0.6
1
-20
Error (%)
40
-40
Activity Rate (MBq/s)
Variation in Error v.s. Valve Flow Ratio
40
Error (%)
Error (%)
Variation in Error v.s. Valve Flow Ratio
40
Activity Rate (MBq/s)
82
RMS = 14.6962
1
0.5
0
0
20
40
Time (s)
60
Figure 5-6 – Illustration of the effect of accelerated self-tuning of the valve response model over three
successive elutions at 30% over 30 s. The top graph represents the measured error vs. the valve dutycycle while the bottom portion compares the eluted activity rate to the requested activity rate. As the
linear slope and sigmoid scaling parameters are adjusted the RMS error decreases.
The same process can be demonstrated over a different set of data in which 30%
relative activity 30 s elutions were repeated 87 times. The evolution of parameters, and the
resulting RMS error and elution time error is shown in Figure 5-7. As the valve response is
self-tuned the RMS error initially increases, but then decreases as the parameters G and L
converge. The elution time error increases in magnitude almost in unison with the RMS
error. During the entire training session Πmax is unchanged, as the desired valve ratio does
not reach the region (100% open) required for tuning Πmax.
The evolution of parameters G and L can also be viewed on the plot of the parameters
(Figure 5-8). Parameter L is initially far from its nominal value, and adapts slowly.
Parameter G adapts faster and overshoots its nominal value. Once L begins to converge to its
nominal value, the over correction of G becomes prominent and its correction reverses. As
both parameters evolve, they converge towards their nominal values and remain relatively
stable in 17 subsequent runs (G=26.5±0.65, L=0.00677±0.00017).
111
82
Rb Elution System Control
Ran Klein, University of Ottawa
Πmax
1
0.5
Parameter L and G adaptation
0
0
20
40
60
L
35
80
0.01
30
0.005
0
0
25
20
40
G
60
80
20
G
40
20
0
0
Stop
100
15
20
40
60
RMS Error (%)
80
100
Start
10
100
5
50
0
0
20
40
60
Time Error (%)
80
40
80
0
0
100
1
2
3
4
L
50
5
6
7
-3
x 10
0
-50
0
20
60
100
Sample #
Figure 5-7 – Evolution of parameters G and L
during self-tuning through repeated runs of 30%
relative activity over 30 s. The start point is the
manual fit of the curve, while the stop point was
determined when change to the parameters was
relatively small (n=87).
Figure 5-8 – Evolution of parameters G and L
during a 30% relative activity over 30 s
training session. The grey lines define the
region of model parameter variation over 17
subsequent elutions.
The above training process involved 87 repeated elutions, which in a typical clinical
setting would require several weeks to complete. Although a clinical system is not expected
to be in a parameter state that is so far from the nominal values, this slow learning indicates
that the self tuning algorithm will be very slow to accommodate changes in the system. The
system learning parameters, γL and γG, can be increased in order to speed up the learning
process - suggested values could be 0.1 and 0.05 respectively.
Variation in Valve Model Parameters with Requested Elution Parameters
In the above training set, the parameters are optimized for the specific requested
profile (30% relative activity over 30 s). It is expected that these parameters should remain
valid over other profiles as well (different durations and relative activities), but in practice
this may not be true as the self-tuning mechanism corrects for measured activity rate errors
regardless of what their source is. Over a set of elutions with variable relative activities this
suspicion was confirmed in the sense that changing the relative activity seemed to result in
conflicting parameter adjustments.
112
82
Rb Elution System Control
Ran Klein, University of Ottawa
One reason for the conflicting L parameter adjustments is the two different scenarios
through which this parameter may be adjusted. To illustrate this, Figure 5-9 (bottom) shows
an example activity rate error vs. desired flow ratio. Since more than 4 data points exist for
the higher flow ratio region (rt<r<1), parameter L is adjusted based on the slope of the line fit
to this region (dotted line), referred to as slope rule. As the slope is negative in this case, the
adjustment of L is positive (0.00021). However, if less activity was requested, less than 4
data points might be measured in the higher flow ratio region, and the mean error in the
lower flow ratio region (r<rt) would be used to adjust L, referred to as a mean error rule.
Since the mean error is clearly negative, the slope would be decreased, to increase the dutycycle in this range. Figure 5-9: top shows the valve response that corresponds to the range of
desired flow ratios that were used during the elution and the cut-off between the lower and
higher range of the response, rt.
Valve Response
Duty-Cycle
1
0.98
rt
0.96
0.94
0.25
Error (%)
0
0.3
0.35
0.4
0.45
0.5
0.55
0.6
0.65
0.7
0.75
0.7
0.75
Variation in error v.s. the valve ratio
-20
High threshold adjestment = 0
Linear Slope Adjustment = 0.00021072
-40 Sigmoid Scaling adjestment = 0.050531
0.25
0.3
0.35
0.4
0.45
0.5
0.55
0.6
0.65
Desired Flow Ratio
Figure 5-9 – Example activity rate error measurements used for valve response model parameter tuning
to illustrate conflicting adjustments based on how the data are treated.
With this adjustment conflict in mind, it is interesting to know what values parameter
L would converge to with each adjustment scenario. This was attempted through repeated
runs of 50% relative activity over 30 s but was aborted as a second problem with the L
parameter adaptation law was revealed (Figure 5-10).
113
82
Rb Elution System Control
Ran Klein, University of Ottawa
If a high relative activity is requested, the generator bolus activity may be exhausted
before the end of the elution, resulting in large negative error at very high valve flow ratios.
Adjusting parameter L based on the slope rule, results in producing constant-activity rate
elutions with a bias. This is a result of the slope rule ‘attempting’ to achieve a constant level
of error throughout the range of valve flow ratios. Since negative errors are inevitable if the
bolus activity is exhausted, the end result is negative errors throughout the range of valve
flow ratios.
Valve Response
0.4
0.6
0.8
0.6
0.8
0.85
1
0.6
0.8
1
Desired Flow Ratio
Instantaneous Activity Rate at Patient Outlet
0.4
RMS = 49.6851
0.3
0.2
0.1
20
40
Time (s)
60
0
-20
∆Πmax = -1e-005
-40
∆L = -0.00034309
∆G = 0.22759
-60
0.4
0.6
0.8
1
Desired Flow Ratio
Instantaneous Activity Rate at Patient Outlet
0.4
0.5
0.6
0.7
RMS = 55.7499
0.2
0.1
10
20
30
40
Time (s)
50
0.9
rt
0.85
0.4
0.6
0.8
Variation in Error v.s. Valve Flow Ratio
40
20
0
∆Πmax = 0
-40
∆L = 0.00074225
∆G = -0.37729
0.4 0.5 0.6 0.7 0.8
Desired Flow Ratio
Instantaneous Activity Rate at Patient Outlet
0.8
0.4
RMS = 50.8022
0.2
20
40
Time (s)
60
0
∆Πmax = 0
-20
∆L = 0.0005809
∆G = -0.28301
0.4
0.6
0.8
Desired Flow Ratio
Instantaneous Activity Rate at Patient Outlet
0.8
-40
-60
0.3
0.6
0
0
0.95
0.8
0.8
-20
-60
0.4
0.3
0
0
0.4
20
Error (%)
∆L = -0.00026222
∆G = 0.11633
0.3
Variation in Error v.s. Valve Flow Ratio
40
Activity Rate (MBq/s)
-40
Error (%)
∆Πmax = -1e-005
Duty-Cycle
rt
0.9
20
0
Activity Rate (MBq/s)
Error (%)
Activity Rate (MBq/s)
0.4
0.95
Variation in Error v.s. Valve Flow Ratio
40
20
-20
0
0
0.99
0.98
1
Variation in Error v.s. Valve Flow Ratio
40
-60
rt
Error (%)
0.98
1
1
Activity Rate (MBq/s)
rt
Valve Response
1
Duty-Cycle
Duty-Cycle
Duty-Cycle
1
0.96
Valve Response
Valve Response
1.01
1.02
0.6
0.4
RMS = 50.7615
0.2
0
0
20
40
Time (s)
60
Figure 5-10 – Adaptation of parameter L over a repeated sequence of 50% relative activity over 30 s
elutions revealed that the adaptation law is flawed. The resulting elution curves become flat, but biased
due to exhaustion of the generator activity.
This issue does not occur when the alternate (mean error) rule is used since the lower
range, which spans most of the elution time, is always driven to achieve zero error. With the
mean error rule, the L parameter is a product of two concurrent processes: driving the
average lower range error to zero and adjusting the upper valve saturation point, Πmax. It is
expected that maintaining the mean error rule as the only adaptation rule for parameter L will
yield better self-tuning characteristics; however this was not tested within the scope of this
work.
Analysis of Tuned Valve Response
Comparing the valve response curves produced with manually estimated parameters
and self-tuned parameters (Figure 5-11) reveals some interesting issues. The response graph
generated with self-tuned parameters (dashed line) follows the measured response less
closely than the manual estimate (dotted line). The region of operation of the valve is
114
82
Rb Elution System Control
Ran Klein, University of Ottawa
~0.25<r≤1.0 which corresponds to very small changes in the duty-cycle, ~0.97<Π<0.9975.
The response in this range caused very large changes in flow ratio due to very fine dutycycle changes, an unfavourable response.
Valve Response Correction Curve
PWM 0.998
DC (Π)
Πmax
0.996
0.994
0.992
Measured
0.99
Manual Estimate
Converged Estimate
0.988
0.986
0.984
0.982
0.98
0.25 0.3 0.35 0.4 0.45 0.5 0.55 0.6 0.65 0.7 0.75 0.8 0.85 0.9 0.95
1
Desired Valve Flow Ratio (r)
Figure 5-11 – Valve response correction curve used to determine the PWM duty-cycle (DC) required to
achieve a desired valve flow ratio. The measured curve (shown in heavy line) is followed more closely by
the manually estimated fit (dotted line) than by the automatically tuned fit (dashed line).
The discrepancy between the self-tuned valve response and the measured response is
partially due to the self-tuning algorithm adjusting the valve response parameters to decrease
the overall activity rate errors. These errors are not caused solely by modeling of the valve
response, but also through imperfect system modeling, prediction of activity concentration,
and possibly other unknown factors. The self-tuned valve response by its nature will try to
correct for these error sources.
A potential limitation in the design of the self-tuning algorithm is that the error
analysis does not take into account that errors in the valve response also contribute to activity
concentration prediction errors. Even if the system model (and prediction algorithm) were
perfect, errors in the valve response model would lead to erroneous prediction of the
effective volume through the generator leading to a false activity concentration prediction,
CM-. As a result, activity concentration errors may accumulate as the elution progresses. It is
115
82
Rb Elution System Control
Ran Klein, University of Ottawa
the role of the corrective algorithm to compensate for errors during the elution, and also
reduce prediction error, but some degree of error is inevitable.
Since the elution begins with a high activity concentration from the generator as the
bolus portion of the activity curve is eluted, the valve flow ratio during the beginning of the
elution is kept low. During the later portion of the elution the valve flow ratio increases if a
high relative activity was requested. Since more prediction error is expected as the elution
progresses, the activity rate at higher ranges of valve flow ratios (rt<r) is associated with
more prediction error than the activity rate associated with the lower range of valve flow
ratios (r<rt). For this reason the error measurements associated with the lower valve flow
ratio range must be weighted more heavily for adjustment of the model parameters.
Both the theoretical analysis and experimental analysis point to a stable and
converging self-tuning model of the valve response over repeated elutions with the same
requested profile. However some variation in ideal parameter values is expected between
requested profiles. The amount of variation cannot be estimated with the available data, but
could be addressed by future research. The experience to date is over a relatively short time
period and in a well monitored environment. Furthermore, these results were measured using
a single generator. In a clinical setting, generators will be replaced every 2 months
approximately, the system will be used without tracking of the parameters, and if the elution
profiles worsen it is unlikely that the technologists will be capable of readjusting the
parameters. Ultimately, clinical trials will shed light on the long term performance and
reliability of the self-tuning algorithm.
5.6
Elution Tests
With the system tuned in both the HC-TC and PCC-PWM control modes,
comparisons were performed to determine a preferred method. In a typical clinical
application elutions are 30 s long and the activity is matched to the physical size of the
patient. Typical relative activities range from 10% for a small patient and a hot generator to
70% for a large patient and a cold generator.
116
82
Rb Elution System Control
Ran Klein, University of Ottawa
The control algorithms were compared through ten sets of 30 s elutions of 10, 30, 50,
and 70% relative activity. Both HC-TC control and PCC-PWM were assessed for
comparison. For each run the elution time error was defined as the difference between the
actual elution time (required to reach the requested activity) and the requested time (32). In
addition, the RMS error relative to the requested activity rate was calculated as an indication
of the accuracy of the algorithm in maintaining a constant-activity rate (33). The time error is
an indication of the average activity rate throughout the elution, while the RMS error is a
measure of deviation of the activity profile from the ideal rectangular form. Typical elution
profiles using both control modes are demonstrated in Table 5-4.
Elution Time Error = T̂Elution − TReq
Error RMS =
∑ A&ˆ
C
&
-A
C
&
AC
(32)
2
T̂Elution
(33)
⋅ 100%
Table 5-4 – Typical constant-activity elution profiles for various relative activities and over 30 s.
Relative
Activity
HC-TC
PCC-PWM
Activity Rate (MBq/s)
RMS = 45.5195
1
0.5
0
40
50
60
70
80
90
Time (s)
100
110
120
Instantaneous Activity Rate at Patient Outlet
0.4
0.3
0.2
RMS = 9.2384
0.1
0
40
50
1
RMS = 49.3151
20
30
40
Time (s)
50
60
Activity Rate (MBq/s)
4
2
20
25
30
35
Time (s)
40
45
50
Instantaneous Activity Rate at Patient Outlet
8
6
RMS = 46.5441
4
2
0
5
10
15
20
25
30
Time (s)
35
40
100
110
120
RMS = 12.2317
0.5
0
10
20
45
117
50
30
40
Time (s)
50
60
Instantaneous Activity Rate at Patient Outlet
1.5
1
RMS = 8.8375
0.5
0
10
55
Activity Rate (MBq/s)
Activity Rate (MBq/s)
Activity Rate (MBq/s)
70%
RMS = 52.6257
15
90
1
70
6
0
10
80
Time (s)
Instantaneous Activity Rate at Patient Outlet
2
0
10
70
1.5
Instantaneous Activity Rate at Patient Outlet
50%
60
Instantaneous Activity Rate at Patient Outlet
3
Activity Rate (MBq/s)
30%
Activity Rate (MBq/s)
10%
Activity Rate (MBq/s)
Instantaneous Activity Rate at Patient Outlet
1.5
15
20
25
30
35
Time (s)
40
45
50
55
Instantaneous Activity Rate at Patient Outlet
6
4
RMS = 43.7626
2
0
5
10
15
20
25
30
Time (s)
35
40
45
82
Rb Elution System Control
Ran Klein, University of Ottawa
Table 5-5 and Figure 5-12 compare the activity rate RMS error and the elution time
error over the range of relative activities. The requested elution time is typically achieved
using HC-TC but fluctuations cause a >40% RMS error. The PCC-PWM control
significantly reduces the RMS error over most of the range of relative activities, except in at
the upper extreme of generator activity (70% relative activity).
Table 5-5 - Comparison of Performance measures for HC-TC and PCC-PWM 30 s Elutions [n=10]
Requested
Dose
(% relative
activity)
10
30
50
70
RMS Error ±SD (%)
P-value
HC-TC PCCPWM
43.6±2.7
54.3±3.8
42.8±7.2
45.3±5.3
10.6±1.4
12.9±2.5
13.±3.2
41.2±8.5
<0.001
<0.001
<0.001
0.120
Elution Time Error ± SD (%)
HC-TC PCCP-value
PWM
-1.0±2.3
-1.7±2.3
3.0±5.1
9.0±4.7
HC-TC
70.0
0.220
0.089
0.85
0.002
Time
Error
15.0
[%]
RMS Comparison
MSE
[%]
-3.3±3.1
0.7±2.6
3.3±2.2
-0.7±5.2
Modeling Accuracy ± SD
HC-TC PCCP-value
PWM
1.10±.08
1.14±.03
1.02±.03
.96±.03
1.01±.03
1.08±.06
1.08±.06
.95±.03
0.005
0.014
0.053
0.352
Elution Time Error Comparison
HC-TC
PCC-PWM
PCC-PWM
60.0
10.0
50.0
5.0
40.0
30.0
0.0
20.0
10%
30%
50%
70%
-5.0
10.0
0.0
10%
30%
50%
-10.0
70%
Relative Activity
Relative Activity
Figure 5-12 - Comparison of performance measures of elutions [n=10] over 30 s at 10, 30, 50, and 70%
relative activity. The root mean square (RMS) activity rate error shown on left is an indication of
instantaneous precision, while the elution time error on the right is an indication of global precision.
The activity rate is measured at the activity counter and is used to predict the activity
rate at the patient outlet. To ensure that this prediction is accurate, a comparison with the
dose calibrator was made and a modeling accuracy factor (Table 5-5) was calculated for each
relative activity (relating to flow rates 5-25 ml/min). The modeling accuracy was calculated
as the ratio between the integrated rate of activity based on both activity counter and dose
calibrator readings (34) demonstrated by Figure 5-13. The activity counter readings were
corrected for transport delay to the patient outlet while the calibrator readings were
118
82
Rb Elution System Control
Ran Klein, University of Ottawa
deconvolved with the 82Rb decay curve to convert accumulated activity readings to activity
rate measurements. Ideally the area ratio should be equal to 1 indicating perfect modeling.
As Table 5-5 shows, using both HC-TC and PCC-PWM resulted in model accuracy ≈ 1
throughout the entire range of relative activities, with a significant improvement with PCCPWM in the 10-30% relative activity range. The PCC-PWM results indicate modeling error
that is typically less than 10% with a slight underestimation of activity at the patient outlet in
the 30-50% relative activity range.
Activity Rate (MBq/s)
Model Accuracy =
∫A
cal
∫N
det
(t ) ⊗ −1 e − λτ dt
(34)
(t − (TCO − Tcorr )) ⋅ K ⋅ f ⋅ e − λ (TCO −Tcorr ) dt
Instantaneous Activity at Patient Outlet
Detector: Delayed
Calibrator: Deconvolved
6
4
2
0
0
10
20
30
Time (s)
40
50
60
Figure 5-13 – Activity rate at patient outlet calculated based on the activity counter readings (blue) and
dose calibrator readings (red). The ratio of integral activity over the elution time (black lines) is used to
assess the accuracy in predicting activity rate at the patient outlet based on activity counter readings.
The high RMS error of the PCC-PWM control at 70% relative activity is partly a
result of the initial overshoot which is not discarded as with lower relative activity elutions.
The initial activity portion cannot be removed, as the generator activity will be insufficient to
achieve the requested activity without it. The source of this overshoot is an initial rise in
activity at high flow rates that is too fast for the system to respond to. The magnitude of the
peak varies significantly based on whether the rise of activity is sampled early enough to
afford the prediction algorithm time to respond. In most cases the rise is not sampled early
enough, leading to an overshoot in activity rate of approximately 100% over approximately 2
s as is shown in the lower right figure in Table 5-4.
Over a 30 s elution a 100% initial overshoot over 2 s would result in a 26% RMS
error even if no additional error is experienced over the remaining 28 s of the elution.
However, the integrator component of the corrective mechanism attempts to correct for this
overshoot by reducing the activity rate over the remainder of the elution resulting in an even
higher RMS error. To make matters worse, the activity rate from the generator decreases
119
82
Rb Elution System Control
Ran Klein, University of Ottawa
below the set point as the bolus of activity is exhausted. This is seen in the decrease of
activity rate in the final ~5 s of the elution in the mentioned figure. Since the generator valve
is already fully opened at this point, nothing more can be done to increase the activity rate.
These reasons combine to set the upper limit of relative activity that can be expected from a
constant-activity elution.
At 70% relative activity the mean elution time error achieved by PCC-PWM is less
than with HC-TC (p=0.002). However, the variability of elution time error is similar for both
control modes (p>0.45 for 10,30,70%) with exception of 50% relative activity (p=0.022). At
70% relative activity PCC-PWM seems to experience more variability in the elution time
error compared to lower relative activity elutions. This is partially due to late registration of
the activity rise phenomenon as discussed above.
Due to the higher saline flow rate (>20 ml/min) used in high relative activity rate
elutions, a fast rise of activity over time results as the bolus is flushed from the generator.
Detection of a rise in activity is needed to synchronize the prediction algorithm with the
actual eluted volume (by solving for Vs). If this rise is not sampled early enough for the
prediction algorithm to take effect, an initial overshoot results which will lead to early
stopping of the elution. If the rise is detected early enough to avoid the overshoot, as with
most cases at low flow rates, the total elution time to reach the same activity may be longer,
thus introducing a variation in elution time error. With the current implementation the
variation in early rise detection is a fundamental limit.
Range of Relative Activities as a Function of Elution Duration
Although 30 s elutions are the norm, there may be reason to believe that longer
elutions may permit more accurate measurement of perfusion [18,27,28]. Since this issue is
being addressed through a current study at the UOHI it was deemed necessary to assess the
system characteristics at various elution durations.
A second set of elutions was aimed at determining the minimum and maximum
relative activities that can be eluted from the generator as a function of the elution duration.
Elutions of 15, 30, 60, 120, and 240 s were used as a test set in which the maximum relative
activity was determined empirically. The success of each elution was evaluated by testing for
no significant drop in activity recorded at the end of the elution due to insufficient activity in
120
82
Rb Elution System Control
Ran Klein, University of Ottawa
the generator, and that both the RMS error and elution time error remained unchanged from
the 30 s elutions.
As the results in Figure 5-14 show, the performance between HC-TC and PCC-PWM
is similar for short elution durations (15-60 s), however at longer durations (120 and 240 s)
the HC-TC method has difficulty controlling low relative activities. At durations of 240 s the
PCC-PWM method can perform elutions using as low as 36% relative activity elutions,
while HC-TC can only achieve relative activities where activity was at least 69%. The
measured maximum relative activities were almost identical throughout the entire range of
durations. The HC-TC method was not capable of achieving low activity rates leading to
premature elution of the requested activity. Pump flow rates were set in the same manner for
both control algorithms to avoid bias; however it may be that by better adjusting the saline
flow rates this short coming of the HC-TC method could be overcome.
RelativePCC-PWM Relative Activity Range
Activity
[%] 140
HC-TC Relative Activity Range
Relative
Activity
[%] 140
120
120
100
100
High range
80
80
60
60
Achievable range
40
20
High range
Achievable range
40
20
Low range
Low range
0
0
15
30
60
120
15
240
30
60
120
240
Duration [s]
Duration [s]
Figure 5-14 – Range of relative activities that can be achieved using the HC-TC method (left) and the
PCC-PWM method (right) without significantly influencing the precision. The high range indicates that
the requested activity is higher than can be provided by the generator, while the low range indicates
activity that is too low for the control algorithm to generate.
5.7
Generator Life Span
In order to increase the cost effectiveness of
82
Rb generators, one would like to
perform as many scans as possible between reloading of the generator. This issue has only
been addressed in the context of of the range of relative activities that can be eluted to
patients (Chapter 1). However, several other factors must also be taken into account.
121
82
Rb Elution System Control
Ran Klein, University of Ottawa
Breakthrough Sr Activity
Elution of 82Sr and
85
Sr isotopes (half-life of 25 and 65 days respectively) to the
patient is undesired, as Sr tends to accumulate in the bone marrow, which is particularly
radiation sensitive [15]. Of concern to us was premature Sr breakthrough, due to the
pulsating flow of saline through the generator as the valve is cycled.
Daily calibration samples are used to test for the breakthrough of Sr activity; if
significant Sr activity is detected, the generator cannot be used on humans. The
specifications of our generator permit 20 L of saline to be eluted before Sr breakthrough
should be experienced. We continued to use the generator on the development system past
the specifications and experienced first breakthrough after approximately 40 L were eluted
through the generator. Once breakthrough appeared, it was tracked over two months. The
measured breakthrough activity reached a maximum around the 40th day. However, if the
activity is corrected for
82
Sr decay it becomes clear that the breakthrough (82Sr to
82
Rb
activity ratio) continues to increase as shown in Figure 5-15.
Sr/82Rb
activity ratio
0.025
82
82
Sr Breakthrough
0.02
0.015
0.01
0.005
0
90
80
70
60
50
40
30
20
10
0
Day
Figure 5-15 - Breakthrough ratio progression over time as measured and corrected for 82Sr decay.
We have no data to suggest premature breakthrough due to the cycling valve.
However, testing on additional generators is required to determine whether breakthrough is
accelerated or not. Sr breakthrough does not appear to be a safety concern as it changes
slowly and is tested for on a daily basis as part of the daily protocol.
122
82
Rb Elution System Control
Ran Klein, University of Ottawa
Activity Curves
The activity rate vs. volume curve collected during the daily calibration run is used to
predict the activity concentration from the generator as part of the prediction algorithm. A
question that arises is whether these curves change over the life time of the generator. It is
clear that their amplitude decreases as the 82Sr in the generator decays (Figure 5-2: bottom),
but the shape of the curves had not been investigated.
Calibration curves over the life of the generator were normalized by their peak
activity rate and plotted on the same graph with the colours varying (blue to orange) in order
of date (Figure 5-16). This graph reveals that over the life of the generator, the bolus volume
becomes smaller, evident as a narrower peak. This may be a result of the Sr migration along
the generator column resulting in less delay and dispersion of the solution as it travels
through a smaller volume to the generator outlet. These curves follow the model described
by (1), but the model parameters vary with time (or total eluted volume).
Normalized activity curves at various ages of generator
1.2
Normalized Activity
1
0.8
0.6
16/01/2004
30/01/2004
13/02/2004
27/02/2004
07/03/2004
05/04/2004
29/04/2004
14/05/2004
01/06/2004
16/06/2004
29/06/2004
13/07/2004
30/07/2004
17/08/2004
31/08/2004
18/10/2004
01/11/2004
15/11/2004
01/12/2004
13/12/2004
0.4
0.2
0
0
10
20
30
40
50
60
Time (s)
Figure 5-16 - Normalized activity rate vs. time curves measured during calibration runs over the life
span of a generator.
The significance of these results is that the prediction mechanism is expected to
perform better with a new generator than with an old one. In the case of an old generator, a
123
82
Rb Elution System Control
Ran Klein, University of Ottawa
small error in the volume through the generator will manifest itself as a large error in the
predicted activity concentration, and therefore a larger error in the predicted valve flow ratio.
Since all of the constant-activity elution measurements in this work were performed within
the last two months of the generator on the research system, it is expected that the elution
performance measures may improve once a newer generator is obtained for research use.
Replacement of this generator was not scheduled until late January 2005; therefore this
hypothesis could not be tested.
The life span of
82
82
Sr/82Rb generators has been determined until now by the risk of
Sr breakthrough and minimum patient activity (~2000 MBq). The results of Figure 5-16
pose yet another constraint on the life span of the generator, the bolus width which limits the
accuracy of constant-activity elutions. Fortunately, these constraints do not contradict each
other. As the Sr isotopes migrate along the tin-oxide column they not only increase the risk
of Sr breakthrough, but also make constant-activity elution harder to achieve.
5.8
Benefits of 82Rb Constant-Activity Elutions
Since this project was started, the RbES has been used in several studies which are in
their initial phase. Some of the relevant initial results are included here to demonstrate the
benefits of the constant-activity rate
82
Rb elutions. All the studies mentioned within have
been conducted with approval of the University of Ottawa Heart Institute Research Ethics
Board.
Comparison of 82Rb and 13N-ammonia for Measurement of Perfusion in 3D PET
With the RbES capable of producing constant-activity elutions, one can address the
larger issue: “Do constant-activity elutions of
similar quality to those obtained using
13
82
Rb enable perfusion measurements with
N-ammonia?” Although this question is not
addressed fully within the scope of this work, some indication can be seen from preliminary
results of ongoing studies using the RbES.
Of the patients that underwent 82Rb perfusion scans at the UOHI Cardiac PET Center,
14 subjects participated in a comparative study of
82
Rb and
13
N-ammonia perfusion
measurement. These (normal) volunteers have low risk of cardiac disease and were scanned
124
82
Rb Elution System Control
Ran Klein, University of Ottawa
using both tracers and under similar conditions of rest and dipyridamole induced stress of the
heart. Dipyridamole increases myocardial blood flow through dilation of the coronary
arteries. The study is planned to continue with additional normal volunteers, as well as
subjects with coronary artery disease (CAD).
As the tracer is introduced to the patient through an injection into the hand, it passes
through the right ventricle of the heart, the lungs, and to the left ventricle of the heart.
Dynamic imaging of the left ventricle blood cavity allows measurement of the blood activity
before significant tracer uptake is experienced in the myocardium. If the blood activity
curves in the LV cavity using both tracers have a similar shape it can be concluded that the
tracers were introduced at a similar rate and that the subsequent perfusion measurement is
conducted under similar conditions for both tracers.
The subjects were scanned on two occasions less than two weeks apart. On each
occasion either a 13N-ammonia or 82Rb (constant-activity using HC-TC) perfusion scan was
conducted under rest and stress condition. In total, four scans were performed on each patient
with 220 MBq introduced over 30 s. The studies were performed with a Siemens/CTI ART
3D scanner using a dynamic protocol with time frames as shown in Table 5-6. The
13
N-
ammonia acquisition was over a longer time since the slower decay permits longer uptake
measurements.
Table 5-6 - Dynamic scan time frame durations for 82Rb and 13N-ammonia perfusion measurements.
82
Rb dynamic scan time frames
12 x 10 s
2 x 30 s
1 x 60 s
1 x 120 s
1 x 240 s
Total Scan Time
10 min
13
N-ammonia dynamic scan time frames
12 x 10 s
2 x 30 s
1 x 60 s
1 x 120 s
1 x 240 s
2 x 300 s
20 min
Figure 5-17 gives results from a representative study, showing a comparison of blood
activity vs. time curves under both rest (left) and stress (right) conditions. The curves are
shift corrected to minimize the mean-squared-error and are corrected for the activity decay of
each tracer. In addition, the curves are normalized by the peak activity. The blood curves in
this case are similar in shape and magnitude.
125
Rb Elution System Control
Rest Study
1
Measured Counts (Bq/cc)
Ran Klein, University of Ottawa
0.9
0.9
0.8
0.8
0.7
0.6
0.5
RMS=0.38482
0.4
0.3
0.2
ammonia
rubidium
0.1
0
0
0.5
1
Stress Study
1
Measured Counts (Bq/cc)
82
0.7
0.6
0.5
RMS=0.53891
0.4
0.3
0.2
ammonia
rubidium
0.1
0
1.5
Time (min)
0
0.5
1.5
1
Time (min)
Figure 5-17 – Represantative graph of 82Rb and 13N-ammonia activity concentration in the blood over
time for the same patient show similar curves. Left is under rest condition, while Right is under
dipyridamole induced stress condition.
The variation in blood activity vs. time curve shapes using constant-activity
82
Rb is
similar to intra-patient variations for repeated ammonia studies. The key benefit appears to
be that the intra-patient blood activity curve with constant-activity
82
Rb studies is less
variable than with constant-time elutions. The reason is that the activity rate profiles using
constant-activity elution are similar regardless of the generator age.
Optimized Perfusion Measurements
A second study being performed at UOHI aimed to create more controlled
experimental conditions by performing the studies in dogs. PET images of dogs are higher
quality than those of humans as the small tissue mass introduces less attenuation and scatter.
The entire procedure is carried out with the dog under full anaesthesia and respiratory
monitoring. As with the human study, perfusion scans were conducted under rest and
dipyridamole induced stress condition using constant-activity 82Rb.
During a rest study the activity (40-300 MBq) and the duration (15-240 s) of the
PCC-PWM elutions were varied in order to assess the variation in perfusion measurements.
If the tracer kinetic model is accurate, one would expect similar perfusion measurements
126
82
Rb Elution System Control
Ran Klein, University of Ottawa
regardless of these parameters. The results in Table 5-7 confirm this expectation as the
standard deviation in perfusion measurements (average across entire LV) is 8.1%. These
results are well within range of typical test-retest variability (~15%) using constant-time
elutions.
Variable Activity (time = 30 s)
Relative Median Perfusion (ml/min/g)
Activity [n=2x576]
9.1%
0.57
17.0%
0.60
34.0%
0.64
68.0%
0.64
Activity
(MBq)
40
75
150
300
Variable Time (Activity = 150 MBq)
Time (s)
Median Perfusion (ml/min/g)
[n=2x576]
15
0.68
30
0.63
60
0.60
120
0.59
240
0.67
Table 5-7 – Rest study results comparing perfusion measurements in a dog at varied 82Rb constantactivity elution time durations and activities show that similar results are obtained regardless of these
elution parameters.
5.9
Critical Analysis and Future work
Although experience with the system instilled confidence in its design, the self-tuning
algorithm seems to be the potential weak point in the entire PCC-PWM control concept. The
main concern is that repeated elutions at a given relative activity rate may result in model
parameters that are not suited to other relative activity rates. While there is no evidence to
suggest that this is the case, the system has not been used over a long period needed to reach
a firm conclusion. Several alternatives to the self-tuning algorithm may be considered in the
future:
1.
Abandoning the PCC-PWM algorithm in favour of the simpler but less
precise threshold comparison algorithm.
2.
Removal of the self-tuning algorithm, leaving maintenance of the model
parameters at the hands of the operators.
3.
Continued research into development of an improved model and tuning
algorithm.
4.
Seeking of a variable flow ratio valve that better meets the requirements for
this problem. Namely the valve must be fast, robust, accurate, and simple to
integrate with the system.
127
82
Rb Elution System Control
Ran Klein, University of Ottawa
Of these options, a decision for future steps must be made based on various
considerations and how they are weighed. If precision is a crucial factor, reverting to the
threshold comparison controller is unacceptable as the comparison of the two approaches
clearly indicates that the PCC-PWM has more desirable characteristics. Whether or not
precision is crucial remains to be determined as the comparative perfusion study continues.
Replacing the self-tuning algorithm with free parameters that can be set by the
operator is an unlikely option, as this would entail thorough understanding of the system by
the technologists. A poor selection of model parameters could result in undesirable activity
profiles.
In order to improve precision while maintaining complete automatic tuning of the
system, it is most likely that further research is required. First and foremost this research
would need to better assess the automatic-tuning performance of the current implementation.
Part of this assessment should be selection of the learning parameters γL, γG, and γR to
improve the learning rate while maintaining a reasonable immunity to abnormal elution
results. Further experience with the existing system will indicate if additional development is
required, and would also serve as a benchmark to which other improvements could be
compared.
Other models and tuning techniques could also be considered. Further research could
look at a model that better describes the valve response than the sigmoid-linear model does.
Alternatively, a simpler model that can be tuned with fewer parameters (even if less
characteristic of the true response) can be sought. Since the desired flow ratios typically fall
within the 25-100% range, there is no need to model the entire dynamic range of the valve.
A final possibility is searching for or developing a valve that can accurately control
the valve flow ratio directly. If this were the case, modeling and tuning of the valve response
could possibly be avoided or simplified. Such a valve would require a fast response time
enabling to fully open and close within a fraction of a second. In addition, the valve would
have to be sufficiently precise so that fine changes in flow ratio could be generated. Finally
the valve would have to be simple enough in design so as to ensure a high degree of
reliability while making integration into the current system easily achievable.
128
82
Rb Elution System Control
Ran Klein, University of Ottawa
Of these considerations it seems that the most benefit could be gained for the least
effort by revaluating the range of readily available flow control valves. However, if an
alternative to the current two-way pinch valve is still not feasible, it appears that further
research and development of the valve response model and its self-tuning algorithm is the
most promising route for future improvement of the RbES.
129
82
Rb Elution System Control
Ran Klein, University of Ottawa
Chapter 6: Conclusion
This thesis describes the development of the
82
Rb Elution System (RbES) as a
complete system to automatically administer precise amounts of
82
82
Rb activity from a
82
Sr/ Rb generator for use as a perfusion tracer in PET. This work describes the system
hardware, which for the most part was handed down from previous work [18,20], and the
complete development of the software. Much of the work focuses on development of a
control system that can directly administer a constant rate of activity to the patient despite
variation in activity concentration from the
82
Sr/82Rb generator as a function of time and
eluted volume.
Analysis of the system model is based on comparison to an external dose calibrator.
Both calibration results and elution tests confirm that the system model is sufficiently
accurate for predicting the activity delivered to the patient based on the on-board positron
counter readings. This result is important not only to patient safety but also to system
precision.
The RbES has matured to the point where it can be routinely used in clinical studies.
This is reflected both by meeting of the design requirements, behaviour verification, and
system characterization. The testing includes not only functionality of the system under
ordinary conditions, but also in abnormal situations. The system is sufficiently automated
that no user intervention other than monitoring is required during an elution process.
Constant-activity elutions are implemented by controlling saline flow through the
generator or its bypass line (using an on/off solenoid valve) using two methods, which are
compared in chapter 5. The first method, hysteresis corrected threshold comparison (HCTC), modifies the previously published threshold comparison method [18] by correcting for
valve hysteresis. The second method cycles the solenoid valve and modulates the pulsewidth (PWM) in order to simulate a variable flow valve. A predictive-corrective control
(PCC) algorithm determines the desired flow ratio through the valve, which a valve response
model translates to a corresponding pulse-width.
The measured results demonstrate that the RbES using PCC-PWM can dramatically
improve the precision of constant-activity elutions over HC-TC if the valve response model
130
82
Rb Elution System Control
Ran Klein, University of Ottawa
is properly tuned. This is noted in the reduction of RMS error, as well as in reduction of
performance variability as the requested elution parameters change. However, this work does
not clearly determine if the proposed self-tuning algorithm is reliably effective during routine
clinical use. A clinical setting entails routine use of the system as desired by the clinical
application and does not include ad-hoc training sessions intended for tuning of the valve
response model. In this work, the training sessions span the entire dynamic range of
achievable relative activities forcing the self-tuning algorithm to converge to global nominal
values without biasing towards a specific range of relative activities. The risk of biasing the
model parameters is very real in a clinical setting as repeated elutions within a limited
relative activity range are likely.
Future work should focus on assessing long term reliability of the current
implementation. In particular the focus should be on the performance of the self-tuning
algorithm proposed in this work as well as potential alternatives. In addition, the sigmoidlinear model used to describe the valve response may prove to be overly complicated with
too many degrees of freedom. However, the need for a valve response model and self-tuning
algorithm may be completely avoided by seeking or developing a more suitable flow ratio
control mechanism. For example, a new valve may be found with linear response. If it is also
fast acting, simple to integrate and cost effective the problem can be significantly simplified.
For this reason, it is the recommendation of the author that a first step to future improvement
be research into a possible replacement for the generator valve that exhibits faster transition
response than the current model.
Additional work should concentrate of preparing the system for distribution to
external facilities by improving robustness and protection of intellectual property. This
would include transporting the software to a proven real-time operating system in place of
Microsoft Windows 98. In addition, the software should be compiled to binary code, which
would both hide the source code and simplify the system. Byte code would eliminate the use
of both the virtual machine and interpreter in the current application; thus reducing the
consumption of computer resources, and potentially improving the robustness of the system.
In contrast, the current market does not seem to justify the development of new hardware
components, confirming the decision to utilize off-the-shelf components.
131
82
Rb Elution System Control
Ran Klein, University of Ottawa
Current theories suggest that constant-activity elutions may indeed have a favourable
effect on quantitative perfusion measurement using PET. Preliminary studies at UOHI in a
dog demonstrate that similar measurements are obtained regardless of the amount of tracer
activity and elution duration in this mode. In a second experiment comparing 13N-ammonia
and
82
Rb as perfusion tracers in humans (both introduced at constant-activity rates),
preliminary results indicate that there is no significant difference in quantitative perfusion
measurements obtained using either tracer. If these results are confirmed through future
work, constant-activity
82
Rb elutions may serve as a cost effective alternative to
13
N-
ammonia for quantitative perfusion measurement using PET, which could offer cheaper
state-of-the-art diagnosis to a wider population.
132
82
Rb Elution System Control
Ran Klein, University of Ottawa
List of References
1.
S. R. Bergmann, B. E. Sobel, ”Positron Emission Tomography of the Heart”, Futura
Publishing Inc., 1992.
2.
I. Koike, M. Ohmura, M. Hata, N. Takahashi, T. Oka, I. Ogino, J. Lee, T. Umezawa,
K. Kinbara, K. Watai, Y. Ozawa, T. Inoue, “FDG-PET scanning after radiation can
predict tumor regrowth three months later”, Int. J. of Radiation Oncology Biology
Physics, Vol. 57, No. 5, p 1231-1238, 2003.
3.
J. N. Talbot. Y. Petegnief, K. Kerrou, F. Montravers, D. Grahek, N. Younsi, “Positron
emission tomography with [18F]-FDG in oncology”, Nucl. Inst. and Meth. in Phys.
Res., Section A: Accelerators, Spectrometers, Detectors and Associated Equipment,
Vol 504, No. 1-3, pp. 129-138, 2003.
4.
K. Mah, C. B. Caldwell, Y. C. Ung, C. E. Danjoux, J. M. Balogh, S. N. Ganguli, L. E.
Ehrlich, R. Tirona, “The impact of
18
FDG-PET on target and critical organs in CT-
based treatment planning of patients with poorly defined non-small-cell lung
carcinoma: a prospective study“, Int. J. of Radiation Oncology Biology Physics, Vol.
52, No. 2, pp. 339-350, 2002.
5.
R. S. Beanlands, “Positron emission tomography in cardiovascular disease”, Can. J.
Cardiology, Vol. 12, No. 10, pp. 875-883, 1996.
6.
M. R. Costanzo, S. Augustine, R. Bourge, el al., “Selection and treatment of candidates
for heart transplants”, Circulation, Vol. 92, pp. 3593-612, 1995.
7.
H. Schelbert, R. Bonow, E. Geltman, J. Maddahi, M. Schwaiger, “Position statement.
Clinical use of cardiac positron emission tomography”, Position paper of the
Cardiovascular Council of the Society of nuclear Medicine., J. Nucl. Med., Vol. 34, pp.
1385-8, 1993.
8.
K. Baete, J. Nuyts, W. Van Paesschen, P. Suetens, P. Dupont, “Anatomical-based
FDG-PET reconstruction for the detection of hypo-metabolic regions in epilepsy”,
IEEE Trans. on Med. Imag., Vol 23, No. 4, pp. 510-519, 2004.
133
82
Rb Elution System Control
9.
Ran Klein, University of Ottawa
J. S. Lee, D. S. Loo, S. K. Kim, S. K. Lee, J. K. Chung, M. C. Chul, K. S. Park,
“Localization of epileptogenic zones in F-18 FDG brain PET of patients with temporal
lobe epilepsy using artificial neural network” IEEE Trans. on Med. Imag., Vol. 19, No.
4, Apr, pp. 347-355, 2000.
10.
C. K. Yen, Y. Yano, T. F. Budinger, R. P. Friedland, S. E. Derenzo, R. H. Huesman,
H. A. O’Brien, “Brain tumor evaluation using Rb-82 and positron emission
tomography”, J. Nucl. Med,. 23(6), pp. 532-537, 1982.
11.
T. Jones, “Clinical Uses of 82Sr/82Rb Generators”, Appl. Radiat. and Isot., Vol 38, No
3, pp. 171-173, 1987.
12.
R. D. Finn, D. J. Schyler, “Production of Radionuclides for PET, Principals and
Practice of Positron Emission Tomography”, Lippincott Williams and Wilkins, p1:15,
2002.
13.
M. A. Green, “The potential for generator-based PET perfusion tracers”, J. Nucl. Med.,
Vol 31(10), pp. 1641-1645, 1999.
14.
M. R. Cackette, T.J. Ruth, J.S. Vincent, “82Sr production from metallic Rb targets and
development of an 82Rb generator system”, Appl. Radiat. Isot., Vol. 44, No. 6, pp. 917922, 1993.
15.
Y. Yano T. F. Budinger, G. Chiange, H. A. O’Brien, P. M. Grant, “Evaluation and
application of alumina-based Rb-82 generators charged with high levels of Sr-82/85”,
J. Nucl. Med., Vol 20, pp. 961-966, 1979.
16.
Y. Yano, “Essentials of a Rubidium-82 generator for nuclear medicine”, Appl. Radiat.
Isot., Vol 38, No 3, pp. 205-211, 1987.
17.
V. Dhawan, “Model for 82Sr/82Rb generator elution profiles: A second approach to
radiodosimetry”, Appl. Radiat. Isot., Vol. 38, No. 3, pp. 233-239, 1987.
18.
N. J. Epstein, A. Benelfassi, R. S. Beanlands, R. A. deKemp, “A 82Rb infusion system
for quantitative perfusion imaging in 3D PET”, App. Radiat. Isot, Vol. 60, pp. 921-7,
2004.
134
82
Rb Elution System Control
19.
Ran Klein, University of Ottawa
G. P. Gennaro, B. C. Bergner, P. S. Haney, R. H. Kramer, M. D. Loberg,
“Radioanalysis of 82Rb Generator Eluates”, Appl. Radiat. and Isot., Vol 38, No 3, pp.
219-225, 1987.
20.
N. J. Epsein, “Modeling and simulation of a rubidium-82 infusion system”, Internal
document at University of Ottawa Heart Institute Cardiac PET Unit, August 2001.
21.
K. L. Gould, “PET perfusion imaging and nuclear cardiology”, J. Nucl. Med., Vol.32,
pp. 579-606, 1991.
22.
L. Golanowski, R. A. deKemp, R. S. Beanlands, T. D. Ruddy 2000, “Variance and
covariance of
82
Rb kinetic parameters: computed simulations and dynamic PET
studies”, Proceeding of the 22nd annual EMBS International Conference, pp. 1096-99,
2000.
23.
W. J. Lin, R. R. Sciacca, R. L. Chou, A. F. Laine, S. R. Bergmann, “Quantification of
perfusion in human subjects using
82
Rb and wavelet-based noise reduction”, J. Nucl,
Med., Vol 42, pp. 201-208, 2001.
24.
K. Yoshida, N. Mullani, K. L. Gould, “Coronary flow and flow reserve by PET
simplified for clinical applications using rubidium-82 or nitrogen-13-ammonia”, J.
Nucl. Med., Vol 37, pp. 1701-1712, 1996.
25.
M. L. Beauchesne, T. D. Ruddy, R. A. deKemp, M. T. Aung, N. Levesque, T. AlvarezDiez, T. K. Vickers, B. A. Aubrey, R. S. B. Beanlands, “Reproducibility of myocardial
perfusion measurements with rubidium-82 PET imaging”, abstract Circulation 98, I222, 1998.
26.
R. A. deKemp, T. D. Ruddy, T. Hewitt, M. M. Dalipaj, R. S. B. Beanlands, “Detection
of serial changes in absolute myocardial perfusion with 82Rb PET”, J. Nucl. Med., Vol
41, pp. 1426-1435, 2000.
27.
R. R. Raylman, J. M. Caraher, G. D. Hutchins, “Sampling requirements for dynamic
cardiac PET studies using image-derived input functions”, J. Nucl. Med. Vol 34, pp.
440-447, 1993.
28.
D. L. Bailey, H. Young, P. M. Bloomfield, S. R. Meikle, D. Glass, M. J. Myers, T. J.
Spinks, C. C. Watson, P. Luk, A. M. Peters, T. jones, “ECAT – ART a continuously
135
82
Rb Elution System Control
Ran Klein, University of Ottawa
rotating PET camera: performance characteristics, initial clinical studies, and
installation considerations in a nuclear medicine department”, Eur. J. Nucl. Med., Vol
24(1), pp. 6-15, 1997.
29.
Y. Yano, J. L. Cahoon, T. F. Budinger, “Precision flow-controlled Rb-82 generator for
bolus or constant-infusion studies of the heart and brain”, J. Nucl. Med., Vol 22:11, pp.
1006-1010, 1981.
30.
T. M. Alvarez-Diez, R. A. deKemp, R. S. Beanlands, J. Vincent, “Manufacture of
strontium-82/rubidium-82 generators and quality control of rubidium-82 chloride for
myocardial perfusion imaging in patients using positron emission tomography”, Appl.
Radiat. Isot., Vol. 50, pp. 1015-1023, 1999.
31.
G. F. Knoll,”Radiation detection and measurement”, Second Edition, 1989 by John
Wiley and Sons, Inc. ISBN 0-471-81504-7.
32.
Matlab 6.5.1 User Manual: Real-Time Windows Target: Introduction: Real-Time
Kernel.
33.
A. P. Johnson, M. W. S. Macauley, “High precision timing within Microsoft Windows:
Threads, scheduling and system interrupts”, Microprocessors and Microsystems, Vol
25, No 6, pp. 297-307, 2001.
34.
University of Ottawa Heart Institute Investigator’s Report, 2003
35.
Capintec CRC-15R User Manual, Capintec Inc.
36.
“The American Heritage Dictionary of the English Language”, 3rd Edition, 1992 by
Houghton Mifflin Company. Provided through Microsoft Bookshelf, 1999.
37.
T. Imaizumi, O. Oyama, Yoshimitsu T., “Study of pneumatic servo system employing
solenoid valve instead of proportional valve by keeping the solenoid valve plunger to
be floating”, Flucom Symposium Proceedings, article 076, 2000.
38.
E. Kreyszig, “Advanced engineering mathematics” 8th edition, 1999, by John Wiley
and Sons, Inc. ISBN 0-471-15496-2.
39.
K. J. Astrom, B. Wittenmark, “Adaptive Control”, 2nd edition, Addison Wesley, 1995.
40.
K. S. Narendra, A. M. Annaswamy, “Stable Adaptive Systems”, Prentice Hall, 1989.
136
82
Rb Elution System Control
Ran Klein, University of Ottawa
Appendix A: Test Cases
Merge into here the report from the TestList Database.
137