1
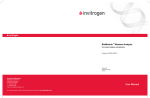
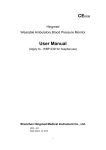
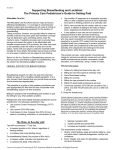
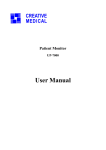
 HRV Live! Continuous Heart Rate Variability Monitoring System User’s Manual Version 1.2 Copyright © 2001‐2008 Biocom Technologies. All rights reserved. Biocom Technologies makes no claim that its products treat or heal. Biocom’s products are designed to measure and monitor physiological change. Professional should work within the scope of their licenses and/or certifications when interpreting or applying data derived from Biocom’s products. This product is to be used for research and educational purposes only. Biocom HRV Live! User’s Manual Table Of Contents Table Of Contents ............................................................................................................... 3 Credits ................................................................................................................................. 5 1. Introducing HRV Live! ..................................................................................................... 7 2. Scientific Background ...................................................................................................... 9 2.1. Physiological Basics ................................................................................................... 9 2.2. HRV Analysis ........................................................................................................... 11 2.3. Clinical Significance of HRV..................................................................................... 13 2.4. Methods of HRV Analysis ....................................................................................... 14 2.4.1. Time‐Domain HRV ............................................................................................ 14 2.4.2. Frequency‐domain HRV ................................................................................... 14 3. Starting HRV Live! ......................................................................................................... 17 4. Running New HRV Live! Session ................................................................................... 19 4.1. Proper Pulse Wave Sensor Placement And Use ..................................................... 19 4.2. Proper ECG Sensor Placement And Use ................................................................. 20 4.3. Starting New Session .............................................................................................. 21 4.4. Start physiological data recording .......................................................................... 22 4.5. Marking Data .......................................................................................................... 23 4.6. Finish Session Recording ........................................................................................ 24 4.7. View Selection ........................................................................................................ 25 4.8. Enlarging Windows ................................................................................................. 26 4.9. Graph Scales Adjustment ....................................................................................... 26 5. Viewing Session Reports ............................................................................................... 29 5.1 Viewing Session Data ............................................................................................... 29 5.2. View Selection ........................................................................................................ 30 5.3. Graph Scales Adjustment ....................................................................................... 32 5.4. Enlarging Windows ................................................................................................. 33 5.5. Event Markers and Picking Data ............................................................................. 33 5.6. Viewing HRV Profile ................................................................................................ 34 5.7. Generating an HRV Assessment Report ................................................................. 35 5.8. Editing Session Data ............................................................................................... 37 5.9. Navigating Through the Data.................................................................................. 39 5.10. Printing Reports .................................................................................................... 40 5.11. Selecting Other Sessions ....................................................................................... 40 5.12. Returning to the Main Menu ................................................................................ 40 7. Managing Clients ........................................................................................................... 41 7.1. Creating a New Client Record ................................................................................. 41 7.2. Selecting a Client Record ........................................................................................ 42 7.3. Edit Client Record ................................................................................................... 42 7.4. Delete Client Record ............................................................................................... 42 8. Managing Sessions ........................................................................................................ 45 Table of Contents ‐ 3 ‐ Biocom HRV Live! User’s Manual 8.1. Deleting Session Record ......................................................................................... 45 8.2. Importing Data as a New Session Record ............................................................... 46 8.3. Exporting Session Data ........................................................................................... 47 9. Managing Database ...................................................................................................... 51 9.1. Compacting Database ............................................................................................. 51 9.2. Backup database ..................................................................................................... 51 9.3. Restore database .................................................................................................... 52 10. Program Settings ......................................................................................................... 53 11. Using Help ................................................................................................................... 55 12. Exiting the HRV Live! ................................................................................................... 57 13. Technical Support ....................................................................................................... 59 Table of Contents ‐ 4 ‐ Biocom HRV Live! User’s Manual Credits Software concept: • Vadim Pougatchev, M.D., Biocom Technologies • Yevgeniy Zhirnov, M.D., Ph.D., Biocom Technologies • Yevgeniy Gribkov, Ph.D., Biocom Technologies Software design and user interface: • Vadim Pougatchev, M.D., Biocom Technologies Programming: • Yevgeniy Zhirnov, M.D., Ph.D., Biocom Technologies • Yevgeniy Gribkov, Ph.D., Biocom Technologies Quality assurance: • Vadim Pougatchev, M.D., Biocom Technologies • Mark Ferris, BS, Biocom Technologies Authoring online help and user’s manual: • Vadim Pougatchev, M.D., Biocom Technologies • Anna Pougatcheva, Biocom Technologies • Yevgeniy Zhirnov, M.D., Ph.D., Biocom Technologies Credits ‐ 5 ‐ Biocom HRV Live! User’s Manual Credits ‐ 6 ‐ Biocom HRV Live! User’s Manual 1. Introducing HRV Live! Most known existing HRV measurement tools available at this time have the capability to measure short‐term HR data and provide further static assessment. Each assessment provides information on what happened at a certain point in time without any consideration for the dynamics of physiological changes reflected in HRV. HRV Live! represents a new approach in HRV evaluation that is performed repetitively and continuously over extended periods of time. A standard 5‐minute time window is used for such HRV evaluation, which is continuously updated every half a second. A robust method of real‐time HR data evaluation and artifact detection is implemented to ensure reliability of HRV data. The use of a new auto‐regression method of power spectrum calculation allows for a fast and reliable early detection of transitory processes caused by various interventions. This tool is especially effective when a variety of effects are examined. For example, when performing tests for specific allergies or toxins, various substances have to be tested with regard to what kind of autonomic response they create. Having ability to detect sudden changes in autonomic balance provides an opportunity to reliably detect agents that cause such allergic reactions by means of affecting the autonomic balance. When monitoring HRV changes, multiple time markers can be posted along with recorded data. When HRV data is reviewed, multiple comparisons of the data associated with those time markers can be performed. Introducing HRV Live! ‐ 7 ‐ Biocom HRV Live! User’s Manual Introducing HRV Live! ‐ 8 ‐ Biocom HRV Live! User’s Manual 2. Scientific Background 2.1. Physiological Basics The origin of heartbeat is located in a sino‐atrial (SA) node of the heart, where a group of specialized cells continuously generates an electrical impulse spreading all over the heart muscle through specialized pathways and creating process of heart muscle contraction well synchronized between both atriums and ventricles. The SA node generates such impulses about 100 – 120 times per minute at rest. However, in a healthy individual, the resting heart rate (HR) would never be that high. This is due to continuous control of the autonomic nervous system (ANS) over the output of SA node activity. Its net regulatory effect gives real HR. In a healthy subject at rest, it ranges between 60 and 80 beats per minute. Fig. 2.1. Phases of electrical impulse propagation The autonomic nervous system is a part of the nervous system that non‐voluntarily controls all organs and systems of the body. As the other part of nervous system ANS has its central (nuclei located in brain stem) and peripheral components (afferent and efferent fibers and peripheral ganglia) accessing all internal organs. There are two branches of the autonomic nervous system ‐ sympathetic and parasympathetic (vagal) nervous systems that always work as antagonists in their effect on target organs. For most organs including heart, the sympathetic nervous system stimulates organ’s functioning. An increase in sympathetic stimulation causes an increase in HR, stroke volume, systemic vasoconstriction, etc. In contrast, the parasympathetic nervous system inhibits functioning of those organs. An increase in parasympathetic stimulation causes a decrease in HR, stroke volume, systemic vasodilatation, etc. Scientific Background ‐ 9 ‐ Biocom HRV Live! User’s Manual Fig. 2.2. Autonomic nervous system chart A heart response time to sympathetic stimulation is relatively slow. It takes about 5 seconds to increase HR after actual onset of sympathetic stimulation and almost 30 seconds to reach its peak steady level. The heart’s response to parasympathetic stimulation is almost instantaneous. Depending on actual phase of heart cycle, it takes just 1 or 2 heartbeats before heart slows down to its minimum proportional to the level of stimulation. At rest, both sympathetic and parasympathetic systems are active with parasympathetic dominance. The actual balance between them is constantly changing in attempt to achieve optimum considering all internal and external stimuli. There are various factors affecting autonomic regulation of the heart, including but not limited to respiration, thermoregulation, humoral regulation (rennin‐angiotensin system), blood pressure, cardiac output, etc. One of the most important factors is blood pressure. There are special baroreceptive cells in the hear and large blood vessels that sense blood pressure level and send afferent stimulation to central structures of the ANS that control HR and blood vessel tonus primarily through sympathetic and somewhat parasympathetic systems forming continuous feedback dedicated to maintain systemic blood pressure. This mechanism is also called baroreflex, which Scientific Background ‐ 10 ‐ Biocom HRV Live! User’s Manual increases HR when blood pressure decreases and vice versa. This mechanism is also targeted to maintain optimal cardiac output. Fig. 2.3. Autonomic regulation of the heart rate 2.2. HRV Analysis The heart rate variability analysis is a powerful tool in assessment of the autonomic function. It is an accurate, reliable, reproducible, yet simple to measure and process. The source information for HRV is a continuous beat‐by‐beat measurement of interbeat intervals. The electrocardiograph (ECG or EKG) is considered as the best way to measure interbeat intervals. ECG is an electrical signal measured with special conductive electrodes placed on chest around heart area or limbs. It reflects minute changes in electrical field generated by heart muscle cells originating from its SA node. ECG signal has a very specific and robust waveform simple to detect and analyze. Because of that cardiac rhythm derived from ECG is the best way to detect not only true sinus rhythm but all types of ectopic heartbeats, which must be excluded from consideration of HRV analysis. Scientific Background ‐ 11 ‐ Biocom HRV Live! User’s Manual Fig. 2.4. Normal heartbeat interval detection The other approach to measuring cardiac intervals is a measurement of pulse wave. It is a less invasive and simple method of measurement based on photoplethysmograph (PPG). PPG is a signal reflecting changes in a blood flow detected when infrared light is emitted towards microcirculatory blood vessels. Depending on blood flow volume certain portion of that light is absorbed letting other part to pass or b reflected. An optical sensor detects a quantity of light passed (or reflected from) the blood flow producing a waveform identifying pulse wave. Such waveform can also be processed to derive beat‐by‐beat interbeat intervals. Although PPG gives the summary information reflecting both cardiac and blood vessel components of HRV, some research studies showed a significantly high correlation between interbeat interval data measured by both ECG and PPG in short‐term steady‐state recordings. One of the important issues when measuring either ECG or PPG is the absence of abnormal heartbeat used in interval detection. Only heartbeats originated in SA node can be processed to obtain HRV data. Whether there are ectopic heartbeats (PVCs or other types of extrasystolic heartbeats) or various movement artifacts on ECG (or PPG) considered as heartbeats, they must be excluded from consideration. There are various statistically‐based algorithms of detection of such abnormal heartbeats that minimize chances to get contaminated HR recordings. Nevertheless, for the sake of accuracy in HRV analysis it is important to be able to visually verify all heartbeats automatically found, remove abnormal ones and include missing. Scientific Background ‐ 12 ‐ Biocom HRV Live! User’s Manual Fig. 2.5. Abnormal heartbeat detection 2.3. Clinical Significance of HRV It is found that lowered HRV is associated with aging, decreased autonomic activity, hormonal tonus, specific types of autonomic neuropathies (e.g. diabetic neuropathy) and increased risk of sudden cardiac death after acute MI. Other research indicated that depression, panic disorders and anxiety have negative impact on autonomic function, typically causing depletion of parasympathetic tonus. On the other hand an increased sympathetic tonus is associated with lowered threshold of ventricular fibrillation. These two factors could explain why such autonomic imbalance caused by significant mental and emotional stress increases risk of acute MI followed by sudden cardiac death. Aside from that, there are multiple studies indicating that HRV is quite useful as a way to quantitatively measure physiological changes caused by various interventions both pharmacological and non‐pharmacological during treatment of many pathological conditions having significant manifestation of lowered HRV. However it is important to realize that clinical implication of HRV analysis has been clearly recognized in only two medical conditions: 1. Predictor of risk of arrhythmic events or sudden cardiac death after acute MI. 2. Clinical marker of diabetic neuropathy evolution. Nevertheless, as the number of clinical studies involving HRV in various clinical aspects and conditions grows, HRV remains one of the most promising methods of investigating general health in the future. Scientific Background ‐ 13 ‐ Biocom HRV Live! User’s Manual 2.4. Methods of HRV Analysis Short‐term HRV analysis requires much shorter recordings – typically 5‐min long. However such recordings are assumed to be done at steady‐state physiological condition and should be properly standardized to produce comparable data. Typically, such measurements should be done in either supine or comfortably sitting relaxed position, limiting body movements, conversations, any mental activities. According to the standards set forth by the Task Force of the European Society of Cardiology and North American Society of Pacing and Electrophysiology in 1996, there are two methods of analysis of HRV data: time‐ and frequency‐domain analysis. In either method, the interbeat intervals should be properly calculated and any abnormal heartbeats found. 2.4.1. Time‐Domain HRV Time‐domain measures are the simplest parameters to be calculated. Before such calculation, all abnormal heartbeats and artifacts must be removed from consideration. The following time‐domain parameters can be calculated for short‐term recordings: • Mean HR, • Mean NN • SDNN • RMS‐SD Some extra parameters can be calculated specifically for long‐term recordings. The time‐domain parameters are associated mostly with overall variability of HR over the time of recording, except RMS‐SD, which is associated with fast (parasympathetic) variability. 2.4.2. Frequency‐domain HRV A standard spectral analysis routine is applied to such modified recording and the following parameters evaluated on 5‐min time interval: • Total Power (TP) • High Frequency (HF) Scientific Background ‐ 14 ‐ Biocom HRV Live! User’s Manual •
•
•
•
•
Low Frequency (LF) Very Low Frequency (VLF) LF/HF Ratio Normalized High Frequency (HFnorm) Normalized Low Frequency (LFnorm) When long‐term data is evaluated an additional frequency band is derived – Ultra Low Frequency. The HF power spectrum is evaluated in the range from 0.15 to 0.4 Hz. This band reflects parasympathetic (vagal) tone and fluctuations caused by spontaneous respiration known as respiratory sinus arrhythmia. The LF power spectrum is evaluated in the range from 0.04 to 0.15 Hz. This band can reflect both sympathetic and parasympathetic tone. The VLF power spectrum is evaluated in the range from 0.0033 to 0.04 Hz. The physiological meaning of this band is most disputable. With longer recordings, it is considered to represent sympathetic tone as well as slower humoral and thermoregulatory effects. There are some findings that in shorter recordings VLF has fair representation of various negative emotions, worries, rumination etc. The TP is a net effect of all possible physiological mechanisms contributing in HR variability that can be detected in 5‐min recordings, however sympathetic tone is considered as a primary contributor. The LF/HF Ratio is used to indicate balance between sympathetic and parasympathetic tone. A decrease in this score might indicate either increase in parasympathetic or decrease in sympathetic tone. It must be considered together with absolute values of both LF and HF to determine what factor contributes in autonomic disbalance. Scientific Background ‐ 15 ‐ Biocom HRV Live! User’s Manual Scientific Background ‐ 16 ‐ Biocom HRV Live! User’s Manual 3. Starting HRV Live! Double‐click this shortcut icon on the desktop screen to start the HRV Live! software. Once the software is loaded, the following view opens: Use the top, main menus and the tool bar commands to perform operations you need. Starting HRV Live! ‐ 17 ‐ Biocom HRV Live! User’s Manual Starting HRV Live! ‐ 18 ‐ Biocom HRV Live! User’s Manual 4. Running New HRV Live! Session The HRV Live! measures heart rate data deriving it from either pulse wave or ECG signal. 4.1. Proper Pulse Wave Sensor Placement And Use With the HRV Live! you can record heart rate data using Biocom HRM‐02 pulse wave sensor with an ear‐clip probe. The device has a small plastic box with a long USB cable and round stereo‐type jack connector. A separate ear‐clip sensor probe is connected to the device box. Connect the device USB cable to any USB port in the computer. The software will detect it automatically. Place an ear‐clip on the left or right ear lobe. Make sure it is placed so that small glass windows on the inside surfaces of the clip are in good contact with soft tissue of the ear lobe. Be aware that proper placement will affect the quality of pulse wave signal. Small ear lobes or earrings may make placement more difficult. In some cases when earlobe placement does not give good pulse wave signal the ear‐
clip can be placed on a finger. Running New HRV Live! Session ‐ 19 ‐ Biocom HRV Live! User’s Manual 4.2. Proper ECG Sensor Placement And Use With the HRV Live! you can record heart rate data using Biocom 4000 ECG Recorder device. The device has a small plastic box with a long USB cable. Two large round electrodes are attached to the bottom side of the box. Another lead wire comes out of the box and ends up with a third large round electrode pad. Connect the device USB cable to any USB port in the computer. The software will detect it automatically. It is recommended to wipe the surfaces of all three round electrodes with rubbing alcohol before electrode placement. Put two elastic wristbands on both wrists. Running New HRV Live! Session ‐ 20 ‐ Biocom HRV Live! User’s Manual Place the device box on the left wrist underneath the wristband so that two round electrodes on the bottom side of the box make contact with skin. Put the box along the arm so that both USB and lead wire cables are oriented towards the palm. Place the plastic electrode pad of the lead wire on the right wrist underneath the wristband so that large round electrode makes contact with skin. Put the electrode pad on the arm so that lead wire cable is oriented towards the palm. 4.3. Starting New Session Click this button to start a new HRV Live! session. The following view will open: Running New HRV Live! Session ‐ 21 ‐ Biocom HRV Live! User’s Manual This default view includesg the following windows: • Heart rate graph (top). •
ECG (or pulse wave) graph (bottom). The heart rate graph displays instantaneous changes in heart rate, updated every 0.5 seconds. The ECG graph is updated 256 times per second. It displays live electrocardiograph signal. If pulse wave device is used the bottom window displays the pulse wave signal being updated 64 times per second. It is helpful to observe the raw signal to be sure that electrode pads or ear‐clip are placed appropriately. Once the signal becomes regular, you may begin recording data. 4.4. Start physiological data recording If pulse wave signal is being monitored, observe the pulse wave signal scrolling in the bottom window to make sure that the sensor is placed correctly. When placement is correct, you should see a smooth signal with periodic peaks: Running New HRV Live! Session ‐ 22 ‐ Biocom HRV Live! User’s Manual Here is an example of poor pulse wave sensor placement: When you see this happening, reposition the sensor until you see the clear pulse waves. Then restart the current session to get rid of the data containing poor quality signal. If you are using an ECG recorder, make sure that ECG signal has a regular waveform and is free of noise and movement artifacts. When ECG electrode placement is correct, you should see an ECG signal trace looking like this: Once you get good signal, click this button to begin data recording. If during data recording the signal becomes inappropriate and good heart rate data cannot be obtained, you must restart the session. Click this button to restart the session. 4.5. Marking Data While the session is being recorded, you may create event markers for pieces of data you wish to highlight and review later. Click this button to create a marker. This will create a new event marker automatically time stamped and the following dialog box will open: Running New HRV Live! Session ‐ 23 ‐ Biocom HRV Live! User’s Manual Select the appropriate time from the dropdown menu if it is not already selected. You may also enter a text comment what will be associated with the event marker just created. Press “OK” to save marker. A vertical line will appear on the Heart Rate graph, as shown below: 4.6. Finish Session Recording You may stop the current session at any time by clicking the “Stop” button. Running New HRV Live! Session ‐ 24 ‐ Biocom HRV Live! User’s Manual You will be prompted to confirm termination of the data recording. Click “Yes” to confirm finishing data recording. The following dialog box will open: Select the appropriate client’s name from the list. If you do not have your client name in the list, create a new client record by clicking the “New Client” button and filling out a special form. Click “Yes” button to save the session data. Once recorded data is saved a confirmation message will open: 4.7. View Selection The HRV Live! software provides several view options to be displayed during data recording. You can select view from the drop‐down list on the top toolbar: Running New HRV Live! Session ‐ 25 ‐ Biocom HRV Live! User’s Manual 4.8. Enlarging Windows Each view may consist of several display windows. Each window can be selected by clicking into the window area. The selected window has an alternative background color different from the color of unselected windows. Click this button to enlarge the selected window to the size of entire view. Click it again to return to the normal size of window in the multi‐window view. 4.9. Graph Scales Adjustment To change the settings of a specific window, you must first click inside the window which you wish to adjust. Once you have done so, the appropriate adjustment controls become available. Use the Time dropdown menu to adjust the time interval for which data is displayed at any given time. Specific time intervals depend on which window you choose to adjust. Use the Gain dropdown menu to adjust an amplitude axis of the selected graph. Selecting a smaller gain value will allow you to stretch the graph, while selecting a larger gain value would compress the graph. Use the Offset dropdown menu to adjust the offset (or origin) of the graph, which positions the current range within the full range of possible signal values. For instance, the full range of heart rate is between 30 and 150 beats per minute. The current range Running New HRV Live! Session ‐ 26 ‐ Biocom HRV Live! User’s Manual might be 40 with an offset at 50. It could give a scale between 50 and 90 beats per minute. Running New HRV Live! Session ‐ 27 ‐ Biocom HRV Live! User’s Manual Running New HRV Live! Session ‐ 28 ‐ Biocom HRV Live! User’s Manual 5. Viewing Session Reports 5.1 Viewing Session Data Once session data is saved you can review it at any time. Click this button to review session data. The following dialog box will open: Select the session you wish to review and click OK. The following view will open: Viewing Session Reports ‐ 29 ‐ Biocom HRV Live! User’s Manual This is the default “Edit Raw Data” view. It is designed to edit recorded heart rate data to ensure the absence of abnormal HR readings in further HRV assessments. 5.2. View Selection You may choose different views to review your session data. Use the following “Screen” dropdown menu to select different view options: The following view options can be selected: Viewing Session Reports ‐ 30 ‐ Biocom HRV Live! User’s Manual Viewing Session Reports ‐ 31 ‐ Biocom HRV Live! User’s Manual 5.3. Graph Scales Adjustment To change the settings of a specific window, you must first click inside the window which you wish to adjust. This will make the appropriate adjustment controls available. Viewing Session Reports ‐ 32 ‐ Biocom HRV Live! User’s Manual Use the Time dropdown menu to adjust the time interval for which data is displayed at any given time. Specific time intervals depend on which window you choose to adjust. Use the Gain dropdown menu to adjust an amplitude axis of the selected graph. Selecting a smaller gain value will allow you to stretch the graph, while selecting a larger gain value would compress the graph. Use the Offset dropdown menu to adjust the offset (or origin) of the graph, which positions the current range within the full range of possible signal values. For instance, the full range of heart rate is between 30 and 150 beats per minute. The current range might be 40 with an offset at 50. It could give a scale between 50 and 90 beats per minute. 5.4. Enlarging Windows Each view may consist of several display windows. Each window can be selected by clicking into the window area. The selected window has an alternative background color different from the color of unselected windows. Click this button to enlarge the selected window to the size of entire view. Click it again to return to the normal size of window in the multi‐window view. 5.5. Event Markers and Picking Data HRV Live! lets you choose segments of data of preset length to obtain short‐term HRV data sets derived from those segments. This can be done by means of setting special data pickers. Viewing Session Reports ‐ 33 ‐ Biocom HRV Live! User’s Manual As it was described above special event markers can be created during the session recording. These event markers also serve as preset data pickers. You may create new data pickers as many as you need while viewing session data. To select any existing event marker, just click the vertical line associated with event marker you need. The selected marker line will turn red. Click this button to create a new data picker while reviewing the session data. A new red vertical line marker will appear in the HR data window. You may then drag this or any other marker anywhere on the time scale. The event markers created during the session recording can be moved as well – however, their original positions will be marked with a dashed line. Click this button to remove currently selected data picker or event marker displayed as a red vertical line. 5.6. Viewing HRV Profile HRV Live! records one session as a continuous block of raw signal (either ECG or pulse wave). A respective set of HR data is calculated out of the raw signal record. When it comes to calculate HRV data out of HR data series, a single set of HRV parameters is calculated off HR data segments of preset duration. 5‐min long data segments are most commonly used. When any HRV parameter (e.g. SDNN) is displayed as a graph, each value of it is derived from the block of HR data of preset size shifted every ½ second along the record. Viewing Session Reports ‐ 34 ‐ Biocom HRV Live! User’s Manual To obtain a full set of HRV parameters (called here as HRV Profile) derived from one data segment, data pickers / event markers are used. Each data picker / event marker determines the end of data segment of preset duration (e.g. 5‐min). To display HRV profile for specific data picker / event marker, select a respective vertical line by clicking on it (this should turn the line red). Click this button to display HRV profile in a popup window. Click the Close button to close this window. You can display as many HRV profiles as many data picker / event markers were created. 5.7. Generating an HRV Assessment Report Whenever there are two or more data pickers / event markers created during the session recording or viewing recorded data, you may view a special HRV assessment report, which gives you a comparison view of all created data pickers / event markers. Click this button to display HRV assessment report. Viewing Session Reports ‐ 35 ‐ Biocom HRV Live! User’s Manual Once this button is clicked, HRV profiles will be automatically calculated for all available data pickers / event markers and special comparison report generated: This report contains the following information: • Client personal information •
List of session comments associated with event markers created during the session •
Numerical table of all HRV parameters for all data pickers / event markers including their absolute values and % of change from reference point. •
Bar charts of absolute values of HRV parameters •
Bar charts of % of change values of HRV parameters A reference point is set to the first data picker / event marker by default. You can set reference point to any of the data picker / event marker available by means of the dropdown menu: Viewing Session Reports ‐ 36 ‐ Biocom HRV Live! User’s Manual Select an appropriate marker from the list and HRV assessment report will be properly adjusted, The assessment report is shown in a printer friendly multi‐page report format. 5.8. Editing Session Data Although the HRV Live! software has capability to automatically detect abnormal RR intervals and handle them properly to ensure valid HRV analysis in real time during the session recording as well as when reviewing the session record, the standards of HRV analysis suggest to provide means for manual editing of RR data. To edit recorded data select the “Edit raw data” view using a view selection dropdown menu: The Edit Raw Data view will open: Viewing Session Reports ‐ 37 ‐ Biocom HRV Live! User’s Manual The view is divided in two parts: Heart Rate data (top) and the ECG trace (bottom). It is very important to have heart rate recordings free of any abnormal readings to perform correct heart rate variability analysis! Unfortunately there might be various reasons for having unstable heart rate calculation like: • Improper sensor placement that produces weak or unstable signal; •
Body movements producing movement artifacts on raw signal; •
Ectopic heartbeats that cannot be involved into HRV evaluation. Using this view you may review the HR data and tag abnormal HR readings. The program displays a recorded ECG or pulse wave trace as a line graph and HR readings as big blue dots along the signal trace. Thus you can see whether HR reading was calculated properly. The normal heartbeat should be detected in the near proximity to the R‐peak (very sharp and narrow peak) on ECG trace or at the front (ascending) part of pulse wave and its value should not deviate from previous normal HR reading more than 30%. The software is capable of an automatic search of various types of abnormal heartbeats irrelevant to their cause. It is based on standard statistical procedure of exclusion of rough artifacts from data series. This procedure involves the following steps: 1. Linear trend is removed from HR data record. 2. Mean HR and standard deviation of HR (SD) are calculated). Viewing Session Reports ‐ 38 ‐ Biocom HRV Live! User’s Manual 3. Each HR reading is tested as belonging to the normal HR data pool based on Student t‐test. However this method only works if the number of artifacts found is a small part of entire data series, otherwise the results are not reliable and such HR data should not be evaluated for HRV at all. Once abnormal HR reading are automatically detected and toggled into an "abnormal" state marked with big red dot. If you see an abnormal peak marked with a blue dot, you can manually toggle it in “red” by double‐clicking the dot. If you see a normal R‐peak marked with a red dot, you can manually toggle it in “blue” by double‐clicking the dot. Any dot can be manually toggled to either state at any time. Click this button to save data when editing is finished. 5.9. Navigating Through the Data While viewing data, use the following navigation bar to scroll through the data. Click the “Begin” button to move to the beginning of the data record. Click the “Back” button to move one step backward through the data record. Click the “Next” button to move one step forward through the data record. Click the “End” button to move to the end of the data record. You can also use the “Prev” and ”Next” buttons to jump between data pickers / event markers if there are any. Viewing Session Reports ‐ 39 ‐ Biocom HRV Live! User’s Manual 5.10. Printing Reports Click this button to print content of the current view. If the current view is not a specially designed printable report a screen snapshot will be printed out. If printable report is displayed a multi‐page formatted report will be printed out. 5.11. Selecting Other Sessions Click this button to open a session selection dialog box described above. This will allow for quick access to other sessions stored in the currently opened or other client records. 5.12. Returning to the Main Menu Click this button to close current view and go back to the main program menu. Viewing Session Reports ‐ 40 ‐ Biocom HRV Live! User’s Manual 7. Managing Clients Click this button to select and manage client records. The following dialog box will open: 7.1. Creating a New Client Record Click the “New” button to create a new client record. The following client data entry dialog box will be shown: Managing Clients ‐ 41 ‐ Biocom HRV Live! User’s Manual Fill out all relevant data fields, then click OK button. The following fields are required: • Alias Name • First Name • Last Name • Date of Birth • Gender 7.2. Selecting a Client Record Certain operations with client records require selection of the client record. Such selection makes this record to be opened automatically. Select an appropriate client from the list, then click the ”Close” button if you wish just to open selected client record to run new session or view data previously recorded for this client. 7.3. Edit Client Record Select an appropriate client name from the list then click the “Properties” button. The client data entry dialog box will be shown. See the instructions given in the “Creating New Client Record” section on how to enter or modify client personal information. 7.4. Delete Client Record Select an appropriate client name from the list then click the “Remove” button to delete the selected client record. The following prompt to delete the client will open: Click the “Yes” button to confirm record deletion. Managing Clients ‐ 42 ‐ Biocom HRV Live! User’s Manual Note! Since client record keeps all session data associated with this client, all such session data will be permanently lost once the client record is deleted. Managing Clients ‐ 43 ‐ Biocom HRV Live! User’s Manual Managing Clients ‐ 44 ‐ Biocom HRV Live! User’s Manual 8. Managing Sessions Click this button to select and manage session records. The following dialog box will open: Select client name from the dropdown list to specify client record to open for further session 8.1. Deleting Session Record Select an appropriate session from the list then click the “Remove” button to delete the selected session record. The following prompt to delete the session will open: Click the “Yes” button to confirm record deletion. Note! Entire session record data will be permanently lost once the session record is deleted. Managing Sessions ‐ 45 ‐ Biocom HRV Live! User’s Manual 8.2. Importing Data as a New Session Record To import the HR data arranged as an ASCII file click the “ASCII Import” button. The following dialog box will open: Use the following steps to import the HR data: 1. Specify the data file to import from. Use the “File name” data entry field to specify exact location of the ASCII data file to import from. As an alternative and safer way to specify the file location click the “. . .” button to open a standard “Open File” dialog box. Managing Sessions ‐ 46 ‐ Biocom HRV Live! User’s Manual Use this dialog box to find the file to import data from then click the “Open” button. The “File name” data entry filed will be automatically populated. 2. Select the client name from the list to import data into. If there is no client record in the list, click the “New Client” button to create a new client record. This will enable a standard new client record creation procedure. 3. Click the “New Session” button to create a new session record to put the imported data into. This will automatically create a new session record, which will appear in the session list. 4. Select an appropriate (newly created) session from the list. Note! Make sure you select right session (typically a newly created empty record) from the list. If you select the record, which already has data in, then imported data will replace the existing data in this record! 5. Click the “Import” button to complete importing procedure. Click the “Exit” button to close this dialog box and return to the main menu. 8.3. Exporting Session Data This feature is very useful if you want to put selected session data into Excel for further manipulations with text and numerical data: formatting as custom reports, charting, basic statistics, etc. To export session into Excel sheet: 1. Select the “Data Export” option from the “Database” menu. The “Export Session Data” dialog box will open: Managing Sessions ‐ 47 ‐ Biocom HRV Live! User’s Manual 2. Select the “Excel File” option. 3. Specify the data file to export into. Use the “File name” data entry field to specify exact location of the data file to export to. As an alternative and safer way to specify the file location click the “...” button to open a standard “Save File” dialog box. Use this dialog box to specify the file name to export data into then click OK button. The “File name” data entry filed will be automatically populated. 4. Select an appropriate client name from the dropdown list. Use Select all client names checkbox if needed. 5. Select one session from the session list to be exported. Use Select all sessions checkbox if needed. 6. Set any of the following check‐boxes (Client Personal Info, HRV Parameters, Interbeat Intervals) to specify what session data will be exported into Excel sheet. Each selected component will be exported into a separate sheet combining all together a new workbook. 6. Click OK button. This will close current dialog box and opens the Microsoft Excel program with a new and empty workbook. The program will automatically fill out all created sheets with data Managing Sessions ‐ 48 ‐ Biocom HRV Live! User’s Manual being exported. Upon completion of the export process, Excel may suggest to save the current workbook. Specify any filename you want to keep this data in. Managing Sessions ‐ 49 ‐ Biocom HRV Live! User’s Manual Managing Sessions ‐ 50 ‐ Biocom HRV Live! User’s Manual 9. Managing Database The HRV Live! manages various types of data: client records, HRV sessions in fairly complex database format. Time to time you should do several procedures dealing with entire database. 9.1. Compacting Database While intensive use of the system a lot of database operations happen. Multiple records are created, accessed, modified and deleted. Because of that database files gradually grows and its internal structure loses its optimal organization. However there is a way to optimize a database file, which also causes its becoming more compact. To compact database, select “Compact” menu option from “Database” menu. The program automatically does this job. 9.2. Backup database It is very important to keep data safe. Time to time any trouble with computer happen, e.g. computer or hard disk crash. As many other software products HRV Live! offers Backup / Restore feature that allows to make a copy of entire database in a very convenient compressed format. It can be used to keep data copies just in case or to transfer entire data storage to another computer with ease. To backup entire database: 1. Select “Backup” menu item from “Database” menu. 2. The program prompts you with the question to perform backing up the database. Click “Yes” button. 3. Standard "Save As" dialog box opens to allow you to specify backup file name and its location. Managing Database ‐ 51 ‐ Biocom HRV Live! User’s Manual 4. Once the filename and location is specified, click “OK” button. 9.3. Restore database It is very important to keep data safe. Time to time any trouble with computer happen, e.g. computer or hard disk crash. As many other software products HRV Live! offers Backup / Restore feature that allows to make a copy of entire database in a very convenient compressed format. It can be used to keep data copies just in case or to transfer entire data storage to another computer with ease. To restore entire database: 1. Select “Restore” menu item from “Database” menu. 2. The program prompts you with the question to perform restoring up the database. Click “Yes” button. 3. Standard "Open" dialog box opens to allow you to specify backup file name and its location. 4. Once the filename and location is specified, click “OK” button. Managing Database ‐ 52 ‐ Biocom HRV Live! User’s Manual 10. Program Settings HRV Live! has a number of settings that are used by the program. All of them have certain preset values, which are determined when the software is installed. Sometimes, you need to modify any of them. Select the “Settings” menu option from the “Application” menu to access the program settings. The following dialog box will open: Use the “Data Acquisition Device” selector to choose a type of the device as a source of heart rate information. Use the “Select time frame for HRV analysis” selector to choose the size of data block to be analyzed to obtain a single HRV profile. Use the “Recalculation period (sec)” data filed to determine how often the HRV parameters will be recalculated during session recording. The default value is 0.5 sec. Use the “Automatically search for Biocom hardware” checkbox to enable an automatic search of the data acquisition device connected to your PC. Click OK button to save current program settings. Click “Cancel’ button to discard all changes made to these settings since the dialog box was opened. Program Settings ‐ 53 ‐ Biocom HRV Live! User’s Manual Program Settings ‐ 54 ‐ Biocom HRV Live! User’s Manual 11. Using Help HRV Live! has a built‐in help system. Click this button to access the program help information. The following help window will open: Use the table of contents in the left panel to access to specific help topics. Close the help window to return to the main program window. Using Help ‐ 55 ‐ Biocom HRV Live! User’s Manual Using Help ‐ 56 ‐ Biocom HRV Live! User’s Manual 12. Exiting the HRV Live! Click this button to close the HRV Live! program window. Exiting HRV Live! ‐ 57 ‐ Biocom HRV Live! User’s Manual Exiting HRV Live! ‐ 58 ‐ Biocom HRV Live! User’s Manual 13. Technical Support Customer Support Phone: Contact your local dealer Web‐site: www.biocomtech.com E‐mail: [email protected] Call your local dealer for: • System installation • Software installation • System troubleshooting • Hardware use • Software use According to our customer support policy we charge customers $60.00 an hour with $15.00 increments for all incoming calls and $75.00 an hour when we return calls. Each new customer has one hour of technical support free. If a computer and peripherals comply with our requirements and configured properly, there is enough time to get the system up and running within this hour. Any support related to hardware repair, accessories and supplies replacement is free of charge. Any reports on possible software bugs found, software comments and suggestions are more than welcome. Please send them to us by fax or e‐mail. Technical Support ‐ 59 ‐ Biocom HRV Live! User’s Manual Technical Support ‐ 60 ‐