1
PULSE OXIMETER CALIBRATOR
A Major Qualifying Project Report:
Submitted to the Faculty
Of the
WORCESTER POLYTECHNIC INSTITUTE
In partial fulfillment of the requirements for the
Degree of Bachelor of Science
by
________________________________
David Reid
________________________________
Heidi Robertson
________________________________
Matthew Sonntag
Submitted on:
April 29, 2011
Approved by:
_________________________________________________
Professor Yitzhak Mendelson, Advisor, Biomedical Engineering
Table of Contents
Authorship Page ............................................................................................................................................ 3
Acknowledgements ....................................................................................................................................... 4
Abstract ......................................................................................................................................................... 5
Table of Figures ............................................................................................................................................ 6
Table of Tables ............................................................................................................................................. 8
Executive Summary ...................................................................................................................................... 9
1.0
Introduction ..................................................................................................................................... 12
2.0
Literature Review............................................................................................................................ 13
2.1
Oximetry ..................................................................................................................................... 13
2.2
Pulse Oximetry............................................................................................................................ 13
2.3
Current Pulse Oximeter Calibrators ............................................................................................ 15
2.3.1
Mock Circulatory Systems .................................................................................................. 15
2.3.2
Basic Finger Models ........................................................................................................... 18
2.3.3
Electrical Simulators ........................................................................................................... 20
3.0
Design Approach ............................................................................................................................ 22
3.1
Initial Client Statement ............................................................................................................... 22
3.2
Revised Client Statement ............................................................................................................ 22
3.3
Device Requirements .................................................................................................................. 22
3.4
Device Objectives ....................................................................................................................... 23
3.5
Component Comparison ............................................................................................................. 24
4.0
Device Development ....................................................................................................................... 27
4.1
Design Alternatives ..................................................................................................................... 27
4.1.1
Mock Circulatory System ................................................................................................... 27
4.1.2
Wedge Model ...................................................................................................................... 29
4.2
Evaluation of Alternative Designs .............................................................................................. 34
4.2.1
Mock Circulatory System ................................................................................................... 34
4.2.2
Wedge Model ...................................................................................................................... 35
4.3
5.0
Design Selection ......................................................................................................................... 36
Current Design ................................................................................................................................ 38
5.1
Conical Core ............................................................................................................................... 38
5.2
Core Manufacturing .................................................................................................................... 45
1
5.3
Motor Systems ............................................................................................................................ 45
5.4
Base and Linkages Manufacturing .............................................................................................. 47
5.5
Programming............................................................................................................................... 48
5.6
Bill of Materials .......................................................................................................................... 51
6.0
Experimentation .............................................................................................................................. 52
6.1
Dye selection ............................................................................................................................... 52
6.2
Light Intensity ............................................................................................................................. 54
6.3
Device Testing ............................................................................................................................ 55
7.0
Results ............................................................................................................................................. 56
7.1
Device Alterations ...................................................................................................................... 56
7.2
Motor Functionality .................................................................................................................... 58
7.3
Pulse Oximeter Testing ............................................................................................................... 59
8.0
Discussion ....................................................................................................................................... 65
9.0
Conclusions ..................................................................................................................................... 66
10.0
Future Improvements ...................................................................................................................... 67
References ................................................................................................................................................... 68
Appendix A: CAD Models ......................................................................................................................... 69
Appendix B: Code....................................................................................................................................... 74
Section 1: ................................................................................................................................................ 74
Section 2: ................................................................................................................................................ 74
Section 3: ................................................................................................................................................ 74
Section 4: ................................................................................................................................................ 75
Section 5: ................................................................................................................................................ 76
Appendix C: Circuit Diagram ..................................................................................................................... 78
Appendix D: Schedule and Timeline of Project Tasks ............................................................................... 79
Appendix E: User Guide ............................................................................................................................. 82
2
Authorship Page
David Reid, Heidi Robertson, and Matthew Sonntag all contributed to the research and writing of
this report. The following is a breakdown of how the report was written for this project:
David Reid contributed to „Component Comparison‟, „Conical Core‟, „Experimentation‟, „Pulse
Oximeter Testing‟, and „Discussion‟ as well as provided editing and formatting support.
Heidi Robertson contributed to „Current Pulse Oximeter Calibrators‟, „Wedge Model‟,
„Evaluation of Alternative Designs‟, „Current Design‟, „Bill of Materials‟, „Device Alterations‟,
„Motor Functionality‟, „Appendix A‟, and „Appendix C‟ as well as provided editing and
formatting support.
Matthew Sonntag contributed to the „Introduction‟, „Mock Circulatory System‟, „Programming‟,
„Conclusions‟, „Future Improvements‟, „Appendix B‟, and „Appendix E‟ as well as provided
editing and formatting support.
In addition to writing individual sections of the report, David Reid, Heidi Robertson, and
Matthew Sonntag as a group established the „Design Approach‟, „Evaluation of Alterative
Designs‟, „Design Selection‟ and „Appendix D‟.
3
Acknowledgements
The design team would like to thank the following individuals and institution for their support
throughout the course of our Major Qualifying Project.
Professor Yitzhak Mendelson for his continual guidance and advice in all aspects of our
project.
Lisa Wall for her assistance in obtaining supplies for our design.
Professor Destin Heilman for his assistance in testing our dye substitutes.
Professor John McNeill for his help during light intensity testing.
Our peer consultants Andrew Nehring, Jeffrey O‟Rourke, Joe Amato, Daniel Jones and
Michael Fagan for their advice regarding the design, development, and manufacturing of this
project, as well as, our other peer consultants, Huan Lai, Jesse Basset and Kevin McManus
for their advice in the design of the python program.
Worcester Polytechnic Institute for providing funding and work space for our project.
4
Abstract
Initial calibration of pulse oximeters is conducted by inducing hypoxemia in healthy human volunteers to
obtain blood oxygenation levels as low as 70%. This method of calibration is expensive and time
consuming for pulse oximeter manufacturers. Eliminating the human element of calibration would reduce
overall cost and save time. An artificial system was developed to simulate blood oxygenation levels
between 70-100% and heart rate readings between 30-150 BPM. A programmed, motorized, dual-axis
system was designed to provide certain calibration values as specified by the user through a computer
interface. Tests conducted with the CMS50F Wrist Oximeter showed that values obtained from the
calibrator fall within ±4% oxygenation and ±3 BPM heart rate from that of the user defined values.
5
Table of Figures
Figure 1: Light absorption spectra of hemoglobin variants [6]................................................................... 13
Figure 2: Material within a finger showing arterial blood volume changing over time,
photoplethysmogram [6]. .......................................................................................................... 14
Figure 3: Normalized R ratio for oxygen saturation levels [6]. .................................................................. 15
Figure 4: Kent and Mendelson Finger model (a), mock circulatory system (b) [5]. .................................. 16
Figure 5: Diagram of double flow cell [7]. ................................................................................................. 17
Figure 6: Complete setup of the mock circulatory system by Oura et al. [7]. ............................................ 17
Figure 7: Reynolds et al. finger dock (a), mock circulatory system (b) [8]. ............................................... 18
Figure 8: Finger model squeeze ball pulsation mechanism cross-sectional view [9]. ................................ 19
Figure 9: Wedges in square formation (a), wedges of different sizes in a larger wedge formation
(b) [10]. ..................................................................................................................................... 19
Figure 10: Finger model with in and out motion (a), enclosed finger model with in and out motion
(b), finger model with rotating disk motion (c) [1]................................................................... 20
Figure 11: SmartSat by Clinical Dynamics [2]. .......................................................................................... 21
Figure 12: Kent and Mendelson mock circulatory system set up (a) [5], block diagram of mock
circulatory system (b). .............................................................................................................. 27
Figure 13: Reynolds et al. finger model side view (top) and top view (bottom) (a) [6], mock
circulatory finger model of similar design (side view) (b). ...................................................... 28
Figure 14: Wedges of 0% and 100% oxygenation with pulse oximeter probe attached showing
light path position and direction through wedges. .................................................................... 30
Figure 15: Light path (arrow) through wedges. Right side up view (a), upside down view (b). ................ 30
Figure 16: Outer frame and motor shaft (a), frame configuration attached to wedges (b). ........................ 31
Figure 17: Top view of wedges showing axis of rotation and the direction of wedge turning (a),
light path through wedges before and after wedge turning (b). ................................................ 31
Figure 18: Motor control system of oxygenation content and arterial pulsation simulation. ..................... 32
Figure 19: Pulse oximeter probe attachment to outer semi-transparent casing........................................... 32
Figure 20: Weighted objectives tree. .......................................................................................................... 36
Figure 21: Core filled with oxygenated liquid: Blue = lower oxygenation, Crimson = higher
oxygenation. ............................................................................................................................. 40
Figure 22: Example light path through core. .............................................................................................. 40
Figure 23: Sketch of the core design and CAD model isometric view. ...................................................... 42
Figure 24: Sketch of new core design and CAD model isometric view. .................................................... 44
Figure 25: Conical assembly with cap and bottom piece. ........................................................................... 45
Figure 26: Pulse Oximeter Calibrator Device. ............................................................................................ 47
Figure 27: GUI for Pulse Oximeter Calibrator ........................................................................................... 49
Figure 28: Spectrometer results of blue food coloring, green food coloring, and wild berry
pomegranate mix. ..................................................................................................................... 53
Figure 29: Example photodetector circuit to measure light intensity. ........................................................ 54
Figure 30: Four bar crank-slider linkage attached to servo ......................................................................... 56
Figure 31: New linkage using cam attached to servo wheel, top view (a), side view (b) ........................... 57
Figure 32: Center wall screw holes for stepper........................................................................................... 58
Figure 33: Finger dock support (a), finger dock additional wall (b). .......................................................... 58
6
Figure 34: Specified heart rate value vs measured BPM. ........................................................................... 59
Figure 35: Masimo Heart Rate Deviation. .................................................................................................. 60
Figure 36: PPG waveform of Device with CMS50F Pulse Oximeter. ....................................................... 60
Figure 37: CMS50F connected to device. ................................................................................................... 61
Figure 38: CMS50F connected to Human 1. .............................................................................................. 62
Figure 39: CMS50F connected to Human 2. .............................................................................................. 63
Figure 40: Oxygenation Deviation with CMS50F Pulse Oximeter. ........................................................... 64
Figure 41: Specified oxygenation value vs measured oxygenation. ........................................................... 64
Figure 42: Human PPG waveform. ............................................................................................................. 65
Figure A1: Original Full Device ................................................................................................................. 69
Figure A2: Adapted Full Device ................................................................................................................. 69
Figure A3: Original Base ............................................................................................................................ 70
Figure A4: Adapted Base ............................................................................................................................ 70
Figure A5: Servo Motor .............................................................................................................................. 71
Figure A6: Stepper Motor ........................................................................................................................... 71
Figure A7: Original servo attachment ......................................................................................................... 71
Figure A8: Adapted servo attachment to stepper shaft ............................................................................... 71
Figure A9: Cam for linear actuation ........................................................................................................... 71
Figure A10: Cam walls with guide grove and shaft hole ............................................................................ 71
Figure A11: Finger Dock ............................................................................................................................ 72
Figure A12: Conical device sectional view and side view ......................................................................... 72
Figure A13: Device with probe attachment over core ................................................................................ 72
Figure A14: Full device with probe attached and user interface................................................................. 73
Figure A15: Full device top view with probe attached and circuit connections ......................................... 73
7
Table of Tables
Table 1: Model design requirement comparison......................................................................................... 24
Table 2: Morphological Chart. .................................................................................................................... 25
Table 3: Numerical evaluation matrix. ....................................................................................................... 26
Table 4: Pair-wise comparison chart for design objectives. ....................................................................... 37
Table 5: Spectrometer results and calculated extinction coefficient. .......................................................... 53
Table D1: Gantt Chart B-term .................................................................................................................... 81
Table D2: Gantt Chart C-term .................................................................................................................... 81
Table D3: Gantt Chart D-term .................................................................................................................... 81
8
Executive Summary
Pulse oximeters are standard medical devices used for continuous patient monitoring of arterial oxygen
saturation (SpO2) and heart rate (HR). Initial calibration of pulse oximeters is conducted by inducing
hypoxemia in healthy human volunteers to obtain blood oxygenation levels as low as 70% and comparing
pulse oximeter measurements to that of a reference CO-oximeter. These data are used to determine
calibration coefficients and create a look-up table that is programmed into the pulse oximeter. This
method of calibration is expensive and time consuming for pulse oximeter manufacturers, and it is
required by the FDA in order to bring a new pulse oximeter to market. Eliminating the human element of
calibration would reduce overall cost and increase efficiency.
To eliminate the need for human volunteers, a calibration system was developed to simulate blood
oxygenation levels between 70-100% and heart rate readings between 30-150 BPM. This programmable,
motorized, dual-axis system was designed to provide certain calibration values as specified by the user
through a computer interface. Tests conducted with a portable pulse oximeter displayed oxygen saturation
values within ±5% and heart rate values within ±3 BPM from values defined by the user.
The team investigated previous pulse oximeter calibrators that were presented in journal articles and
patents. These models were categorized into three different types: finger models, mock circulatory
systems, and electrical simulators. Whole blood was generally used in the mock circulatory systems; the
use of blood is expensive and inefficient as it requires proper handling and preparation. Electrical
simulators were found incapable of performing the initial calibration of a pulse oximeter because they
depend on previously calibrated look-up tables for oxygenation values specific to pulse oximeter models.
A finger model design was found to be the most efficient and cost-effective design that can be used to
calibrate a pulse oximeter.
Simulation of heart rate was achieved by mimicking the 1-3% volumetric change of arterial blood
within a finger. Pulse oximeters measure the pulsatile volumetric change within the finger. To simulate
pulsations, a conical shape is actuated within the light path of the probe to increase and decrease the
volume of the simulated blood compartment.
Pulse oximeters determine SpO2 by measuring light intensity transmitted through tissue in the red and
infrared spectrum. The difference in absorbance of oxygenated hemoglobin (HbO2) and reduced
hemoglobin (Hb) in these spectra can be used to find the ratio of HbO2 and Hb (calculated as SpO2) in the
blood by comparing a normalized ratio of absorption at each of the two wavelengths. In this device the
ratio of light absorption was controlled by using two different concentrations of a red-absorbing dye
solution. The two solutions were separated by rounded partitions such that the volumetric ratio of the
different concentrate solutions would change linearly as the device is rotated within the sensor light path.
9
Heart rate values are simulated through linear actuation of the device. A servo motor rotates a cam
which compresses a plate attached to the core. This produces a change in volume within the light path of
the pulse oximeter that resembles a blood pressure waveform. Oxygenation values are changed by
rotating the core using a stepper motor. A 5.5° rotation of the core corresponds to a 1% change in
oxygenation. A finger dock allows for the attachment of a pulse oximeter probe while the core moves
internally. The core creates a 1% volume change when moved 0.6 cm.
The absorbencies of various dye solutions for use in the core were analyzed using a
spectrophotometer. Concentrations of these solutions were measured, and a portion of the solution was
placed in a standard cuvette. The extinction coefficient was then determined using Beer-Lambert‟s Law.
Using a custom designed light intensity circuit, the absorbance of the human finger was compared to the
absorbance of the core filled with the dye solutions. Final concentrations were chosen such that the
combined absorbance of the core and dyes were comparable to a human finger.
The motors and a graphic user interface (GUI) were programmed in the scripting language Python.
The GUI was created to allow user controlled variation in heart rate and SpO2. Device accuracy was
measured against a portable pulse oximeter to determine how closely user entered values followed pulse
oximeter readings. Each heart rate and oxygenation test was conducted for four minutes.
Blood substitute dye solution tests involved the three most red-absorbing dyes that were tested. When
the core was attached to the pulse oximeter, the powdered drink solution (Wild-Berry Pomegranate)
proved most effective in simulating signals. This powder-based solution also allowed easy concentration
adjustment.
Heart rate tests evaluated the motor‟s ability to produce a user defined heart rate in beats per minute,
as well as the pulse oximeter‟s ability to read these heart rate values correctly. Test results showed that
the servo motor was able to produce heart rate values within the range of 30-150 BPM within ±4 BPM.
Motor specifications would not allow higher speeds and thus 150-160 BPM was the maximum range
achievable. Pulse oximeter readings of the heart rate were accurate to within ±3 BPM, although the device
needed approximately10 seconds to stabilize to the correct value. Oxygenation testing produced a trial
with SpO2 values between 70-100% which settled near the intended value, but varied within ±4% over
time. The oxygenation displayed was observed to fluctuate anywhere between 0-100% given alterations
in finger dock to probe attachment, probe alignment, and wall stabilization.
The generated photoplethysmogram (PPG) waveform by the calibrator is similar to a physiological
waveform. The PPG waveform was created by programming in wait times as opposed to adjusting motor
speeds. This caused slight differences between the programmed and physiological waveforms and made
higher BPMs unachievable.
10
Oxygenation tests revealed that the calibrator was sensitive to movement. Oxygenation values also
depend greatly on maintaining proper probe placement on the finger dock. The position of the probe
relative to the core is critical to obtaining correct values and the PPG waveform. Overall accuracy
increased when a wait time of 30 seconds was added between consecutive tests.
The current design did not meet original design specifications. However, the calibration device helped
to verify the theoretical concept behind the core design. Testing revealed possible improvements to the
design to increase accuracy and reproducibility.
11
1.0
Introduction
Pulse oximeters are standard for continuous patient monitoring of arterial oxygen saturation and heart rate
in a clinical setting. The current method for the calibration of this device involves inducing hypoxemia
upon human subjects and comparing pulse oximeter measurements to that of a CO-oximeter. This data is
used to determine calibration coefficients and create a look-up table that is programmed into the pulse
oximeter. FDA regulations require this calibration method for pulse oximeter approval. However,
calibration with human subjects can only be done between 70-100%. Inducing hypoxemia at the lower
end of this range is potentially dangerous to the test subjects, while oxygenation levels below 70% are
considered too dangerous to be conducted. This makes such a calibration process both costly to the
company producing the device and inaccurate below 70% since the oxygenation data can only be
determined through extrapolation.
It was the goal of this project to create a device which would increase the accuracy of the calibration
process and potentially set the stage for the elimination of the need for human volunteers. Such a device
would also significantly reduce cost and time for companies attempting to bring a new model of pulse
oximeter to market. A device such as this, even if it is not used as a substitute for testing on humans,
would allow the company the opportunity to test their device before making the expensive commitments
involved with FDA testing.
We propose to do this by creating a device which uses a motorized dual axis system to adjust the
positioning of a core component and thereby altering oxygenation and creating a pulsing signal. The core
consists of two partitions that respond to rotation with a change in the ratio of blood substitutes within the
light emitted and received by the pulse oximeter. Much of our project was spent in developing the
concept, design, and testing of a prototype for this idea. It is our hope that this device and project will aid
in future investigations regarding the production of an alternative solution to the current methods of pulse
oximeter calibration.
12
2.0
Literature Review
The team performed a thorough literature involving the science and techniques employed by pulse
oximeters. Then the team reviewed previous designs for the calibration of pulse oximeters.
2.1
Oximetry
Oximetry is the optical measurement of HbO2 content in the blood. The field of oximetry takes into
account the difference in optical absorption of HbO2 and Hb at specific light wavelengths in order to
measure the oxygen saturation in blood. The maximum difference in light absorption occurs at red light at
660nm, as seen in Figure 1. The ratio of absorbance at 660 nm to the absorbance at a known wavelength
in the infrared spectrum (between 880-940nm) can be used to determine the saturation of HbO2 in the
blood. Often oximetry uses a number of wavelengths to determine the oxygen content in blood which is
more accurate because other hemoglobin variants can then be detected, such as MetHb and HbCO. The
absorbance spectrum for MetHb and HbCO is displayed along with the absorbance spectrum for Hb and
HbO2 in Figure 1.
Figure 1: Light absorption spectra of hemoglobin variants [6].
2.2
Pulse Oximetry
While traditional oximetry has the ability to determine oxygen saturation in blood, there was a major
limitation preventing its use in real-time patient monitoring systems. The light scattering through the
tissue could not be distinguished from that of the blood. The development of pulse oximeter was after the
1970‟s, when Takuo Aoyagi invented photoplethysmography, which is the use of optically generated
measurements of the volume of an organ, to identify a time dependent volumetric change [1]. In this case,
the time dependent volumetric change can be associated with that of arterial blood. This can be seen in
Figure 2 where the amount of light absorbed can be seen to vary in time with the arterial pulse state.
13
Figure 2: Material within a finger showing arterial blood volume changing over time, photoplethysmogram [6].
The pulse oximeter is able to disregard portions of the signal that remain constant by taking a ratio of
the changing (AC) and unchanging (DC) signal per wavelength as defined in Equation 1. This ratio is
called the R-ratio:
Eq. (1)
Empirical calibrations allow for conversion from the R-ratio to SpO2. Equation 2 shows an example
of how an empirical calibration could look. Some pulse oximeter models use more calibration
coefficients. In Equation 2, both A and B represent calibration coefficients.
Eq. (2)
The AC/DC ratio at each wavelength normalizes the signal such that differences in individuals tested
are ignored. Equation 3 shows that the normalization of the signal yields the changing component of the
signal.
Eq. (3)
Today pulse oximetry is recognized worldwide as the standard of care in anesthesiology and is widely
used in intensive care, operating rooms, and during patient transport. However, all pulse oximeters require
initial empirical calibration. Companies wishing to bring new pulse oximeters to the market need to
initially calibrate their device such that it meets the FDA‟s standards in providing proper oxygenation
readings. A graph showing a typical R-ratio is shown in Figure 3.
14
Figure 3: Normalized R ratio for oxygen saturation levels [6].
The R-ratio is displayed by the pulse oximeter and matched to the corresponding oxygenation value
as the intravenous blood measured by a CO-oximeter. The calibration procedures are time consuming and
expensive. Thus, it would be of benefit to the manufacturer to have a device that provides an efficient,
universal, and cost effective calibration of pulse oximeters. Our device seeks to meet this need for initial
calibration that reduces cost, time, and risk to volunteers.
2.3
Current Pulse Oximeter Calibrators
A pulse oximeter calibrator must fulfill certain criteria. According to Hornberger et al, “it is important
that the R-ratio signals that the pulse oximeter receives are within the calibration range of the device. The
pulse oximeter must identify the device as a patient. It must also be able to assess the accuracy and
correctness of data compared to an accepted standard. Finally, it must provide an absorbance that would
be the same as a finger with known arterial blood saturation.” [3]
To be detected as a patient, the calibrator would have to have a non-changing absorbing component
that absorbs proportional to the tissue and venous blood of a patient a pulsatile absorbing component that
absorbs proportional to pulsating arterial blood. Current pulse oximeter calibrators do not meet the need
of the commercial market. There are many designs, ideas, and patents of pulse oximeter calibrators and
simulators/testers and use various methods to function. Most of them fall into one of three categories:
mock circulatory, finger models, and electronic simulators.
2.3.1
Mock Circulatory Systems
A variety of mock circulatory systems exist which seek to provide an identical photoplethysmogram as
measured in vivo. This is done by reproducing the pressure wave of blood as it pulses through the finger.
Oxygenation of the blood is controlled within the system by an oxygenator and gas supply. Some
15
oxygenators may be more efficient in the time it takes to oxygenate the blood, but this wasn‟t taken into
consideration when comparing the models. Some of these models have special points of attachment for
the pulse oximeter, while others better reproduce certain physiological conditions. The following are
mock circulatory system models that were looked at in the literature review.
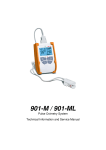
A tissue model by Kent and Mendelson was developed to have similar optical properties as tissue,
recreate photoplethsomgrams that are similar to those natural to the finger, and have a whole blood/tissue
volume comparable to that in the finger (2%) [5]. A 35% systole and 65% diastole at a rate of 70
stroke/min was created by the pump. Experiments in this paper were conducted using physiological
conditions of 41% hematocrit and 1.5% HbCO; however the temperature of the blood was at 37 Celsius.
The tissue model uses a block of Dow Corning silicone elastomer with 15 symmetrically distributed
cylindrical conduits, shown in Figure 4, to simulate capillaries and relevant optical properties of tissue.
The finger model is placed within the circulatory system that creates pulsations, oxygenates the blood,
and regulates flow through the finger model. The pulse oximeter then attaches around this finger model.
Results of experiments showed that the presence of elevated HbCO caused an overestimation in SpO2.
The model was shown to allow controlled and reproducible SpO2 measurements.
(a)
(b)
Figure 4: Kent and Mendelson Finger model (a), mock circulatory system (b) [5].
Oura et al. created a mock circulatory system that included arterial and venous circulation in parallel
[7]. This model was developed to produce an in vitro pulsatile optical density ratio that would agree with
the in vivo pulsatile optical density ratio. They reported that single layer pulsation flow cells show a
discrepancy in pulsatile optical density ratios when at the same oxygen saturation. This model was
designed to be compact and has dimensions of 60 cm x 40 cm. The arterial circulation part of the system
includes a compliance chamber, reservoir chamber, clamp, pumping unit, and artificial lung. This circuit
is able to produce pulsatile waveforms that are similar to aortic pressure (120/80 mmHg) and flow
waveforms and the heart rate was set to 60 BPM. The venous system contained a centrifugal pump,
reservoir chamber and artificial lung. Flow in this circuit was steady and the pressure was set to 0 mmHg.
16
The flow from these two systems meets in the middle within a double-layered pulsation flow cell. This
flow cell consists of two elastic diaphragms that move in response to the pulsations created in the arterial
side of the system. Figure 5 shows a diagram for the double layer flow cell and Figure 6 shows the
complete circulatory system with arrows indicating the direction of the flow. The pulse oximeter would
attach around the flow cell.
Figure 5: Diagram of double flow cell [7].
Figure 6: Complete setup of the mock circulatory system by Oura et al. [7].
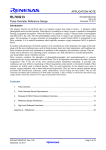
An alternative iteration of the mock circulatory model was developed by Reynolds et al. [8] which
included a slightly altered flow path to allow for easier pulse oximeter probe attachment around a finger
shaped silicone rubber membrane. Figure 7 shows the finger model inner flow system and Figure 9 shows
a diagram of the circulatory system.
17
(a)
(b)
Figure 7: Reynolds et al. finger dock (a), mock circulatory system (b) [8].
2.3.2
Basic Finger Models
Basic finger models eliminate the need for a mock circulatory system by focusing just on the finger
portion of blood flow and pulsations. There is a wide variety of these models as there are a number of
different ways to simulate light absorption by blood, light absorption by tissue, and pulsations within the
artery.
One model by Volgyesi [9], patent 5,166,567, uses a squeeze ball to simulate arterial pulsations
and two solutions of known concentrations of red and infrared absorbers such that the oxygen saturation it
represents is known. The outside of the finger model is rigid while the inside walls containing the liquid
are flexible such that air within the tubes as created by pressure on the bulb creates pulsations. The device
can be seen in Figure 8.
18
Figure 8: Finger model squeeze ball pulsation mechanism cross-sectional view [9].
Yount describes a device that includes two hollow wedges on top of each other as seen in Figure 9
[10]. The wedges are filled with two different solutions of 5% sheep‟s blood in agar solution. The blood
of the first solution had 100% oxygen saturation while the second solution had 0% oxygen saturation. The
choice of 5% blood in agar solution was supported by the fact that between 5-8% blood is seen in finger
tissue. This orientation of wedges yields a continuous change in oxygen saturation values to the pulse
oximeter. Pulsations are created in this device by a rotating device that has openings spaced to allow the
light to travel. This does not allow for photoplethysmographic waveforms to be obtained as the light
signal is temporarily blocked at some points by the rotating disk. In other words, the pulsation is not
characteristic to in vivo pulsations.
(a)
(b)
Figure 9: Wedges in square formation (a), wedges of different sizes in a larger wedge formation (b) [10].
Patent 5,278,627, by Aoyagi et al. [1] describes that the device needs to provide highly repeatable and
highly reliable signals to the pulse oximeter, but notes that calibrations involving human fingers have
poor repeatability making it difficult to judge whether the value measured is reliable or not. He proposes a
tissue model enclosing a blood model which is moved into or out of view of the pulse oximeter. The
blood model is moved rotationally on one axis and linearly on another axis to present pulsations and
oxygen saturations, respectively. The motors are powered via a power supply that is stored within the
19
device. The blood model in this patent uses a solid material compound that consists of an acrylic base
with different fluorescent materials in varying ratio to create an absorbance and reflectance that is
characteristic to differing oxygen saturation levels. However, the device is in the number of different
oxygen saturations that it can represent. The device includes a finger shaped dock for the pulse oximeter
probe to attach to and can be seen in Figure 10. In his patent he notes that calibrations have been done
electronically without the use of a measuring probe.
(a)
(b)
(c)
Figure 10: Finger model with in and out motion (a), enclosed finger model with in and out motion (b), finger model with
rotating disk motion (c) [1].
2.3.3
Electrical Simulators
Electric signal simulators were lastly considered for the very attractive quality of minimal parts and no
liquid or material to simulate blood light absorption. Electric simulators/calibrators essentially perform
like a reverse pulse oximeters. A sensor takes in the light emitted by the pulse oximeter and transmits a
properly altered signal to the pulse oximeter sensor using its own LEDs. The altered signal would
correspond to a set value for light absorption by a specific oxygen saturation and pulse rate as found in a
database of a pulse oximeter. Certain models have the ability to test specific pulse oximeter models as
20
they contain the databases from these specific devices. The SmartSat made by Clinical Dynamics contains
over 10 different device databases to look up the proper oxygenation level [2]. Once inputted into the
system, the intended oxygenation level can be compared to the oxygenation level read by the pulse
oximeter. The same can be done for pulse rate. The SmartSat device can be seen in Figure 11.
Figure 11: SmartSat by Clinical Dynamics [2].
21
3.0
Design Approach
The team identified the problem with current methods for calibration. Then the team looked at what was
achieved by the current methods and what should be achieved for a device that could replace these
methods. Finally, several designs and their components were compared.
3.1
Initial Client Statement
Current pulse oximeter calibration techniques are expensive, time consuming and limited risky for human
volunteers. The purpose of this project is to develop a pulse oximeter calibrator which reproduces clinical
situations that can provide users with a simple, inexpensive, and effective tool to test the basic functional
capabilities of a pulse oximeter and perform initial calibrations.
3.2
Revised Client Statement
Pulse oximeter calibration is expensive, time consuming, and risky for human volunteers. The purpose of
this project is to develop a simple, efficient, and cost-effective way to initially calibrate and later test
pulse oximeters without human volunteers. The device created will simulate heart rate between 30-250
BPM and blood oxygenation between 70-100% in order to properly calibrate and test the basic functional
capabilities of a pulse oximeter for medical use. This calibration device will serve as an alternative
method to allow manufacturers to gain FDA acceptance of their pulse oximeters.
3.3
Device Requirements
1. Calibrate and Test the Accuracy of Pulse Oximeters
1.1. Must calibrate and test how well pulse oximeter measures saturation and heart rate
1.1.1. Simulate oxygen saturation 70-100%
1.1.2. Simulate heart rate between 30-250 BPM
1.2. Must be compatible with multiple models of commercially available pulse oximeters
1.2.1. Allows pulse oximeter probe attachment around the section of the calibrator simulating
oxygenation and heart rate
1.3. Calibrator should be insensitive to the surrounding environment
1.3.1. Readings are not be significantly affected by ambient temperature
1.3.2. Readings are not be significantly affected by ambient light
2. Ease of Use
2.1. User interface
22
2.1.1. Intuitive design
2.1.2. Easily adjustable to desired oxygenation and pulsation levels
2.2. Attachment to Pulse Oximeter
2.2.1. Fits in transmission pulse oximeters (small enough)
2.2.2. Blocks ambient light
2.2.3. Works with devices that do not adjust the LED drive current under low transmittance
2.3. Portability
2.3.1. Easy to carry (< 20 pounds)
2.3.2. Easy to assemble/disassemble (if required)
2.3.3. Durable
3. Manufacturability
3.1. Accuracy not effected by manufacturing tolerances
3.2. Inexpensive
3.3. Reproducible
3.4
Device Objectives
1. Larger range of oxygen saturation
a. 0-100% oxygen saturation data can be simulated
2. Usable for both transmission and reflectance oximeters
3. Accounts for dysfunctional hemoglobin
4. Allows alteration of calibration standards
23
3.5
Component Comparison
A detailed description of many current calibration and simulation devices found during the team‟s
literature review was provided in an earlier section. This section of the paper compares the models and the
components that have been utilized for each function. Table 1 determines the success of each design with
respect to our developed requirements and objectives.
Table 1: Model design requirement comparison.
Kent and Mendelson Oura et al.
(in vitro tissue
(dual flow
Criteria
model)
cell)
Control
saturation
Gas supply
Gas supply
Reynolds et al.
Volgyesi
(ball pump)
Yount
(wedges)
Aoyagi et al.
(finger model)
Gas supply
Fluid filling model,
remains same
Sliding of
wedges
Materials that
simulate different
oxygenations
0-100
Only a few values
can be simulated,
not continuous
No
No
One value
simulated, not
continuous
measurements
May not mimic
natural waveform
Saturation
(min-max)
0-100
0-100
0-100
Pulsation
waveform
Shows natural
photoplethysmogram
Yes
Yes
Pulsation rate
(min-max)
Determined by motor
Determined
by motor
Determined by
motor
Venous
pulsation
No
Yes
No
No
No
No
Standard of
data
Changeable 35%
systole, 70BPM, 2%
blood per volume,
41% hematocrit, 37C
Can be
changed
Can be changed
Decided by fluid
filled model
Decided by
fluid filled
wedges
Decided by
material used to
represent oxygen
saturation
Repeatability
Mobility
Power source
tissue
component
Dysfunctional
hemoglobin
Can be varied, but is Determined by
One pulsation rate
not accurate
motor
Uncontrolled
Better than
Depends on
Better than human pulsation variability,
human
accuracy of
fingers
Oxygenation will
fingers
motors
remain the same
Extensive
Extensive cleaning,
Dimensions
cleaning,
Small size and
disassembly, and set
Small size and
of 60cm x disassembly, and
weight, may
up time for
weight
40cm
set up time for
be fragile
experiments
experiments
Outlet,
Outlet, power
Manual labor, power
Outlet, power supply
power
Battery
supply
supply
supply
Better than human
fingers
Yes
Yes
Yes
Possible
Depends on
accuracy of
motors
Small size and
weight, very
mobile
Battery
Possible
No
Some of the designs appear similar in this assessment and further analysis is required to show any
differences in components used. A morphological chart was generated based on these models, seen in
Table 2, which relates each function with possible components to achieve the function. The lists of
possible components for fulfilling each function were gathered from the aforementioned models.
24
Table 2: Morphological Chart.
Functions
1
2
3
4
5
Plastic
Rubber
Silicon
Whole
milk
Attenuate
light signal
Real blood
Human
blood
Animal
blood (cow,
sheep, pig)
Simulation
of blood
Liquid
dyes
Dyed plastic
material
Liquid
crystal
light valve
LEDs
Simulate oxygen
saturations
Wedge
Multiple
wedges
(position
variation)
Oxygenate blood
Artificial
lung
Disk
oxygenator
Means of supplying
oxygen
Gas tank
Surrounding
environment
Simulate pulse
Pressure
pump
Plunger
pump
Rotating
core
Rotating
disk
Means of powering the
device
Batteries
Wall outlet
Power
supply
Manual
labor
Simulate soft tissue
Light
absorption
of blood
component
5% animal
blood in
agar
solution
Semitransparent
plastic film
Multiple
samples
with known
oxygen
content
6
Semitransparent
plastic film
7
Quartz
Database
Computer
generated
alternating
light signal
Modulating
distance
Peristaltic
pump
The morphological chart provided insight to possible designs through the mixing of components
between the previous designs. Several different types of systems were developed based on this
combination of functions. The two main systems were the mock circulatory models and finger models.
The mock circulatory model usually consisted of a series of tubes with a pump attached to represent the
flow of blood through the body with the pulse oximeter attached at a location to represent the finger. The
finger models used a device to represent change in blood volume within a finger only. Three separate
finger models were considered: the liquid crystal light valve, the pump model, and the wedge model. The
electrical simulator was also considered in the numerical evaluation matrix. An evaluation of the systems
developed was completed in order to determine which could best fulfill the constraints and objectives.
The evaluation assigned numerical values between 0-100 to the constraint/objective and each was
multiplied by a priority factor based on relative importance. Each team member completed the evaluation
independently and individual responses were averaged to give a final score for each category. The results
are displayed in Table 3.
25
Table 3: Numerical evaluation matrix.
Design Contraints (C) and Objectives (O)
C: Can perform initial calibrations for pulse oximeters
C: Simulate pulse rate between 30-250 BPM
C: Simulate blood oxygen saturation between 70-100%
C: Complete within MQP time constraints
O: High level of accuracy
O: Allows attachment of commercialy available pulse oximeters
O: Ease of Maintenance: clean/assemble/disassemble
O: Simulate blood oxygen saturations below 70%
Totals
Priority (J) Mock Circulatory System Electrical Simulator Liquid Crystal Light Valve Wedge Model Pump Model
X
X
JJJJ
JJJ
JJ
J
260
220
47
87
613
X
X
367
220
147
98
832
213
250
160
67
690
The resulting score led the team to the conclusion that a model similar to the wedge model proposed
by Yount would be the most viable calibrator. A mock circulatory system design was also investigated.
The electrical simulator was not considered because the device is dependent on pre-calibrated
oxygenation values, which are only specific to pulse oximeter models. The liquid crystal light valve was
eliminated due to complexity and time constraints to complete the design.
26
4.0
Device Development
The development of the device began with the evaluation of the possible design alternatives, as well as
the advantages and disadvantages associated with each design.
4.1
Design Alternatives
When developing a pulse oximeter calibrator, two design alternatives were considered: the mock
circulatory system and the wedge model. Each design accomplishes the outlined requirements through
distinct simulation mechanisms. These designs were evaluated in order to determine the most accurate,
efficient, and cost-effective means of calibration.
4.1.1
Mock Circulatory System
This artificial circulatory system will work similarly to previous circulatory models specifically the model
as developed by Kent and Mendelson [5]. Blood vessels are represented with tubing that takes the blood
from one system component to another. Blood will come from an oxygenator and will be pumped by a
motor to an artificial finger (to which the oximeter will be attached). After the finger, blood moves to a
reservoir that will remove or at least dampen any residual pulsations from the system and return the blood
to the oxygenator. Oxygen will be provided by an oxygen tank and can be combined with other gases
with varying partial pressures, thus changing the saturation. A diagram of the full system as used by Kent
and Mendelson is shown in Figure 12 alongside a block diagram of our device showing the major
components and their placement in the path of blood flow.
Reservoir/
Oxygenator
Artificial
Finger
Motor &
Control
Circuit
(a)
(b)
Figure 12: Kent and Mendelson mock circulatory system set up (a) [5], block diagram of mock circulatory system (b).
27
This design variation would focus on the decreasing the size, increasing the ease of assembly,
disassembly and cleaning. We will also try to modify it to be used as an initial calibrator for pulse
oximeters. We would attempt to do this latter part by simulating the relevant optical properties that would
be measured by both reflectance and transmission oximeters.
This device would be scaled down to use minimal tubing and hence minimal blood. The other
components will also be miniaturized and combined (where possible). Smaller gas tanks may be
obtainable to be used with this system in setting the oxygen saturation. The device would be designed to
easily and securely attach each member, and allow cleaning of the components between uses.
The motor must be capable of pumping between 30-250 times per minute, the same operating range
as the heart, without damaging the blood cells. Most pulse oximeters are programmed to measure within
this range. A control panel would be attached for varying the pulse rate. More research is needed in
determining any further requirements and the necessary implementation of the motor/pump mechanism.
The finger dock ought to mimic the human finger in optical properties that are relevant to the
oximeter and model finger absorption spectra where possible. Mechanical properties of the dock ought to
be similar to the human finger if it causes significant differences in measurement. Whether it causes
significant differences in measurement remains to be investigated as well. The tubing within the finger
dock has to be capable of producing photoplethysmographic similarities to the photoplethysmogram of a
human patient. The feasibility in achieving high accuracy in these properties is still unknown and will
have to be researched. Our finger dock would be modeled from Reynolds et al. which allows flow into
and out of a finger shaped protrusion to more closely mimic the blood flow within a finger. Figure 13
shows these two finger models.
Blood flow
directions
Finger casing
Blood channel
(b)
(a)
Figure 13: Reynolds et al. finger model side view (top) and top view (bottom) (a) [6], mock circulatory finger model of
similar design (side view) (b).
28
Further analysis of a device is still required, to ensure that this design at least retains all features in the
current model, if not improving upon them. With sufficient improvements in design this model could
potentially find use as a tester for clinicians, a calibrator for manufacturers, and for research in pulse
oximetry, so long as the device can mimic human finger absorption spectra and be inexpensive to
manufacture. Currently, we have little knowledge of how the oxygenator works or how exactly the
motor/pump mechanism interacts with the blood to cause the pulsatile flow.
4.1.1.1
Bill of Materials
1.5 meters rubber tubing
Small electric motor
Circuit control board
10 cm3 cube of Delrin
Artificial finger dock
Blood ≈1L
It is important to note that many of the components listed here are estimations of what will be need
and not exact values. While we currently believe that we have a general understanding of what will need
to go into this device, at the moment it is impossible us to say with absolute certainty what materials the
final design will require.
All materials need to be biocompatible if they are to come into contact with blood before or during
the use of this circulatory system.
4.1.2
Wedge Model
The wedge model designed comes from the patent by Yount which includes wedges filled with blood of
known oxygenation content articulated within the oximeter probe to simulate pulsating [ ]. The patent also
uses a pair of polarizing disks to simulate pulsations. Here, we use the wedge portion of this patent with
slight modifications, but with a different means of wedge movements to simulate pulsations.
In this case, there are two wedge shaped pieces. These wedges are aligned to form a rectangle. Both
wedges are made of solid material; one has optical properties that are similar to reduced hemoglobin, and
another with optical properties similar to fully oxygenated hemoglobin. These two values for oxygenation
are chosen because only two wedges can produce any oxygenation value between 0-100%. The wedges
are placed on top of each other and the pulse oximeter probe is placed such that light emitted goes
through the top flat portion of the top wedge and the sensor is located on the bottom flat portion of the
bottom wedge. The oxygen saturation is then equal to the ratio of thickness of the 100% oxygenated
material and the 0% oxygenated materials. This can be seen in Figure 14, the light path of the pulse
29
oximeter probe goes through the middle of both wedges such that the oxygenation is a ratio of the width
of the two wedges.
Pulse Oximeter Probe
Hb
HbO2
Figure 14: Wedges of 0% and 100% oxygenation with pulse oximeter probe attached showing light path position and
direction through wedges.
Figure 15 more explicitly demonstrates the light path through the wedges. It would go through the
middle of the two wedges such that the edges and sides are not within the light path.
0% O2
100% O2
100% O2
(a)
0% O2
(b)
Figure 15: Light path (arrow) through wedges. Right side up view (a), upside down view (b).
The wedges simulate the oxygen saturation and movement of the wedges simulates the arterial
pulsations. The wedges are placed in a frame that surrounds the outer edge of the bottom and short sides
of the wedges. This frame would be unseen by the pulse oximeter as it holds only the edges of the
wedges. This frame is attached to a motor shaft at one short side of the wedges. This shaft is connected to
a motor configuration that will move the wedges in order to simulate a pulse. This configuration can be
seen in Figure 16.
Motor Shaft
Outer Frame
(a)
30
Pulse Oximeter Probe
Motor Shaft
Light Path
0% O2
100% O2
Light Path
Outer Frame
(b)
Figure 16: Outer frame and motor shaft (a), frame configuration attached to wedges (b).
Two different types of motors would be used to move these two pieces of material. One motor, a
servo motor, will be used to simulate the arterial pulsations, while another motor, a stepper motor, is used
to move the wedges into the proper ratio of thicknesses to simulate an oxygenation level as seen by the
pulse oximeter. The servo is used to turn the device side to side on the bottom longitudinal axis of the
wedges. This motion would cause an increase in the path length while maintaining an equal ratio of
thicknesses of the wedges relative to the light source. An increased path length means more light will be
absorbed and thus an ac component is being simulated to the pulse oximeter. This is shown in the two
diagrams in Figure 17. Figure 17 (a) shows the axis along which the wedge will turn and the direction of
turning. It also shows where the light source would be located with respect to the wedges. Figure 17 (b)
shows how the light path of the pulse oximeter light source is affected by the wedge turning.
Top View of Wedges
Pulse Oximeter LED
Location of pulse
oximeter light source →
HbO2
HbO2
Hb
Hb
Axis of Rotation
(a)
Pulse Oximeter Photodiode
(b)
Figure 17: Top view of wedges showing axis of rotation and the direction of wedge turning (a), light path
through wedges before and after wedge turning (b).
The second motor, the stepper motor, would be used to initially position the wedges within the device
such that the photodiode would read the intended oxygenation level. This motor would be attached to a
gear pulley system that would move two gears simultaneously in one direction or the other. A bearing
31
block is on this gear pulley system upon which the stepper motor is attached and from this via the motor
shaft, the wedges are also attached. The wedges would have a set position before any measurements
begin. This can be seen in Figure 18 where a servo is connected to a set of gearing that in turn is
connected to a shaft that goes through the bearing block to the wedge frame. The bearing block is set atop
a platform (guide block) which is attached to the pulley gear system which moves the platform with a
stepper motor to place the wedges at the correct position within the pulse oximeter probe. A diagram of
this system is shown in Figure 18.
M
o
t
o
r
S
h
a
f
t
Figure 18: Motor control system of oxygenation content and arterial pulsation simulation.
Finally, in order to allow pulse oximeter attachment while also moving the wedges, the wedge portion
of the device will be enclosed within a casing. This case would be made out of Delrin, rubber, silicone, or
a similar material that has optical properties which mimic human tissue [1]. The case and inner wedges
would be small and thin enough to allow it to fit within a transmission oximeter probe. If a rubber silicone
material is used, the casing would be slightly flexible as well to allow better shape confirmation. The
material would be semi-transparent to allow the light to pass through the device. This can be seen in
Figure 19. In this figure, the casing has been made fully transparent such that you can see the wedges
inside.
Pulse Oximeter Probe
Outer casing
0% O2
100% O2
Figure 19: Pulse oximeter probe attachment to outer semi-transparent casing.
32
All of the positions and motion of the device would potentially be controlled with a programmable
intuitive user interface. The motors would be controlled by control circuit which would include a
microcontroller that could be programmed using C or another device interface programs. Lab View is one
program often used for biomedical applications that could be utilized for this device. The position of the
wedges within the pulse oximeter probe and the speed of turning to simulate pulsations would be set by
the user before each use of the device.
An alternative variation of the design would use hollow internal wedges that could be filled with
100% oxygenated blood and 0% oxygenated blood or dyes that would have a similar optical properties.
These types of wedges can be used if solid wedges cannot be found or depending on the FDA premarket
approval processes. This method would be used only as a backup plan and potentially during initial pulse
oximeter calibration instead of human testing because using blood is undesirable as it is expensive,
requires proper handling, and is sometimes difficult to obtain. This method also requires extra cleaning
between uses and extra preparation before use.
To use the device for reflection oximeters, an additional component would be added to reflect the
light back to the photo detector. This involves simply adding a metal plate. The metal plate would sit
within the metal frame, at the bottom of the wedge system, and reflect the light back up into the sensor.
4.1.2.1
Bill of Materials
Material to simulate 100% oxygenated HbO2
Material to simulate 0% oxygenated Hb
Metal plate
Delrin or silicone rubber casing
Stepper motor
Servo motor
Guide block- potentially 6723K9 (McMasters)
Belts
Gearing
Metal shaft
Internal metal framing
Pulse width modulation circuit
Microprocessor
Program software
It is important to note that many of the components listed here are estimations of what will be needed
and not exact materials or values that will be used. This bill of materials is an estimation of what we will
need for the device. While we currently believe that we can obtain the necessary items to go into this
device, at the moment we cannot say with absolute certainty what materials the final design will require.
We are also unsure at this point what materials will best suit our purposes. This will require further testing
and research to determine the best material suited for our purposes.
33
4.2
Evaluation of Alternative Designs
After the alternative designs were established and described they were assessed and evaluated. Below are
the advantages and disadvantages of both alternative designs along with the testing that would need to be
completed before the design could be chosen as the final design.
4.2.1
4.2.1.1
Mock Circulatory System
Advantages
This device will be made small in size compared to current devices and will attempt to reduce the number
of components. A possible combination of oxygenator and reservoir could eliminate one component, and
the use of an artificial finger dock eliminates the need for a mounting unit for the oximeter. The finger
model also allows for the mounting of any type of pulse oximeter since it will be sized and shaped
similarly to an actual human finger. The device would also provide adjustable oxygen saturation by
means of adjusting the oxygen partial pressure, and would allow for adjustment of pulse rate through a
circuit board. The device meets all of the requirements established in the requirements list.
4.2.1.2
Disadvantages
The system, despite its small size and combined parts, may still require assembly/disassembly/cleaning
time (however, it would take less time than current models) and the size of the gas tank may be a
hindrance if smaller tanks are unavailable. The small size may cause issues with the behavior of the flow,
such that residual pulsations form even with the addition of the reservoir/oxygenator. Blood also has its
own disadvantages such as handling, expense, and availability. We will have to investigate how this
blood will be acquired and the proper procedures for being handled.
4.2.1.3
Testing
There are several points of this design which must be tested before it can be set as the final design. First it
would be necessary to test how well the custom motor system would simulate a pulse. The motor/pump
mechanics would have to be tested in combination with the tubing and finger dock to ensure that the
device will simulate photoplethysmograms similar to those from human subjects. The other potential
complication is the size of the set up. Ideally the system would be as small as possible; however, it is
necessary to ensure that reducing the size does not adversely affect the accuracy of the readings taken by
the pulse oximeter. To do this, we would need to use a device to measure the pulsations of the blood
through the tubing and look for irregularities (potentially this could be done with a pulse oximeter). The
finger model must also be tested to ensure that the materials used will simulate the proper light absorption
34
properties. Again, this testing could be done using a pulse oximeter in tandem with a CO oximeter to
make sure oxygenation levels remain at the desired levels. One circulatory model examined had a
secondary venous circulatory system running in parallel to the artificial arterial circulatory system. This
more closely resembles the structure seen in a finger, and the affects should be investigated as to its
influence in the readings of pulse oximeters.
4.2.2
4.2.2.1
Wedge Model
Advantages
This model would provide a bloodless calibrator to the market that would require no set up or cleaning
between uses, and would utilize a user interface that would allow modulation of oxygenation and heart
rate, and would be able to assess the accuracy of a pulse oximeter or be used to pre-calibrate a pulse
oximeter. Many components are easy to obtain or manufacture and can be purchased at minimal costs,
below $20. Oxygen saturation levels can be simulated below the normal calibration range of 70-100%,
improving upon the standard pre-calibration techniques. The movements, although shown exposed to the
environment, can be enclosed to allow for more durability of the device.
4.2.2.2
Disadvantages
This device has moving parts and the wedges and frame would have to be sized properly to fit the
transmission pulse oximeter probe. The movements to simulate the pulse would also have to be very
small to properly simulate a human subject. Potential difficulty would come about from simulating high
BPMs using the servo. There is still skepticism as to whether or not pulsations can be created using the
motion devised for this purpose. Further testing would need to be done in order to determine most parts
necessary for device operation. Using this design, the calibrator would not fit within most commercially
available pulse oximeters.
4.2.2.3
Testing Methods
First, the proper material needs to be chosen to simulate fully oxygenated and fully reduced hemoglobin.
This will be done through research and testing of the accuracy in blood light absorption replication
through these materials. A basic circuit will be set up in order to determine the amount of red light and
infrared light absorbed by the oxygenated blood and deoxygenated blood. The optimal size and angle of
inclination for each block will be tested by using an LED and photodiode so that the internal components
will fit into a finger sized casing and that the accuracy is maintained to less than 1-2%. Through equations
and light absorption testing, it can be further shown that when the path length is changed through equal
displacement of the wedges, the ratio can be maintained and a pulse can be simulated. Other ways of
35
moving the two pieces to simulate the pulse and oxygen saturation while maintaining adjustability will be
considered. One such alternative is moving both wedges inward and outward simultaneously to increase
the path length and produce a pulse.
Other testing will determine if the location, size, and type of motors is optimal for the device
function. The pulsation mechanism and positioning mechanism, along with the program used to control
these mechanisms, must be tested to insure proper simulated oxygen content and pulse rate. All of these
functions will undergo final testing with a functional pulse oximeter.
4.3
Design Selection
While both designs have positive attributes that make them desirable designs, there are specific
disadvantages that eliminated both designs. The objectives are stated in the objectives tree below. The
weights in the sub-objectives indicate relevance to the stated objectives of the device, including
simulation of signal, compatibility, ease of use, and manufacturability. The pair-wise comparison chart
(Table 4) also shows the importance of each objective in a slightly different format. Simulation of signal
was most important while calibration of multiple pulse oximeters was second. Both the wedge design and
the mock circulatory system could simulate the signal; however, the wedge design was not compatible
with multiple models of pulse oximeter probes. Further research into current pulse oximeter models
showed that there are several different types of probes that would not fit onto our square wedge design
The mock circulatory system would require a great deal of set up and clean up while not allowing for a
GUI. Both designs could be easy to manufacture depending on the components used.
Device for Pulse
Oximeter Calibration:
1.0/1.0
Simulation of signal:
0.5/0.5
Calibrates multiple
pulse oximeters:
0.25/0.25
Ease of use:
0.15/0.15
Manufacturability:
0.1/0.1
Heart rate:
0.35/0.175
Refelctance:
0.2/0.05
GUI: 0.50/0.075
Easy to assemble:
0.3/0.03
Oxygenation:
0.50/0.25
Transmission:
0.8/0.2
Set up: 0.30/0.045
Durable: 0.4/0.04
Cleaning: 0.20/0.03
Inexpensive:
0.3/0.03
PPG: 0.15/0.075
Figure 20: Weighted objectives tree.
36
Table 4: Pair-wise comparison chart for design objectives.
Objectives
Oxygenation
range
Oxygenation
range
Cost
Portability
Dysfunctional
hemoglobin
Heart Rate
Range
Compatibility
with probes
User
Interface
0
0
0
0
0
0
1
1
1
1
1
0
1
1
1
1
1
1
0
0
Cost
1
Portability
1
0
1
0
1
1
0
0
0
1
0
0
0
1
User Interface
1
0
0
0
1
1
Sum
6
0
2
1
5
4
Dysfunctional
hemoglobin
Heart Rate
Range
Compatibility
with probes
0
3
Not only this, the mock circulatory system that was designed was not a unique enough design and would
not significantly improve upon the current model. The design would also be too expensive to implement
with the budget provided. The wedge design surpassed the mock circulatory system in each objective
except compatibility. This problem could be overcome however while the mock circulatory design
problems such as expense could not. The wedge model was then pursed and redesigned to meet all the
objectives.
37
5.0
Current Design
The current design came about due to the large problem found with the wedge model. The wedge model
did not allow easy pulse oximeter attachment. This conical model incorporates wedge-type elements but
the wedges are made into a three-dimensional cone-like shape. This allows the wedges to be the proper
shape and size of a finger. This cone has inner partitions that are shaped in such a manner that, when the
cone is rotated, the oxygenation is changed. Because the device is cone shaped, moving it in and out
would increase and decrease the amount of volume seen by the pulse oximeter which will create
pulsations. This cone is attached to a motor system that moves the device in the proper manner to obtain
these results.
The main core of the device and the motor systems to obtain pulsations and oxygenation are further
explained in the following sections.
5.1
Conical Core
The core was designed to provide a pulse oximeter with a specified heart rate and oxygen saturation. This
requires knowledge on how a pulse oximeter obtains its heart rate and oxygen saturation measurements
from a finger. The pulse oximeter measures the intensity of light transmitted through the tissue at each
wavelength. The amount of light transmitted through a material at a given wavelength can be described
using Beer-Lambert‟s law, shown in Equation 4, where alpha is the absorption coefficient, l is the path
length, and c is the concentration. This can be related to the optical density of a material by Equation 5.
Eq. (4)
Eq. (5)
If the tissue is composed of multiple absorbers, the total absorbance of the material is the
concentration times the absorption coefficient all multiplied by the total path length of the material.
Equation 6 describes the total absorbance of a medium with multiple absorbers with
indicated the total
path length through both material one and material two.
Eq. (6)
Within a finger, the measured path length through the material is not constant; the total path length
changes over time due to pulsations but keeps a constant baseline amount. For this reason, a
normalization of the signal is required. This is represented in Equation 7, where
indicates the smallest
path length associated with the unvarying (DC) component.
38
Eq. (7)
The normalized function for the light path is independent of the light intensity from the pulse
oximeter‟s LEDs and the non-linearities associated with the photodiode emitting the light. To determine
the saturation of the LEDs, the pulse oximeter relates the normalized absorbance of the two wavelengths
used in what is called an R-ratio, described in Equation 8.
Eq. (8)
When the pulse oximeter is calibrated, the R-ratio measured by the pulse oximeter is related to the
actual saturation as measured by the CO-oximeter. This relationship is called the calibration curve and an
example can be seen previously in Figure 3. Calibration procedures using human volunteers are limited to
70% saturation, and values below 70% need to be extrapolated from the data, and as a result pulse
oximeters are less accurate in reading lower saturation values. For our device to be equally as accurate at
all saturation values specified, the design must allow for adjustable increases in oxygen saturation
between 70-100%. To achieve better accuracy, our device must allow for adjustable oxygen saturations
below 70%.
Another consideration that needed to be taken into account is heart rate. The pulse oximeter measures
the volumetric change through the light absorption mechanism described above. Pulsations in vivo
represent a 1-3% change in volume from the DC component. The design must simulate a similar
volumetric increase and decrease by increasing and decreasing the path length through the core. This is
achieved using a three dimensional cone shape. The simulated heart rate is created using a back and forth
motions that changes the total path length through which the light had to be transmitted.
A much more difficult consideration is the change the oxygen saturation. This is achieved through
rotation of the core. The inside of the core will be filled with two solutions that have opposite oxygen
saturation levels. The inner design of the core creates four partitions, two that are filled with the highly
oxygenated solution and two that are filled with the lower oxygenated solution. Rotation of the core will
provide a change in absorbance of the two wavelengths of light through alterations in the ratio of solution
high and solution low. To increase oxygenation, the path length through solution high will increase while
the path length through solution low will decrease. Overall, the total path length through the cone will
remain constant. The center of the core is hollow such that the center will not play a role in the ratio of the
two solutions. A model of the core is shown in Figure 21. The blue represents the lower oxygenated
liquid while the crimson represents the higher oxygenated liquid.
39
Figure 21: Core filled with oxygenated liquid: Blue = lower oxygenation, Crimson = higher oxygenation.
The light path extends through the entire core such that a ratio of the two liquids can be taken by
simply rotating the core. This can be seen in Figure 22. The red arrow represents the light path through
the core (enlarged for easier viewing). The outer material will be translucent such that the light could
penetrate the core.
Figure 22: Example light path through core.
At a given positive angle of rotation from ϴ0, the design would result in a ratio of material depths,
within the LED path length, of solution 2 to solution 1 + solution 2 that is a function of the angle of
rotation over the range of possible rotation, where solution two is in the circular wedges that has no
externally faced sides and solution 1 is in the circular wedge that has one externally faced side.
40
The first design developed for the inner partitions had a range of rotation of 120.833° (145-24.167°
will be shown later). The partition width was 0.05 cm which resulted from the requirement of small size
while retaining mechanical stability. The reason for choosing a small thickness was to allow for a greater
angle over which the path length ratio of solution high to solution low could change. A greater angle
would make the device more accurate. The outer limit was approximately the size of a finger, 1.2 cm in
diameter. The inner hollow circle was 0.5 cm in diameter. Two partitions extend from the hollow inner
radius to the outer radius laying 180 degrees apart. Each was 0.0467 cm thick at the junction with the
inner radius. This partition thickness reduced the angle over which we could change the saturation from
180°to 169.23° because the wall thickness takes up 10.77°. Equation 9 shows the angle taken up by the
thickness.
Eq. (9)
A partition would also extend from the inner radius to the outer radius as the device was rotated. This
would give a spiral shape that is defined by Equations 10 and 11, which started the curve at 0° and ended
it at 145° such that
.
Eq. (10)
y
Eq. (11)
This first set of equations created a line, but since the partitions needed to have width, a second set of
equations was created. This second spiral is defined by Equations 12 and 13, which when combined with
the first spiral line gives created the partition. This curve started at 24.167° and ended at 169.167° such
that
°.
Eq. (12)
Eq. (13)
The equations were defined using the Rinner and Router, which made the equation easy to change to fit
the small end of the cone as well as the large end of the cone. The thickness of the spiral partition had to
vary so that the saturation remained the same during pulsations. With a fixed thickness, the angle at which
the second spiral would begin was not the same for the two different outer radii, the smaller bottom in
comparison to the larger top. The thickness of the spiral partition was defined by Equation 14, and was
based on the angle at which the second spiral starts, 24.167°. The remaining 169.23°,not taken up by the
41
straight partitions, were made up of two 24.167 ramp increases of partition thickness and the actual range
of changing saturations 120.833 (145-24.167).
Eq. (14)
Due to the change in the thickness of the spiral partition, the outer radius thickness would have to
increase as well to keep the net gain of the non-blood component through the path length at zero. The
outer radius thickness was then a function described by Equation 15. Rinner is constant throughout the cone
chosen to be 0.25 cm and represents the inner radius. Router is the changing outer radius resulting
in
. This allows for a 3% increase in path length which will represent the
3% change in blood due to pulsations.
Eq. (15)
The core was then created using Solidworks using the parameters described above. A sketch of the
core design is shown in Figure 23 along with the three dimensional CAD model. The resulting partitions
create four half-cresent compartments for the two solutions.
Figure 23: Sketch of the core design and CAD model isometric view.
42
A recent modification of the design eliminates the ramp increase of the spiral partition thickness. This
increases the range of degrees over which the spiral line extends from the inner radius to the outer radius
by 47.63° (current range: 120.833°, new design range: 168.463°). This will be over 39% more accurate.
This design has the same principles, but eliminates increasing the thickness of the partitions. The
equations below were used in defining this design. The first spiral is defined by Equations 16-18 and the
second spiral is defined by Equations 19-21.
Eq. (16)
Eq. (17)
Eq. (18)
Eq. (19)
Eq. (20)
Eq. (21)
This gives a fixed thickness of the spiral partition throughout the cone, which was set at 0.05 cm.
Rinner was chosen to remain at 0.25 cm, and Router variation remained the same
. With a fixed partition thickness, the outside radius thickness also remained fixed at 0.05 cm.
This new design is less complex to design, making it easier to change the dimensions. The straight
partitions no longer need to flair outward (from the inner to outer radius) and now can stay parallel with
each other and 0.05 cm apart, offset by 180°.
Rotating the core the 168.463° of the spiral will give a linear change in the saturation percentage from
that of solution high to solution low as a function of the incident light angle through the center. From 0°
to -6.43°, solution high will have a decreasing path length and the path length of the plastic will increase
until only plastic is seen (at -6.43º). Plastic will then be the only absorber for the next 2.3° in the negative
direction. Solution low then begins to show an increase in path length and the plastic will show a
decreasing path length for the next 2.81° in the negative direction. Our design will only need to rotate
180°, which is accounted for (168.46+6.43+2.3+2.81=180). The negative degrees represent rotation of the
model in the clock-wise direction. A full 180º of the design will be identical to the remaining 180º from
the design, so that -1º looks the same as 179º. The zero degree point is considered to be along the positive
x direction and 180º is along the negative x direction with reference to the center point of the device.
43
The above describes one half of the cone, and the other half is the duplicate of this, simply rotated
180°. The light from the pulse oximeter goes through both sides to reach the photodiode. This means that
the ratio calculated from one side needs to be doubled when determining oxygenation.
The final design can be seen in Figure 24. A sketch of the smaller end is shown as well as an
isometric view of the cone. The length of the cone is 1.25 cm.
Figure 24: Sketch of new core design and CAD model isometric view.
In order for the core to perform the necessary functions, it needs to hold liquid. This functionality
required that the device is completely enclosed. Also, there needs to be a way to fill the partitions with the
proper oxygenated liquid. Due to the size of the device, it was determined that the only way to fill the
device would be using a needle and syringe. It would be very difficult to have a cap that screws on or
snaps on given the size. Due to these constraints, a septum closure will be used over holes in the cap. The
proper liquid can be injected into the core through the septum
The device also needed a method of attachment to the rest of the device. The easiest mechanism for
attachment in order to keep the device secure would be a screwing mechanism. The base includes a
tapped hole that will screw onto the main device. The CAD model of this conical device with the cap and
bottom piece is shown in Figure 25. The cap is shown with the holes for fluid injection. The bottom
portion is attached, and the screw hole is shown (without the tapered edges).
44
Figure 25: Conical assembly with cap and bottom piece.
5.2
Core Manufacturing
The core needed to be 3D printed due to the conical shape. It would be extremely difficult to use a
standard machine as it would need three degrees of freedom to produce the tapered internal features. The
small size of the device also limited the type of 3D processes that could be used. Machines at WPI were
not equipped to deal with our small cone, and, because of this found an outside company to produce the
core. In the first attempt to print the device, the team used laminated object manufacturing at Intelitek
(Manchester, NH). This process was performed twice with walls of various thicknesses. The walls in the
first process were 0.5 mm thick which caused the walls to collapse after device printing. The walls in the
second process were 1.5 mm thick which did not allow for the manual inner material extraction necessary
for this process. This required us to find a company that specialized in rapid prototyping such that our
device could be processed using a different type of 3D printing. The third attempt at core printing was
done by Cideas (Cary, IL) using a process called Polyjet, ideal for detailed, high-resolution pieces. The
resolution of this process was ±0.005” which was necessary in our device in order to obtain the proper 13% change in the walls of the core. Fullcure 720 was the material used as it produced a semi-transparent
amber material, the closest to skin color achieved in this type of 3D printing. The piece was printed with
the base attached and the top piece was printed separately in order to allow septum closure attachment
between the top piece and the conical portion. Two copies of the core were printed.
5.3
Motor Systems
The design uses two motors in order to obtain the correct pulsations and oxygenation. The pulsations
come about by reciprocating the conical device within the light path of the pulse oximeter. This is
achieved using a servo motor in combination with a four-bar crank-slider linkage. This configuration
45
turns rotational motion into reciprocating motion. The servo provides the rotating crank while the shaft
connected to the conical model is the reciprocating slider. This type of motor was chosen because it varies
easily between two extremes rotating a total of 60°. This is necessary to obtain pulsations within our
system. When the servo rotates between its extremes, the conical device is pushed and pulled, forward
and backward. This creates a pulse according to the pulse oximeter. Since the device is cone-shaped,
moving it backward and forward will decrease and increase the amount of liquid as seen by the pulse
oximeter. This is similar to the increase and decrease in volume within a finger during pulsations. The
servo can be programmed to allow pulses to be created at a speed between 30-250 BPM. It also is
possible to alter the rotations of the servo such that the subsequent movement of the conical device will
create a waveform similar to that of a normal arterial blood pressure waveform. The servo used in our
device is an HS-77BB HiTec Low Profile Servo. The servo has a running speed of 60° rotation in 0.17
sec at 5.0V.
The oxygenation as seen by the pulse oximeter is altered by rotating the conical device. This is
accomplished using a stepper motor. The stepper motor can accommodate 360° of rotation with
controllable step angles. This will allow precise control over the change in oxygenation. As the conical
device rotates, the oxygenation as seen according to the pulse oximeter changes due to design of the
partitions within the conical device. The amount of change is dictated by the amount of rotation. With
saturation variation between 0-100%, an angle change of 1.2-1.3° will cause a change of 1%. The stepper
motor used has a minimum step angle of 1.8° which would cause a 1.3% increase in oxygenation. The
stepper motor shaft is attached to the servo which in turn is attached through the crank-slider to the
conical device. All components are proportioned such that the linkage attached to the conical device and
the stepper motor shaft is on the same linear plane supported by the base walls. As long as the shafts are
rotating on the same axis, there will not be any distortion between the stepper rotation and the rotation of
the conical device. The servo is suspended such that it can be rotated by the stepper. The stepper has the
ability to rotate a full 360°, but our device will not rotate beyond this point due to the limitations imposed
by the cord extending from the servo motor. When all of these constraints are taken into account, the
stepper can rotate the conical device to the proper oxygenation position. The stepper motor used in our
device is a ROB-09238 Stepper Motor (Sparkfun Electronics).
These motors are driven by two circuits. The stepper has its own driver, an EasyDriver Stepper Motor
Driver ROB-09402 (Sparkfun Electronics), with a micro stepping resolution to full, half, quarter and
eighth steps. It has adjustable current control from 150mA/phase to 750mA/phase and can be controlled
by a power supply ranging from 7V to 30V. The servo is driven by the USB Bit Whacker – PIC 18F2553
Development Board (Sparkfun Electronics) which comes preprogrammed with boot loader and UBW_D
firmware to allow easy programmability.
46
The entire system can be seen in Figure 26. On the left is the stepper motor connected in the middle to
the servo which in turn is connected to the conical device on the right. The tube surrounding the conical
device and shaft is the finger dock on which the pulse oximeter will attach. The red pieces attached to the
base are the circuit boards driving both motors, the stepper driver next to the stepper and the USB Bit
Whacker in the section next to the servo. The stepper is raised such that the servo can be suspended and
the shafts of the stepper and the conical device are on the same linear axis.
Figure 26: Pulse Oximeter Calibrator Device.
5.4
Base and Linkages Manufacturing
In order to gain the precision necessary to keep both motor movements aligned, the base components had
to be laser cut out of acrylic. The two end walls were adhered to the base platform for stability using an
acrylic solvent. The stepper support was also adhered to the back wall to align the middle wall which can
be removed if the device needs to be disassembled. The stepper attachment to the servo as well as the
linkage from the servo to the core shaft was laser cut as well. It was essential to obtain the correct height
of the servo motor to maintain alignment of the shafts. The resolution in the laser cuter was specified to
be ±0.005”. Each piece was designed to slip fit into the other base pieces; however, due to the laser beam
width and the resolution, not all the pieces were as tight as originally designed and needed to be adhered
to be level and maintain stability. The notches within the finger were cut using a vertical mill. The finger
47
can then slip fit into the outer wall to allow pulse oximeter probe attachment and guide movement of the
core during pulsations. The shaft connected to the core was originally a threaded rod and the threads were
removed using a lathe. This was done in order to maintain a standard thread size, and it was simpler than
threading a bare rod.
5.5
Programming
Due to the nature of our device and the ways in which it will be used, it is necessary to have a way to
easily facilitate repeated and consistently reproducible movements. For this reason, it is important to have
some sort of simple user interface which would allow users to consistently produce the same functional
results with minimal effort and technical knowledge of the motor systems.
The program used to control the device was tasked with performing three basic functions. First, it had
to control two motors, a servo motor and a stepper motor. Second, it had to allow for user defined values
to be inputted for the Beats per Minute, Running time, and Stepper degree orientation. Finally, the third
function called for both of the above to be accessible through a clearly defined and intuitive user
interface.
The aforementioned program is written using Python. The reasons for this are twofold. Python is a
very minimalistic language. By itself it has only a very limited number of core functionalities. Its strength
lies in its ability to utilize a vast library of plug-in modules which give it increased functionality. This
means that a program written in python will tend to be both smaller and faster than one written in a more
robust language that has a great number of functionalities constantly present. The second reason for
choosing Python is simply that it was a language which was already familiar to the team. This meant that
the time spent learning the language would be minimal and work could be conducted more efficiently.
When programming medical devices, it has become somewhat of an industry standard to use (at least
in part) the block language LabView. The team decided against using LabView for multiple reasons.
While LabView boasts a simplistic and understandable editor for non-programmers, it has a base level of
complexity which cannot be reduced. Python by nature is a language that was built to be very bare bones,
with infinite potential for features to be added onto it. It is this nature that made it idea for programming
our motors. Firstly, the actual functional code for the motor drivers involves simply printing text
commands to a serial port. Python can do this in one line of code after importing the "serial module" (a
task requiring only one more line of code). However, to accomplish the same task in LabView one would
need several blocks connected correctly. Another issue is the amount of times the code needs to be edited,
revised or almost completely redone. With python, this is a simple matter of changing around a few lines,
deleting a section of code, or moving a line to a new spot to change its functionality. This simple editing
is more complex and time consuming in LabView. Complete revision of the code would require the
48
deletion of some of the blocks used previously and their replacement by new blocks with different
functionality.
To give more specific examples of Python‟s functional diversity, the current build of the program
uses three modules. They are Tkinter, Serial, and Time. “Tkinter” is a module for python made
specifically for the purpose of creating a UI or “User Interface” (also referred to as a GUI or “Graphic
User Interface”). It adds functions that allow python to create a window and place things within that
window such as message bars, menu bars, buttons, and dialogue boxes. It also allows the program to
make pop up dialogue boxes such as error messages and make requests for user input. “Serial” is a
module which allows Python to communicate with the computer‟s serial ports. This is the most essential
plug in for this program, as all interfacing with the motors is done via a virtual serial port (this topic will
be discussed in more detail later). Finally “Time” is a module which provides a simple, yet essential
function. It allows the program to recognize the exact time and date since the epoch (January 1, 1970),
and thereby recognize the passage of time. It also allows for the use of a delay function.
The UI for the device is fairly minimalistic. It consists of five buttons arranged in a small window.
From right to left are the “set BPM”, “set time”, “Rotate Stepper”, “reset”, and “Start” buttons (Figure
27).
Figure 27: GUI for Pulse Oximeter Calibrator
For the most part the names of these buttons are fairly self-explanatory, though their exact
functionality will be discussed later.
In relation to the code itself the buttons are packaged in a very efficient fashion. Each button is
essentially its own compartment containing a description and a reference to the function which it
activates. The functions are completely separate entities from the buttons which call them. This division
and compartmentalization means that making changes to the actual program is as simple as swapping out
one component for another. Also should there be an issue with any one function it is a simple task to
identify the source of the problem since the break will only happen when that function is called by its
corresponding button.
The servo motor is responsible for creating the rapid pulsations which are read by the pulse oximeter
as a heartbeat. The program accomplishes these motions by sending the motor a series of text commands
through the virtual serial port. The board which we are using interprets text commands which are defined
49
by the board‟s firmware. The servo is commanded using the format “RC, (port letter), (Pin Number),
(Position number)”. The program we are using works by printing these text commands to the serial port in
a specifically timed and ordered pattern meant to simulate the pulsations seen in an actual human
specimen (See Appendix B section 3).
The BPM defined by the user actually works by modifying the delay placed in between each arches of
the beats within this artificial pulsation. The time duration set by the user works by measuring the time
between when the program was started (with relation to the Epoch) and the current time (also with
relation to the Epoch). If this measured time is equal to or exceeds the time defined by the user (in
seconds) then the program terminates, if not, it continues (See Appendix B section 3).
The stepper motor is responsible for rotating our finger model into the correct orientation which in
turn gives the desired oxygen saturation. To accomplish this function, two things are required. The
program must be able move based on user defined degree values and reset to the original starting position.
These two functionalities are achieved in much the same way. First, the specified degree rotation function
stores the user input and inserts it as a time delay between the activation and its deactivation of the
stepper. The stepper is currently set to receive a square wave at 2Hz. At this frequency it moves exactly
3.65 degrees for each second (See Appendix B section 4). The second function, the reset button works by
using the same user defined variable as above, again converting it to a time and inserting it as a delay
between activation and deactivation. Due to the way the board controlling the stepper works to move it
backwards a continuous signal must be sent to the direction pin, and another continuous signal sent to the
stepper control pin. This causes the stepper to rotate backwards continuously and stop after traveling the
same distance backwards as it did forward (a distance defined by the user). (See Appendix B section 5)
A few compromises had to be made with the structure and functionality of the Stepper code. For
instance, before the user can define a new degree value for the device they must first press the reset button
to return it to the neutral starting position. This is caused by the inability of the program to store any but
the very last user defined variables of any one given type.
These functions were compiled into an executable file that can be opened by the user. This file can be
used after the install drivers have been downloaded to the computer. The program would need to be
altered depending on the USB port connected to the Microcontroller. An additional feature would allow
the program to function no matter which port the USB is plugged into. Overall, the function of the GUI is
simple and intuitive. Several people outside of the project group have been able to use the interface
without any problems.
50
5.6
Bill of Materials
Component
HS-77BB Low Profile Servo
Stepper Motor with Cable
ROB-09238
EasyDriver Stepper Motor
Driver ROB-09402
USB Bit Whacker – PIC
18F2553 Development
Board
Base
Stepper attachment
Cam components
Core Shaft
Finger dock
Conical device
Septum Closure
Power supply
Program
Computer
Specifications
Speed: 0.14 sec @ 60° running at
6.0V
Size: 1.73 x 0.90 x 0.98 in
Step Angle: 1.8°, Rated voltage:
12V, Rated current: 0.33A,
Size: 1.67x1.67x1.34 in
Shaft size: 0.945 in, 5 mm
diameter
Microstepping resolution to full,
half, quarter and eighth steps.
Adjustable current control from
150mA/phase to 750mA/phase.
Power supply range from 7V to
30V
Size: 2 x 4.8 cm
16 General I/O, Preprogrammed
with Boot loader and UBW_D
firmware
Size: 2.54 x 4.064 cm
Acrylic
Thickness: 0.5334cm
Base Size: 16.523 x 14.355 cm
Acrylic
Size: 2.96 x 2.20 cm
Thickness: 0.5334cm
Acrylic
Thickness: 0.635 cm
Length: 6.5 cm, Diameter: 0.317
cm
Price
$31.94
Suppliers
Servo City
$18.89
Sparkfun Electronics
$14.99
Sparkfun Electronics
$28.89
Sparkfun Electronics
$5.00
Plastics Unlimited
$1.04
Home Depot
Plexiglas – 5.715cm tube
Outer diameter of 0.75 in and Wall
thickness of 0.0625 in
Polyjet process, Fullcure 720
material (2 copies)
13 mm in diameter
5V logic levels, 12V stepper
supply
Python
Programming, power for
Microcontroller
$5.94
Plastics Unlimited
$60.00
Cideas
$2.08
N/A
VRW
N/A
N/A
N/A
N/A
51
6.0
Experimentation
6.1
Dye selection
The blood component is represented in our design by two solutions, one which represents 100%
oxygenated blood, and one which represents 70% oxygenated blood. The saturation as seen by the pulse
oximeter is varied by rotating the devices such that the light from the pulse oximeter‟s LEDs will pass
through each section with a specified path length and is thus a function of the core‟s angular position.
Fully oxygenated blood absorbs less than fully deoxygenated blood in the red light spectrum and
absorbs slightly more in the infrared spectrum. The normalized ratio of change in red absorbance to
change in infrared absorbance is measured by the pulse oximeter and compared to the pre-calibrated
oxygenation values associated with this ratio value. Thus, the oxygenation can be most easily controlled
through changing the amount of red light that is absorbed. This change in absorbance is caused by
pulsations, which effectively increase the path length of the blood component in the finger, and is
mimicked by the stepper motor in our device.
The team looked at a variety of commercially available dyes that could be mixed with a solvent for
representing each component in the device. However, these dyes were available only in increments of one
milligram and one gram would cost anywhere from $50-$190 depending on the supplier. This cost was
more than the team had left in available funds, so an alternative was sought. Everyday products such as
food coloring, beverages, and powdered drink mix were purchased and tested with a spectrometer to
determine absorbance. Once the absorbance of the solution was known, the extinction coefficient could be
determined using the path length of the spectrometer cuvette and the concentration of the solution.
The purchased dyes were mixed with water to obtain a concentration within the spectrometer scale.
The spectrometer can only measure the absorbance of a dye solution accurately when the absorbance is
between 0.2 and 1.0 absorption units. The volume of food coloring was measured and the powdered drink
mix was weighed before each was added to individual samples of a known volume of water. After all the
testing was complete, the team found that there were three dye solutions that could be used. Powdered
drink mix concentrations were measured to avoid saturation. The other food color solutions that were
tested required almost only food coloring to be used to obtain the necessary absorbance for calculating the
extinction coefficient. This high concentration was not practical for the device. The concentrations used
for testing can be seen in Table 5.
52
Table 5: Spectrometer results and calculated extinction coefficient.
Test #
1
Substance 660 absorbance
(flavor)
(average)
Wild berry0.2848
pomegranate
Concentration
Path
length
Extinction coefficient
0.02634 g/mL
1 cm
10.81348 mL/(cm*g)
2
Fruit Punch
0.1987
0.02638 g/mL
1 cm
7.533649 mL/(cm*g)
3
Cranberry
Pomegranate
0.0111
0.02655 g/mL
1 cm
0.418079 mL/(cm*g)
4
Cherry
0.1613
0.02623 g/mL
1 cm
6.15062 mL/(cm*g)
5
Strawberry
-0.0010
0.0280 g/mL
1 cm
-0.03571 mL/(cm*g)
6
Green dye
0.5830
0.001667 mL/mL
1 cm
349.800 mL/(cm*mL)
7
Yellow dye
0.0014
0.008333 mL/mL
1 cm
0.16800 mL/(cm*mL)
8
Red dye
0.0062
0.008333 mL/mL
1 cm
0.74400 mL/(cm*mL)
9
Blue dye
0.3094
0.0008333 mL/mL
1 cm
371.2800 mL/(cm*mL)
The results from the spectrometer are shown in Figure 28. The vertical axis shows the absorbance
values while the horizontal axis is the wavelength. The three dye solutions that had the highest absorption
in the red light spectrum are shown in the table and in the graph by a color that corresponds to the
solution.
3
Blue
2.5
Wild
berry
Green
Absorbance
2
1.5
1
0.5
0
620
630
640
650
660
Wavelength (nm)
670
680
Figure 28: Spectrometer results of blue food coloring, green food coloring, and wild berry pomegranate mix.
Once the extinction coefficient was known, the two dye concentrations could be calculated for 100%
oxygenation and 70% oxygenation to match that of a finger. A finger can range in size from one person to
the next and thus it is known that the absorbance of one finger is different from the next. This means that
53
the core absorbance does not need to match the absorbance of a single finger with the dye solution but
rather have the dye solution concentrated enough to produce an absorbance that is in the dynamic range of
finger absorbance.
6.2
Light Intensity
A pulse oximeter can only read light through a finger at certain intensities. Excess amounts of light or not
enough light going through to the photodetector will cause errors in the readings of the pulse oximeter.
Outside of this error range, the pulse oximeter will not be able to read the light signal. Light intensity
through the core of the device needs to be in the proper range in order for the pulse oximeter to obtain a
correct reading. The material for the core was chosen such that it would approximately match the finger
tone and would not be overly transparent. While, visually, this material may look like it would give the
proper oximeter reading, it needed to be tested to determine if it would give the proper numerical results
similar to that of a finger. Not only did we need to test the material for the core, but also the material with
the dyes in the selected concentration.
These materials and solutions were tested without the pulse oximeter using a simple photodetector
circuit. Using two LEDs at the proper red and infrared wavelength and a photodetector, we measured the
light intensity through a finger, the core, and the core with dyes. An example of this circuit is shown in
the Figure 29.
Figure 29: Example photodetector circuit to measure light intensity.
The material being tested was placed between the LED and the photodiode, similar to that of a pulse
oximeter. A guide tube was placed between the LED and the photodiode to keep the finger in the same
place during each test. The input and output of the circuit was measured by an oscilloscope to determine
the amount of light is going to the photodetector. This experiment was conducting with multiple fingers
of different skin tones to get an average result. Then, the finger result was compared to that of the core
with and without the dyes chosen for the device. Since only a small amount of light will be going to the
54
photodiode through a finger, the gain at the output stage was increased to detect the light. This is why the
circuit above is only an example; the gain stage was adjusted by altering the 1MΩ resistor to a 2MΩ
resistor.
The results of this test showed that using high concentrations of dyes would provide absorbance that
was similar to a finger. However, the team found that the concentration was limited by the amount of
powder mix that could be dissolved. The team chose to use the highest concentration of the wild berry
pomegranate solution that would be allowed without saturation.
6.3
Device Testing
Testing of the device first involved the establishing functionality of the motors. Each motor was tested for
accurate control through a GUI. The device was then connected to a pulse oximeter probe to test the
accuracy of the heart rate and oxygenation values displayed by the pulse oximeter.
The servo motor was tested by inputting a user value into the interface and recording the beats
outputted during each test. The test ran for two minute intervals and the number of simulated beats was
counted by two team members. These BPM results were then compared to the user defined value. The
stepper motor rotation tests were conducted by inputting step values of 5º, 10º, 30º, 90º, and 180º
increments. These step angles were then measured with a protractor at both the stepper shaft and the core
shaft. These values were compared to the defined rotation angle. Measurements were taken at both
locations to determine if step degrees were lost through the linkage system connected at the servo wheel.
Pulse oximeter results were compared to the user defined value for oxygenation and heart rate. The
pulse oximeter probe was attached to the finger dock such that the LED and photodiode were aligned
vertically over the smaller end of the core. Once the pulse oximeter probe was aligned, the pulse oximeter
display was monitored for two minute intervals for heart rate tests and four minute intervals for
oxygenation tests. The larger time interval length for oxygenation values was used to allow the pulse
oximeter readings time to stabilize. The values displayed on the pulse oximeter were recorded and a
weight was assigned based on the amount of time each value was displayed in an interval. The weighted
average was found and compared to the user defined value. The PPG displayed on the pulse oximeter was
also compared to the compared to a sample human PPG waveform to determine signal accuracy. This,
however, was not necessary for calibration purposes.
Each pulse oximeter test was conducted with a CMS50F Wrist Oximeter and the Masimo SET
Radical pulse oximeter.
55
7.0
Results
7.1
Device Alterations
When testing began, several problems with the device design became apparent and several alterations
needed to be made to allow device function. The largest problems were linkage movement and stability.
The original design used a four-bar crank-slider linkage to translate the rotational movement of the servo
to linear actuation shown in Figure 30.
Figure 30: Four bar crank-slider linkage attached to servo
While sound in principle and in CAD modeling, this approach did not create smooth movement over
the intended degree range. Each portion of the linkage system needed to be supported to keep it level and
aligned. Only level movement would create the linear actuation necessary for pulsation simulation. The
shaft diameter was too small to allow a hole to be drilled through it. Without this hole, there was no easy
way to secure the shaft to the linkage to still allow rotation. To achieve the small amount of movement by
the core, the linkage between the shaft and the servo needed to be 2 cm in length. This size was too small
to easily attach it to both the servo and the shaft. The original CAD model also had the servo wheel on the
one side of the motor, but, the servo can only move within a certain degree range and needed to be on the
other side to allow this rotation. Overall, the linkage system created had many problems and could only
achieve pulsations within 30º of servo rotation. This was not acceptable and needed to be improved.
A new linkage system was designed to overcome this problem. Instead of using a crank-slider, a cam was
designed to allow 0.6 cm of shaft movement for 90º of servo rotation. The amount of space within the
walls and the necessary volumetric change determined the amount of linear movement while the servo
specifications determined the degree value. This design can be seen in Figure 31.
56
(a)
(b)
Figure 31: New linkage using cam attached to servo wheel, top view (a), side view (b)
In this set up, the cam is attached to the servo wheel in order to rotate between two positions. The start
position and end positions are indicated by the lines etched into the cam; the smaller line is the start while
the larger line is the end. This forms a 90º angle, the allowable rotation for the servo motor. When the
cam rotates, it compresses and releases a plate. Between the plate and the wall is a piece of foam to act as
a spring. The plate is attached to the core shaft such that, when the plate is compressed and released, the
shaft moves inward and outward within the finger dock. The plate has a grove in which the cam rotates.
This allows the rotation of the servo to also rotate the shaft since the plate will rotate when the cam
rotates. The servo was lifted slightly place the cam directly centered on the plate. This type of linkage
allowed movement without dependence on each component being level. It also allowed easier attachment
and component variation and alteration.
The base had originally been designed to allow easy assembly and disassembly. The center wall was
not adhered to the base plate or stepper support. The stepper also was placed on the stepper support with
the shaft through the center wall without any other way of anchoring the motor. These design choices
caused large motion artifacts in the PPG when servo rotation occurred. The servo had a large amount of
torque to move the linkages and caused the back wall to jump with each turn. The stepper would also
move when the wall jumped and when pressure was applied to the servo attachment. On the other end, the
outer wall with the finger dock would also bow out during pulsations. This caused large movement of the
finger dock, often hitting the core. The finger dock could not properly support the pulse oximeter probe
when attached. Certain probes were also too large to easily fit onto the finger dock.
The center wall was redesigned to allow stepper attachment and was glued to the base plate and the
stepper support to keep it from moving during Screw holes were added to the middle wall to secure the
stepper during movement (Figure 32).
57
Figure 32: Center wall screw holes for stepper.
While the stepper has four screw holes, only the top holes were used; bottom screws would hinder
servo rotation. Additional supports were added on the outer finger dock wall. A shaft support and new
finger dock wall were designed, as seen in Figure 33.
(a)
(b)
Figure 33: Finger dock support (a), finger dock additional wall (b).
All additional parts were constructed out of acrylic and manufactured using the laser cutter. With
these improvements, the overall functionality of the device increased and results could be obtained. The
results in the following sections were obtained after the adjustments had been made.
7.2
Motor Functionality
Each motor was tested individually to determine if the output matched that of the user defined value.
The servo motor was run for two minutes and two team members counted out the beats. This showed that
the servo was within ±4 BPM from the user defined value with higher deviations in the upper range with
larger variations near the higher BPM range. While our intended range was 30-250 BPM, the servo did
not have the capacity to produce over 150 BPM. The motor itself had the ability to move 60º in 0.17 sec
at 5V; however, this specification refers to no load on the servo and does not account for the speed of
commands from the program.
The stepper motor was tested at 5º, 10º, 30º, 90º, and 180º increments. This rotational motion needed
to translate through the mechanisms of the device all the way to the core to change the oxygenation.
Because of this, rotation was also measured at the shaft end. The stepper motor shaft moved the proper
increment amount during each test. The core shaft; however, lost rotation during the middle 90º of the
58
necessary165º rotation. The shaft successfully turned the proper amount for the 90º and 180º increment
tests. Smaller increments had errors once the rotation had reached approximately 35º. When this point
was reached, approximately 1-4º of rotation would be lost with each increment. Larger increments would
have a smaller deviation while smaller increments would have a larger deviation. During these tests, the
shaft would usually fall to 4º behind stepper shaft rotation. The reset button would return the stepper to
the previous position after a rotation increment. Identical errors were seen when the stepper moved in the
opposite direction. These errors can be accounted for due to the cam-plate connection. To have ideal
rotation, the grove needed to be a tight fit over the cam, which was not the case. The grove for cam
movement could only be a certain size to allow both cam rotation and shaft rotation.
7.3
Pulse Oximeter Testing
Figure 34 shows the measured BPM that was output by the device versus the specified BPM output for
the device (in blue). The red line indicates the identity. A linear regression was performed and is
displayed in the graph by the black line. The standard deviation is also shown for the BPM values; the
standard deviation from the user specified value was 2.441 BPM. This shows that the device is both
accurate and predictable in the nature of its heart rate simulation.
User specified BPM vs Measured BPM
BPM specified by user
160
140
120
100
80
y = 1.024x
R² = 0.9958
60
40
50
60
70
80
90
100
110
120
130
140
150
160
BPM measured by pulse oximeter
Figure 34: Specified heart rate value vs measured BPM.
Figure 35 displays the deviation from the user specified value versus the average of the measured
value and the user specified value. This shows that the device has a slightly faster pulsation rate at low
BPM and a slightly slow pulsation rate at high BPM.
59
Heart Rate
Deviation from User Value
6
4
2
0
-2
-4
-6
-8
-10
30
50
70
90
110
130
150
Average of Reference Heart Rate and Specified Heart Rate (BPM)
Figure 35: Masimo Heart Rate Deviation.
Figure 36 shows the PPG waveform of the device while attached to the CMS50F Wrist Oximeter. It
shows a one third rise time and two thirds fall time characteristic to human PPGs. In addition, a dicrotic
notch can be observed.
Figure 36: PPG waveform of Device with CMS50F Pulse Oximeter.
Figure 37 shows readings from the CMS50F when connected to the device. The data displayed shows
two trials, the first trial had a heart rate set to 72 BPM and the second trial had a heart rate set to 75 BPM.
The graph indicates a high level of accuracy in the control of the heart rate. However, it can be seen that
the accuracy of the oxygen level differs between the two trials. The first trial was able to stabilize the
oxygenation value after approximately 30 seconds and then remained at the same value. The second trial
shows a stabilization of the oxygenation value after approximately 30 seconds as well, but continued to
vary by 3% for the rest of the trial length.
60
Figure 37: CMS50F connected to device.
Figure 38 shows the CMS50F readings for a human volunteer. The data shows a variance in the
oxygenation value of 7% over the ten minute testing length. In addition, the heart rate is seen to vary by
about 10 BPM during the testing interval. The subject was sitting prior and during the test and was told to
breathe normally.
61
Figure 38: CMS50F connected to Human 1.
Figure 39 shows CMS50F readings for a second human volunteer. The data showed a variance in
oxygenation values of 5% over the ten minute testing length. The heart rate was initially measured as 90
BPM, but two minutes after the trial began the pulse oximeter measured approximately 60 BPM, which
continued for the rest of the interval. The volunteer was at rest prior and during testing and was told to
breathe normally.
62
Figure 39: CMS50F connected to Human 2.
Several test trials were conducted for oxygenation; however, results varied a great deal between
different trials and pulse oximeters. The Masimo pulse oximeter could detect the heart rate but rarely
displayed the correct oxygenation value. If probe placement was exact, certain values could be achieved
for small intervals of time. When the device was connected to the CMS50F, oxygenation values were
detected; however, the oxygenation values were inconsistent at different speeds. Oxygenation values
would rise and fall appropriately with the given direction when turning the device; however the degree of
the rise and fall was different such that it was difficult to return to a specific oxygenation value. Closer
inspection revealed that the linear actuation of the core would cause the core to shift left or right during
the diastole end of pulsation. This meant that the light path was not going through the core in the center
during all points in the pulsation, but rather off to one side at different points. With the given time and
resources, this mechanical problem could not be resolved. Given these problems, reproducible results
could not be obtained. Only one testing run showed promising results, as seen in Figure 40. This run was
done after taking a large amount of time to adjust the pulse oximeter probe. Based on the position of the
core, the user specified value was visually estimated to verify oxygenation. The team created a reference
paper that could aid the visual verification of the oxygenation value. Furthermore, the team found it
impossible to make correlations between the tests due to the high sensitivity of probe placement.
63
Deviation from Oxygenation (CMS50F)
5
Deviation (SpO2)
4
3
2
1
0
-1
-2
70
75
80
85
90
95
100
Average of Reference Oxygenation and Specified Oxygenation(SpO 2)
Figure 40: Oxygenation Deviation with CMS50F Pulse Oximeter.
Given the lack of reproducible oxygenation results, statistical analysis could not be properly conducted.
Analysis was done using the data above. Figure 41 shows the measured oxygenation that was output by
the device versus the specified oxygenation (in blue). The red line indicates the identity. A linear
regression was performed and is displayed in the graph by the black line. The standard deviation is also
shown for the oxygenation values; the standard deviation from the user specified value was 1.632%.
Specified vs Measured Oxygenation
Specified Oxygenation (%)
100
95
90
85
80
75
y = 0.9467x + 3.7626
R² = 0.9571
70
65
65
70
75
80
85
Oxygenation (%)
90
95
100
Figure 41: Specified oxygenation value vs measured oxygenation.
Qualitative assessments were made to determine approximate accuracy and possible improvements.
The overall assessment was that heart rate could be reproducible but depended on the pulse oximeter used
and could be improved upon with alterations in servo speed. Oxygenation could also be achieved if probe
placement was verified and mechanical stability could be achieved. Testing results verified the theory
behind the core design since simulated signals could be achieved.
64
8.0
Discussion
From the results, it can be seen that our device did meet most original specifications. The heart rate could
be simulated between 30-160 BPM, and the oxygenation could be simulated between 70-100%. These
values could be easily varied by changing the programming or concentrations of the dyes in the core.
Both the CMS50F and the Masimo pulse oximeter could simulate a steady heart rate over two minute
intervals. The results of the CMS50F pulse oximeter indicate that this method of calibration can
controllably simulate different oxygenation levels. The PPG waveform of the device, as measured by the
CMS50F, shows many similarities to the human PPG waveform seen in Figure 42.
Figure 42: Human PPG waveform.
Both show a one-third rise time and two-thirds fall time along with a dichotic notch. While this is not
necessary for the calibration of a pulse oximeter, it does show the accuracy of the simulated signal. The
PPG waveform of the device when connected with the Masimo pulse oximeter showed a signal that
appeared to be inverted. The team was unable to identify why the simulated signal on the Masimo pulse
oximeter was different from that of the CMS50F, but reasoned that the differences could be due to
differences in the processing techniques that are employed internally by the pulse oximeters.
Alternatively, the difference could be related to the pulse simulation, which used motor wait times instead
of varying the motor speed.
With some improvements in the design, the accuracy of the calibrator can be improved. This was
apparent when testing began as alterations to the device needed to be made upon first assembly to obtain
results. Other improvements would reduce motion artifacts during operation and resolve a method for
repeatable probe placement, such that measurements are taken from the desired location. Probe placement
seemed to be the largest variable during testing and adjustment of the probe would take a considerable
amount of time before each test. The length of the core was slightly too small for the size of the LED and
photodiode windows of the probe. The partitions of the core also caused particulates to catch in the
corners, causing staining and further affecting the oxygenation results.
Given the large amount of variability of our design, the reproducible results obtained only further
solidify the theory behind the design of the core. Simulated signals were obtained by the pulse oximeter
for both heart rate and oxygenation even with the many problems found during testing.
65
9.0
Conclusions
Based on the experimental results derived several conclusions can be drawn. Through extensive testing of
the core with the two different pulse oximeters we saw a great deal of evidence supporting our theory that
conical shape accurately reproducing the volumetric change of a human subject to a pulse oximeter; and
with a reasonable level of error (less than ±2%) the pulse oximeter read the same heart rate values input
by the user. However, the waveform created by the pulsations does still need some improvement. Largely
due to inadequacies in the program and issues with the probe attachment, the wave form is only similar
and not identical to that produced by a normal human subject.
The blood oxygenation functionality of the core also seems to work well, but there were issues with
maintaining the reproducible probe attachment, and so the testing results would vary. Results with the
CMS50F pulse oximeter typically followed a pattern in line with the increase or decrease we expected,
however the values were not exactly where they should be, suggesting that the pulse oximeter might not
be vertically aligned. This indicates that the idea behind the core design seems to work as expected,
however due to design issues of the probe attachment site and other design flaws, the oxygenation values
were not reproducible or consistently accurate.
Overall we can conclude from our results that the theory governing the design of the core has great
potential. Its conical shape provides the volumetric change needed for the pulse oximeter to read an
oxygenation and heart rate, and the values for blood oxygenation follow a pattern similar to those we had
expected to be produced. Thus making a few basic alterations to the overall design of our device would
improve its performance significantly.
66
10.0 Future Improvements
It is our feeling that most of the reason we were unable to bring our calibrator model to a state in which it
could move into more extensive and regular testing is that there wasn‟t enough time. Should we have had
time to move on with our testing and adjustments, it is possible we could have had the calibrator working
in a state in which it could be considered for production. In addition, some of the smaller design flaws
could have been addressed with a second or third iteration of the design.
Some issues with the device which are immediately obvious and have foreseeable solutions are the
length of the core component, the method by which the probe is attached to the finger dock, the strength
of the base materials and the maximum speed of the servo motor.
The length of the core component has a significant effect on the PPG waveform. If the core was
pushed beyond its length the pulse oximeter would display odd readings, and the results would be corrupt.
It would seem that much of the differences between the wave form produced by our device and that of a
human subject are caused by the shortness of the core, and the limitation of a single speed for the servo
motor. We therefore propose lengthening the core component to effectively increase the range in which
the device could actuate. In addition, our device would be able to reach heart rates of up to 250 BPM.
However, we were limited to one available speed, and the maximum heart rates we could achieve were
150-160 BPM. This problem could be rectified by using a different, higher speed servo motor in its place.
Another issue with the servo motor is its use of delay times in the programming rather than actually
changing the speed at which it turns. This is a problem which can only be rectified by altering the
program used to run it and the firmware installed on the microcontroller.
Another essential change would be improvement is the finger dock. This part of the device is one
which has caused much trouble during our testing. The current model causes a great deal of trouble when
trying to properly attach the pulse oximeter probe to the dock. The device, therefore, could benefit greatly
from the addition of some mechanism which would allow for consistent and easy attachment to the proper
location on the dock.
Finally improvements to the strength and stability of the current base would improve the accuracy of
our results. At the moment the base is composed of five interlocking pieces of acrylic which are held
together by glue. Because of this design structure, during operation a slight bowing effect can be
observed. This bowing can lead to motion artifacts in the pulse oximeter signal and even misalignment of
the pulse oximeter probe. If the base of the device were to be made from a more solid material, such as
aluminum, or even if the current base were to be reinforced with some type of support structure such as a
roof or thicker walling, it would make great strides in reducing this bowing effect and therefore the
motion artifacts in the signal.
67
References
[1] Aoyagi, Takuo, et al. “Apparatus for Calibrating Pulse Oximeter.” Patent 5278627. January 11, 1994.
[2] Clinical Dynamics. “SmartSat Information: SmartSat Pulse Oximetry Analyzer.” 2009.
http://www.clinicaldynamics.com/smartsat_specs.htm.
[3] Hornberger, Ch., et al. "A Prototype Device for Standardized Calibration of Pulse Oximeters."
Journal of Clinical Monitoring and Computing 16.3: 161-9, 2000.
[4] Hornberger, Ch., et al. "A Prototype Device for Standardized Calibration of Pulse Oximeters II."
Journal of clinical monitoring and computing 17.3-4: 203-9, 2002.
[5] Kent, Joel C., and Mendelson, Yitzhak. “An In Vitro Tissue Model for Evaluating the Effect of
Carboxyhemoglobin Concentration on Pulse Oximetry.” IEEE Transactions on Biomedical
Engineering, 1989.
[6] Mendelson, Yitzhak. "Pulse Oximetry." Wiley Encyclopedia of Biomedical Engineering. John Wiley
& Sons, Inc., 2006.
[7] Oura, M., et al. "Calibration System for Pulse Spectrophotometry using a Double-Layer Pulsation
Flow-Cell". Engineering in Medicine and Biology Society, 2009
[8] Reynolds, K. J., et al. "In Vitro Performance Test System for Pulse Oximeters." Medical & biological
engineering & computing 30.6: 629-35, 1992.
[9] Volgyesi, George A. “Method of Testing the Accuracy of Pulse Oximeters and Device Thereof.”
Patent 5166517. November 24, 1992.
[10] Webster, J. G. Design of Pulse Oximeters. IOP Publishing Ltd, 1997.
[11] Yount, John E. “Devices and Procedures for In Vitro Calibration of Pulse Oximetry Monitors.” The
State of Oregon Acting by and through the State Board of Higher Education on Behalf of Oregon
Health Sciences University, assignee. Patent 4,834,532. May 30, 1989.
[12] Yount, John E. “Devices and Procedures for In Vitro Testing of Pulse Oximetry Monitors.” The
State of Oregon Acting by and through the State Board of Higher Education on Behalf of Oregon
Health Sciences University, assignee. Patent 4,968,137. November 6, 1990.
[13] Zhou, G.X., et al. “Pulse Oximeter Calibrator Based on a Liquid-Crystal Light Valve.” Annual
International Conference of the IEEE Engineering in Medicine and Biology Society. 12.5: 2012-13,
1990.
68
Appendix A: CAD Models
Figure A1: Original Full Device.
Figure A2: Adapted Full Device.
69
Figure A3: Original Base.
Figure A4: Adapted Base.
70
Figure A5: Servo Motor.
Figure A6: Stepper Motor.
Figure A7: Original servo attachment.
Figure A8: Adapted servo attachment to stepper shaft.
Figure A9: Cam for linear actuation.
Figure A10: Cam walls with guide grove and shaft hole.
71
Figure A11: Finger Dock.
Figure A12: Conical device sectional view and side view.
Figure A13: Device with probe attachment over core.
72
Figure A14: Full device with probe attached and user interface.
Figure A15: Full device top view with probe attached and circuit connections.
73
Appendix B: Code
Section 1:
Python is a language that has a very limited set of core functions and features. However, the language
has an extensive library of modules which can be called to give Python an impressively robust set of
tools. The below section of the code is what calls all the additional modules which are necessary to run
the motor.
fromTkinter import *
importtkMessageBox
import serial
import time
importtkSimpleDialog
from time import sleep
Section 2:
This section is the heart of the program. This App class creates the user interface (UI) window, the
buttons within it, and the functions which are called when the user clicks on any of the buttons.
class App:
BPM = 0
max_time = 0
def __init__(self, master):
frame= Frame (master)
frame.pack()
self.button = Button(frame, text="Start", command=self.halfstep)
self.button.pack(side=LEFT)
self.button = Button(frame, text="Set BPM", command=self.set_BPM)
self.button.pack(side=RIGHT)
self.button = Button(frame, text="set time", command=self.set_time)
self.button.pack(side=RIGHT)
defset_BPM (self):
self.BPM= int(tkSimpleDialog.askinteger("BPM", "Enter BPM please"))
defset_time (self):
self.max_time=int(tkSimpleDialog.askinteger("Time", "Enter Time please"))
Section 3:
This section is a part of the aforementioned App class, it is the function called by the “start” button in
the UI. It operates by setting the start time to the current moment (based on the epoch) and comparing the
74
current moment to the start time and checking to see if the difference between that and the start time is
still less than the user defined max time.
defhalfstep (self):
start_time = time.time() # remember when we started
print "max_time: "
printself.max_time
while (time.time() - start_time) <self.max_time:
ser = serial.Serial (3) #Opens COM port 4
ser.write ("r\r") #resets device
ser.write ("C,0,0,0,0\r")
ser.write ("O,0,0,0\r")
#ser.write ("RC,B,0,7500\r")
sleep(.125*self.BPM)
ser.write ("RC,B,0,5000\r")
sleep(0.1625*self.BPM)
sleep(0.0625*self.BPM)
ser.write ("RC,B,0,1\r")
sleep(0.59375*self.BPM)
ser.write ("r\r")
ser.close ()
Section 4:
This is the section of the code which adjusts the degree of the stepper. It works by first asking the
user for a degree value, converting it to a time value and then running the program for the amount of time
it would take for the motor to step to that position.
def adjust_degree(self):
self.Degree=float(tkSimpleDialog.askfloat("Degree", "Please enter
degree"))
print ("Step 1 Complete")
ser = serial.Serial (3) #Opens COM port 4
ser.write ("r\r") #resets device
ser.write ("C,0,0,0,0\r")
ser.write ("O,0,0,0\r")
ser.write("F,2,A,1/r")
#ser.write("F,0/r")
ser.write ("r\r")
print ("step 2 complete")
sleep(float((self.Degree)/3.65)) #somehow because of the timing
of the motor it
ser.write ("C,0,0,0,0\r")
ser.write ("O,0,0,0\r")
ser.write("F,0/r")
ser.write ("r/r")
ser.write ("r\r")
75
ser.close ()
Section 5:
This is the reset function. It recalls the last user defined degree of rotation for the stepper and move
the motor back that exact amount. Unfortunately this code does not remember how far the motor has
turned in total, therefore it must be used after every rotation of the stepper to reset it to the original
position.
def reset (self):
print("reset")
ser=serial.Serial (3)
sleep (1)
ser.write ("C,0,0,0,0\r")
sleep (1)
ser.write ("O,0,0,0\r")
sleep (1)
ser.write ("RC,A,1,100")
ser.write ("RC,A,1,100")
ser.write ("RC,A,1,100")
sleep (1)
ser.write ("RC,A,1,0")
sleep (1)
ser.write ("r\r")
ser.write ("RC,A,0,10")
ser.write ("RC,A,0,10")
ser.write ("RC,A,0,10")
ser.write ("r/r")
ser.write ("RC,A,1,0")
ser.close ()
sleep(float(self.Degree)*.000000000001)
ser = serial.Serial (3) #Opens COM port 4
ser.write ("r\r") #resets device
ser.write ("C,0,0,0,0\r")
ser.write ("O,0,0,0\r")
ser.write ("RC,A,1,0")
ser.write ("r\r")
ser.close ()
ser=serial.Serial (3)
sleep (1)
ser.write ("C,0,0,0,0\r")
sleep (1)
ser.write ("O,0,0,0\r")
sleep (1)
ser.write ("RC,A,1,100")
ser.write ("RC,A,1,100")
ser.write ("RC,A,1,100")
sleep (1)
76
ser.write ("RC,A,1,0")
sleep (1)
ser.write ("r\r")
ser.write ("RC,A,0,10")
ser.write ("RC,A,0,10")
ser.write ("RC,A,0,10")
ser.write ("r/r")
ser.write ("RC,A,1,0")
ser.close ()
sleep(float((((self.Degree))+00000000001)/110)+.04)
ser = serial.Serial (3) #Opens COM port 4
ser.write ("r\r") #resets device
ser.write ("C,0,0,0,0\r")
ser.write ("O,0,0,0\r")
ser.write ("RC,A,1,0")
ser.write ("r\r")
ser.close ()
77
Appendix C: Circuit Diagram
Logic Levels:
Ground Rail
5V Rail
Stepper Power:
Ground Rail
12V Rail
Pin B0: Servo
Pin A1: Stepper Step
Pin A0: Stepper Direction
Variable current:
approx. 330mA
Stepper Wires
A: Red, Green
B: Yellow, Blue
Stepper Step
Stepper Direction
78
Appendix D: Schedule and Timeline of Project Tasks
The team outlined the tasks for each term over which the project extends and estimated time frames
within which these tasks were completed. The Gantt charts below visually outline the aforementioned
tasks carried out during the four project terms.
A-term
Literature review
o Principals of pulse oximetry
o Pulse oximeter function
o Soft tissue mechanics
o Current pulse oximeter calibrators
Project proposal
o Revised client statement
o Alternative designs
o Schedule
Preliminary design of critical components
o Determine what methods will be used for different portions of the calibrator
o Simulation of pulse, blood, surrounding tissue, potentially motion artifacts and other Hb
variants
B-term
Evaluate alternative designs
Determine final design
o Establish specifications for oxygenation
- Rotation
- Path Length
- Wedge Partitions
o Establish specifications for pulse
- Conical Shape, angle and size
- Displacement
- Movement
Establish method of locomotion
o In/out
o Rotational
Establish Orientation and Fixation
Establish exact specifications for components
Determine materials and manufacturing process
o Finger casing
o Core component
o Base assembly
Determine devices for motion system
o Determine pricing and suppliers for components
o Order components
79
Complete CAD design of major components and full model
C-term
Develop a complete Bill of Materials (BOM)
Manufacture base and linkages
o Acrylic laser cutting
Manufacture core component
o 3D printing
o Polyjet, Fullcure 720 material
o Amber translucent material
Assemble Device
Testing
o Servo motor movement and programming
- Obtain proper speed and position
o Dyes acquisition and testing
- Produce desired light absorption
o Light intensity
- Neither too low nor too high to obtain results
D-term
Light intensity
o LEDs and photodetector circuit
o Match dye and core absorbance with finger absorbance
Stepper motor
o Program and test proper speed and position
Servo motor
o Program and test proper speed
Pulse Oximeter Testing
o Shows appropriate oxygen saturation
o Shows proper BPM
Final MQP Report
Final MQP Presentation
User Manual
80
Table D1: Gantt Chart B-term
B Term
Task
Week 1
Week 2
Week 3
Week 4
Week 5
Week 6
Week 7
Week 8
Evaluate alternative designs
Decide on a final design
Team
Dave
Heidi
Dave/Heidi
Matt/Heidi
Matt
Matt/Dave
Establish specifications for oxygenation - rotation, path length, wedge partitions
Establish specifications for pulse - concial shape, displacement, movement
Establish method of locomotion - in/out, rotational
Establish component orientation and fixation
Develop a complete bill of materials
Establish exact specifications for components
Determine material for finger casing
Determine material for core
Determine devices for motion system
Find components that fulfill necessary specifications
Determine pricing and suppliers for components
Decide on what final components will be used
Complete preliminary testing of oxygenation and pulse rate simulation
Complete CAD design of major components and full model
Order and receive components
Machine components
Determine testing procedures
Program the motor systems
Assemble attachment system - bearing block, finger
Assemble core component and linkages
Assemble motor system and electrical components
Begin testing device
Fix problems found in testing
S
M
T
W
R
F
S
S
M
T
W
R
F
S
S
M
T
W
T
W
R
F
S
S
M
T
W
R
F
1
2
3
4
5
6
7
8
9
10 11 12 13 14 15 16 17 18 19 20 21 22 23 24 25 26 27 28 29 30
1
2
3
4
5
6
7
8
9
10 11 12 13 14 15 16 17 18
24 25 26 27 28 29 30 31
R
F
S
S
October
M
T
W
R
F
S
S
M
T
W
R
F
S
S
M
November
S
S
M
T
W
R
F
S
December
Table D2: Gantt Chart C-term
C Term
Task
Week 0
Week 1
Week 2
Week 3
Week 4
Week 5
Week 6
Week 7
Program Motors
Create GUI
Select proper dye combination
Order and receive dye
Manufacture base components
Manufacture and receive core component
Assemble device
Post assembly testing
Test motor control
Test motor alignment
Test dye light absorption
Test core with dye light absorption
Test control and accuracy of oxygenation
Test control and accuracy of heart rate
Start user manual
Drat MQP report
Draft MQP presentation
S
M
M
T
W
R
F
S
S
M
T
W
R
M
T
W
R
F
S
9
10 11 12 13 14 15 16 17 18 19 20 21 22 23 24 25 26 27 28 29 30 31
T
W
R
F
S
S
M
T
W
R
F
S
S
M
T
W
R
F
S
S
1
2
3
4
5
6
7
8
9
10 11 12 13 14 15 16 17 18 19 20 21 22 23 24 25 26 27 28
F
S
1
2
3
4
5
January
S
M
T
W
R
F
S
S
M
T
W
R
F
S
S
February
March
Table D3: Gantt Chart D-term
D Term
Task
Week 1
Week 2
Week 3
Week 4
Week 5
Week 6
Week 7
Week 8
Test core with dye light absorption
Test control and accuracy of oxygenation
Test control and accuracy of heart rate
Complete user manual
Complete MQP report
Complete MQP presentation
Program Motors
Create GUI
Complete device assembly
Team
Matt
Dave/Heidi
Final Deadline
S
M
T
W
R
R
F
S
S
M
T
W
R
F
S
S
6
7
8
9
10 11 12 13 14 15 16 17 18 19 20 21 22 23 24 25 26 27 28 29 30 31
F
S
S
M
T
W
R
F
S
1
2
3
4
5
6
7
8
9
10 11 12 13 14 15 16 17 18 19 20 21 22 23 24 25 26 27 28 29 30
March
S
M
T
W
R
F
S
S
M
T
W
M
T
W
R
F
S
S
M
T
W
R
F
S
S
M
T
W
R
April
81
F
S
Appendix E: User Guide
1. Introduction
This device has been created for the purpose of imitating the optical properties of a human
finger to a pulse oximeter. The purpose behind this is to create a device which provides a more
efficient and cost-effective way of calibrating pulse oximeters. This device is capable of
simulating levels of blood oxygenation between 70-100%, as well as, frequencies of heart rates
between 30-250BPM as they would be seen by a pulse oximeter.
2. Necessary Equipment
a. Power Supply
b. Alligator Clips
c. USB Cable
3. Set up
a. Attach power supply to board
i.
Using alligator clamps, connect the power supply to the boards. The red wire of the
servo header should be connected to +5V. The M+ pin of the stepper driver should be
connected to +12V. Connect each ground pin of both boards to Ground.
b. Plug USB cable into computer. Plug the micro-USB end into the USB Bit-Whacker
Microcontroller
4. Installation
a. Use the install disk to install the drivers for the device to the computer. Run the executable
„Pulse Oximeter Calibrator‟ to begin running the device
5. Operation
a. The User Interface (UI) consists of 5 buttons arranged in a small window.
i. Rotate Stepper – Adjusts the stepper motor by
the defined degree amount
ii. Set BPM – Sets the Beats Per Minute of the
servo motor
iii. Set Time – Sets the run time the for pulsations
iv. Start – Starts the pulsations with the user
defined parameters
v. Reset – Moves the stepper motor back to original location before Rotate Stepper
command
82
b. Warnings
i. After each usage, you MUST reset the stepper motor using the reset button before
inputting a new degree amount. If the stepper is not reset, it will not be able to return
to the 0 degrees.
ii. Extended use of the System can cause the stepper motor and stepper motor driver to
become very hot. It is recommended that continuous use not exceed 30 minutes. This
can also be avoided by turning off the power between uses.
83