1
DEVELOPMENT OF A DETACHED VITAL SIGN
HOME MONITORING MANAGEMENT
SYSTEM
by
ANDERSON JOHN
Presented to the Faculty of the Graduate School of
The University of Texas at Arlington in Partial Fulfillment
of the Requirements
for the Degree of
MASTER OF SCIENCE IN COMPUTER ENGINEERING
THE UNIVERSITY OF TEXAS AT ARLINGTON
DECEMBER 2012
Copyright © by ANDERSON JOHN 2012
All Rights Reserved
ACKNOWLEDGEMENTS
I want to thank my mother whose encouragement and support has never waned
through the years. I would like to also thank my brother whose constant encouragement keeps
me focused on achieving my goals. It is difficult to put in words how extremely grateful I am to
Mr. David Levine who has granted me direction, encouragement, and a cheerful environment
throughout my graduate studies. Special thanks to my close friends who believe in me and
made this journey palatable.
NOVEMBER 19, 2012
iii
ABSTRACT
DEVELOPMENT OF A DETACHED VITAL SIGN
HOME MONITORING MANAGEMENT
SYSTEM
ANDERSON JOHN, M.S
The University of Texas at Arlington, 2012
Supervising Professor: David Levine
Patients coping with chronic illnesses are often inconvenienced with routine doctor
visits for the sole purpose of conducting basic vital sign monitoring. Such visits tend to be
disruptive, and are more so when the patient requires a lengthy commute or has a mobility
disability. As technology progresses, advances in low powered integrated circuits and network
connectivity has opened the doors to a new world of remote patient monitoring. This thesis
explores the possibility of using low powered technology to develop a patient monitoring system
that‟s completely detached, thus allowing patients to move around their homes while the
monitoring continues. We discuss the development of such a system with various monitoring
subsystems incorporated into the device. This system, being modular and flexible, will enable
many configuration of monitoring subsystems to be present.
iv
TABLE OF CONTENTS
ACKNOWLE DGEME NTS .......................................................................................................iii
ABSTRA CT............................................................................................................................ iv
LIS T OF ILLUS TRA TIONS .................................................................................................... viii
LIS T OF TABLES ................................................................................................................... x
Chapter
Page
1. INTRODUCTION……………………………………..………..…..................................... 1
1.1 Motivation................................................................................................. 1
1.2 Overview .................................................................................................. 2
2. BACKGROUND ..................................................................................................... 3
2.1 Spirometer................................................................................................ 3
2.2 Pulse Oximetry ......................................................................................... 6
2.3 Electrocardiograph .................................................................................... 8
2.3.1 ECG Electrodes ....................................................................... 10
2.3.2 Amplification ............................................................................ 11
2.3.3 Signal Filtering ......................................................................... 13
2.3.4 Measuring the Signal................................................................ 14
2.4 Cypress PSoC 5 ..................................................................................... 16
3. SYSTEM OVERV IEW .......................................................................................... 21
3.1 Satellite Units ......................................................................................... 21
3.2 Core Unit ................................................................................................ 21
3.3 Server Unit ............................................................................................. 21
v
4. CORE UNIT ........................................................................................................ 23
4.1 Architecture ............................................................................................ 23
4.1.1 Communic ation Between The Core Unit And Satellite Unit .......... 24
4.1.2 Satellite to Core Communication Specific ation ........................... 27
4.1.3 Communic ation Between The Core Unit And The Server Unit ..... 28
4.1.4 Core Unit‟s Program Flow ......................................................... 30
5. ELECTROCA RDIOGRAP H SA TELLITE UNIT ....................................................... 35
5.1 Unit Overview ......................................................................................... 35
5.2 Analog Circuitry ...................................................................................... 37
5.2.1 Silver/Silver Chloride Electrodes ............................................... 37
5.2.2 Amplifier Stage ........................................................................ 37
5.2.3 Filter Stage .............................................................................. 38
5.2.4 Summing Circ uit....................................................................... 37
5.2.5 Power Circuit ........................................................................... 40
5.3 Digital Subsystem ................................................................................... 43
5.3.1 Analog to Digit al Conversion ..................................................... 43
5.3.2 Preparation And Forwarding of Data.......................................... 43
5.3.3 Servicing Incoming Requests .................................................... 44
5.3.4 Message Types ....................................................................... 44
6. BLOOD OXYGE N SA TELLITE UNIT..................................................................... 46
6.1 Unit Overview ......................................................................................... 46
6.1.1 ChipOx Pulse Oximetry Module................................................. 46
6.1.2 ChipOx Development Kit........................................................... 47
6.1.3 System Layout ......................................................................... 48
6.2 Program Flow ......................................................................................... 49
6.2.1 Handling Data From The ChipOx Module................................... 50
vi
7. SPIROME TE R SATE LLITE UNIT ......................................................................... 53
7.1 Unit Overview ......................................................................................... 53
7.1.1 ERT AM1+ B T Module.............................................................. 53
7.1.2 WT41 Bluetooth Module ........................................................... 55
7.1.3 The PSoC 5 Control Unit .......................................................... 56
7.2 Program Flow ......................................................................................... 56
7.2.1 Dat a Export Command Sequence ............................................. 56
7.2.2 Translation And Forwarding of AM1+ B T Data ........................... 57
8. SERVER UNIT .................................................................................................... 60
8.1 Unit Overview ......................................................................................... 60
8.1.1 The D-Bus ............................................................................... 60
8.1.2 Communic ation Layer............................................................... 62
8.1.3 Dat a Store Middleware ............................................................. 64
8.1.4 The Graphical Us er Interface .................................................... 65
9. CONCLUSION A ND FUTURE WORK ................................................................... 71
9.1 Conclusion ............................................................................................. 71
9.2 Future Work ........................................................................................... 72
REFERE NCES ..................................................................................................................... 74
BIOGRAPHICAL INFORMA TION .......................................................................................... 78
vii
LIST OF ILLUSTRATIONS
Figure
Page
2.1 Image showing a portable spirometer ................................................................................. 4
2.2 Asthma by age and sex in the US, 2001 -2009..................................................................... 5
2.3 Fingertip Pulse Oximet er ................................................................................................... 6
2.4 Illustration of light absorption in the body ............................................................................ 8
2.5 Deaths attributable to diseases of the heart in the US from 1900-2009 ................................. 9
2.6 Image of a typical electrocardiograph ............................................................................... 10
2.7 3-Opamp Instrumentation Amplifier .................................................................................. 11
2.8 Flash ADC Architecture ................................................................................................... 15
2.9 Sigma-Delta ADC Architecture ......................................................................................... 16
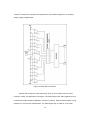
2.10 PSoC 5 digital system block diagram .............................................................................. 17
2.11 PSoC 5 digital system interconnect (DS I) diagram ........................................................... 18
2.12 Image of the PSoC 5 development kit............................................................................. 19
3.1 System Overview ............................................................................................................ 22
4.1 Architectural Diagram of the Core Unit ............................................................................. 24
4.2 Core to Satellite Interconnect ........................................................................................... 25
4.3 SPI slave configurations .................................................................................................. 26
4.4 Roving Networks RN-41-SM ............................................................................................ 29
4.5 Core Unit‟s Program Flow................................................................................................ 32
4.6 Service SPI bus program flow .......................................................................................... 33
5.1 ECG Unit Overview ......................................................................................................... 36
5.2 INA128 circuit diagram .................................................................................................... 38
5.3 Cut-off Frequency Equation ............................................................................................. 39
viii
5.4 Summing Circuit ............................................................................................................. 39
5.5 Summing Amplifier Equation............................................................................................ 40
5.6 ECG Circuit Diagram ....................................................................................................... 41
5.7 ECG Power Circ uit Diagram ............................................................................................ 42
6.1 ChipOx Pulse Oximetry Module ....................................................................................... 47
6.2 ChipOx Development Kit ................................................................................................. 48
6.3 Pulse Oximety Satellite Unit Overview .............................................................................. 49
7.1 Spirometer S atellite Overview .......................................................................................... 54
7.2 AM1+ Data Export Format ............................................................................................... 58
8.1 Server Unit Block Diagram ............................................................................................... 62
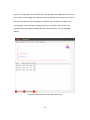
8.2 Graphical User Interface Start Page ................................................................................. 66
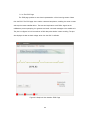
8.3 Graphical User Interface Oximeter Page .......................................................................... 67
8.4 Graphical User Interface Spirometer Page........................................................................ 68
8.5 Graphical User Interface ECG Page ................................................................................. 69
ix
LIST OF TABLES
Table
Page
4.1 System-Wide Message Format ........................................................................................ 27
5.1 ECG Module Message Specification ................................................................................ 45
6.1 ChipOx Message Format ................................................................................................. 51
6.2 Bit Definitions of ChipOx Status Message ......................................................................... 51
6.3 Pulse Oximetry Message Specification ............................................................................. 52
7.1 Subset of iWRAP4 Commands ........................................................................................ 55
7.2 Spirometer Message Specification ................................................................................... 59
x
CHAPTER 1
INTRODUCTION
Telemonitoring is a medical practice that allows patients to be monitored remotely .
Health care providers are able to observe test results at a separate location from where the
tests were carried out. Telemonitoring is an attractive alternative to conventional patient
monitoring as it avoids frequent and tedious doctor visits. It is also beneficial from an economic
point of view as the patients themselves execute various tests and avoid commuting. The
monitoring normally involves multiple medical measurement and sensing devices and some sort
of connectivity for relaying results to the patients‟ health care provider. Some common
monitoring devices include, but are not limited to, blood pressure monitors, blood oxygen
sensors, blood glucose monitors, ECG monitors, spirometers (monitoring lung function), and
weight measures.
1.1 Motivation
Even within the comfort of one‟s home, vital sign monitoring can be disruptive and
confines the patient to a fixed location while the monitoring takes place. Patients confined to
wheelchairs may find it difficult to access these systems depending on the location where they
are situated. A monitoring system that‟s small enough to fit on a wheelchair would provide more
convenient access. In addition, power and other signal wires may pose a risk to the patients.
The development of the Detached Vital Sign Management System attempts to make
telemonitoring less disruptive to the patients.
The Detached Vital Sign Management System is a low powered modular device that
allows monitoring to be done wirelessly around the home. The device comprises of a core
microcontroller unit, several satellite microcontroller units, and a computer system for data
storage and relaying information to the health care provider.
1
Each satellite microcontroller receives data from one or more satellite monitoring
instruments and relays the monitored data to the core unit for Bluetooth transfer to the remote
computer. At any given time, the system allows for many configurations of the satellites to be
present. This modular design makes the system flexible enough to adapt to the specific needs
of the patients. For example, ECG monitoring may not be required for a given patient. In this
case, the ECG module could be removed from that system by simply unplugging it from the
core unit. In addition, when only one measuring device is needed, the core unit can be omitted
completely allowing the satellite unit to communicate directly to the server unit .
1.2 Overview
The rest of this thesis is organized as follows. Chapter 2 offers some background on
the individual sensors incorporated into the system and insight on the vital sign parameters that
they measure. In particular, an in-depth review of literature related to electrocardiograms is
included, since part of this thesis work involves an attempt at the development of an ECG
device. In this project, the core unit refers to the sole interface between all measuring subunits
and the server. Chapter 3 provides an overview of the system and gives an introduction to the
main components. Chapter 4 describes the core unit in detail. Chapter 5 describes the
development of a portable, completely detached ECG device and its associated satellite
module. Chapter 6 details the satellite module interfacing with a blood oxygen sensor. Chapter
7 discusses the spirometer satellite unit. The architectural design of the spirometer satellite unit
is different from the other units because the microcontroller unit communicates with the
measuring device via Bluetooth. Chapter 8 details the development of the remote server‟s three
component processes. It also discusses the database system, and the protocol established for
data transfers over Bluetooth. Chapter 9 provides the conclusion to this work and discusses
future work.
2
CHAPTER 2
BACKGROUND
Vital sign monitoring is the measurement of the body‟s basic physical functions. Vital
sign monitoring is normally used as a status indicator, granting physicians useful information
regarding the current health of their patients. It is also essential for early detection of disease
and other illnesses. The main physical parameters routinely monitored by medical professionals
include electrocardiograms, body temperature, blood pressure, blood oxygen saturation, pulse
rate, and respiration rate. These measurements are, in many cases, critical in early detection
and prevention of medical complications.
2.1 Spirometer
In order to sustain life, living organisms depend on cellular respiration to gain useful
energy for fueling everyday life processes. The most common type of respiration in organisms is
known as aerobic respiration. This process requires oxygen and creates carbon dioxide as a
byproduct. The lung, being an essential respiratory organ in the human body, is tasked with
relaying oxygen from the outside atmosphere to the bloodstream. From there, the oxygen then
makes its way to the cells within tissues in the body. A similar and important function of the lung
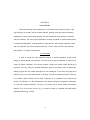
is to release carbon dioxide from the body. Spirometry is an evaluation of the general lung
function. By definition, it is the measurement of air volumes during forced expiration subsequent
to a full and complete inspiration. The aim is to quantify how a patient inhales and exhales
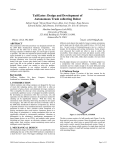
volumes of air as a function of time. Fig. 2.1 shows an image of a portable spirometer device
(eResearchTechnology GmbH).
3
Figure 2.1 Image showing a portable spirometer
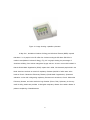
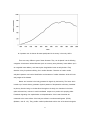
In May 2011, the National Institute of Allergy and Infectious Disease (NIAID) reported
that about 1 in 12 people in the US suffer from Asthma costing the US about $56 billion in
medical costs (National institute of Allergy). Fig. 2.2 is a graph showing the percentage of
Americans suffering from Asthma categorized by age and sex. An even more morbid statistic is
that the World Health Organization (WHO) reports that in 2008, 394 thousand people died in the
North American continent as a result of respiratory diseases (242,500 of which were at the
hands of Chronic Obstructive Pulmonary Disease) (World Health Organization). Spirometric
evaluation can be vital in diagnosing respiratory illnesses such as Asthma, Chronic Obstructive
Pulmonary disease, and other restrictive lung disorders (Pierce, Rob). Spirometry is also very
useful in aiding health care providers to distinguish respiratory disease from cardiac disease in
patients complaining of breathlessness.
4
Figure 2.2 Asthma by age and sex in the US, 2001-2009
Some important measures obtained through spirometry are Forced Vital Capacity
(FVC) and Forced Expiration Volume (FEV1). FVC is defined as the maximal volume of air (in
liters) that can be exhaled forcefully after a full inspiration. FEV1, on the other hand, is the
volume of air exhaled within the first second of an FVC test. The ratio of FEV1/FVC has been
demonstrated to be a very effective indicator to identify airflow obstruction and thus has obvious
diagnostic value. A third common pulmonary function parameter measured by spirometers is
called peak expiration flow (PEF). As the name suggests, PEF is a patient‟s maximum rate of
expiration.
PEF
measurements
over time,
for example,
can indicate degradation or
improvement of a patient‟s condition. It should be noted though that PEF measurements are not
highly reproducible and hence is not the best parameter for predicting occurrences of Asthma
attacks (Mortimer, Kathleen).
The typical procedure for obtaining accurate results includes inspiration of a lung full of
air. Immediately after inhaling, the patient must place his or her lips around the spirometer
mouthpiece and, in a forceful blast, exhale as fast as possible until their lungs are completely
empty. Some spirometers also calculate inspiration-based measures such as Forced Inspiratory
Vital Capacity (FIVC). Such spirometers would require a different test procedure.
5
2.2 Pulse Oximetry
Pulse oximetry is a noninvasive method of measuring blood oxygen saturation and
pulse rate in patients. The measurement of arterial oxygen saturation is of fundamental
importance to critical care medicine. Prolonged periods of low oxygen levels in the blood leads
to a dangerous condition called Hypoxia. If this condition is not detected and corrected in time,
irreversible tissue damage and even death can occur (Mendelson, Yitzhak). Thus, in very ill and
high-risk patients, constant monitoring of blood oxygen saturation is often necessary. An older
method for measuring arterial oxygen saturation includes the use of clinical blood gas analyzers
to sample the patient‟s blood at intervals (Mendelson, Yitzhak). The use of blood gas analyzers
is obviously more invasive and only provides snap shots of blood saturation data rather than a
continuous stream. The ability of pulse oximeters to provide continuous monitoring
noninvasively has made them a very important diagnostic tool.
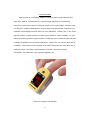
Figure 2.3 Fingertip Pulse Oximeter
6
As outlined in the article by Mendelson, pulse oximeters rely on the differences in
optical absorbance of deoxyhemoglobin and oxyhemoglobin when exposed to light with
wavelength of about 660nm (Mendelson 1601). In the spectrum, this wavelength is that of
visible red light. Oxyhemoglobin, as the name suggests, is the form of hemoglobin when
combined with oxygen. At 660nm light, the optical absorbance of oxyhemoglobin is less than
that of deoxyhemoglobin. Also important, is that the opposite is true when exposed to light of
wavelength between 815nm and 940nm (infrared light). When exposed to light of this
wavelength, the optical absorbance of oxyhemoglobin is slightly greater than that of
deoxyhemoglobin. The absorbance of infrared light in this case is used as a reference.
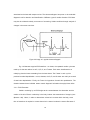
Takuo Aoyagi, a bioengineer in Tokyo, invented the current methodology of pulse
oximetry in 1972 (Severinghaus, John). This method works by noting that cyclic (AC) variations
in the detected absorbance signal are caused by rhythmic changes in the blood volume. This
assumption is based on the fact that blood in the veins does not pulsate. Therefore, any
variation of absorbance is due to changes in the volume of arterial blood. Fig. 2.4 shows
changes of absorption with time due to different factors in the body (Mendelson, Yitzhak). This
distinction is important as arterial blood carries oxyhemoglobin from the lungs and venous blood
contains deoxyhemoglobin from the tissue. From this observation, it was determined that blood
oxygen saturation can be derived by analysis of the rhythmic variances in absorbance caused
by the pulsating arterial blood.
7
Figure 2.4 Illustration of light absorption in the body
In present day pulse oximeters, the light source is commonly from light -emitting diodes
(LEDs). These are very efficient, low powered light sources. The fact that individual LED‟s emit
slightly different intensities of light introduces a calibration issue. The optical sensors used for
measuring the absorption may also individually differ slightly and present a similar issue. These
issues are dealt with by normalization. Normalization involves dividing the AC component
(pulsatile) by the corresponding DC (nonpulsatile) component. Normalization combined with
pre-calibration greatly eliminates reproducibility issues between any two devices manufactured.
2.3 Electrocardiograph
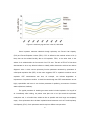
Heart disease is the leading cause of death in the US. According to the American Heart
Association, in 2008, cardiovascular disease caused 811,940 deaths in the US (Roger,
Veronique). This accounted for a third of all deaths that year. Looking at this statistic from a
different perspective, there was 1 death every 39 seconds that was attributed to cardiovascular
disease. Fig. 2.5 provides a graphical illustration of the number of deaths in the US attributable
to heart disease over the last century (Roger, Veronique). It is important to note that not all
cardiovascular diseases can be categorized as a heart disease.
8
Figure 2.5 Deaths attributable to diseases of the heart in the US from 1900-2009
An important note is that not all states participated in the survey in the early 1900‟s.
There are many different types of heart diseases. They can be placed into the following
categories: blood vessel related diseases (such as coronary artery disease), heart defects (such
as congenital heart defects), and heart rhythm irregularities known as arrhythmias. Early
detection is key for patients suffering from cardiac disorders. Detection of certain cardiac
arrhythmia patterns can lead to identification and treatment of cardiac disorders while still in the
early stages of the disease.
Nerves and muscles in the body generate bio-signals by their activity. The heart, which
is made up of muscle tissue, generates rhythmic patterns of bio-potentials with every heartbeat.
Its primary function being to circulate blood throughout the body, the chambers in the heart
(atria and ventricles) contract in a well-coordinated sequence to produce this pumping effect.
Potentials originating from repolarization and depolarization of the heart tissue that are
measured at the outer surface of the body are referred to as electrocardiograms (ECGs)
(Webster, John G. 147). They provide medical professionals with a view of the electrical signals
9
associated to the heart with respect to time. The electrocardiogram has proven to be a valuable
diagnostic tool for detection and identification of different ty pes of cardiac disorders. ECG data
may also be collected routinely as a means of uncovering hidden conditions through analysis of
changes in the traces over time.
Figure 2.6 Image of a typical electrocardiograph
Fig. 2.6 illustrates a typical ECG waveform. As shown, the repeated cardiac cycles are
made up of what are referred to as P, Q, R, S, and T waves. Each wave is attributed to an
underlying electrical event emanating from the heart tissue. The P wave in each cycle is
produced as atrial depolarization occurs, whereas, the Q, R, and S waves are mainly as a result
of ventricular depolarization. Finally, the T wave is a byproduct of ventricular repolarization. The
duration between these individual waves contain diagnostic information that physicians utilize.
2.3.1. ECG Electrodes
Cardiac monitoring by an ECG begins at the contact between the electrodes and the
surface of the skin. Electric conductivity in the body involves the transmission of charge by ions
(Neuman 189). Hence, in order to detect these minute ionic currents within the body, some
form of transducer is required to convert these ionic currents into electric current s. Because of
10
its non-polarizable nature, silver/silver chloride (Ag/AgCl) is a popular choice for biomedical
electrodes. Once the ionic current has been converted into an electrical current in the electrode
wires, the amplification phase follows.
2.3.2. Amplification
The minute voltages present at the electrode sites, often between 1uv and 5mv (Nagel
52-1), require amplification in order for the comparator within the microcontroller‟s analog to
digital converter (ADC) to digitize this voltage with minimal error. A differential amplifier is used
to amplify the difference between the two electrodes by a set gain. Differential amplifiers
multiply any difference in voltage between the two inputs by the gain of the amplifier. Use of the
differential amplifier assists in excluding external electromagnetic noise from the signal. This is
because any electromagnet noise that may cause a change in potential in one electrode wire
would do the same to the other. By measuring the difference between these two wires, the
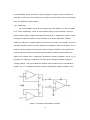
drifting, due to external noise, is significantly eliminated. As noted by (Webster, John G. 91), for
the purpose of measuring bio-potentials, the three-op-amp differential amplifier topology is
normally preferred. This type of differential amplifier is also referred to as an instrumentation
amplifier. Fig. 2.7 is a diagram illustrating a typical instrumentation amplifier (Webster, John).
Figure 2.7 3-Opamp Instrumentation Amplifier
11
Instrumentation amplifiers are normally required for amplifying the very low outputs from
transducers in noisy environments. Desired properties of an effective instrumentation amplifier
include high common mode rejection, high input impedance, a low offset voltage, and a low
input bias current.
2.3.2.1 Common-Mode Rejection
One source of noise encountered while measuring bio-signals is common-mode noise.
A common mode signal is one which appears on both inputs of the amplifier having equal
amplitude and in-phase with each other (Maxim Integrated). The human body can act as an
antenna picking up electromagnetic noise from nearby power lines. This common-mode noise
can make it difficult to measure the signal of interest. One characteristic of differential amplifiers
is their common-mode rejection ratio (CMRR). This is the ratio between the differential signal
gain (the gain of the signal of interest) and the common-mode signal gain (the gain of the
common-mode interference). In most cases, when measuring bio-potentials, an instrumentation
amplifier with a high CMRR is desired. The ideal differential amplifier perfectly rejects the
common-mode voltage. In reality, no differential amplifier performs with such perfection. The
CMRR serves as a measure to quantify this imperfection when comparing differential amplifi ers.
2.3.2.2 High Input Impedance
The impedance at the inputs of an instrumentation amplifier needs to be very high. In
an ideal case, no current should flow through the op-amps and, therefore, an input impedance
of infinity is necessary. This ideal case, of course, is not realistic. The high impedance is
favorable to prevent loading down of the source. This simply means that a current at the inputs
could affect the very phenomenon that‟s being measured (in this case, the transducer). It is also
necessary to have the impedance at both inputs very close in value to one another.
12
2.3.2.3 Low Offset Voltage
An ideal instrumentation amplifier should produce an output of 0V when the two inputs
are the same. In reality, off-the-shelf op-amps are not able to perform with an offset voltage of 0.
Whenever an offset voltage is present at the individual op-amps making up the instrumentation
amplifier, this small difference is also amplified by the gain. This contributes to an error at the
output. Therefore, a very small offset voltage is favorable.
2.3.2.4 Low Input Bias Current
In non-ideal instrumentation amplifiers, small bias currents exist at the op-amp inputs.
These currents are converted to a small voltage by the input resistors and are amplified by the
gain along with the signal. These bias currents add an error to the output, and hence, are
undesirable.
2.3.3. Signal Filtering
The next phase in signal conditioning is the filtering out of unwanted noise that might
have made its way through the instrumentation amplifier. The frequency range of the signal
generated by the heart is normally between 0.05Hz and 100Hz (Onaral, Banu). Therefore,
excluding any frequencies not included in this range is normally desired. By cutting off
frequencies less than 0.05Hz, the dc component is filtered out. The dc component causes
undesirable baseline shifts in the electrograph. This sort of filtering can be accomplished by
building a band-pass filter. Band-pass filters, as the name suggests, only allows a certain range
of frequencies to pass. Band-pass filters can be thought of as a low-pass filter (for blocking off
frequencies higher than the frequency range of interest) added to a high-pass filter (for blocking
off frequencies lower than the band of interest). Concerning filtering, what has been discussed
so far is still insufficient. A major source of electromagnetic noise encountered by devices
emanate from the 50/60Hz hum in power lines. This 60Hz (in the US) noise (and its harmonic at
120Hz) from nearby power lines needs to be addressed. Band-stop filters can be used to
eliminate these frequencies while preserving the other frequencies that we are interes ted in. As
13
opposed to band-pass filter, band-stop filter blocks a range of frequencies from a signal allowing
all other frequencies through. In this project, the 60Hz and 120Hz noise are cancelled with the
help of a digital filter within the microcontroller.
2.3.4. Measuring the Signal
The next stage is to digitize the analog signal. An ADC is used to convert the analog
signal to digital data that can be transmitted, stored, and displayed later. ADC‟s are devices
used for converting analog continuous-time signals into discrete-time binary representations
(Walden, Robert H.). They operate by measuring samples of the input signal at regular intervals
of time. The number of samples taken per unit time is referred to as the sample rate. There are
several different ADC architectures. The more common architectures include direct-conversion,
successive-approximation, delta-sigma, integrating, and sub-ranging ADC‟s.
The direct-conversion, also known as flash ADC, measures the voltages buffered by
comparing the captured voltage with a number of known voltages (fractions of some reference
voltage). The highest fraction of the reference voltage that is less than the signal is encoded into
a binary representation. The number of reference fractions (quantization levels) compared
determines the resolution of the ADC. For example, an 8-bit ADC can only compare a signal to
255 voltage levels. An 8-bit ADC with a voltage reference of 5V compares the signal to
8
references having voltage levels at increasing multiples of 0.0196V (i.e. 5V/(2 -1)). Since ECG
signals span such a large range of values (1uV - 5mV), an ADC with 16 bit resolution or more is
best. An illustration of a flash ADC can be seen below in Fig. 2.8 (Maxim Integrated). Although
flash ADC‟s can achieve very high sample rates in comparison to the other architectures, they
are normally not capable of very high resolutions. This is mainly because two to the power of
the desired resolution of comparators minus one are necessary for flash ADC‟s to operate. As
an example, an 8-bit ADC requires 255 comparators. This shortcoming makes direct-conversion
ADC‟s less desirable for projects that demand higher precision measurements. The direct-
14
conversion architecture is simplistic and represents a more traditional approach to converting
analog signals to digital values.
Figure 2.8 Flash ADC Architecture
Another ADC architecture worth discussing, which is more complex than the di rectconversion variety and applicable to this paper, is the Delta-Sigma ADC. Many applications may
not demand the high sampling capabilities of a direct-conversion ADC but instead require a high
resolution for more precise measurements. The Delta-Sigma ADC is made up of very basic
15
analog electronics. These include a single comparator, a voltage reference, a switch,
integrators, and summing circuits. On the other hand, the digital aspect of this architecture is
very complex. The digital section consists of a digital signal processor (DSP) that serves as a
filter. Fig. 2.9 provides a basic illustration of the Sigma-Delta ADC architecture (Kester, Walt).
Figure 2.9 Sigma-Delta ADC Architecture
2.4 Cypress PSoC 5
The PSoC 5 is a programmable embedded system-on-chip produced by Cypress
Semiconductor Corporation. This particular chip is unique amongst other microcontrollers in that
it allows the user to program necessary peripherals on the chip instead of having the chip
manufacturer decide on what, and how many, peripherals should be included. Microcontroller
peripherals are additional devices integrated on the same chip as the CPU. Such peripherals
include ADC‟s, digital-to-analog converters (DAC‟s), SPI buses, UART buses, USB, among
many others.
16
Internally, the PSoC 5 is powered by a 32-bit ARM Cortex-M3 central processing unit
(CPU). The architecture of the CPU includes a three-stage pipeline with branch prediction. The
ARM Cortex-M3 CPU‟s are known for their low powered capabilities making them the perfect
tool for portable embedded projects. Although the CPU is low powered, it is able to run at clock
rates of 67MHz max. This performance is necessary for data acquisition applications where
events occurring less than a microsecond apart needs to be measured or timed. The CPU
supports interrupts and exceptions with its nested vectored interrupt controller (NVIC).
The programmable digital peripherals of the PSoC 5 make them truly customizable
chips. Within the PSoC 5 chips, are an array of universal digital blocks (UDB). Each UDB holds
a programmable logic array. Various peripheral devices can be programmed into these UDB‟s.
For example, most microcontrollers may provide at most 2 universal asynchronous
receiver/transmitter (UART) buses. With the PSoC 5, numerous UART‟s may be programmed
into these universal digital blocks. With the UART, the benefit of such flexibility is clearly
apparent as communications with only one external device is allowed per UART. Fig. 2.10
shows a block diagram of the digital system (Cypress Semiconductor 147).
Figure 2.10 PSoC 5 digital system block diagram
17
The Digital System Interconnect (DSI) in the PSoC 5 enables general interconnectivity
of peripherals within the universal digital blocks. The DSI also connects the UDB peripherals to
the physical I/O pins and other peripheral devices on the chip. Fig. 2.11 (Cypress
Semiconductor 191) provides an architectural view of the DSI. As listed in the PSoC 5
Architecture TRM, the DSI provides transmission of interrupt requests, dynamic memory access
(DMA) requests, digital peripheral data signals, connections to I/O pins, and connections to the
analog system digital signals.
Figure 2.11 PSoC 5 digital system interconnect (DSI) diagram
The PSoC 5 chip also includes many analog subsystems . These include analog
multiplexers, comparators, voltage references, operational amplifiers, mixers, analog-to-digital
18
converters, and digital-to-analog converters. The internal analog bus allows any generalpurpose I/O pin on the PSoC chip to route signals in and out of the chip. A maximum of 62
discrete analog signals can be interfaced with the chip simultaneously.
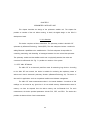
Figure 2.12 Image of the PSoC 5 development kit
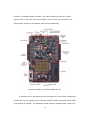
A necessary tool for quick prototyping with the Cypress chip is the PSoC 5 development
kit (PSoC 5LP 18). Among other things, this board provides the basic necessities that the PSoC
5 chip requires for operation. The development board provides a regulated power supply to the
19
chip. The board is capable of sourcing power from the programming circuit, the USB, a 9V
battery, or from a 12V power supply. The CY8CKIT-050 board provides a 24MHz crystal
oscillator for the chip‟s clock source along with a 32KHz oscillator for the real time clock. The
programming circuitry provides debugging and programming through USB or JTAG. Finally, the
development kit offers easy access connectors to the I/O pins on the PSoC chip.
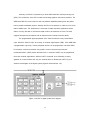
Additional peripherals added to the development board include LED‟s and a character
display. These prove very valuable for debugging various designs. The LED‟s can serve as
indicators of events or even provide a binary representation of some status in the chip.
20
CHAPTER 3
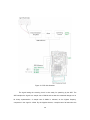
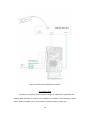
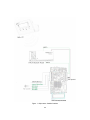
SYSTEM OVERVIEW
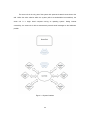
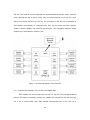
The main components within the system can be categorized into three device
classifications. These include satellite units, a core unit, and a server unit. Fig. 3.1 shows a
block diagram of the overall system.
3.1 Satellite Units
Each satellite unit receives data from a vital sign measurement device. The satellite
units act as an interface and translator between each vital sign measurement device and the
rest of the system. Excluding the ECG unit, all other vital sign units used are OEM devices.
Therefore, they all have their own vendor specific communication protocols and data formats.
The satellite units must translate between these vendor specific data formats and one that
conforms to the system wide communications protocol. The satellite units are low powered
battery operated units that don‟t require external power.
3.2 Core Unit
The core unit serves as an interface between the satellite devices and the remote
server unit. It routes messages between the server unit and multiple satellite devices via
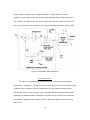
Bluetooth and SPI. The core unit also performs other tasks on behalf of the server unit. One
such task is determining which satellite units are present at a given time. Similar to the satellite
units, the core unit is battery operated and does not require external power to operate.
3.3 Server Unit
The server unit serves as a central data store for incoming vital sign measurement
results. The unit stores incoming data in a database system. Another major role of the server
unit is to serve as an interface for human interaction with the system. One of the sub processes
in the server unit is a graphical user interface for presenting the collected data to the user.
21
The server unit is the only part of the system with power and network connections to the
wall. Unlike the other subunits within the system (which are embedded microcontrollers), the
server unit is a single board computer running an operating system. Having Internet
connectivity, the server unit is able to autonomously transmit email messages to the healthcare
provider.
Figure 3.1 System Overview
22
CHAPTER 4
CORE UNIT
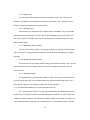
The core unit makes up the heart of the system. It allows communication between
multiple satellite devices and the server unit. This module consists of a PSoC 5 CY8CKIT-050
development board and an RN-41-SM Bluetooth module by Roving Networks. This unit
functions as the sole interface between all remote satellite devices and the single board
computer where the data is viewed, analyzed, and stored.
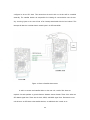
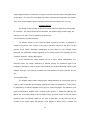
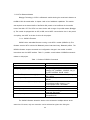
4.1 Architecture
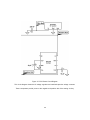
The unit has the capability of routing data coming from a maximum of 8 independent
satellite devices. As soon as a complete message is received, it is routed to the remote single
board computer. Each satellite device communicates with the core unit over a dedicated SPI
bus. One of the benefits of this configuration is that each satellite device controls its own SPI
clock for asynchronous data transfers to the core unit. Therefore, the bus is not shared and a
slave select is not necessary. Another benefit from this configuration is that each SPI peripheral
on the core unit keeps a private read buffer. This keeps the incoming messages from
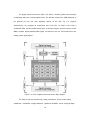
independent devices isolated while the data transfer is in progress. Fig. 4.1 shows an
architecture diagram of the core unit. Data routed outbound to the single board computer is
transmitted over UART to the RN-41-SM Bluetooth device. Once the RN-41-SM receives the
data, it automatically relays the stream of bytes to the single board computer over a secure
person area network (PAN). Some detail on the RN-41-SM is provided later in this chapter.
23
The SPI buses used for communicating with the external satellite devices are used in three-wire
mode. Although the flow of data is mostly from the external devices to the core unit, some
devices may receive data from the core unit. The chip select on the SPI bus is eliminated as
each satellite communicates on a dedicated bus . Thus, only the master out slave in (MOSI),
master in slave out (MISO), and clock lines are necessary. This configuration keeps the design
simple as up to 8 SPI devices could be in use.
Figure 4.1 Architectural Diagram of the Core Unit
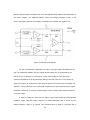
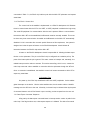
4.1.1. Communication Between The Core Unit And Satellite Units
Each satellite unit communicates with the core unit over SPI using a single predefined
protocol. This allows the flexibility of having any satellite unit connected to the core using any
one of the 8 communication ports. Each satellite communication port on the core unit is
24
configured to be an SPI slave. This means that the serial clock on the bus will be controlled
externally. The satellite devices are responsible for initiating all communication over the bus.
Any incoming bytes to the core will set off an interrupt associated with the bus involved. This
interrupt will alert the core that there‟s unread bytes in its SPI read buffer.
Figure 4.2 Core to Satellite Interconnect
In order to connect each satellite device to the core unit, a total of five wires are
required. One wire provides a ground reference between the two boards. Three of the wires are
SPI related signal lines. These are the clock, MOSI, and MISO signal lines. Because the core
unit will serve as SPI slave to the satellite devices, an additional wire is used as an
25
asynchronous request signal from the core to the device. This additional wire is kept at the
source voltage (VDD). Normally, this would be achieved by physically connecting the line to
VDD using a 10K pull-up resistor. Due to the PSoC 5 pin configuration system, the slave is able
to configure the pin that this wire connects to as resistive pull-up. Whenever the core unit wants
to signal to the satellite device (the SPI master in that case) that it needs to clock in data coming
from the core unit, it pulls this line to ground. This action causes an interrupt in the
microcontroller on the satellite device. The satellite device then produces the clocks needed for
the data to be transmitted over the MISO line.
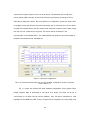
Figure 4.3 SPI slave configurations
This is an actual screenshot taken from the SPI hardware configuration window of Cypress‟
PSoC Creator 2.1.
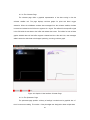
Fig. 4.3 shows the selected SPI slave hardware configurations using Cypress PSoC
Creator Software. Data is transmitted in the typical 8 bit bursts. The buses are all set to
communicate at 10 million bits per second (10Mbps). Also, the data is transmitted in most
significant bit first (MSB first) order. Finally, the data lines are sampled on the rising edge of the
26
clock. The logic graph displayed in Fig. 4.3 illustrates the sampling timing resulting from this
configuration.
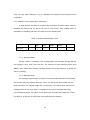
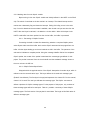
4.1.2. Satellite to core communication specification
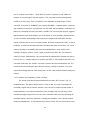
A single protocol will define all communication throughout the entire system. Table 4.1
describes the protocol that all devices will use to communicate. Each satellite device is
responsible for translating data from their sensors into this unified format.
Table 4.1 System-Wide Message Format
MSG Header
Length
0x53, 0x4D,
0x53, 0x47
2 bytes
Device
Type
1 byte
MSG
Type
1 byte
Originating
Device
4 bytes
Destination
Device
4 bytes
Payload
…
4.1.2.1 Message Header
The first 4 bytes in a message is the message header. All messages will begin with the
byte sequence: 0x53, 0x4D, 0x53, and 0x47. This sequence of bytes represents ASCII string
„SMSG‟, which means start message. Receiving devices will use this sequence to identify the
start of a message.
4.1.2.2 Message Length
The message length provides the number of expected bytes contained in the message.
This includes everything following the length. Hence, the first 6 bytes are excluded from the
length calculation. The message length field is 2 bytes wide. This sets an upper bound on the
message size to 65,535 bytes, which is acceptable for the type of messages that will be
communicated throughout the system. On the other hand, the length field should have a value
of at least 10, as the next 10 bytes before the payload field are mandatory.
27
4.1.2.3 Device Type
The next byte in the message indicates the originator‟s device type. This byte, for
example, could identify a message to be coming from a spirometer. This information will be
used for routing incoming data at the system server.
4.1.2.4 Message Type
Some devices may send and receive multiple types of messages. This one byte field
specifies the type of message for the given device type. Message types are only unique for a
given device type. For example, there may be a message with message ID equal to 2 under
different device types.
4.1.2.5 Originating Device Identifier
This four-byte identifier provides a unique tag declaring the originator of the message.
This is primarily for routing messages coming from the server and for debugging and logging
purposes.
4.1.2.6 Destination Device Identifier
This field, also four bytes wide, provides the tag of the destination device. The core unit
needs this field in order to accurately route an incoming message from the server over the
correct SPI bus.
4.1.2.7 Message Payload
The payload field is an optional and variable in length. The length of this field must be
no more than 65,525 bytes. This constraint results from the fact that the length field is only 2
bytes wide and there are 10 mandatory bytes before the payload field.
4.1.3. Communication between the core unit and the server unit
The core unit‟s main function is to relay data collected from the satellite devices to the
remote server. This data is routed over a wireless Bluetooth connection. In order to make this
possible, the data is forwarded using the Roving Networks RN-41-SM module. This device is a
class 1 Bluetooth device supporting up to the Bluetooth v2.1 communication protocol (Roving
28
Networks). The RN-41-SM is a low power device consuming only up to 30mA when active. This
power consumption is essential for this application.
Figure 4.4 Roving Networks RN-41-SM
According to the datasheet, the RN-41-SM has a range of about 100 meters. This
makes it suitable for most home applications. The module provides a UART bus, allowing for
easy interfacing with microcontrollers. Apart from a few other protocols, the module is capable
of transmitting data following the Serial Port Profile (SPP). SPP is a Bluetooth profile that
emulates a serial cable connection between two devices (MettŠla, Dellien and Sšrensen 20).
The RN-41-SM is a very flexible module allowing many configurable features.
Configuring the device is done either wirelessly through the Bluetooth link or via the UART
interface. The RN-41-SM is programmed using an ASCII command language outlined in the
Roving Networks Bluetooth product manual. „Set‟ commands configure the module whereas
„Get‟ commands returns the current configurations. The following is a list a configurations that‟s
directly related to the current project.
4.1.3.1 Master/Slave Mode
The RN-41-SM can operate in numerous modes. The modes relating to this project is
slave mode and master mode. In slave mode, other Bluetooth devices can discover and initiate
29
connection with the device. In slave mode, the module is also allowed to initiate outbound
connections itself. In master mode, only outbound connections are allowed.
4.1.3.2 Command/Data Mode
The device powers up by default in Data mode. In data mode, the module simply
forwards streams of bytes from the UART interface to the Bluetooth link and visa versa. Within
60 seconds after the device is powered up, an ASCII sequence of “$$$” followed by cursor
return sets the device to configuration mode. In this mode, the configuration settings can be
displayed or modified.
4.1.3.3 UART Settings
The UART interface can be configured while in configuration mode. Adjustable settings
for the UART interface include the baud rate, flow control and parity.
4.1.3.4 Bluetooth Settings
The device allows a large number of Bluetooth related settings that can be modified.
Some of which includes encryption settings, the device name (seen by other devices when in
slave mode), the Bluetooth address, and the security code that will be required in order to pair
with the module.
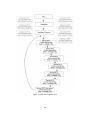
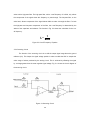
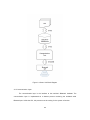
4.1.4. Core Unit’s Program Flow
On power up, the module initializes its on-chip peripherals and the interrupt vector.
Most activity within the core unit is interrupt driven. Each bus has its related interrupt that‟s
triggered by reception of new data. Whenever an interrupt occurs on one of the buses, program
flow switches to the interrupt service routine related to that peripheral. In order to make the
interrupt as brief as possible, the interrupt service routine only sets a flag before clearing the
interrupt and returning to normal execution. This flag will be picked up later within the main loop.
A macro view of the core unit‟s program flow is illustrated in Fig. 4.5.
30
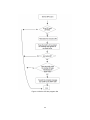
4.1.4.1 Satellite to Core/Server Data Flow
The main loop services the eight SPI buses in order. Fig. 4.6 shows the program flow
involved in servicing each bus. The device must first determine whether the data-in flag for the
given bus was set. If nothing has changed on the bus, the system moves on to service the next
bus. If the flag indicates that new data is ready on the bus, all the bytes are read onto a circular
buffer. Then the buffer is processed to ensure it starts with a valid message header. All
unknown bytes are purged until the message header is detected or the buffer is emptied. Once
a valid message header is detected, the length field in the message is used to determine
whether the entire message has already been read in to the buffer. If the message is
determined to be incomplete, the system moves on to the next bus with the expectation that the
remainder of the message will arrive later. If, in fact, the entire message is present, the system
forwards the message over the UART to the RN-41-SM.
31
Figure 4.5 Core Unit‟s Program Flow
32
Figure 4.6 Service SPI bus program flow
33
4.1.4.2 Server to Core/Satellite Data Flow
The SPI peripherals are not the only sources of interrupts on the core unit. Messages
originating from the server may cause data-in interrupts on the UART peripheral. The RN-41SM relays these messages to the UART bus on the core unit. Interrupt servicing of the UART
bus is handled in a similar fashion to that of the SPI. The difference relates to how the message
gets forwarded to its destination. Additional steps are required before the message can be
relayed to its destination. The destination tag in the message needs to be retrieved so that the
correct forwarding bus could be determined. This is achieved by searching a small eight row
routing table for the destination tag. The table converts the destination identifier extracted from
the message to a pointer to the intended SPI port. Once the correct SPI bus is determined, the
core unit inserts the message on the transmit buffer of the bus and pulls low the asynchronous
slave request line mentioned earlier in Fig. 4.2. This prompts the satellite device, which serve as
the master, to drive the clock line so that the data could be transmitted.
The core, by default, keeps all asynchronous slave request pins for the various satellite
buses low. On every satellite device, this pin is configured internally as a resistive pull-up pin.
This means that the chip emulates a pull-up resistor keeping the pin high. Whenever new
satellite devices are plugged to the core or an existing one is placed on another bus, the pin on
the core, which is low, pulls the line low. This signals the satellite device to try to clock in a
message from the core. Since the core did not place any valid messages in the send buffer, the
satellite device reacts by sending a device identifier message to the core. This mechanism
assures that the core always have the updated position of devices on the bus.
Most messages within the system don‟t originate from the core. They are simply routed
by the core to their final destinations. One message that originates from the core is a device
identifier request message. This message is broadcasted over every SPI bus two seconds after
the core powers up. The primary function of this message type is for populating the bus routing
table.
34
CHAPTER 5
ELECTROCARDIOGRAPH SATELLITE UNIT
This chapter details the complete design of the ECG satellite unit. The chapter first
provides an overview of the unit before covering, in detail, the analog circuitry and the digital
design using the PSoC 5 development board.
5.1 Unit Overview
Fig. 5.1 provides an overview of the ECG unit. Ionic currents originating from the heart
muscle are converted to electric signals by silver/silver chloride electrodes. Minute signals from
the two electrodes are then transmitted to an instrumentation amplifier. This differential op-amp
amplifies the voltage difference between the two signals . The output from the amplifier is fed
into a series of filters in order to significantly reduce the noise in the signal. This is achieved by
eliminating the unwanted frequencies. At the output of the filters, only frequencies within the
range of the signal of interest will remain. The signal, up to this point, fluctuates between
positive and negative voltage values with time. This occurs as, at a given moment, the potential
at one electrode placement may be more positive than at the other, and at another moment, its
potential may be more negative than the other. This creates an issue, as the ADC is only able to
measure positive voltages with reference to its ground. In order to sample the signal at the
ADC, it is necessary that the signal be modified so that, even at its lowest value, it will have a
positive voltage. In order to achieve this result, the output from the filters is passed on to a
summing circuit. The summing circuit simply offsets the signal by a certain voltage.
35
Figure 5.1 ECG Unit Overview
The signal leaving the summing circuit is then ready for quantizing by the ADC. The
ADC samples the signal at a sample rate of 200Hz and converts the measured voltage to a 16
bit binary representation. A sample rate of 200Hz is selected, as the highest frequency
component in the signal is 100Hz. By the Nyquist theorem, a sample rate of at least twice the
36
signal‟s highest frequency component is required. The ADC marks the start of the digital subunit
of this device. The unit‟s CPU then takes the stream of samples and loads them onto a buffer.
There, they can be wrapped with the message protocol bits and relayed to the core unit.
5.2 Analog Circuitry
The analog circuitry includes all the units involved before the signal is fed into the ADC
for conversion. The main units include the electrodes, the amplifier stage, the filter stage, the
summing circuit, and a circuit for providing the power rails.
5.2.1 Silver/Silver Chloride Electrodes
For efficient sensing of the minute bio-signals caused by the heart, a transducer is
needed to convert the ionic currents in the body to electronic currents in the wires. For the
purpose of this project, electrodes manufactured by Bio Protech Inc. are selected. These
electrodes use silver/silver chloride (Ag/AgCl) as the sensing element for converting the ionic
currents to electronic currents (Bio Protech).
At an electrode site, motion artifacts can be an issue. During measurement, if an
electrode moves, the charge distribution is affected causing the measured signal to be
temporarily disturbed. In order to reduce motion artifacts, Bio Protech electrodes contain a solid
adhesive hydro-gel. The hydro-gel increases the bond between the sensing element and the
skin.
5.2.2 Amplifier Stage
The amplifier stage involves magnifying the voltage difference at the electrode sites by
a gain in order to later filter and accurately measure the signal. The amplification, in this project,
is performed by an INA128 integrated circuit (IC) from Texas Instruments. The INA128 is a low
power instrumentation amplifier with a common mode rejection of 120dB max (INA128). The
INA128 has a low offset voltage of 50 microvolts and an input bias current at 5nA max. These
properties make the INA128 suitable for this type of application, as very little error will be
introduce to the output signal. The INA128‟s circuit diagram is shown in Fig. 5.2 below. The
37
INA128‟s general design resembles that of the standard differential amplifier discussed earlier in
the second chapter. The additional features include over-voltage protection circuitry on the
inputs. This feature gives the IC the ability to withstand up to positive and negative 40V.
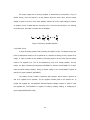
Figure 5.2 INA128 circuit diagram
The gain of the INA128 is adjustable. The value of the gain resistor Rg determines the
gain. The relationship between the gain resistor and the output gain is represented by the
formula in Fig. 5.2 (INA128). For this project, a gain of 600 is desired. This gain allows
maximum amplification of the signal without getting to the rails of the circuit. The internal opamps can‟t produce an output that is higher than the positive rail or lower than the negative rail.
Therefore, if at any given point, the input signal multiplied by the gain surpasses the rail, signal
information will be lost. To achieve the desired gain of 600, an 83ohm gain resistor is selected.
5.2.3 Filter Stage
In order to isolate the noise from the signal, a filter stage follows the instrumentation
amplifier‟s output. This filter stage comprise of a passive band-pass filter. It allows only the
desired frequency range to go through. This band-pass filter is made of a low-pass filter in
38
series with a high-pass filter. The high-pass filter, with a cut-off frequency of 0.05Hz, only allows
the components of the signal above this frequency to pass through. The low-pass filter, on the
other hand, allows components of the signal below 100Hz to make it through the filter. For both
the high-pass and low-pass components of the filter, the cut-off frequency is determined by the
values of the capacitors and resistors. The formula in Fig. 5.3 shows the calculation for the cutoff frequency.
Figure 5.3 Cut-off Frequency Equation
5.2.4 Summing Circuit
The function of the summing circuit is to shift the output signal range above the ground
reference (0V). This keeps the signal voltage positive in order to enable the ADC to sample the
entire range of values produced by the analog circuit. This is achieved by offsetting the signal
by a voltage greater than the most negative signal voltage. Fig. 5.4 shows the circuit diagram of
the summing circuit.
Figure 5.4 Summing Circuit
39
The output voltage from a summing amplifier is determined by the equation in Fig. 5.5
(Carter, Bruce). From the formula, if all the resistors share the same value, then the output
voltage is equal to the sum of the input voltages inverted. Since the output voltage is inverted,
an inverting circuit is added after the summing circuit. Since the two resistors in the inverting
circuit are equal, the output is inverted but not amplified.
Figure 5.5 Summing Amplifier Equation
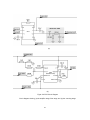
5.2.5 Power Circuit
A single 9V battery powers both the analog and digital circuitry . The digital circuitry (the
PSoC 5 development board) is set to operate at 5V, whereas the analog circuitry requires a 6V
supply. In order to provide the 6V needed by the analog section, the 9V power from the battery
needs to be dropped to 6V. This is accomplished by using a 6V voltage regulator. For this
project, the Micro Commercial Components‟ MC7806CT is utilized. The MC7806CT is a threeterminal positive voltage regulator. Having a dropout voltage of 2V, the MC7806CT requires at
least 8V for proper operation (MC7806CT).
The analog circuitry includes components with op-amps, which require a positive as
well as a negative rail for operation. The 6V regulator provides power to the positive rail. To
provide the negative rail, the MAX1044 switched-capacitor voltage converter is used to invert
the regulated 6V. The MAX1044 is capable of inverting, doubling, dividing, or multiplying an
input voltage (MAX1044/ICL7660).
40
(a)
(b)
Figure 5.6 ECG Circuit Diagram
Circuit diagram showing (a) the amplifier stage, filter stage, and (b) the summing stage.
41
Figure 5.7 ECG Power Circuit Diagram
This circuit diagram shows the 6V voltage regulator and switched-capacitor voltage converter.
These components provide power to the negative and positive rails of the analog circuitry.
42
5.3 Digital Subsystem
The digital subsystem of this module comprises solely of a PSoC 5 development board.
Its main functions include converting the signal from the analog circuitry into digital data,
relaying the stream of samples to the core unit, clocking-in messages from the core device over
the MISO line of the SPI bus, and executing these incoming requests from the core unit.
5.3.1 Analog to Digital Conversion
A Delta Sigma ADC on the PSoC chip is employed to quantize the conditioned signal
for the analog circuitry. The Delta Sigma is configured with its default sample rate of 10,000
samples per second. This sample rate, of course, is in excess of what‟s required to obs erve
cardiac events. Although the sample rate is kept high, the ADC buffer is polled at a much slower
rate of 200Hz for the converted data. The PSoC‟s Delta Sigma ADC allows various
configurations for the input range. For this particular application, a range of VSSA to VDDA is
preferred. VSSA represents the analog ground reference voltage of the board, whereas VDDA
represents the analog source voltage. Although the PSoC 5 development board allows 3.3V
and 5.0V operation, an operating voltage of 5.0V is preferred so that voltages above 3.3V would
be able to be measured by the ADC. The ADC is configured to produce samples with 16bit
16
resolution. This means that the signal can be measured with 2 -1 distinct values. And, since
the range is set to VSSA-VDDA (0V-5V), each step in the converted value represents 5/65535
or 76.3 microvolts.
5.3.2 Preparation and Forwarding of Data
An interrupt handler connected to a 1KHz timer on the PSoC chip is responsible for
collecting samples from the Delta Sigma‟s sample buffer. This reduces the effective sample rate
to 1KHz. Once the data is retrieved from the ADC‟s buffer, it is placed on a holding buffer for
transmission later. This procedure is preferred for two reasons. Firstly, instructions within the
interrupt service routine are kept to a minimum. Instead of doing any processing of the data, it is
simply moved to a location when it will be attended to at a later time. Secondly, to minimize the
43
interval traffic is sent over the bus, ECG samples are transmitted in groups of 5 samples.
Therefore, the device will transmit the next message out to the core only after a minimum of 5
samples has accumulated in the holding buffer.
5.3.3 Servicing Incoming Requests
Because all satellite devices (including this one) is the master on the SPI bus, requests
originating from (or relayed by) the core needs to be clocked in by the satellite device. In order
to do so, the core must pull the asynchronous slave request line high then low. This event
causes an interrupt within the satellite‟s CPU. When this occurs, execution is switched to the
incoming request interrupt service routine. This routine is kept as brief as possible. The routine
simply sets a flag to indicate later to the main loop that an incoming request needs to be dealt
with. The routine then clears the interrupt before returning. A section of the main loop poles the
incoming request flag. If the flag is set, the system clocks in the first 6 bytes. As discussed in
the previous chapter, all messages should begin with the 4-byte message start sequence and
the 2-byte length field. This information is useful for first determining if there is a valid incoming
message. Secondly, the length field indicates the number of bytes that‟s remaining to be
clocked in. In situations where the first 4 bytes indicate that there is no valid message, the
device assumes that it has recently been plugged into to the core and sends an identification
message. As discussed in the previous chapter, the core uses the identification message to
update its routing table.
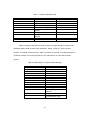
5.3.4 Messages Types
As described earlier, the ECG module sends and receives a small variety of messages.
The remainder of this chapter describes the message types relating to the EGC unit. Table 5.1
provides a summary of these message types.
5.3.4.1 Device Identification Message
This is considered an outgoing message. This message type is sent from the ECG
device to the core unit. The core unit depends on this message for updating its routing table.
44
The destination device for the ECG device identification message is always the core. Also, this
message type never includes a payload. Therefore, the length field is always 10.
5.3.4.2 ECG Data Message
This is the most frequently transmitted message by this device. This message type is
used to transmit the stream of sampled measurements to the server unit. The message length
is always 30 bytes as the payload for this message type is a fixed 20 bytes of data. In the
payload, 5 samples of ECG data are transmitted per message. And each sample is a 2-byte
word. For this message type, the destination is always the server unit.
5.3.4.3 Start Message
This message type is transmitted from the server unit to the ECG device. The server
unit uses this message to start ECG measurements remotely. This message type does not have
a payload so the length is always 10 bytes.
5.3.4.4 Stop Message
Similar to the start message, the stop message is transmitted from the host to the ECG
device. Hence, the originating device is always the server unit. This message type, as the name
suggests, is used to remotely halt measuring and transmission of samples by the ECG device.
Table 5.1 ECG Module Message Specification
Description
Header
Length
Device
Identifier
Message
ECG Data
Message
0x53, 0x4D,
0x53, 0x47
10
0x53, 0x4D,
0x53, 0x47
Start
Message
Stop
Message
0x53,
0x53,
0x53,
0x53,
0x4D,
0x47
0x4D,
0x47
Device
Type
21
(ECG)
MSG
Type
1
Originating
Device
Device ID
Destination
Device
2 (core)
Payload
30
21
2
Device ID
1 (server)
10
21
3
1 (server)
Device ID
20 bytes
of ECG
Data
None
10
21
4
1 (server)
Device ID
None
45
None
CHAPTER 6
BLOOD OXYGEN SATELLITE UNIT
This chapter describes the design of the blood oxygen satellite unit. The chapter first
provides an overview of the unit before covering, in detail, the digital design using the PSoC 5
development board.
6.1 Unit Overview
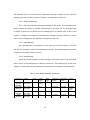
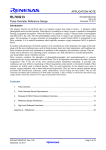
6.1.1 ChipOx Pulse Oximetry Module
For this satellite module, a low-powered pulse oximetry module named ChipOx is
incorporated. Its manufacturer, EnviteC-Wismar GmbH, produces the ChipOx unit as an OEM
module for use in medical devices or other human applications . The ChipOx module operates
with the standard principles for non-invasive pulse oximetry discussed in chapter 2 (EnviteC
User Manual). The device measures the absorbance of red and infrared light by hemoglobin in
the blood using light emitting diodes (LEDs). Fig. 6.1 shows an image of the ChipOx unit (Digital
Pulse Oximeter). The unit operates on a source voltage of 3.3V and consumes less than 25mA
of current. The unit provides a serial UART interface for transmitting digital measurements and
allowing configuration changes.
According to the ChipOx manual, the unit uses its own packet protocol for transmitting
messages. The outer layer is called the transfer layer. In the transfer layer, packets are divided
into 4 major sections. A ChipOx packet comprises of a start flag, the packet‟s data, a checksum,
and an end flag. The checksum in the packet is used to determine whether or not the received
packet is corrupt.
46
Figure 6.1 ChipOx Pulse Oximetry Module
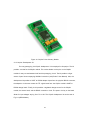
6.1.2 ChipOx Development Kit
For easy prototyping, the ChipOx development kit is employed in this project. The kit
provides a socket for the ChipOx module. This socket breaks out the pins on the ChipOx
module for easy access between itself and the prototyping circuit. The kit provides a finger
sensor clip and its accompanying MiniMed connection jack (EnviteC User Manual). Also, the
development kit provides a UART to RS232 adapter. Apart from the physical RS232 connector,
the adaptor‟s circuit must convert the TTL signal levels from the ChipOx module‟s UART to
RS232 voltage levels. Finally, the kit provides a regulated voltage source for the ChipOx
module, the sensor head, and the RS232 conversion circuit. The power circuitry on the board
allows for input voltages varying from 7V to 16V. The ChipOx development kit can be seen in
Fig. 6.2 (OEM Module).
47
Figure 6.2 ChipOx Development Kit
6.1.3 System Layout
Fig. 6.3 is an illustration of the entire blood oxygen satellite unit. The ChipOx
development board is connected to the unit‟s PSoC 5 board through the RS232. It‟s worth
noting that, in a non-prototyping situation, the ChipOx development board would be eliminated.
This would allow the UART from the ChipOx unit to connect directly to the UART on the PSoC
chip. In the prototype design, the development board also shares power with the PSoC board.
48
Figure 6.3 Pulse Oximety Satellite Unit Overview
6.2 Program Flow
On power up, processing on the PSoC5 unit begins by initializing the peripherals and
enabling global interrupts on the chip. Once initialization is complete, the unit attempts to send a
device identifier message to the core unit before processing enters the main loop.
49
6.2.1 Handling data from the ChipOx module
Bytes coming in from the ChipOx module are initially buffered in the UART on the PSoC
chip. The arrival of new data on the bus results in an interrupt. The related interrupt service
routine sets a data ready flag and clears the interrupt. Polling of this flag occurs in the main
loop. Once it‟s determined that new data is available, data is read one byte at a time from the
UART. After each byte is retrieved, it is added to a circular buffer. When all the bytes in the
UART‟s read buffer have been pushed into the circular buffer, the buffer is processed.
6.2.1.1 Processing of ChipOx Packets
Processing the buffer includes first determining whether a complete ChipOx packet
exists. Bytes at the start of the buffer that‟s not the ChipOx start sentinel are purged from the
buffer. All other bytes leading up to the end sentinel are left in the buffer. The presence of the
end sentinel indicates a complete packet. Using the message identifier field of the completed
ChipOx packet, the content of the packet is translated into a message type defined for this
project. The packet is removed from the circular buffer and the translated message is sent to
the core unit over the SPI bus.
6.2.1.2 ChipOx Packet Specification
Wrapped within the payload section of the ChipOx data packet is another layer, which is
referred to as the communication layer. This layer defines the channel and message types
(EnviteC User Manual). The first byte in the payload represents the channel ID. Per the manual,
channel 127 is used. The next byte indicates the message type. The ChipOx user manual
defines a plethora of ChipOx message types. For the purpose of this project, only a subset of
these message types will be focused upon. Table 6.1 provides a summary of these ChipOx
message types. The final section of the payload is actual data. The length of this field varies for
different message types.
50
Table 6.1 ChipOx Message Format
Message Identifier
0x01
0x02
0x03
0x05
0x08
0x51
0x71
0x72
0x73
0x74
Description
SpO2 Value [0-100%]
Pulse [0-300 bpm]
Signal Quality [0-100%]
Pulsation Strength [0-255]
Status Information (Bit coded)
Realtime Data (multi-data
packet)
Error. Unknown Channed ID
Error. Unknown MSG
Identifier
Error. Corrupt Parameter
Error. Transfer Protocol Error
Field Length (bytes)
1
2
1
1
2
Variable
2
2
2
1
ChipOx message types 0x01 and 0x02 provide the oxygen saturation and pulse rate.
Message identifier 0x08 provides status information. Having a width of 2 bytes, this field
provides 15 individual status indicators. Table 6.2 provides a summary of the data presented in
the status message. The most significant bit in the status field is not used and should be
ignored.
Table 6.2 Bit Definitions of ChipOx Status Message
Bit
0
1
2
3
4
5
6
7
8
9
10
11
12
13
14
Description
Sensor off
Finger out
Pulse wave detected
Searching for pulse
Pulse search timeout
Low pulse strength
Low signal
Too much ambient light
Too many disturbances
High motion artifact
Sensor defective
Power supply out of tolerance
Operating temperature out of
tolerance
Wrong sensor
Vital parameter data outside
of measurement range
51
Table 6.3 Pulse Oximetry Message Specification
Description
Header
Length
Device
Identifier
Message
SPO2
Data
Message
Pulse Data
Message
Status
Message
Error
Message
Start
Message
Stop
Message
0x53, 0x4D,
0x53, 0x47
10
0x53, 0x4D,
0x53, 0x47
0x53,
0x53,
0x53,
0x53,
0x53,
0x53,
0x53,
0x53,
0x53,
0x53,
0x4D,
0x47
0x4D,
0x47
0x4D,
0x47
0x4D,
0x47
0x4D,
0x47
Device
Type
22
(SPO2)
MSG
Type
1
Originating
Device
Device ID
Destination
Device
2 (core)
Payload
11
22
2
Device ID
1 (server)
1 byte
12
22
3
Device ID
1 (server)
2 bytes
12
22
4
Device ID
1 (server)
2 bytes
11
22
5
Device ID
1 (server)
1 byte
10
22
6
1 (server)
Device ID
None
10
22
7
1 (server)
Device ID
None
None
6.2.1.3 Satellite Device Messages
Table 5.3 is a summary of the oximeter satellite‟s message types. Incoming packets
from the ChipOx module are translated into these messages prior to being forwarded to the
core.
52
CHAPTER 7
SPIROMETER SATELLITE UNIT
This chapter describes the design of the spirometer satellite unit. The chapter first
provides an overview of the unit before covering, in detail, the digital design on the PSoC 5
development board.
7.1 Unit Overview
This device comprises of three subsections. The spirometry module is the AM1+ BT
spirometer by eResearchTechnology GmbH (ERT). The next subsystem involves a module for
adding Bluetooth capabilities to the satellite device. The final subsystem is responsible for
controlling, translating, and forwarding of messages between the core unit and the spirometer.
The spirometry module and the satellite module are not physically attached, but rather are
connected via a Bluetooth link. Fig. 7.1 provides an overview of the system.
7.1.1 ERT AM1+ BT Module
The AM1+ BT is an electronic peak flow meter for measuring lung function. According
to the AM1+ BT user manual, the device is suitable for monitoring the respiratory status of
asthma and chronic obstructive pulmonary disorder (eResearchTechnology 67). The device is
also useful in applications such as occupational medicine and disease management.
The AM1+ BT saves measurements taken in its internal database. A maximum of 400
readings can be stored at any given time in its non-volatile memory. Measurements stored in
memory can later be exported from the device memory over its Bluetooth link. For each
measurement, the device provided parameters include FVC, PEF, and FEV1. The device also
provides the date and time of each measurement.
53
Figure 7.1 Spirometer Satellite Overview
54
7.1.2 WT41 Bluetooth Module
Bluegiga Technology‟s WT41 is a Bluetooth module sharing the same basic features as
the RN-41-SM discussed earlier in chapter 4 with a lot of additional capabilities. This module
was required as the internal buffer of the RN-41-SM proved to be insufficient for the transfer
burst of the AM1+ BT. The WT41 is a class 1 device with a range of up to 800 meters (Bluegiga
6). The module is equipped with an SPI, a USB, and a UART communication bus. In the pursuit
of simplicity, the UART is the bus of choice for this project.
7.1.2.1 iWRAP4 Firmware
iWRAP4 is the embedded firmware running on the WT41 module (iWRAP4 10). This
firmware arms the WT41 with the full Bluetooth protocol stack and many Bluetooth profiles. The
iWRAP4 firmware accepts commands and configuration changes in the module via ASCII
instructions over the UART interface. Table 7.1 provides a small subset of iWRAP4 commands
relevant to this project.
Table 7.1 Subset of iWRAP4 Commands
iWRAP4 Command
AT
SET
SET {category} {option} {value}
SET BT AUTH {device address} {pin}
INQUIRY [timeout]
CALL {device address} {channel} {mode}
LIST
CLOSE {link ID}
<1 second>+++<1 second>
SELECT {link ID}
Description
Test that the iWRAP is functional
Returns configurations of the Bluetooth device
Change configurations
Category: BT, CONTROL, PROFILE, link_Id
Eg. SET CONTROL BAUD 115200
Sets the pin that would be used for pairing
with a device
Scans for nearby discoverable Bluetooth
devices
Initiate a Bluetooth connection.
For serial port profile channel = 1101
For this project mode = RFCOMM
Shows the count of active connections
Close a connection at the link ID
Escape sequence. Toggle between command
mode and data mode.
Switch from command mode to data mode for
the specified link
The iWRAP4 firmware allows the device to be connected to multiple devices at the
same time. Of course, only one connection can be selected at a given time. Using the
55
commands in Table 7.1, the PSoC chip is able to pair with the AM1+ BT spirometer and request
stored data.
7.1.3 The PSoC 5 Control Unit
The control unit for the satellite is implemented on a PSoC 5 development kit. Because
the unit communicates with the WT-41 via UART, a UART peripheral is added to the logic array.
The usual SPI peripheral for communication with the core is present. Before a communication
link with the AM1+ BT can be established, its Bluetooth must be manually enabled. This must
be done every time communication is needed as the Bluetooth on the AM1+ BT automatically
disables if a link is not made after a certain period. Because of this requirement, the system is
designed such that the press of buttons on the PSoC5 development board initiates all
interaction between the PSoC5 chip and the AM1+ BT.
A button on the PSoC5 development board is responsible for initiating the data export
function on the spirometer. The pin on the PSoC chip is configured as a resistive pull up. The
press of the button pulls the pin to ground. This event causes an interrupt and, eventually, the
related interrupt service routine to execute. This routine sets a flag, which in turn, causes the
main loop to execute code to establish a connection with the spirometer through the WT41-A.
Once a connection is established, the satellite‟s control unit issues commands to AM1+ BT to
export any saved data.
7.2 Program Flow
On power up, the PSoC chip initializes the SPI and UART peripherals. It also enables
global interrupts on the device. Like the other satellite units, the unit sends a device identifier
message over the SPI bus to the core. All activity in the main loop is initiated either by the press
of command buttons on the PSoC board or upon receiving a slave request from the core unit.
7.2.1 Data Export Command Sequence
A flag set by the data export command button‟s interrupt service routine is polled in the
main loop. If the flag has been set, a data export sequence is initiated. The device first sends
56
the „AT‟ command from Table 7.1 to the WT41-A module. A response of „OK‟ allows the
transition to the next stage of the state machine. This is a simple check that the Bluetooth
module is up and running. Then a connection to the spirometer is made using the „CALL‟
command. A response of “CONNECT {link number} RFCOMM 1” indicates that the connection
was successful. At this point, any bytes sent over the UART will be forwarded to the AM1+ BT.
Before any commands are sent to the device, the AM1+ BT communication protocol suggests
that hexadecimal value 0x05 (ENQ) is sent to the device for synchronization (Asthma Monitor
4). Once the device acknowledges with a response of hexadecimal 0x06 (ACK), the data
request command can be sent. To request the data, the ASCII command “B01<CR>” is sent to
the device. It should be noted here that when the data makes it way to the server unit, a clear
memory message is immediately sent back to the satellite device. Upon receipt of this
message, the device issues a “L<CR>” delete command to the AM1+ BT. This clears the
memory for future measurements. Two seconds after the satellite device forwards the data to
the core, the “+++” escape sequence is issued to the WT41-A. This transitions the WT41-A to
command mode where the “CLOSE” command is used to disconnect the Bluetooth link. The
timeout of two seconds allows time for the clear memory message to get back. If for some
reason this message does not make its way back, the link is disconnected without clearing the
memory.
7.2.2 Translation and Forwarding of AM1+ BT Data
The format of the data export transmitted from the AM1+ BT is shown in Fig. 7.2
(Asthma Monitor). The device always returns 11 lines of data. The rows of result data are
horizontally aligned and the columns vertically. Thus, each line contains the total number of
results pertaining to one particular parameter. Each line begins with a 3-byte string, which
indicates the length in bytes of the line. The next 4 characters make up a code indicating the
parameter that the current line represents. Following the parameter code is the list of stored
results for that parameter. A colon delimits each result in the list. The line ends with the cursor
57
return (0x0D) and line feed (0x0A) characters. These two bytes are also included in the length
count.
Figure 7.2 AM1+ Data Export Format
For the purpose of forwarding the retrieved data, the satellite device creates one
message for each stored test set. Therefore, a single data export from the AM1+ can result in
multiple satellite messages. Before the messages containing the test results are transferred to
the server, a result header message is sent. The sole purpose of this message is to inform the
server of the number of expected results. Because the server needs to respond with a clear
memory message only after all the results are received, the expected number of messages is
needed.
58
Table 7.2 provides a summary of the satellite‟s message types. In the spirometer‟s data
messages, all parameters are transmitted as integer values with the exception of the date and
time parameters. In other to do so, the satellite unit converts the ASCII representations
transmitted by the AM1. The date and time parameters are kept as ASCII strings within the
message.
Table 7.2 Spirometer Message Specification
Description
Header
Length
Device Type
MSG
Type
1
Originating
Device
Device ID
Destination
Device
2 (core)
Payload
Device
Identifier
Message
Spirometer
Data
Message
Spirometer
Data
Header
Message
Clear AM1
Memory
Message
0x53,
0x4D,
0x53, 0x47
0x53,
0x4D,
0x53, 0x47
0x53,
0x4D,
0x53, 0x47
10
23
(Spirometer)
29
23
2
Device ID
1 (server)
19 bytes
11
23
3
Device ID
1 (server)
1 byte
0x53,
0x4D,
0x53, 0x47
10
23
4
1 (server)
Device ID
None
59
None
CHAPTER 8
SERVER UNIT
This chapter describes the design of the server unit. The primary function of the server
unit is to serve as a central data repository, to function as an interface between the patient and
the doctor‟s office, and to present historical data from the connected devices in a meaningful
way.
8.1 Unit Overview
Although the prototype was done using a laptop, the server unit can exist on any
computer system having Bluetooth capability and the UBUNTU Linux operating system. Other
versions of the Linux operating system may be used provided that the necessary libraries are
available for these operating systems. The key components making up the server unit includes
the communication core, the data store middleware, and a graphical user interface (GUI). Both
the communication core and the data store are daemon processes. Events within the system
either emanates from the GUI or as a result of data events in the communication core. Fig. 8.1
provides an illustration of the server unit‟s overall architecture.
8.1.1 The D-Bus
Because the server unit consists of independent processes working together, a system
for inter-process communication (IPC) is necessary. In order to transmit messages and events
between processes, the D-Bus messaging system is put into use. D-Bus is a well-known IPC
mechanism in the Unix domain. It allows local communication between processes running on
the same host. The D-Bus allows both one-to-one messaging and publish/subscribe type
communication (Warsaw, Barry 1). Apart from allowing messages to be shared between
processes, D-Bus also emulates function calls by supporting message parameters and return
types. These are referred to as methods.
60
The parameters and return values are not treated simply as raw bytes, but as structured
data types. This allows the D-Bus to be able to validate the data it carries. Processes wishing to
communicate over the D-Bus have the option of two distinct components for doing so. One
option is the point-to-point dbus library. The dbus library allows any two processes to exchange
messages. The other is the dbus daemon. The daemon runs a bus with which any number of
processes may be connected to at any given time. The dbus daemon is also capable of
providing authentication mechanisms and access controls for processes running under different
users that wish to communicate. Each bus has an address that describes how to connect to it.
Typically, this address will be a filename.
Connections to the bus are addressed using the connection‟s bus names. These names
consist of dot-separated identifiers. Processes access the bus using what are called proxy
objects. They are referred to proxies, as these objects, which are local to the individual client
processes, are simply local representations of bus objects. Bus objects also have names or
paths. Each object exists within the context of a particular connection. Therefore, in order to find
an object, both the name of the connection and that of the object are necessary.
In the context of the D-Bus, method invocations differ from conventional function calls.
Method invocations could be either synchronous or asynchronous. Conventional function calls
are synchronous. This means that when a function is called, the calling program must wait until
the function returns. Asynchronous method invocation allows the requesting process to
accomplish other tasks while waiting for a response. In asynchronous invocation, a process can
actually call other methods while waiting on a response from a previous call. Also, the D-Bus
provides timeouts for message returns. If a method does not return within this timeout, an
exception will be produced. For the purpose of this project, the Glibmm binding to the D-Bus
library was utilized.
61
Figure 8.1 Server Unit Block Diagram
8.1.2 Communication Layer
The communication layer is the interface to the machine‟s Bluetooth hardware. The
communication layer is implemented as a daemon process monitoring the emulated serial
Bluetooth port. Unlike the GUI, this process must be running for the system to function.
62
8.1.1.1 Interface to Hardware
The system gains access to the hardware by opening a file descriptor to the Bluetooth
device node. The device node is an interface to the hardware driver provided by the operating
system. Bluetooth communication is done using the serial port profile (SPP). SPP emulates
serial cable communication over a Bluetooth link (Palo Wireless 1). The port is configured using
a baud rate of 115200. The port is configured with the common 8 data bits, no parity and 1 stop
bit.
Once the file descriptor is opened, the system monitors the file descriptor at regular
intervals using the select command. This method is normally applied to network server
processes for monitoring whether new data is ready to be read on a socket. The select
command waits on either the arrival of new data or expiring of a timeout. This timeout allows the
execution to cancel the read if there isn‟t any data available after the set duration. This is
important for such processes as a blocking call could prevent other important tasks from taking
place while there‟s no data coming in from the port.
Whenever new data is available, it is read into a buffer. The system processes the
buffer by scanning for the presence of complete messages. Similarly to the core unit, the length
field in the message is used to determine whether the entire message is present in the buffer.
Once a complete message is detected, the message is forwarded to the data store middleware
process via the D-Bus.
8.1.1.2 Interface to Middleware
The interface from the communication core to the middleware process is the D-Bus.
Requests coming from the middleware are wrapped in the system message header before
being transmitted over the Bluetooth link. Inbound messages processed from the Bluetooth port
are unwrapped before being forwarded to the middleware.
63
8.1.3 Data Store Middleware
The function of the data store middleware is primarily to process then save incoming
data to the database. The middleware also functions as a repeater. It emits signals to the GUI
alerting it that events have occurred. This process is essential to the server‟s functionality and
must be kept alive while the system is running. Apart from receiving external messages from the
communication core, it also receives requests from the GUI. These requests are packed into
system messages and forwarded to the intended recipients via the communication core.
When a message passed on from the communication layer is received, the device type
and message type fields are used to determine the callback function to process the packet.
Processing the packet involves parsing the bytes received and then storing the data in the
correct database tables. Once the database inserts has been committed, the process emits a
signal to the GUI. This signal alerts the GUI that an event has occurred and that a data refresh
is necessary.
8.1.2.1 Event Logging
Another very important function of this process is system logging. Because it exists
between the GUI and the communication layer, the middleware is aware of all significant events
occurring within the system. GUI initiated commands to the external devices must be routed
through the middleware. Also, messages initiated externally make their way from the
communication core to the middleware. Another reason why the logs produced by the
middleware are very useful is the fact that messages received at the communication core are
treated as a black box. The messages are not interpreted passed the message start sentinel
and the message length field. The middleware, on the other hand, parses the incoming
messages and hence expose information about every message.
64
8.1.2.2 Email Alerts
The middleware process is capable of performing analysis on received data and
sending out alert emails when necessary. The arrival of certain message types can initiate
analysis of the data in the database. In cases where it is determined that urgency exists, the
system sends out emails using a system call to the MUTT utility (MUTT is a text-based mail
utility available on most Unix systems). This functionality depends on a persistent Internet
connection.
8.1.2.3 The Database
It is required that events in the system originating from the Bluetooth hardware are
eventually saved in some format in a database. Data stored in a database will be easily
available later for display and analysis. Not only is a database necessary for storage and
retrieval of measurement data, but it‟s also required for storing system settings and state
variables. The database system of choice for this project is PostgreSQL. PostgreSQL is an
“open source object-relational database system” (PostgreSQL 1). In order to access the
PostgreSQL database from within the GUI, an interface library is required. For this requirement,
the pgSQL C++ library, “libpqxx,” is included in the source.
8.1.2.4 Status Monitoring
Another function of the middleware is to occasionally poll the core unit for status
updates. Every 10 seconds, a message is sent to the core unit to request an update on which
devices are currently connected. 10 seconds provide an updated status without producing too
much traffic on the bus. Upon receiving this message, the core unit broadcasts a device
identification request over each SPI bus. The responses are then forwarded to the middleware.
8.1.4 The Graphical User Interface
Unlike the other processes in the server, the GUI is not essential for the system to
function. The GUI is only necessary for presenting information from the database to the user. It
also provides other information such as notifications of certain events in the system. The GUI is
65
developed with the gtkmm library. GTK refers to the GIMP Toolkit and is a library collection for
creating graphical user interfaces. The gtkmm library provides a C++ interface to GTK+ which is
natively C.
8.1.3.1 The Start Page
Fig. 8.2 shows a screenshot of the GUI. The main window comprises solely of a
notebook widget and a status area. Within the notebook, each vital sign device has its own tab.
The status area below displays the availability of devices within the system. A red indicator
shows that the device is currently unavailable, whereas a green indicator shows that the device
is currently online. This function is implemented by connecting a status update handler to the
middleware. Whenever the middleware detects a change in the availability of devices connected
to the system, it emits a signal to the GUI.
Figure 8.2 Graphical User Interface Start Page
66
8.1.3.2 The Oximeter Page
The oximeter page offers a graphical representation of the data coming in from the
oximeter satellite unit. The page displays real-time graphs for pulse and blood oxygen
saturation. When the middleware receives data messages from the oximeter satellite, the data
is stored and emitted to the GUI as an argument in a signal. The callback for that specific signal
in the GUI adds the new data to the buffer and redraws the screen. The buffers for both of these
graphs withhold data until the buffer outgrows a determined size. After this limit, new messages
added causes the older data to be dropped producing a moving real-time graph.
Figure 8.3 Graphical User Interface Oximeter Page
8.1.3.3 The Spirometer Page
The spirometer page provides a history of readings in a tabular and a graphical view of
the 10 most recent reading. This version of the plot widget was designed to draw multiple data
67
groups on a single graph. Since the PEF values are generally much smaller than the FVC and
FEV1 values, the plot widget was designed to allow independent zoom factors to the y -axis of
each plot. This allows the three parameters to be within view. Similarly to the plots in the
oximeter page, the plot will begin dropping data once the 10-point limit is reached. The
spirometer page also updates automatically when new data arrives from the middleware
daemon.
Figure 8.4 Graphical User Interface Spirometer Page
68
7.1.3.4 The ECG Page
The ECG page provides a more visual representation of the incoming stream of data
from the ECG. The ECG page also contains a start and stop button, enabling the server to start
and stop the remote satellite device. The start and stop buttons emit D-Bus signals to the
middleware process prompting it to generate and send command messages to the satellite unit.
The plot is configured to hold a maximum of 500 data points before it starts scrolling. The plot
also displays the last received voltage value from the ADC in millivolts.
Figure 8.5 Graphical User Interface ECG Page
69
The plot is able to update the display in two modes. In scrolling mode, the plot shows
the normal behavior when the 500 data points limit is met. The oldest data point is removed
from the end of the buffer before the new data point is added. In overwrite mode, the plot
behaves like the usual ECG display. The buffer is implemented as a fixed array with a moving
index. Each time a new data point arrives, it simply replaces the old data at the current index
then the index is incremented. Of course, the index is reset to zero when it gets to the end of
the array buffer.
70
CHAPTER 9
CONCLUSION AND FUTURE WORK
This chapter discusses the results achieved from the research performed in this thesis.
The scope of this research focused mainly on the design and development of a detached vital
sign management system. The system was required to be flexible (having the ability to hold
different configurations) and disconnected from any wall sockets.
9.1 Conclusion
The five subsystems discussed in this thesis paper were developed. When connected
together, messages were routed throughout the system allowing measurements to be stored
remotely by the server.
The core unit was developed with the PSoC 5 development kit and the RN-41-SM
module. The core unit acts as a wireless bridge between satellite devices and the remote
server. Multiple satellite devices were able to connect to the core unit forming a star network.
Activity passing through the core was observed by the alternate blinking of two LEDs indicating
that a complete message has been received or routed.
The spirometer satellite unit was developed with the PSoC 5 development board and
the WT41-A Bluetooth module. At the touch of a button, the spirometer unit initiates Bluetooth
connection between the WT41-A and the AM1+ BT device. The device then requests the stored
data on the AM1. The data is received by the satellite unit and parsed. Each individual result is
then sent to the server via the core unit. After initiating the data exchange, new spirometer data
were seen on the database and the GUI automatically refreshed displaying the new data.
71
The pulse oximeter satellite unit was developed with the ChipOx OEM module and the
PSoC 5 board. Data transmitted by the ChipOx device was formatted to meet the system
communication specification before being forwarded toward the server via the core unit. Pulse
and blood oxygen reading were observed in the database and on the GUI.
The ECG unit was developed with both the analog circuitry and the PSoC 5 board. ECG
data were observed passing through the core unit and making its way to the server. The results
were observed as a live plot on the GUI. Although heart activity was clearly observed on the
plots, the expected P wave, the QRS complex, and the T wave were not well defined. Additional
work is required to refine the ECG traces.
Finally, the server unit was developed with its three sub-processes. The server
communications process was developed as a daemon process. This process serves as the link
between the server‟s Bluetooth modem and the other components. The server core process
receives messages and signals from the communication process and the graphical user
interface. The server core process generated logs and saved inbound data from the
communication process to the PostgreSQL database. The graphical user interface was
developed using the GTKmm library. The GUI provided a visual view of what‟s going on with the
attached devices in the system. Inter-process communication between the server‟s processes
was implemented with the Glibmm bindings to the D-Bus.
9.2 Future Work
As mentioned in section 9.1, the ECG satellite unit needs additional work in order to
improve the waveform. The filter stage needs to be improved upon to reduce interference and
avoid filtering out of wanted frequencies. Input guarding circuitry needs to be added to the ECG
design as an additional measure to reduce interference. The ECG unit would also show
improved performance with the addition of a third electrode for reducing common mode noise.
Finally, the ECG unit could be made even less obstructive to the patients by implementing it as
a wearable device with communication to the core unit solely by Bluetooth.
72
To allow for use in multi-level homes, work on a Bluetooth forwarding system using the
WT41-A is proposed. This would increase the range of the system to multiple floors within a
home.
Additional satellite devices, including a wireless glucose monitor and a blood pressure
meter, should be designed and added to the arsenal of devices that are able to integrate and
work with the system.
73
REFERENCES
[1] Asthma Monitor AM1+ Communication Protocol. Hoechberg:, 2011. Print.
[2] Bluegiga Technologies. "iWRAP4 User Guide." Bluegiga. 2012.Web.
<http://techforum.bluegiga.com/wt41?downloads#1. 0>.
[3] Bluegiga Technologies. "WT41-A / WT41-N Datasheet." Bluegiga. 2012.Web.
<http://techforum.bluegiga.com/wt41?downloads#1. 0>.
[4] Carter, Bruce. "A Single-Supply Op-Amp Circuit Collection." TEXAS INSTRUMENTS.
2000.Web. <http://www.ti.com/lit/an/sloa058/sloa058.pdf>.
[5] Cypress Semiconductor. "PSoC 5 Architecture Technical Reference Manual." Cypress
Semiconductor. 06/05/2012 2012.Web. <http://www.cypress.com/?rID=55603>.
[6] Cypress Semiconductor. "PSoC 5LP Development Kit Guide." Cypress Semiconductor.
2012.Web. <http://www.cypress.com/?rID=51577>.
[7] "EnviteC User Manual: Digital Pulse Oximeter Module ChipOx." MTL System. 2006.Web.
<http://www.mtl-system.com/Products/Envitec/SPO2/chipox/47-07-00330002-g.pdf>.
[8] eResearchTechnology GmbH. Asthma Monitor AM1+BT Instructions for use. Hoechberg:,
2012. Print.
[9] eResearchTechnology GmbH. "Image of The AM1+." ERT. 2012.Web.
<http://www.ert.com/equipment-catalog/am1>.
[10] "Fingertip Pulse Oximeter." Wikipedia. 2012.Web.
<http://en.wikipedia.org/wiki/Pulse_oximetry>.
[11] "INA128 Precision, Low Power Instrumentaion Amplifiers." TEXAS INSTRUMENTS.
2012.Web. <http://www.ti.com/product/ina128>.
[12] Kester, Walt. "ADC Architectures III: Sigma-Delta ADC Basics." Analog Devices, Inc.
2008.Web. <http://www.analog.com/static/imported-files/tutorials/MT-022.pdf>.
74
[13] "MAX1044/ICL7660 Switched-Capacitor Voltage Converters." Maxim Integrated. 1994.Web.
<http://www.maximintegrated.com/datasheet/index.mvp/id/1017>
[14] Maxim Integrated. "Understanding Flash ADCs." Maxim Integrated. 2010.Web.
<http://www.maximintegrated.com/app-notes/index.mvp/id/810>.
[15] "MC7806CT Three-Terminal Positive Voltage Regulators." Micro Commercial Components.
06/01/2011 2011.Web. <http://61.222.192.61/mccsemi/up_pdf/MC7806CT(TO-220).pdf>.
[16] Mendelson, Yitzhak. "Pulse Oximetry: Theory and Applications for Noninvasive Monitoring."
Clinical Chemistry 38.9 (1992): 1601-7. Print.
[17] MettŠla, Riku, Olof Dellien, and Johan Sšrensen. "Serial Port Profile." www.Bluetooth.org.
2012.Web.
<http://www.bluetooth.org/docman/handlers/DownloadDoc.ashx?doc_id=260866& vId=2900
97>.
[18] Mortimer, Kathleen M., et al. "Evaluating the use of a Portable Spirometer in a Study of
Pediatric Asthma." Chest 123 (2003): 1899-907. Print.
[19] Nagel, Joachim H. "Biopotential Amplifiers." Medical Devices and Systems. Ed. Joseph D.
Bronzinno. 3rd ed. Boca Raton, FL: Taylor & Francis Group LLC, 2006. 52-1. Print. THE
BIOMEDICAL ENGINEERING HANDBOOK .
[20] National Institute of Allergy and Infectious Diseases. "Asthma in the US: Growing every
year." National Institute of Allergy and Infectious Diseases. 2012.Web.
<http://libproxy.uta.edu:3106/topics/asthma/understanding/Pages/usAsthma. aspx>.
[21] Neuman, Michael R. "BIOPOTENTIAL ELECTRODES." MEDICAL INSTRUMENTA TION
Application and Design. Ed. John G. Webster. 4th ed. Hoboken, NJ: John Wiley & Sons,
Inc., 2010. 189. Print.
[22] "OEM Module." MTL System.Web. <http://www.mtl-system.com/oemmodule.html#ChipOx>.
75
[23] Onaral, Banu. "Biomedical Signal Analysis." Medical Devices and Systems. Ed. Joseph D.
Bronzinno. 3rd ed. Boca Raton, FL: Taylor & Francis Group LLC, 2006. 1-2. Print. THE
BIOMEDICAL ENGINEERING HANDBOOK .
[24] Palo Wireless. "Seial Port Profile." Palo Wireless Bluetooth Resource Center.Web.
<http://www.palowireless.com/infotooth/tutorial/k5_spp. asp>.
[25] Pierce, Rob. "Spirometry: An Essential Clinical Measurement." Australian family physician
34.7 (2005): 535-9. Print.
[26] PostgreSQL. "About." PostgreSQL. 2012.Web. <http://www.postgresql.org>.
[27] Roger, Veronique L, et al. "Heart Disease and Stroke Statistics 2012 Update." Circulation
125 (2012): 188-97. Print.
[28] Roving Networks. “Roving Networks Bluetooth Product User Manual.” Roving Networks.
2009.Web. <http://www.rovingnet works.com/products/RN_41>.
[29] Severinghaus, John W., and Honda Yoshiyuki. "HISTORY OF BLOOD GAS ANALYSIS.
VII. PULSE OXIMETRY." journal of clinical monitoring 3 (1987): 135-8. Print.
[30] "TELECTRODE." BIO-PROTECH INC. 2005.Web.
<http://www.protechsite.com/eng/pro/ecg-electrodes.html>.
[31] "Understanding Common-Mode Signals." June 29, 2003 2003.Web. September 14, 2012
<http://www.maximintegrated.com/app-notes/index.mvp/id/2045>.
[32] Warsaw, Barry. "Introduction To DBus." freedesktop.org. 2011.Web.
<http://www.freedesktop.org/wiki/IntroductionToDBus>.
[33] Watts, M.P., D. B. Shoat. "Trends in Electrocardiograph Design." Journal of the Institution of
Electronic and Radio Engineers 57.4 (1987): 140-50. Print.
[34] Webster, John G. "AMPLIFIERS AND SIGNAL PROCESSING." MEDICAL
INSTRUMENTA TION Application and Design. Ed. John G. Webster. 4th ed. Hoboken, NJ:
John Wiley & Sons, Inc., 2010. 91. Print.
76
[35] World Health Organization. "Cause-specific mortality, 2008: WHO region." World Health
Organization. 2008.Web.
<http://libproxy.uta.edu:3537/entity/gho/mortality_burden_disease/global_burden_disease_
DTH6_2008.xls>.
77
BIOGRAPHICAL INFORMATION
Anderson John was born in Roseau, Dominica in 1980. He completed his Bachelors in
Computer Science at the Midwestern State University in Wichita Falls, Texas towards the end of
2007. In January of 2008, he started his career in embedded software engineering at a medical
equipment manufacturer in Dallas, Texas. In the fall of 2009, he began his graduate studies as
a part-time student at the University of Texas, Arlington. His areas of interest include embedded
systems design and medical device engineering.
78