1
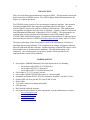
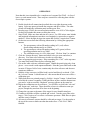
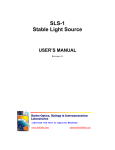
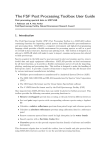
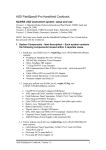
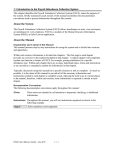
USING THE OCEAN OPTICS SPECTRORADIOMETER
By Mark Nordheim
Cosine corrector
Serial connection
USB2000
incoming
Fiber optics
Computer
USB2000
upwelling
Bare fiber head
Last revised: August 6, 2004
2
WHAT IS THIS?
There are two different spectroradiometer systems at ERSC. This document concerns the
dual Ocean Optics USB2000 system. The ASD FieldSpec Hand Held instrument is the
subject of a separate document.
The USB2000 system consists of two spectrometers connected together. One measures
incoming sunlight and the other measures upwelling light from the target. A white
reference panel is also used to calibrate reflectance measurements. This configuration
was originally developed at the University of Nebraska – Lincoln’s Center for Advanced
Land Management Information Technologies (UNL-CALMIT). The spectrometers are
operated using a laptop (which must be brought out in the field) running CDAP
(CALMIT Data Acquisition Program). Questions about the hardware or software can be
directed to Bryan Leavitt at CALMIT ([email protected], phone: (402) 472-0306).
The primary advantage of the Ocean Optics system is the simultaneous collection of
upwelling and incoming radiation. This compensates for changes in lighting conditions
between calibration and data collection. Another advantage is that the fiber optics can be
placed underwater or in other unusual conditions. The main disadvantage is the
complexity – the system requires two people to operate effectively and may be
impractical under certain field conditions.
HARDWARE LIST
•
•
•
•
•
•
•
•
•
•
Ocean Optics USB2000 Miniature Fiber Optic Spectrometer (2) including:
o Ocean Optics GRATING #2 (350-1000 nm)
o Ocean Optics SLIT-25 25-micron slit
o Ocean Optics OFLV-350-1000 detector filter
Ocean Optics CC-3-UV Cosine Corrector
Ocean Optics QP400-VIS/NIR fiber optics (6, various lengths)
Labsphere Spectralon SRT-99-100 99% reflectance standard, 10 inch by 10 inch
Quatech QSP-100 four port RS-232 serial PCMCIA card
Serial cables
12 V battery with power adapter and splitter
GPS unit (any)
Dell Latitude notebook computer
For technical specifications of these components, visit the manufacturers websites:
o www.oceanoptics.com
o www.labsphere.com
o www.quatech.com
o www.calmit.unl.edu
3
BEFORE GOING IN THE FIELD
•
•
•
•
•
Check the hardware list above to make sure everything is present (items should be
in the dark gray pelican case, except fiber optics, cosine corrector, and laptop).
Make sure the fiber optics that you will use are not broken. To do this, remove
the caps from both ends, hold one end towards light and look through the other
end. You will see light shining through if the fiber is in good condition.
Make sure the Quatech QSP-100 card is in the laptop and its batteries are fully
charged. The Quatech drivers must be installed.
CDAP must be installed on the laptop and the current.ini file must reflect the
instrument calibrations (if you are using a different laptop, copy this file from the
Dell Latitude).
Check GPS batteries and the 12 V battery.
ASSEMBLY
Items marked with red tape are associated with incoming solar radiation (downwelling).
Items marked with green tape are associated with upwelling radiation from the target. In
general, connect red to red and green to green. Here are some steps to follow:
1. Attach the power adapter to the 12 V battery (red to red, black to black).
2. Connect the plugs on the other side of the adapter to the appropriate holes in the
USB2000 units.
3. Attach the serial cables to the USB2000 units’ serial ports (red to red, green to
green).
4. The multiport adapter connects to the QSP-100 card and to the serial cables.
5. The red fiber optic plugs into the red spectrometer and has the cosine corrector on
the other end.
6. The green fiber plugs into the green spectrometer and has a bear head at the other
end. Remove the cap.
7. The USB ports on the spectrometers are not used.
Serial Ports
Fiber Optic
Ports
Power Plugs
4
OPERATION
Note that this is not intended to be a complete user’s manual for CDAP. As far as I
know, no such manual exists. These steps are essential for collecting data with the
Ocean Optics system:
1. Double check the all connections described above are tight, then turn on the
laptop. Select one person to handle the computer and the red fiber. The other
person will handle the calibration panel and the green fiber.
2. In order to use CDAP, the screen resolution must be set to 1024 x 768 or higher.
On the Dell Latitude this means scrolling the screen.
3. Start CDAP. Make sure date and time are correct. Use GPS unit to enter latitude
and longitude information (remember west longitude is expressed as a negative
number). Select daylight savings time status and click the “acquire data” button.
4. On the next screen enter the following information by clicking the appropriate
buttons:
a. The spectrometer with an ID number ending in 21 (red) collects
downwelling radiation and is on COM6.
b. The spectrometer with an ID number ending in 22 (green) collects
upwelling radiation and is on COM5.
c. The calibration source is a 99% white panel. Click on “done” to continue.
5. Click the “change directory” button and either select (or create and select) a
directory. You must select a directory in order to collect data.
6. Enter an appropriate project name. Enter something like “CAL” as the rep name.
You must enter both of these before collecting data.
7. Get out the white reference calibration panel. Handle the panel using only clean
gloves – never touch it with unprotected hands. Point the green fiber head so that
its entire 25 degree field of view contains only the white reference and does not
contain any shadows.
8. Hold the cosine corrector (red fiber head) vertical and directly overhead. Click
the “cal scan” button. It should turn red – this means that the next scan will be a
calibration scan.
9. While both fibers are pointed properly, click the “Acquire” button. It should turn
red while the system is scanning. Hold both fibers in place until the buttons turn
gray and a “scan successfully completed” message appears on the status bar.
10. Repeat the calibration scan several times. You will have to click both “cal scan”
and “begin scan” each time. There should be at least six calibration scans per
project, though they need not all be done at the beginning.
11. Change the rep name to the name of the target for easy identification later.
12. Continue to hold the red fiber overhead and vertical. Aim the green fiber at the
target. Click “begin scan” to collect a reflectance spectrum. Hold fibers in place
until the scan is complete.
13. At least six reflectance spectra should be collected per target. Use the graphs at
the top of the screen to make sure that data make sense. Click “Exit” when
finished.
5
POST PROCESSING
1.
2.
3.
4.
Start CDAP and click a daylight savings setting. Then click on “process data”.
Click on current.ini, select “99% Panel” and “OK”.
Find and select the directory to process and accept all of the default settings
The most important output file will be called reflectance.txt and can be opened
with Excel.