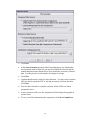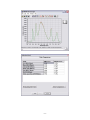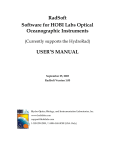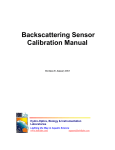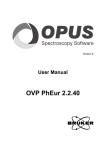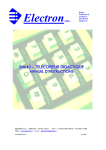
1
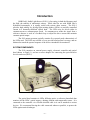
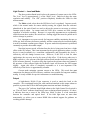
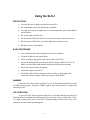
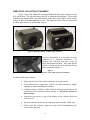
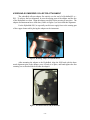
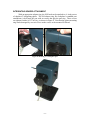
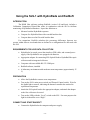
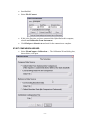
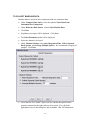
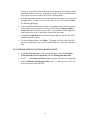
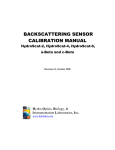
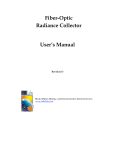
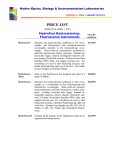
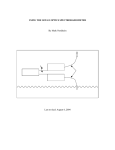
SLS-1
Stable Light Source
USER’S MANUAL
Revision A1
H
Hyyd
drroo--O
Op
pttiiccss,, B
Biioollooggyy &
& IIn
nssttrru
um
meen
nttaattiioon
n
L
a
b
o
r
a
t
o
r
i
e
s
Laboratories
Lighting the Way in Aquatic Science
www.hobilabs.com
[email protected]
Revisions
Initial release May 2005
Revision A, November 2007: Added Labsphere mounting description
Revision A1, December 2007: Corrected formatting
-2-
Table of Contents
INTRODUCTION............................................................................................................. 4
SYSTEM COMPONENTS ..................................................................................................... 4
CONTROLS AND CONNECTIONS ......................................................................................... 5
Power ..................................................................................................................................................... 5
Thermal Control ..................................................................................................................................... 5
Light Control .......................................................................................................................................... 6
Output..................................................................................................................................................... 6
REAR PANEL CONNECTIONS ............................................................................................. 7
USING THE SLS-1........................................................................................................... 8
PRECAUTIONS ................................................................................................................... 8
BASIC PROCEDURE ........................................................................................................... 8
WARMUP .......................................................................................................................... 8
LED OPERATION .......................................................................................................... 8
FIBER OPTIC COLLECTOR ATTACHMENT..................................................................... 9
HYDRORAD-E1 EMBEDDED COLLECTOR ATTACHMENT ........................................ 10
INTEGRATING SPHERE ATTACHMENT ............................................................................. 11
USING THE SLS-1 WITH HYDRORADS AND RADSOFT .................................... 12
INTRODUCTION ............................................................................................................... 12
REQUIREMENTS FOR LIVE DATA COLLECTION...................................................... 12
PREPARATION ................................................................................................................. 12
CONNECT AND START RADSOFT ................................................................................... 12
START COMPARISON WIZARD ........................................................................................ 13
TO COLLECT BASELINE DATA .......................................................................................... 14
TO COMPARE LIVE DATA WITH A BASELINE FILE .......................................................... 15
-3-
Introduction
HOBI Labs’ Stable Light Source (SLS-1) is for testing, in both the laboratory and
the field, the stability of radiometric sensors. While ideal for use with HOBI Labs’s
HydroRad instruments, it is equally useful with various other sensors. The SLS-1
provides high stability by driving light emitting diodes (LEDs) at carefully controlled
current in a thermally-stabilized optical head. The LEDs may be driven either in
constant-current or constant-power mode. In constant-power mode the signal from a
reference detector is used in a feedback loop to adjust the drive current and maintain
constant optical output.
The SLS output spectrum typically contains five spectral peaks characteristic of
the LEDs used. The LEDs are selected so as to provide broad spectral coverage, and are
balanced to match the spectral response of the devices intended to be monitored.
SYSTEM COMPONENTS
The SLS comprises an external power supply, electronic controller and optical
head (shown in Figure 1), and one or more adapters for connecting the optical head to
devices under test (DUTs).
Figure 1 SLS Controller and Optical Head
The optical head contains six LEDs, diffusing optics, a reference photodiode that
monitors all the LEDs’ optical output, a heating element, and temperature sensor. It is
connected to the controller via a flexible shielded cable so it can be attached to various
devices. We recommend leaving the cable connected whenever possible, to protect the
LEDs against static discharges.
-4-
The controller contains four independent channels of circuitry to drive the LEDs
and monitor their output. To allow independent monitoring and regulation of the four
channels, the LEDs are modulated at different frequencies from 2 to 16 kHz, and
synchronous detection circuits tuned to the different frequencies extract their signals from
the composite reference detector output.
Adapters are used to attach the optical head to different devices under test. There
are two types of adapters for HydroRads: one for collectors mounted on fiber optic cables
(show in Figure 4), and one for collectors embedded in the HydroRad (Figure 6). When
properly used, these adapters provide very repeatable positioning of the light collectors
with respect to the optical head.
CONTROLS AND CONNECTIONS
Figure 2 SLS Front Panel
Power
The circular DIN-5 connector on the left of the front panel accepts power from the
external power supply. Use only the power supply that was provided with the SLS.
Other power supplies with DIN-5 connectors may not be compatible.
Do not use the main power switch to turn the LEDs on and off for short periods,
since the unit must stabilize each time it is turned on. To turn the LEDs on and off while
maintaining stability, use the Light Control / Level switch.
Thermal Control
The toggle switch turns on or off the feedback-regulated heater in the optical
head. The yellow light indicates when heat is being applied to the head. Note that it
normally dims when the head reaches its stable temperature. The green “Stable” light
indicates that the optical head is at its target operating temperature and the unit is ready
for use. It typically takes 5 to 10 minutes for the head to warm up to this temperature
from a room temperature of 20 to 25C.
The LEDs can operate safely without the thermal control turned on, but maximum
stability is ensured only when the thermal control is on and stable.
-5-
Light Control — Level and Mode
The three-position Level switch selects the amount of current sent to the LEDs.
The “Low” level is approximately ¼ of the “High” level. Both levels have the same
regulation and stability. The “Off” position completely disables the LEDs for dark
measurements.
The Mode switch selects how the LED drive level is regulated. In power mode,
which is the normal mode for sensor stability testing, the signals from the reference
photodiode in the optical head are used to adjust the current as necessary to achieve
constant optical output. In current mode the LED drive currents are held constant
regardless of reference readings. Because it is especially important not to accidentally
switch between these modes, the switch has a locking toggle that must be pulled out in
order to change its position.
It is important to use power mode for long-term stability monitoring because as
LEDs age, their efficiency decreases gradually, and the current must be increased slightly
in order to maintain constant power output. In power mode this adjustment is performed
constantly to provide ultra-stable output.
Note that in power mode, reflection from the device being tested can have a slight
effect on the SLS output. This is not important for the typical application where a certain
device is tested repeatedly in a consistent configuration, and presumably the device’s
reflectivity will not change between tests. However, if the SLS is used for other
applications, the user may need to be aware of this effect. If the device under test is
highly reflective, a few percent of the light reflected back into the head will be picked up
by the reference detector. In order to keep the signal on the reference detector constant n
the presence of this reflected light, the feedback circuit will decrease the LED output
slightly. Again, this effect is completely repeatable so it is not important if the
reflectivity of the device is approximately constant.
Current mode maintains constant current to the LEDs. This mode does not
compensate for changes in LED efficiency, and thus is not suitable for long-term stability
testing. It is only suitable for special circumstances or troubleshooting.
Output
A high-density D-Sub 15-pin connector is used to attach the head to the
controller. We recommend leaving the cable and head attached to this output whenever
possible, to protect the LEDs in the head against transients and static discharges.
The green “On” indicator should light whenever the Light Control Level switch is
on. The red “Fault” indicator should never come on during normal operation. If it does,
it indicates that one or more of the LEDs have failed, or there is a bad connection
between the controller and optical head. If the fault light turns on more than
momentarily, we advise you to contact HOBI Labs technical support for guidance on
avoiding possible damage.
-6-
REAR PANEL CONNECTIONS
Figure 3 SLS Rear Panel
The connections on the rear panel are not needed for routine use, but can be used
to monitor the operation of the SLS itself. The Reference outputs produce DC voltages
that indicate the measured optical output of each of the four channels. In constant-power
mode these outputs should remain constant. The driver (labeled “current” in later units)
outputs indicate the current being sent to each channel, and should remain constant in
constant-current mode.
The left-most jacks carry the set-point voltage and actual voltage for the
temperature sensor. When the green “Stable” light on the front panel is on, these should
be within 10 millivolts of each other.
The reference, driver and temperature outputs of each SLS unit are measured at
HOBI Labs before shipment for purposes of monitoring the SLS’s long-term stability.
-7-
Using the SLS-1
PRECAUTIONS
•
Use only the power supply provided with your SLS.
•
Do not detach the optical head from the controller.
•
Use only your fingers to tighten the screws that attach the optic head, adapters
and collectors.
•
Do not open the controller box.
•
Do not run the LEDs more than is necessary to perform your measurements.
•
Do not run the LEDs if the red “Fault” light turns on when you do.
•
Keep the system clean and dry.
BASIC PROCEDURE
•
Turn on the thermal control and allow time for it to stabilize
•
Clean the window of the optical head
•
Select an adapter appropriate to the device under test (DUT)
•
Ensure the mating surfaces of the optical head, adapter and DUT are free of
debris or defects that could interfere with their mechanical positioning
•
Attach the optical head to the adapter
•
Attach the adapter to the DUT
•
Check the Light Control settings to make sure they are appropriate and
consistent with the settings used for previously collected data.
WARMUP
It takes at least a few minutes, typically 5 to 10, for the thermal controller to reach
its stable operating point. The green “Stable” light is your assurance that it is warmed up
and ready for use.
LED OPERATION
To give the LEDs their maximum stable life you should ordinarily turn them on
after the thermal controller has stabilized and you are nearly ready to collect data. There
is a slight warmup effect due to the LEDs’ internal heating, but this takes only a few
seconds to reach its stable operating point.
-8-
FIBER OPTIC COLLECTOR ATTACHMENT
Figure 4 shows the adapter for mounting HOBI Labs fiber optic collectors to the
SLS optical head. The left panel shows the side to which the head attaches. Three metal
alignment pins ensure stable, repeatable mating of the head to the adapter, which is then
secured in place with hand-tightened screws. The right panel shows the side into which
the fiber optic collector is inserted and secured.
Figure 4 Mounting Adapter for Fiber Optic Collectors
For best repeatability it is important to insert
collectors in a consistent orientation.
To
facilitate this, collectors may have a pair of
white dots marked on them. These dots should
always be facing up, that is, toward the flat top
plate, as shown in Figure 5.
Figure 5
Figure 5 Fiber Optic Collector Orientation
To attach a fiber optic collector:
•
Ensure the surfaces of the collector body are clean and smooth.
•
If the collector has a copper face, remove any dark corrosion by lightly
sanding it (without scratching the window).
•
Clean the window or diffuser of the collector with isopropyl alcohol or an
alcohol-based lens-cleaning solution, and dry it. Do not use acetone or
other solvents.
•
Loosen the four screws on top of the adapter so the collector body can
slide freely in.
•
Insert the collector, in the correct orientation, until it reaches a hard stop.
•
Firmly press the collector against the stop while hand-tightening the
screws on the flat plate.
-9-
HYDRORAD-E1 EMBEDDED COLLECTOR ATTACHMENT
The embedded collector adapter fits entirely over the end of a HydroRad-E1 or –
ES1. To achieve the best alignment, be sure the mating parts of the adapter and the face
of the HydroRad are clean. Align the adapter carefully before pressing it into place. The
adapter and instrument have white dots (visible in Figure 6) to assist with this alignment.
For the HydroRad-ES1, be especially careful not to apply force to the rotating part
of the copper shutter while placing the adapter on the instrument.
Figure 6 Mounting Adapter for HydroRad-ES1
After mounting the adapter to the HydroRad, align the SLS head with the three
metal alignment pins on the adapter, press it firmly in to place, and hand-tighten the four
retaining screws that hold the head onto the adapter.
Figure 7 SLS head mounted on HydroRad-ES1
- 10 -
INTEGRATING SPHERE ATTACHMENT
With an appropriate adapter ring, the SLS head can be attached to a 1-inch port on
a Labsphere™ integrating sphere. The SLS adapter ring, like Labsphere’s standard port
attachments, is held onto the port with set screws that grip the port ring. These screws
are tightened with a 0.035” hex key, as shown in Figure 8. Note that the sphere mounting
ring can be damaged by excessive force on the screws or the mounted SLS head.
Figure 8 Mounting on a Labsphere port
- 11 -
Using the SLS-1 with HydroRads and RadSoft
INTRODUCTION
The HOBI Labs software package RadSoft (version 1.08 and later), includes a
Calibration Comparison Wizard that works in conjunction with the SLS to facilitate
monitoring of HydroRad calibrations. It provides functions to
•
Measure baseline HydroRad responses
•
Compare live HydroRad data with recorded baseline data
•
Compare data saved in files with baseline data.
For comparison, RadSoft calculates the percentage differences between two
spectra within discrete wavebands that are defined in a configuration file delivered with
the SLS.
REQUIREMENTS FOR LIVE DATA COLLECTION
•
HydroRad to be tested, power/data interface (PDI) cable, and external power
supply if the HydroRad is not equipped with batteries.
•
Appropriate adapter for connecting SLS Optical Head to HydroRad fiber optic
collectors and/or integrated collectors
•
Computer with an available RS-232 COM port
•
RadSoft software, installed
•
A laboratory environment with moderate room temperature (approximately 25
C)
PREPARATION
•
Allow the HydroRad to assume room temperature.
•
Turn on the SLS’s main power switch, and Thermal Control switch. Wait for
the Stable light to turn on, indicating the thermal controller has reached its
equilibrium temperature.
•
Attach the SLS optical head to the appropriate adapter, and attach the adapter
to the first collector to be tested.
•
Turn on the LEDs with the “Level” switch on the SLS. For most purposes the
light level should be set to “High”.
CONNECT AND START RADSOFT
•
Connect the HydroRad to the computer and power supply.
- 12 -
•
Start RadSoft
•
Select File Connect
•
If this is the first time you have connected this HydroRad to this computer,
select Load Calibration From Instrument.
•
Click Find port & baud rate and wait for the connection to complete.
START COMPARISON WIZARD
•
Select File Compare Calibrations…. The Calibration Wizard dialog box,
shown below, will open.
- 13 -
TO COLLECT BASELINE DATA
Baseline data are saved for later comparison with new instrument data.
•
Under Compare Data Source, select the option Collect Data From
Instrument For Comparison
•
Under Reference Data Source, select Collect Baseline Data
•
Click Next.
•
Explanatory messages will be displayed. Click Next.
•
The Select Parameters panel will be displayed.
•
Select the channel to be tested.
•
Under Channel Settings, select Auto Integration Time, Collect Separate
Dark Spectra, and Average Multiple Spectra. We recommend averaging 10
samples. Click Next.
•
Check that the SLS “Stable” light is still on, and that the optical head is
properly connected to the light collector to be tested. If so, check the
appropriate boxes in the dialog box and click Next. This will initiate data
- 14 -
collection. Note that the data collection time depends on the sensitivity of the
HydroRad channel under test. Instruments set up for direct solar illumination
may require several seconds for each of the 10 integrations.
•
After the integrations have been selected, RadSoft will instruct you to turn off
the light source. Set the “Level” switch on the SLS to “Off” and click OK to
the following prompt(s).
•
Wait for the data collection to complete. Depending on the relative positions
of the windows on your screen, you may need to click the Bring Graph to
Front button in the wizard to see the data. To switch between the light and
dark integrations, click on the slider control below the graph.
•
Click Save Graph Data in the Wizard window, and save the data file in the
standard Windows manner.
•
To collect additional data, click Back. The graph will close, and if you did
not save the data above, you will be asked whether you wish to save the data
first.
TO COMPARE LIVE DATA WITH A BASELINE FILE
•
In the File Selection panel of the Wizard dialog box, select Collect Data
From Instrument For Comparison and Use Existing Baseline Data.
•
Click “…” under Reference Data Source to select a data file for comparison.
•
Under Calibration Configuration File, click “…” and select the “.SLS” file
that was included with your SLS.
- 15 -
•
Click Next.
•
In the Select Parameters panel of the Wizard dialog box, the channel that
was measured in the baseline file you specified should be selected, and the
manual integration time should also be set to match the previously collected
data. You may need to set the number of samples to average.
•
Click Next.
•
Confirm that the setup is ready for data collection. You may need to turn the
LED Level back up on the SLS, if you had previously collected dark data.
Click Next.
•
Wait for data collection to complete, and turn off the LED Level when
prompted to do so.
•
At the conclusion of the test, the comparison will be displayed in graphical
and text form.
•
To save a text file summarizing the comparison, click Save Comparison
- 16 -
- 17 -