1
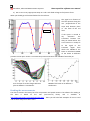
Data acqusition software user manual Particulars, Advanced Measurement Systems 3.) Run a scan in very appropriate steps in x and z with fixed voltage to find precise focus. What you should get is illustrated below for the red laser. x-axis The signal as a function of the laser position along the axis perpendicular to the strips with detector place in the focus of the red laser. If the optics is moved in any directions the transitions become less sharp as shown below. The error function is usually fit to the signal in the transition region from which the FWHM of the beam is calculated. FWHM of the beam at different positions of the optics shows a nice Gaussian profile of the beam with FWHM of around 6 m. Error function fit to the charge collection plots at different z coordinates FWHM of the beam at at different z coordinates Reading the measurements The data is stored in the binary form for compactness and speed reasons. The software for reading in the data is based on the root (root.cern.ch) library and is available in http://www.particulars.si/TCTAnalyse/index.html . There you will also find examples of how to read and do some analysis on taken scans. Version 1.2, September 2014 Page 12