1
Chart Review
User Manual
Version 1.0
Oct 2014
Department of Veterans Affairs (VA)
VINCI
Document Revision History
Revision History
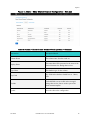
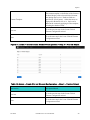
Table 1. Documentation revision history
Date
Revision
Description
10/20/2014
1.0
•
Initial version
Author
•
Brad Adams
REF: This is an initial version of the user manual
Oct 2014
Chart Review 1.0 User Manual
ii
Contents User Manual ............................................................................................................................................. i Figures ................................................................................................................................................................. v Tables ............................................................................................................................................................... viii What is Chart Review? .................................................................................................................................. xi How to Use this Manual ............................................................................................................................... xii Intended Audience ........................................................................................................................................ xii Legal Requirements ..................................................................................................................................... xii Disclaimers ...................................................................................................................................................... xii Documentation Conventions .................................................................................................................... xiii Assumptions .................................................................................................................................................. xiii References / Online Demo ........................................................................................................................ xiii 1 Introduction .................................................................................................................................... 1 1.1 System Architecture Must-‐Knows .................................................................................................. 1 1.2 System Integration Must-‐Knows ..................................................................................................... 2 1.3 The Chart Review Home Page .......................................................................................................... 3 1.4 Setting up your Browser for Chart Review .................................................................................. 6 1.4.1 General Setup ..................................................................................................................................................... 6 1.4.2 Single Sign On (SSO) Setup ........................................................................................................................... 6 2 Admin ................................................................................................................................................ 7 2.1 Overview ................................................................................................................................................. 7 2.2 Project Clinical Element Configurations (User/Admin) .......................................................... 8 2.3 Projects (User/Admin) ..................................................................................................................... 22 2.4 Reports (User/Admin) ..................................................................................................................... 36 2.5 Schemas (User/Admin) .................................................................................................................... 49 2.6 Failed Jobs (Admin only) ................................................................................................................. 61 2.7 Process Templates (Admin only) .................................................................................................. 62 2.8 Tools and Utilities (Admin only) ................................................................................................... 63 2.9 Users (Admin only) ............................................................................................................................ 65 2.10 About (Admin only) ........................................................................................................................ 69 2.11 Log Level (Admin only) .................................................................................................................. 71 2.12 Performance Monitoring (Admin only) ................................................................................... 72 3 Chart Review ................................................................................................................................. 75 3.1 Overview ............................................................................................................................................... 75 3.2 Quick-‐Start ............................................................................................................................................ 76 3.3 Initiating a Chart Review ................................................................................................................. 76 3.4 Layout Options .................................................................................................................................... 78 3.4.1 Two Column Mode ........................................................................................................................................ 78 3.4.2 Variable Height Views ................................................................................................................................. 80 3.4.3 View Detail Docking/Hiding Options .................................................................................................... 81 3.4.4 Optional Column Inclusion ........................................................................................................................ 82 3.4.5 List Sorting ....................................................................................................................................................... 84 3.4.6 List Grouping ................................................................................................................................................... 84 3.4.7 Variable Column Order and Size ............................................................................................................. 86 3.4.8 Collapsible Views ........................................................................................................................................... 87 3.4.9 Delete View ....................................................................................................................................................... 88 Oct 2014
Chart Review 1.0 User Manual
iii
Contents
3.4.10 Add View ......................................................................................................................................................... 89 3.4.11 Multiple Instances of the Same View (comparison) and the Auto-‐select Toggle ............ 90 3.4.12 Closable Annotation Panel ...................................................................................................................... 91 3.5 Workflow Support .............................................................................................................................. 92 3.5.1 View In New Tab ............................................................................................................................................ 92 3.5.2 Marking Records As Done .......................................................................................................................... 94 3.5.3 Optional Text Wrapping ............................................................................................................................. 94 3.5.4 Description Hiding ........................................................................................................................................ 96 3.6 Annotation Workflow ....................................................................................................................... 97 3.7 Annotation Schema ............................................................................................................................ 98 3.8 Annotation of Clinical Element Text ............................................................................................ 99 3.9 Annotation of Whole Context Clinical Element (i.e. Note, Lab) ........................................ 101 3.10 Annotation of Principal Clinical Element (i.e. Patient) .................................................... 102 3.11 The Annotation List ...................................................................................................................... 103 3.12 Editing Annotation Attributes .................................................................................................. 105 Oct 2014
Chart Review 1.0 User Manual
iv
Figures and Tables
Figures
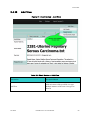
Figure 1: Chart Review Data Sources ........................................................................................................... 2 Figure 2: Chart Review Integrations ............................................................................................................. 3 Figure 3: Chart Review Home Page .............................................................................................................. 4 Figure 4. Admin – Project Clinical Element Configurations ........................................................................ 8 Figure 5. Admin – Show Clinical Element Configuration – General Configuration .................................. 10 Figure 6. Admin – Show Clinical Element Configuration – General Configuration – Edit ....................... 12 Figure 7. Admin – Show Clinical Element Configuration – Columns ....................................................... 14 Figure 8. Admin – Show Clinical Element Configuration – Content Template ......................................... 15 Figure 9. Admin – Create Clinical Element Configuration – Step 1 – Define Test Connection and Queries16 Figure 10. Admin – Create Clinical Element Configuration – Step 2 – Data Set Column Definition &
Other Metadata .................................................................................................................................. 18 Figure 11. Admin – Create Clinical Element Configuration – Step 3 – Preview Output ........................... 20 Figure 12. Admin – Create Clinical Element Configuration – Step 4 – Name and Description ................ 21 Figure 13. Admin – Project List .................................................................................................................. 22 Figure 14. Admin – Project – Show – General Configuration .................................................................... 23 Figure 15. Admin – Project – Show – Documents ...................................................................................... 25 Figure 16. Admin – Project – Show – Project Users .................................................................................. 26 Figure 17. Admin – Project – Show – Processes ........................................................................................ 27 Figure 18. Admin – Project – Edit – General Configuration ...................................................................... 28 Figure 19. Admin – Project – Edit - Project Users...................................................................................... 29 Figure 20. Admin – Project – Add Process – Step 1 – Choose the Process to Add .................................... 30 Figure 21. Admin – Project – Add Process – Step 2 – Process Parameters ................................................ 31 Figure 22. Admin – Project – Add Process – Step 3 – Users and Clinical Elements In This Process ........ 34 Figure 23. Admin – Project – Run SQL Query ........................................................................................... 35 Figure 24. Admin – Chose Project and Processes For Reports ................................................................... 36 Figure 25. Admin – Reports ........................................................................................................................ 37 Figure 26. Admin – Report – Annotations Per Annotator Detail................................................................ 38 Figure 27. Admin – Report – Annotations Per Annotator Detail – Clinical Element................................. 40 Figure 28. Admin – Report – How Many Annotations By Type ................................................................ 41 Figure 29. Admin – Report – How Many Annotations By Annotator And Type ....................................... 42 Figure 30. Admin – Report – Patients Per Annotator and Process ............................................................. 43 Oct 2014
Chart Review 1.0 User Manual
v
Figures and Tables
Figure 31. Admin – Report – Patients Per Annotator And Process DETAIL ............................................. 44 Figure 32. Admin – Report – Patients Reviewed More Than Once ........................................................... 46 Figure 33. Admin – Report – Inter-Annotator Agreement – Original Report ............................................ 47 Figure 34. Admin – Report – Inter-Annotator Agreement – New Report .................................................. 48 Figure 35. Admin – Schema List ................................................................................................................ 49 Figure 36. Admin – Schema – General Configuration................................................................................ 51 Figure 37. Admin – Schema – Attributes .................................................................................................... 52 Figure 38. Admin – Schema – Attribute – Create/Edit ............................................................................... 53 Figure 39. Admin – Schema – Attribute – Create/Edit - Numeric .............................................................. 54 Figure 40. Admin – Schema – Attribute – Create/Edit - Date .................................................................... 55 Figure 41. Admin – Schema – Attribute – Create/Edit - Option................................................................. 56 Figure 42. Admin – Schema – Attribute – Create/Edit - Option - Create/Edit Option........................... 57 Figure 43. Admin – Schema – Classifications ............................................................................................ 58 Figure 44. Admin – Schema – Classification – Create/Edit – General Configuration ............................... 59 Figure 45. Admin – Schema – Classification – Create/Edit – Attributes ................................................... 60 Figure 46. Admin – Failed Jobs .................................................................................................................. 61 Figure 47. Admin – Process Templates ...................................................................................................... 62 Figure 48. Admin - Tools and Utilities ....................................................................................................... 63 Figure 49. Admin - Tools and Utilities – API Docs.................................................................................... 64 Figure 50. Admin - Users ............................................................................................................................ 65 Figure 51. Admin – Show User ................................................................................................................... 66 Figure 52. Admin – Edit User ..................................................................................................................... 67 Figure 53. Admin - About ........................................................................................................................... 69 Figure 54. Admin - About – API Docs ....................................................................................................... 70 Figure 55. Admin - Log Level .................................................................................................................... 71 Figure 56. Admin – Performance Monitoring – Top .................................................................................. 72 Figure 57. Admin – Performance Monitoring - Bottom ............................................................................. 73 Figure 58. Chart Review ............................................................................................................................. 75 Figure 59. Chart Review – Initiating a Chart Review ................................................................................. 77 Figure 60. Chart Review – Two Column Mode .......................................................................................... 79 Figure 61. Chart Review – Single Column Mode ....................................................................................... 79 Figure 62. Chart Review – Variable Height Views .................................................................................... 81 Figure 63. Chart Review – View Detail Docking/Hiding Options ............................................................. 82 Figure 64. Chart Review – Optional Column Inclusion.............................................................................. 83 Figure 65. Chart Review – List Sorting ...................................................................................................... 84 Oct 2014
Chart Review 1.0 User Manual
vi
Figures and Tables
Figure 66. Chart Review – List Grouping ................................................................................................... 85 Figure 67. Chart Review – Variable Column Order and Size ..................................................................... 86 Figure 68. Chart Review – Collapsible Views ............................................................................................ 87 Figure 69. Chart Review – Delete View ..................................................................................................... 88 Figure 70. Chart Review – Add View ......................................................................................................... 89 Figure 71. Chart Review – Multiple Instances of the Same View (Comparison) ....................................... 90 Figure 72. Chart Review – Auto-select Toggle........................................................................................... 91 Figure 73. Chart Review – Closable Annotation Panel .............................................................................. 92 Figure 74. Chart Review – View in New Tab ............................................................................................. 93 Figure 75. Chart Review – Marking Records As Done .............................................................................. 94 Figure 76. Chart Review – Optional Text Wrapping .................................................................................. 95 Figure 77. Chart Review – Description Hiding........................................................................................... 96 Figure 78. Chart Review – Task Panel and Toolbar ................................................................................... 97 Figure 79. Chart Review – Annotation Schema .......................................................................................... 99 Figure 80. Chart Review – Annotation of Clinical Element Text ............................................................. 100 Figure 81. Chart Review – Annotation of Whole Clinical Element ......................................................... 101 Figure 82. Chart Review – Annotation of Principal Clinical Element...................................................... 102 Figure 83. Chart Review – Annotation List .............................................................................................. 104 Figure 84. Chart Review – Editing Annotation Attributes........................................................................ 106 Oct 2014
Chart Review 1.0 User Manual
vii
Figures and Tables
Tables
Table 1. Documentation revision history ...................................................................................................... ii Table 2: Chart Review Main Toolbar ........................................................................................................... 4 Table 3: Admin – Project Clinical Element Configuration List.................................................................... 8 Table 4: Admin – Show Clinical Element Configuration – General Configuration ................................... 10 Table 5: Admin – Show Clinical Element Configuration – General Configuration - Edit ......................... 12 Table 6: Admin – Show Clinical Element Configuration – Columns......................................................... 14 Table 7: Admin – Show Clinical Element Configuration – Content Template .......................................... 15 Table 8: Admin – Create Clinical Element Configuration – Step 1 – Define Test Connection and Queries16 Table 9: Admin – Create Clinical Element Configuration – Step 2 – Data Set Column Definition & Other
Metadata ............................................................................................................................................ 18 Table 10: Admin – Create Clinical Element Configuration – Step 3 – Preview Output ............................ 20 Table 11: Admin – Create Clinical Element Configuration – Step 4 – Name and Description.................. 21 Table 12: Admin – Show Project – General Configuration ........................................................................ 22 Table 13: Admin – Project – Show – General Configuration ..................................................................... 23 Table 14: Admin – Project – Show – Documents ....................................................................................... 25 Table 15: Admin – Project – Show – Project Users .................................................................................... 26 Table 16: Admin – Project – Show – Project Users .................................................................................... 27 Table 17: Admin – Project – Edit – General Configuration ....................................................................... 28 Table 18: Admin – Project – Edit – Project Users ...................................................................................... 29 Table 19: Admin – Project – Add Process – Step 1 – Choose the Process to Add ..................................... 30 Table 20: Admin – Project – Add Process – Step 2 – Process Parameters ................................................. 32 Table 21: Admin – Project – Add Process – Step 3 – Users and Clinical Elements In This Process ......... 34 Table 22: Admin – Project – Run SQL Query ............................................................................................ 36 Table 23: Admin – Chose Project and Processes For Reports .................................................................... 36 Table 24: Admin – Reports ......................................................................................................................... 37 Table 25: Admin – Report – Annotations Per Annotator Detail ................................................................. 38 Table 26: Admin – Annotations Per Annotator Detail – Clinical Element ................................................. 40 Table 27: Admin – Report – How Many Annotations By Type ................................................................. 41 Table 28: Admin – Report – How Many Annotations By Annotator And Type ........................................ 42 Table 29: Admin – Report – Patients Per Annotator and Process .............................................................. 43 Table 30: Admin – Report – Patients Per Annotator and Process DETAIL ............................................... 45 Table 31: Admin – Report – Patients Reviewed More Than Once ............................................................. 46 Table 32: Admin – Report – Inter-Annotator Agreement – Original Report.............................................. 47 Oct 2014
Chart Review 1.0 User Manual
viii
Figures and Tables
Table 33: Admin – Report – Inter-Annotator Agreement – New Report ................................................... 48 Table 34: Admin – Schema List .................................................................................................................. 49 Table 35: Admin – Schema – General Configuration ................................................................................. 51 Table 36: Admin – Schema – Attributes ..................................................................................................... 52 Table 37: Admin – Schema – Attribute – Create/Edit ................................................................................ 53 Table 38: Admin – Schema – Attribute – Create/Edit - Numeric ............................................................... 54 Table 39: Admin – Schema – Attribute – Create/Edit - Date ..................................................................... 55 Table 40: Admin – Schema – Attribute – Create/Edit - Option .................................................................. 56 Table 41: Admin – Schema – Attribute – Create/Edit - Option .................................................................. 57 Table 42: Admin – Schema – Classifications ............................................................................................. 58 Table 43: Admin – Schema – Classification – Create/Edit – General Configuration................................. 59 Table 44: Admin – Schema – Classification – Create/Edit - Attributes ..................................................... 60 Table 45: Admin – Process Templates ........................................................................................................ 62 Table 46: Admin – Tools and Utilities ........................................................................................................ 63 Table 47: Admin – Tools and Utilities – API Docs .................................................................................... 64 Table 48: Admin – Users ............................................................................................................................ 65 Table 49: Admin – Show User .................................................................................................................... 66 Table 50: Admin – Show User .................................................................................................................... 68 Table 51: Admin – About............................................................................................................................ 69 Table 52: Admin – About – API Docs ........................................................................................................ 70 Table 53: Admin – Log Level ..................................................................................................................... 71 Table 54: Admin – Performance Monitoring .............................................................................................. 73 Table 55: Chart Review – Initiating a Chart Review .................................................................................. 77 Table 56: Chart Review – Two Column Mode ........................................................................................... 80 Table 57: Chart Review – Variable Height Views ...................................................................................... 81 Table 58: Chart Review – Variable Height Views ...................................................................................... 82 Table 59: Chart Review – Optional Column Inclusion ............................................................................... 83 Table 60: Chart Review – List Sorting........................................................................................................ 84 Table 61: Chart Review – List Grouping .................................................................................................... 85 Table 62: Chart Review – Variable Column Order and Size ...................................................................... 86 Table 63: Chart Review – Collapsible Views ............................................................................................. 87 Table 64: Chart Review – Delete Views ..................................................................................................... 88 Table 65: Chart Review – Add View .......................................................................................................... 89 Table 66: Chart Review – Closable Annotation Panel ................................................................................ 92 Table 67: Chart Review – View In New Tab .............................................................................................. 93 Oct 2014
Chart Review 1.0 User Manual
ix
Figures and Tables
Table 68: Chart Review – Marking records as Done .................................................................................. 94 Table 69: Chart Review – Optional Text Wrapping ................................................................................... 95 Table 70: Chart Review – Description Hiding ............................................................................................ 97 Table 71: Chart Review – Task Panel and Toolbar .................................................................................... 97 Table 72: Chart Review – Annotation Schema ........................................................................................... 99 Table 73: Chart Review – Annotation of Clinical Element Text .............................................................. 100 Table 74: Chart Review – Annotation of Clinical Element Text .............................................................. 101 Table 75: Chart Review – Annotation List ............................................................................................... 104 Table 76: Chart Review – Editing Annotation Attributes ......................................................................... 107 Oct 2014
Chart Review 1.0 User Manual
x
Orientation
What is Chart Review?
Chart Review is a manual, multi-level annotation tool. Its configurable medical record interface, allows
annotation at any level of the record (i.e. note part or whole, lab value part or whole, patient part or
whole, etc.) in a configurable, multi-annotator workflow. Annotating within the context of the whole
patient chart allows reviewers to follow a more natural clinical process of finding and aggregating patient
information, while still supporting powerful annotation capabilities.
Chart Review displays all aspects of a medical record, from any database environment. Though Chart
Review was built to specifically allow its use in the VINCI research environment (taking into account the
VINCI project database configuration and policies), it can be used in any database environment where
medical records may be kept. Access to the data layer is configurable in the UI, allowing the tool to
access any database environment, with any database schema definition.
The tool also allows configuration of annotation workflow processes which make annotation tasks
available to multiple annotators using the application simultaneously. Annotations are saved and
viewable in downstream tasks and processes, whether inside or outside of the system. This tool can share
inputs and outputs with other NLP processes and annotation tools through standard definitions and
standard access of clinical elements (i.e. documents, records) and annotations. In addition, annotation
statistics are provided for workflow analysis.
Chart Review provides features such as:
•
Definition of clinical elements (notes, labs, radiology, problems, meds, etc.)
•
Definition of available process types (single step, multi-step, graph, etc.)
•
Definition of projects (users, workflow processes, tasks, views, cohorts, and mapping to the data
source, etc.)
•
Reports (workflow process, annotation activity, etc.)
•
User definition
•
Project workflow maintenance and trouble shooting tools and utilities
•
System performance monitoring
•
System help
The features of Chart Review listed above may only be accessible to users with certain roles and
privileges. A typical annotator, for example, may not have access to the project definition features that
are available to a project coordinator.
Chart Review is a public domain software package that is developed and maintained by the Department of
Veterans Affairs. It is widely used in the VA VINCI research environment as well as in university
settings. It may be used in commercial settings in the future.
Oct 2014
Chart Review 1.0 User Manual
xi
Orientation
How to Use this Manual
The Chart Review User Manual is designed to provide you, the Chart Review user, with screen-by-screen
"how to" information on the usage of Chart Review.
This manual is divided into two main sections: Chart Review System and Project Administration, and
Reviewing a Chart. The manual will provide explanations of each screen and of all user interface options
within the context of an easy to understand demonstration data scenario.
NOTE: This document is available in Microsoft Word (.doc), Adobe Acrobat Portable
Document Format (PDF), and Hypertext Markup Language (HTML) format as onlinehelp.
Intended Audience
This manual will distinguish features that are available to project administrators from those available to
other project users (i.e. annotators).
Legal Requirements
There are no special legal requirements involved in the use of Chart Review.
Disclaimers
This manual provides an overall explanation of Chart Review and the functionality contained in Chart
Review 1.0; however, no attempt is made to explain how the reader may access the VINCI environment
or procure and view data within that environment. We suggest contacting VINCI management directly
from the VA network at vaww.vinci.med.va.gov.
DISCLAIMER: The appearance of external hyperlink references in this manual does not
constitute endorsement by the Department of Veterans Affairs (VA) of this Website or
the information, products, or services contained therein. The VA does not exercise any
editorial control over the information you may find at these locations. Such links are
provided and are consistent with the stated purpose of the VA.
Oct 2014
Chart Review 1.0 User Manual
xii
Orientation
Documentation Conventions
This manual uses several methods to highlight different aspects of the material:
•
Various symbols are used throughout the documentation to alert the reader to special information.
Table gives a description of each of these symbols:
Table 1. Documentation symbol descriptions
Symbol
Description
NOTE/REF: Used to inform the reader of general information including
references to additional reading material.
CAUTION/RECOMMENDATION/DISCLAIMER: Used to caution the reader to
take special notice of critical information.
Assumptions
This manual is written with the assumption that the reader is familiar with the following:
•
SQL – there will be many references to SQL code in setting up a project’s mapping to a data
source.
References / Online Demo
Readers who wish to learn more about Chart Review should consult the following documents:
•
Chart Review Release Notes (TBD)
•
Chart Review Installation Guide (TBD)
•
Chart Review Technical Manual (TBD)
•
Chart Review User Manual (this manual; PDF and HTML format)
•
Chart Review Developer’s Guide (TBD)
ONLINE DEMO: A demo of Chart Review and its online help is available on the VA intranet
at: http://vhacdwweb03:8080/chart-review/ Using a Fire Fox (ver > 30) browser, open Chart
Review and, after logging in as admin/admin (project administrator features) or project1/project1
(annotator features), access the help link at the top of the page.
Oct 2014
Chart Review 1.0 User Manual
xiii
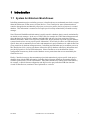
1 Introduction
1.1 System Architecture Must-Knows
In defining annotation project workflow processes, it benefits the user to understand some basic concepts
about the architecture of data sources in Chart Review. First, Chart Review stores information that is
central to the application and shared by all projects, such as user profiles, the list of projects in a central
database. This information is assumed to not require special security maintained by an outside security
manager.
Next, Electronic Health Record information is usually stored in a database that is securely maintained by
an outside security manager. In the case of VINCI data, for example, the VINCI data management team
places the data in project specific databases and individual end users are given permissions to those
databases and tables. When a user logs into Chart Review, his permissions are passed on to the database
system when he tries to access project specific information. He will only be able to see EHR and project
specific data, such as annotation process tasks and annotations in project databases for which he has been
given permission by the data management team. In defining and annotation project workflow process in
the Chart Review tool, a project coordinator will need to specify database connectivity information and
provide SQL queries to access EHR information. Please note that errors in the definition of these
configuration elements may be the result of database access permissions that are not controlled by the
Chart Review tool.
Finally, Chart Review stores other annotation project information that is project specific in the project
database along with the EHR information, including clinical element definitions, annotation schemas,
workflow process tasks, as well as annotations. These data elements may contain secure information if,
for example, a clinical element configuration (the SQL used to query/transform EHR data into data
viewed in Chart Review) contained a list of patient ids as a criteria.
Oct 2014
Chart Review 1.0 User Manual
1
Introduction
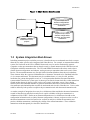
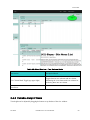
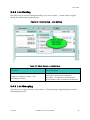
Figure 1: Chart Review Data Sources
ChartReview
Project1: EHR, clinical
element configurations,
schemas, process tasks,
annotations
Project2: EHR, clinical
element configurations,
schemas, process tasks,
annotations
ChartReview: users,
projects
1.2 System Integration Must-Knows
In defining annotation project workflow processes, it benefits the user to understand some basic concepts
about the way other systems can be integrated with Chart Review. For example, an automated annotation
system, like one based on the LEO or SIMON frameworks, may be used to automatically generate
symptoms or other pre-annotations that can then be seen by a manual annotator in the Chart Review tool
to help them with their annotation tasks. The LEO and SIMON frameworks allow these tools to share
clinical element configurations and schemas, and to generate pre-annotations that can be seen in Chart
Review. The automated annotator may first pull clinical element definitions from the project database.
These elements allow the system to understand what a “document” that needs to be annotated looks like
(i.e. its content and format). This document may be a traditional note, or it may be a lab, problem,
medication list, patient demographic record, etc. It is important that both the automated annotation
system and the Chart Review system agree on what a given clinical element looks like so that annotations
created on that element by the one system can be seen correctly in the other system. Next, sharing
schemas allows the automated annotator to generate annotations that relate to classifications and have
class attributes and relationships that may then be understood and viewed in Chart Review. Process tasks
could be utilized by both systems to sequence the pre-annotation task with the manual annotation task.
As another example of integration, there may be a validation tool that would take the manual annotations
created in Chart Review and allow an analyst to do a quick validation of the given annotation in a
validation tool like CHEX. Similar to an automated annotation tool, a validation tool would use the
configuration information such as clinical element configurations, schemas, and process tasks as well as
the manual annotations created in Chart Review to allow an analyst to validate the annotations and
produce validation annotations, confirming the validity of the manual annotations. These validation
annotations could subsequently be viewed in Chart Review.
Oct 2014
Chart Review 1.0 User Manual
2
Introduction
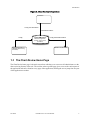
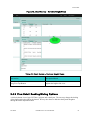
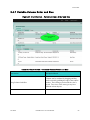
Figure 2: Chart Review Integrations
ChartReview
Config, Pre-annotations
Manual Annotations
Config
Pre-annotations
Project1: EHR, clinical
element configurations,
schemas, process tasks,
annotations
Config, Manual Annotations
Validation Annotations
Automated Annotator (i.e.
UIMA NLP Pipeline using
LEO/Siman)
Validation Tool (like CHEX)
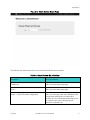
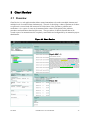
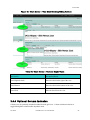
1.3 The Chart Review Home Page
The Chart Review home page is the main screen from which any user can access all admin features or the
chart reviewing features of the tool. The tool bar at the top of the page gives access to the various parts of
the application and can be found on every page of the application, allowing the user to jump from one part
of the application to another.
Oct 2014
Chart Review 1.0 User Manual
3
Introduction
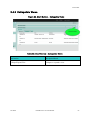
Figure 3: Chart Review Home Page
This table lists the features that can be access from the main Chart Review toolbar:
Table 2: Chart Review Main Toolbar
Item/Action
Description/Result
ChartReview
Takes you to this home page again.
Home
Takes you to this home page again.
Admin -> Clinical Element Configurations
Takes you to the pages that allow definition of the
various chart information views that will be
available to view and annotate during chart review,
for example, labs, notes, radiology reports,
problems, medications, etc.
Oct 2014
Chart Review 1.0 User Manual
4
Introduction
Admin -> Projects
Takes you to the pages that allow definition of a
project, its processes, tasks, and database
mappings, etc.
Admin -> Reports
Takes you to the pages that allow perusal of
analytical reports about various aspects of the
projects, including task completion, annotations
made, inter-annotator agreement, etc.
Admin -> Schemas
Takes you to the pages that allow definition of
classifications, class attributes, and class
relationships that will be available to annotate the
chart with for a each annotation workflow process
task.
Admin -> Failed Jobs
Takes you to a list of failed workflow processes.
Note that different annotators may be
participating in different annotation workflows
simultaneously.
Admin -> Processes
Takes you to the pages that allow upload and
definition of process pre-defined process templates
that may be used in creating process instances for a
given project.
Admin -> Tools and Utilities
Takes you to the pages that provide tools and
utilities to, for example, kill processes, or view API
documentation.
Admin -> Users
Takes you to the pages that allow user definition
and maintenance.
Admin -> About
Takes you to the pages that show information about
the application, its version, structure, dependencies,
and components.
Admin -> Log Level
Takes you to the pages that allow control over the
various levels of system logging available.
Admin – Performance Monitoring
Takes you to the pages that show performance
monitoring analytics about the Chart Review
system itself.
Oct 2014
Chart Review 1.0 User Manual
5
Introduction
Help
Takes you to the help pages.
Settings
Takes you to the pages that allow system settings,
for example, changing the current user’s password.
Logout (username)
Logs you out and takes you to the login screen.
Switch User
Takes you to the pages that allow switching
between users without changing your database
connection permissions.
1.4 Setting up your Browser for Chart Review
Chart Review us available on the Firefox browser only, version 30+.
1.4.1 General Setup
Access to the server may take several seconds, or more, depending upon the underlying database schema
and the queries defined in the project processes. Because of this, the browser java script timeout default
needs to be set to infinity, to not timeout the scripts. This is done in the Firefox configuration screens by
setting max_script_run to zero.
1) In the address area of Firefox, type the following:
About:config
2) In the search area, type the following:
Max_script_run
Double click on the value of this variable, and set it to zero.
1.4.2 Single Sign On (SSO) Setup
See the User Guide for Single Sign On to setup single sign for the VINCI environment. Information in
that document contains VA confidential environment information, so it is not include in this document.
Oct 2014
Chart Review 1.0 User Manual
6
2 Admin
2.1 Overview
The Admin pages in Chart Review allow a project administrator to set an annotation project, including:
define clinical elements, annotation schemas, and annotation process templates and workflows. It also
provides system administration functions such as user management, failure reports, database utilities,
logging control and performance monitoring.
Oct 2014
Chart Review 1.0 User Manual
7
Inquire
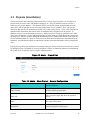
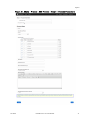
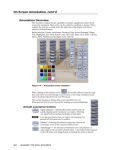
2.2 Project Clinical Element Configurations (User/Admin)
The Clinical Element Configuration item in the Admin drop down menu takes you to the pages that allow
definition of the various chart information views that will be available to view and annotate during chart
review, for example, labs, notes, radiology reports, problems, medications, etc. Chart Review gives
complete control to a project administrator over defining what the clinical elements are, what data they
contain, how they are mapped from a data source, and how they will be viewed during chart review.
While these configurations belong to a give project, a user that has permissions to multiple projects is
able to copy (not share) configurations between those projects, in the event that data sources and
configurations are similar between projects.
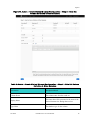
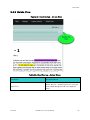
Figure 4. Admin – Project Clinical Element Configurations
Table 3: Admin – Project Clinical Element Configuration List
Item/Action
Description/Result
New Clinical Element Configuration
Creates a new clinical element configuration and
takes you to the clinical element configuration
editor.
Oct 2014
Chart Review 1.0 User Manual
8
Inquire
Project Clinical Element Configurations
This section contains all configurations that belong
to this project.
Change
Allows you to change which project’s clinical
element configurations are listed.
Name link
Sorts table by project clinical element configuration
name.
Name
The name of each clinical element configuration
owned by the specified project.
List item name
Shows the selected clinical element.
Description link
Sorts table by project clinical element configuration
name.
Description
A brief description of the clinical element
configuration.
Active link
Sorts table by project clinical element configuration
active status.
Active
Indicates if the user can choose this configuration
when defining a process. As configurations age,
they will be “turned off”.
Edit
Edits the specified configuration.
Delete
Deletes the specified configuration.
Copy
Copies the specified configuration.
Export
Exports the specified configuration to JSON in a
separate tab.
Clinical Element Configurations Available From
Other Projects
This section contains all configurations that belong
to projects that the user has access to.
Name
The name of each clinical element configuration
belonging to a project the user has access to.
Oct 2014
Chart Review 1.0 User Manual
9
Inquire
Description
A brief description of the clinical element
configuration.
Copy To Project
Copies the specified configuration into the current
project.
Export
Exports the specified configuration to a JSON in a
separate tab.
Upload New Clinical Element Configuration
Allows the user upload of a configuration specified
in a JSON file.
Browse
Find the file in the local browser’s file system.
Upload
Upload the configuration.
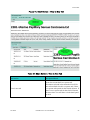
Figure 5. Admin – Show Clinical Element Configuration – General Configuration
Table 4: Admin – Show Clinical Element Configuration – General Configuration
Item/Action
Oct 2014
Description/Result
Chart Review 1.0 User Manual
10
Inquire
Name
Name of the configuration.
Description
Simple description of the configuration.
Active
Indicates if the user can choose this configuration
when defining a process. As configurations age,
they will be “turned off”.
Title Field
The database field that is the title of this
configuration.
Description Field
The database field that is the description of this
configuration.
Type
The type of this clinical element configuration.
Summary is one record per primary clinical
element (patient), list is multiple records per
principal clinical element (patient).
All Elements By Patient Id Query
Queries all context clinical elements by the
principal clinical element id (i.e the patient id). For
example, this query could return all elements of
this type that belong to a given patient (plus any
other desired criteria).
This SQL queries a project database.
Single Element Query
Queries a single clinical element of this type. The
goal of this query is to return a single record by
specifying any criteria in the where clause that are
needed to identify the record uniquely. The criteria
may include the relationship to the principal
clinical element (i.e. the patient), but does not have
to. The record id alone could be the only criteria,
in the most simple case.
This SQL queries a project database.
Created By
The user that created the configuration.
Created Date
The date that the configuration was created.
Oct 2014
Chart Review 1.0 User Manual
11
Inquire
Figure 6. Admin – Show Clinical Element Configuration – General Configuration –
Edit
Table 5: Admin – Show Clinical Element Configuration – General Configuration Edit
Item/Action
Description/Result
Name
Name of the configuration.
Description
Simple description of the configuration.
Type
LIST – The clinical element view shows a list of
clinical element items (like note documents), with a
detail section that is displayed when an item is
selected.
SUMMARY – The clinical element view shows
only a summary of the clinical element item(s) (like
Oct 2014
Chart Review 1.0 User Manual
12
Inquire
an overview of a patient’s demographic
information, or a graph of all labs through time).
Active
All Elements By Patient Id Query
Indicates if the user can choose this configuration
when defining a process. As configurations age,
they will be “turned off”.
Queries all context clinical elements by the
principal clinical element id (i.e the patient id). For
example, this query could return all elements of
this type that belong to a given patient (plus any
other desired criteria).
This SQL queries a project database.
Single Element Query
Queries a single clinical element of this type. The
goal of this query is to return a single record by
specifying any criteria in the where clause that are
needed to identify the record uniquely. The criteria
may include the relationship to the principal
clinical element (i.e. the patient), but does not have
to. The record id alone could be the only criteria,
in the most simple case.
This SQL queries a project database.
Title Field
The database field that is the title of this
configuration.
Description Field
The database field that is the description of this
configuration.
Created By
The user that created the configuration.
Created Date
The date that the configuration was created.
Update
Saves the edits to the configuration.
Oct 2014
Chart Review 1.0 User Manual
13
Inquire
Figure 7. Admin – Show Clinical Element Configuration – Columns
Table 6: Admin – Show Clinical Element Configuration – Columns
Item/Action
Description/Result
Column Name
The column name from the result set
Display Name
The name that will be presented as the name of the
clinical element view during chart review.
Type Name
The database type for the column.
Key Field
Key fields in the database should be true. Others,
false.
Exclude
Excluded fields are not visible in the item grid
during chart review, but are used as part of the
detail content template.
Update
Saves the edits to the configuration.
Oct 2014
Chart Review 1.0 User Manual
14
Inquire
Figure 8. Admin – Show Clinical Element Configuration – Content Template
Table 7: Admin – Show Clinical Element Configuration – Content Template
Item/Action
Description/Result
Content Template
The content template is a definition of the format of
the detail display of the selected clinical element
item during chart review. Database fields are
specified as ${field_name}. Other characters are
displayed in the detail view as-is. Style can be
added to the content by applying it to the template,
including the database fields.
Oct 2014
Chart Review 1.0 User Manual
15
Inquire
Figure 9. Admin – Create Clinical Element Configuration – Step 1 – Define Test
Connection and Queries
Table 8: Admin – Create Clinical Element Configuration – Step 1 – Define Test
Connection and Queries
Item/Action
Description/Result
Jdbc Driver
The jdbc driver that will be used to connect to the database.
Connection String
Standard jdbc database connection string (i.e.
Oct 2014
Chart Review 1.0 User Manual
16
Inquire
jdbc:mysql://localhost/chartreview?useUniode=yes&characterEncoding=UTF8)
Jdbc
Username/Password
Username and passw0rd to connect to the databse with. If using integrated
authentication, these can be left blank.
Queries all context clinical elements by the principal clinical element id (i.e
the patient id). For example, this query could return all elements of this type
that belong to a given patient (plus any other desired criteria).
NOTE: Query All Elements by Patient Id query can be any query, but must
follow these rules:
•
•
All Elements by Patient
Id Query
It must return the key columns that uniquely identify a row for this clinical
element.
The query must take one parameter, the principal clinical element id (i.e. the
patient id), and is signified with a question mark (?).
An example query might be:
select lab.lab_value, icd9.icd9_code, lab.lab_id
from lab, icd9_code, patient where lab.lab_icd9 =
icd9.icd9 and lab.patient_id = patient.patient_id and
patient.patiend_id = ?
In the above example, lab.lab_id uniquely identifies the lab row for this clinical
element.
Single Element Query
Queries a single clinical element of this type. The goal of this query is to
return a single record by specifying any criteria in the where clause that are
needed to identify the record uniquely. The criteria may include the
relationship to the principal clinical element (i.e. the patient), but does not
have to. The record id alone could be the only criteria, in the most simple
case.
NOTE: The columns and order MUST match that of the Query All
Elements by Patient Id above exactly.
Example Patient Id
An example patient id for querying the database to get table metadata.
Next
Go to the next step in the Create Clinical Element Configuration wizard.
Oct 2014
Chart Review 1.0 User Manual
17
Inquire
Figure 10. Admin – Create Clinical Element Configuration – Step 2 – Data Set
Column Definition & Other Metadata
Table 9: Admin – Create Clinical Element Configuration – Step 2 – Data Set Column
Definition & Other Metadata
Item/Action
Description/Result
Column Name
The column name from the result set
Display Name
The name that will be presented as the name of the
clinical element view during chart review.
Type Name
The database type for the column.
Oct 2014
Chart Review 1.0 User Manual
18
Inquire
Key Field
Key fields in the database should be true. Others,
false.
Exclude
Excluded fields are not visible in the item grid
during chart review, but are used as part of the
detail content template.
Title Field
The database field that is the title of this
configuration.
Description Field
The database field that is the description of this
configuration.
LIST – The clinical element view shows a list of
clinical element items (like note documents), with a
detail section that is displayed when an item is
selected.
Type
SUMMARY – The clinical element view shows
only a summary of the clinical element item(s) (like
an overview of a patient’s demographic
information, or a graph of all labs through time).
Yes if this configuration has a content template, No
otherwise.
Content Template Toggle
A LIST type configuration usually has a content
template that displays the detail of a clinical
element record in a formatted document way.
There may be cases where a LIST type
configuration may just be displayed in a list, with
no detailed, document view if a document view
does not add any information that would not be
seen in the columns of the clinical element grid in
Chart Review, and if annotation never needed to
occur on text within the detail. If there were no
content template provided, an entire clinical
element record could still be annotated as a whole
within Chart Review.
A SUMMARY type configuration must have a
content template. This template would display the
only view available of the clinical element, because
there will be no grid list of clinical element items
displayed during Chart Review for a SUMMARY
type clinical element configuration.
Oct 2014
Chart Review 1.0 User Manual
19
Inquire
Content Template
The content template is a definition of the format of
the detail display of the selected clinical element
item during chart review. Database fields are
specified as ${field_name}. Other characters are
displayed in the detail view as-is. Style can be
added to the content by applying it to the template,
including the database fields.
Previous
Go to the previous step in the Create Clinical
Element Configuration wizard.
Next
Go to the next step in the Create Clinical Element
Configuration wizard.
Figure 11. Admin – Create Clinical Element Configuration – Step 3 – Preview Output
Table 10: Admin – Create Clinical Element Configuration – Step 3 – Preview Output
Item/Action
Description/Result
Previous
Go to the previous step in the Create Clinical
Element Configuration wizard.
Next
Go to the next step in the Create Clinical Element
Configuration wizard.
Oct 2014
Chart Review 1.0 User Manual
20
Inquire
Figure 12. Admin – Create Clinical Element Configuration – Step 4 – Name and
Description
Table 11: Admin – Create Clinical Element Configuration – Step 4 – Name and
Description
Item/Action
Description/Result
Name
Name of the configuration.
Description
Simple description of the configuration.
Active
Indicates if the user can choose this configuration
when defining a process. As configurations age,
they will be “turned off”.
Previous
Go to the previous step in the Create Clinical
Element Configuration wizard.
Next
Go to the next step in the Create Clinical Element
Configuration wizard.
Start Over
Clear out all data from the wizard and start over
defining the clinical element configuration.
Oct 2014
Chart Review 1.0 User Manual
21
Inquire
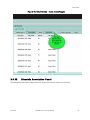
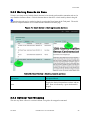
2.3 Projects (User/Admin)
The Projects item in the Admin drop down menu takes you to the pages that allow you to define your
projects, their processes, tasks, and database mappings, etc. First, an annotation project specifies a
connection to a project database. This database will be used to pull clinical element information, the
chart, notes, and records that are relevant to the planned chart review workflow. Next, a project has
documents that describe the annotation work that is to be done on the project. These may be included as
annotation task instructions that will be sent to an annotator that is assigned a task to perform. In
addition, a project is associated with system users. While a project is owned by a particular user, other
users can be assigned to a project with designated project roles which give them appropriate permissions
on that project. Finally, a project defines the annotation process workflows that need to occur to get the
work of annotation done on a project. These processes detail the tasks that need to be performed by the
annotators, and which tasks require pre-annotations and how generated annotations will be grouped and
used.
Project processes utilize pre-loaded process templates that give structure to the process and can be reused
by multiple projects. In addition to a process templates, a library of annotation schemas is maintained at
the system level, so that they may be reused in multiple projects.
Figure 13. Admin – Project List
Table 12: Admin – Show Project – General Configuration
Item/Action
Description/Result
Name Column
Sorts the table by project name.
Name link
Takes you to the pages that show the specified
project.
Name
The name of the project
Description
A short description of the project.
Oct 2014
Chart Review 1.0 User Manual
22
Inquire
View
Takes you to the pages show the specified project.
Edit
Takes you to the pages to edit the specified project.
Delete
Deletes the specified project.
Previous
Takes you to the previous page of projects.
Next
Takes you to the next page of projects.
Create Project
Creates a project and takes you to the pages to edit
that project.
Figure 14. Admin – Project – Show – General Configuration
Table 13: Admin – Project – Show – General Configuration
Item/Action
Description/Result
Project Name
The name of the project.
Description
A brief description of the project.
Database Connection
This is the jdbc connection string to the project database (i.e.
Oct 2014
Chart Review 1.0 User Manual
23
Inquire
URL
jdbc:mysql://localhost/chartreview?useUnicode=yes&characterEncoding=UTF8).
JDBC Driver
The jdbc driver used to connect to the project database (i.e.
com.mysql.jdbc.Driver).
JDBC Username
Username to log into the project database.
JDBC Password
Password to log into the project database.
Edit
Takes you to the pages to edit the specified project.
Run SQL Query
Takes you to the page that allows you to run an SQL query against the project
database.
Drop Siman Tables
Drops the Siman tables from the project database.
Update Annotation
Text
Annotations save a copy of the text that was spanned with than annotation
swipe, as well as the start and end offsets of that span. This utility function
refreshes the copy of the spanned text in all annotations in the project by
querying the original documents with the annotation span anew. This action
may be used if annotations are imported that do not save spanned text, for
example.
Delete Project
Deletes the entire project!
Siman Tables Exist
Siman tables exist in the project database – no action required.
Siman Tables Do Not
Exist
Chart Review requires that Siman tables exist in the project database. Siman
tables hold annotation information and are a standard integration framework for
sharing annotations with other systems like UIMA NLP Pipelines and CHEX
annotation validation.
Create Siman Tables
Creates the Siman tables in the project database.
Oct 2014
Chart Review 1.0 User Manual
24
Inquire
Figure 15. Admin – Project – Show – Documents
Table 14: Admin – Project – Show – Documents
Item/Action
Description/Result
Name
The name of the documents that are associated with
the project. Project documents can be included in
an annotation workflow process task to allow an
annotator to better understand the annotation task
given him.
Description
A brief description of the project document.
View
Opens a new browser tab to display the selected
project document.
Delete
Deletes the project document from the project
database.
Upload Document
Name
Name of the document to upload to the project.
Description
A brief description of the document that will be
displayed during Chart Review to an annotator if
Oct 2014
Chart Review 1.0 User Manual
25
Inquire
this document is included as a task description.
Document
The document to upload.
Browse
Browse the local browser file system for a
document to upload.
Upload
Uploads the document to the project database.
Figure 16. Admin – Project – Show – Project Users
Table 15: Admin – Project – Show – Project Users
Item/Action
Description/Result
Username
The name of a user that has a role in this project.
Role
The role of a user on this project (i.e.
ROLE_ADMIN, ROLE_USER).
Oct 2014
Chart Review 1.0 User Manual
26
Inquire
Figure 17. Admin – Project – Show – Processes
Table 16: Admin – Project – Show – Project Users
Item/Action
Description/Result
Refresh
Refreshes the list of process of this project.
Process
The name of a user that has a role in this project.
Running/Historic
The role of a user on this project (i.e.
ROLE_ADMIN, ROLE_USER).
Copy
Copies the specified process and takes you to the
pages to edit that process.
Delete
Deletes the process!
View
Takes you to the pages to view the specified
process.
Add Process
Adds a process to the project and takes you to the
pages to edit that process.
Oct 2014
Chart Review 1.0 User Manual
27
Inquire
Figure 18. Admin – Project – Edit – General Configuration
Table 17: Admin – Project – Edit – General Configuration
Item/Action
Description/Result
Project Name
The name of the project.
Description
A brief description of the project.
Database Connection
URL
This is the jdbc connection string to the project database (i.e.
jdbc:mysql://localhost/chartreview?useUnicode=yes&characterEncoding=UTF8).
JDBC Driver
The jdbc driver used to connect to the project database (i.e.
com.mysql.jdbc.Driver).
JDBC Username
Username to log into the project database.
JDBC Password
Password to log into the project database.
Next
Takes you to the Project Users tab in the project editor.
Oct 2014
Chart Review 1.0 User Manual
28
Inquire
Figure 19. Admin – Project – Edit - Project Users
Table 18: Admin – Project – Edit – Project Users
Item/Action
Description/Result
Username
The name of a user that has a role in this project.
Role
The role of a user on this project (i.e.
ROLE_ADMIN, ROLE_USER).
Remove
Removes the user from the project.
Find User
Name of the user to find in the system.
Adds username in the text field Find User as a user
in the project.
Add
Note: If the user is not a valid system user, an
error message will be displayed.
Previous
Takes you to the General Configuration tab.
Update
Updates the project with the edited project values.
Oct 2014
Chart Review 1.0 User Manual
29
Inquire
Figure 20. Admin – Project – Add Process – Step 1 – Choose the Process to Add
Table 19: Admin – Project – Add Process – Step 1 – Choose the Process to Add
Item/Action
Description/Result
Select process
The process template type that the process will be
modeled from. For example, a single step process
or a multi-step process, etc. Process templates can
be uploaded in the Admin -> Process menu.
Next
Takes you to the next step in the process creation
wizard.
Oct 2014
Chart Review 1.0 User Manual
30
Inquire
Figure 21. Admin – Project – Add Process – Step 2 – Process Parameters
Oct 2014
Chart Review 1.0 User Manual
31
Inquire
Table 20: Admin – Project – Add Process – Step 2 – Process Parameters
Item/Action
Description/Result
Process Name
The name of the process that is presented in Chart
Review
Clinical Element Group
This is an optional grouping that will keep all
clinical elements grouped under a specified group.
Generally this should be left blank. This
essentially allows for multiple copies of the same
clinical element “document”. Annotations created
on one copy of a clinical element could never be
seen on another copy of the clinical element, in, for
example, a subsequent “downstream” process.
Process Steps
There will be one tab for each step (task) that is
defined in the chosen process type workflow.
Schema
The annotation schema that an annotator will use
during Chart Review to perform the annotation task
required in this step of the annotation process
workflow. Schemas are defined through the Admin
-> Schema menu item.
Clinical Elements
The clinical elements that will be displayed as
context to the principal clinical element displayed
in Chart Review. The principal clinical element is
the clinical element that the task is focused on, for
example a patient is a common principal clinical
element. Along with the principal clinical element,
an annotator may need to see other contextual
clinical information that would support the
annotation of the principal clinical element. For
example, to classify a patient for a given study, an
annotator may need to see clinical notes, lab values,
and radiology reports, but he may not need to see
medication or problem lists.
Note that in Chart Review, context clinical
elements may be annotated as well as the principal.
Include/exclude all clinical elements
A convenience toggle for including/excluding all
listed clinical elements.
Include
If checked, the specified clinical element will be
Oct 2014
Chart Review 1.0 User Manual
32
Inquire
available to be displayed in Chart Review when an
annotator performs this task.
Hidden
If checked, the specified clinical element will not
be displayed automatically when an annotator
initially retrieves this task.
Clinical Element
Name of the clinical element.
Position
The order in which the specified clinical element
view will appear in Chart Review. For example, a
clinical element with position 1 will appear in the
top priority visual position in the application
browser window layout. Positions do not have to
be sequential: included clinical elements with
positions of 1, 3, and 5 will be seen in the same
order as if they had positions 1, 2, and 3.
Task Name
The name of the task that is presented in Chart
Review
Annotation Group
Annotations created for this task will be stored with
this annotation group. Annotations may be
included in downstream process tasks as preannotations by specifying this annotation group as
the Task Pre-Annotation Group of the subsequent
process task.
Task Pre-Annotation Group
The annotation group to load as pre-annotations to
this task. If there are multiple pre-annotation
groups, separate them with a SEMI-COLON AND
NO SPACES. For example:
group1;group2;group3.
Task Principal Clinical Element
Usually this is the patient clinical element. More
generally, this is the clinical element for which a
task is created. The purpose of the task is to
present for annotation this clinical element. All
other clinical element information is contextual to
performing the task on this clinical element.
Task Documentation
A description of what needs to be done to
accomplish this task. The target audience is an
annotator. This description is displayed in the
Chart Review task panel. If this description is long
or needs graphics, consider uploading a document
Oct 2014
Chart Review 1.0 User Manual
33
Inquire
to the project (Admin -> Project -> Documents)
and selecting that document in Associated Project
Document For This Task below.
Associated Project Document For This Task
A project document that describes what needs to be
done to accomplish this task. The target audience
is an annotator.
Previous
Takes you to the previous page in the Create
Process wizard.
Next
Takes you to the next step in the Create Process
wizard.
Figure 22. Admin – Project – Add Process – Step 3 – Users and Clinical Elements In
This Process
Table 21: Admin – Project – Add Process – Step 3 – Users and Clinical Elements In
This Process
Item/Action
Oct 2014
Description/Result
Chart Review 1.0 User Manual
34
Inquire
Task Creation Query
Query to select a list of principal clinical element
ids (i.e. patient ids). A task is created for each
clinical element id returned.
Users
Select all users that could perform this task. Users
may be added to a project in Admin -> Project.
Other
Assignment Style
When an annotator gets a new assignment in Chart
Review, an assignment style of BY PROCESS
dedicates all tasks in a process to the annotator.
That annotator must complete all tasks in the
assigned process. An assignment style of BY
TASK dedicates only one task to the annotator.
Other tasks in the process may be completed by
other annotators, or by this annotator, whoever is
available first.
Previous
Takes you to the previous page of the Create
Process wizard.
Create Tasks and Finish
Saves the process information and creates all tasks
for the process. These tasks are saved in a queue
waiting for an annotator to get a new assignment in
Chart Review.
Figure 23. Admin – Project – Run SQL Query
Oct 2014
Chart Review 1.0 User Manual
35
Inquire
Table 22: Admin – Project – Run SQL Query
Item/Action
Description/Result
Any select statement to run against the project
database. This is a convenience feature, allowing
discovery of project database data that may be
needed for project definition, management, or
maintenance.
SQL To Run
Note: Updates and deletes and DDL with fail.
Execute
Execute the query
2.4 Reports (User/Admin)
The Reports item in the Admin drop down menu takes you to pages that allow perusal of analytical
reports about various aspects of any of your projects, including task completion, annotations made, interannotator agreement, etc.
Figure 24. Admin – Chose Project and Processes For Reports
Table 23: Admin – Chose Project and Processes For Reports
Item/Action
Oct 2014
Description/Result
Chart Review 1.0 User Manual
36
Inquire
Project
The project to be reported on.
Processes
The processes of the project to be reported on.
Select
Sets the project and processes for which reports
from the report page will be given.
Figure 25. Admin – Reports
Table 24: Admin – Reports
Item/Action
Description/Result
More…
Takes you to a popup displaying the project name
and a list of all processes in that project.
Change
Takes you back to the Choose Project and
Processes For Reports page to pick another project
and processes to report on.
Back to reports
Takes you back to the list of reports available.
How Many Annotations By Type
A report of how many annotations were created for
each classification found in the process task
schemas.
How Many Annotations By Annotator And Type
A report of how many annotations were created for
each classification found in the process task
schemas, listed by which annotator created the
annotations.
Patients Per Annotator and Process
A report of how many patients were annotated by
each annotator for each process.
Oct 2014
Chart Review 1.0 User Manual
37
Inquire
Patients Per Annotator and Process Detail
A report of which principal clinical elements (i.e.
patients) that were annotated by which annotators
for the process tasks.
Patients Reviewed by More Than One Annotator
A report of how many times each principal clinical
element (i.e. patient) has been reviewed by an
annotator.
Inter-Annotator Agreement
A report of inter annotator agreement using a
Fleiss’ kappa by principal clinical element (i.e.
patient), by classification, by annotator.
Figure 26. Admin – Report – Annotations Per Annotator Detail
Table 25: Admin – Report – Annotations Per Annotator Detail
Item/Action
Oct 2014
Description/Result
Chart Review 1.0 User Manual
38
Inquire
More…
Takes you to a popup displaying the project name
and a list of all processes in that project.
Change
Takes you back to the Choose Project and
Processes For Reports page to pick another project
and processes to report on.
Back to reports
Takes you back to the list of reports available.
Export to CSV
Opens the report in Microsoft Excel or saves a
CSV to the local file system.
Show N entries
The number of rows to display per page.
Filters the list by the given string (word/partial
word).
Search
Note: The string can be found in any of the
columns of the table.
Process
The process for which the report was generated.
Annotator
The annotator that created the annotation.
Clinical Element
The name of the clinical element configuration type
of the clinical element of the annotation. Clicking
on this name allows you to view the content of the
clinical element that was annotated.
Task
The id of the task the annotation was created for.
Clicking on this id takes you into Chart Review to
review or change that completed task.
Patient
The principal clinical element (i.e patient) that was
annotated.
Annotation Type
The classification from the project task annotation
schemas of the annotation.
Covered Text
The clinical element content text that was
highlighted by the annotation (if any).
Oct 2014
Chart Review 1.0 User Manual
39
Inquire
Attributes
A list of the annotation features (name/value pairs).
Showing x to y of N entries
The current location of the page within the data.
Previous…Page Numbers…Next
Move between pages of the report.
Figure 27. Admin – Report – Annotations Per Annotator Detail – Clinical Element
Table 26: Admin – Annotations Per Annotator Detail – Clinical Element
Item/Action
Description/Result
More…
Takes you to a popup displaying the project name
and a list of all processes in that project.
Change
Takes you back to the Choose Project and
Processes For Reports page to pick another project
and processes to report on.
Back to reports
Takes you back to the list of reports available.
Clinical Element Content
The content of the clinical element.
Oct 2014
Chart Review 1.0 User Manual
40
Inquire
Figure 28. Admin – Report – How Many Annotations By Type
Table 27: Admin – Report – How Many Annotations By Type
Item/Action
Description/Result
More…
Takes you to a popup displaying the project name
and a list of all processes in that project.
Change
Takes you back to the Choose Project and
Processes For Reports page to pick another project
and processes to report on.
Back to reports
Takes you back to the list of reports available.
Export to CSV
Opens the report in Microsoft Excel or saves a
CSV to the local file system.
Show N entries
The number of rows to display per page.
Search
Filters the list by the given string (word/partial
word). Note: The string can be found in any of the
columns of the table.
Type
The classification type of the annotations counted.
Count
The number of annotations of the given
classification type.
Showing x to y of N entries
The current location of the page within the data.
Oct 2014
Chart Review 1.0 User Manual
41
Inquire
Previous…Page Numbers…Next
Move between pages of the report.
Figure 29. Admin – Report – How Many Annotations By Annotator And Type
Table 28: Admin – Report – How Many Annotations By Annotator And Type
Item/Action
Description/Result
More…
Takes you to a popup displaying the project name
and a list of all processes in that project.
Change
Takes you back to the Choose Project and
Processes For Reports page to pick another project
and processes to report on.
Back to reports
Takes you back to the list of reports available.
Export to CSV
Opens the report in Microsoft Excel or saves a
CSV to the local file system.
Show N entries
The number of rows to display per page.
Search
Filters the list by the given string (word/partial
word).
Note: The string can be found in any of the
Oct 2014
Chart Review 1.0 User Manual
42
Inquire
columns of the table.
Annotator
The annotator that created the annotations
represented in the count by type.
Type
The classification type of the annotations counted.
Count
The number of annotations of the given
classification type.
Showing x to y of N entries
The current location of the page within the data.
Previous…Page Numbers…Next
Move between pages of the report.
Figure 30. Admin – Report – Patients Per Annotator and Process
Table 29: Admin – Report – Patients Per Annotator and Process
Item/Action
Description/Result
More…
Takes you to a popup displaying the project name
and a list of all processes in that project.
Change
Takes you back to the Choose Project and
Processes For Reports page to pick another project
and processes to report on.
Back to reports
Takes you back to the list of reports available.
Export to CSV
Opens the report in Microsoft Excel or saves a
Oct 2014
Chart Review 1.0 User Manual
43
Inquire
CSV to the local file system.
Show N entries
The number of rows to display per page.
Filters the list by the given string (word/partial
word).
Search
Note: The string can be found in any of the
columns of the table.
Process
The process from which the patient count by
annotator is found.
Annotator
The annotator that created the annotations
represented in the count.
Patient Count
The number of annotations created by the given
annotator for the given process.
Showing x to y of N entries
The current location of the page within the data.
Previous…Page Numbers…Next
Move between pages of the report.
Figure 31. Admin – Report – Patients Per Annotator And Process DETAIL
Oct 2014
Chart Review 1.0 User Manual
44
Inquire
Table 30: Admin – Report – Patients Per Annotator and Process DETAIL
Item/Action
Description/Result
More…
Takes you to a popup displaying the project name
and a list of all processes in that project.
Change
Takes you back to the Choose Project and
Processes For Reports page to pick another project
and processes to report on.
Back to reports
Takes you back to the list of reports available.
Export to CSV
Opens the report in Microsoft Excel or saves a
CSV to the local file system.
Show N entries
The number of rows to display per page.
Filters the list by the given string (word/partial
word).
Search
Note: The string can be found in any of the
columns of the table.
Process
The process from which the principal clinical
element (i.e. patient) annotation task was
performed.
Annotator
The annotator that performed the principal clinical
element (i.e. patient) annotation task.
Task Id
The id of the annotation task from which the
principal clinical element (i.e. patient) annotation
task was performed.
Patient Id
The id of the principal clinical element (i.e. patient)
on which the annotation task was performed.
Showing x to y of N entries
The current location of the page within the data.
Previous…Page Numbers…Next
Move between pages of the report.
Oct 2014
Chart Review 1.0 User Manual
45
Inquire
Figure 32. Admin – Report – Patients Reviewed More Than Once
Table 31: Admin – Report – Patients Reviewed More Than Once
Item/Action
Description/Result
More…
Takes you to a popup displaying the project name
and a list of all processes in that project.
Change
Takes you back to the Choose Project and
Processes For Reports page to pick another project
and processes to report on.
Back to reports
Takes you back to the list of reports available.
Export to CSV
Opens the report in Microsoft Excel or saves a
CSV to the local file system.
Show N entries
The number of rows to display per page.
Filters the list by the given string (word/partial
word).
Search
Note: The string can be found in any of the
columns of the table.
Patient Id
The principal clinical element (i.e. patient) that was
reviewed more than once.
Reviewed Count
The count of times that the principal clinical
element (i.e. patient) was reviewed.
Oct 2014
Chart Review 1.0 User Manual
46
Inquire
Showing x to y of N entries
The current location of the page within the data.
Previous…Page Numbers…Next
Move between pages of the report.
Figure 33. Admin – Report – Inter-Annotator Agreement – Original Report
Table 32: Admin – Report – Inter-Annotator Agreement – Original Report
Item/Action
Description/Result
More…
Takes you to a popup displaying the project name
and a list of all processes in that project.
Change
Takes you back to the Choose Project and
Processes For Reports page to pick another project
and processes to report on.
Back to reports
Takes you back to the list of reports available.
k (Fleiss’ kappa)
A statistica measure for assessing the reliability of
agreement between a fixed number of annotators
when assigning categories to a number of patients.
See: en.wikipedia.org/wiki/Fleiss’_kappa
concordence
The average of the Pi column.
Left column values
The principal clinical element ids (i.e. patient).
Oct 2014
Chart Review 1.0 User Manual
47
Inquire
Top row values
Annotation schema categories of annotations.
Cell
Number of annotators annotating an annotation
schema category.
Figure 34. Admin – Report – Inter-Annotator Agreement – New Report
Table 33: Admin – Report – Inter-Annotator Agreement – New Report
Item/Action
Description/Result
More…
Takes you to a popup displaying the project name
and a list of all processes in that project.
Change
Takes you back to the Choose Project and
Processes For Reports page to pick another project
and processes to report on.
Back to reports
Takes you back to the list of reports available.
k (Fleiss’ kappa)
A statistica measure for assessing the reliability of
agreement between a fixed number of annotators
when assigning categories to a number of patients.
See: en.wikipedia.org/wiki/Fleiss’_kappa
Oct 2014
Chart Review 1.0 User Manual
48
Inquire
concordence
The average of the Pi column.
Left column values
The principal clinical element ids (i.e. patient).
Top row values
Annotation schema categories of annotations.
Cell
Number of annotators annotating an annotation
schema category listed by annotator.
2.5 Schemas (User/Admin)
The Schemas item in the Admin drop down menu takes you to the pages that allow perusal and definition
of a library of annotation schemas that is shared by all users and all projects. These annotation schemas
define the classifications, and class attributes that will be used to perform the work of an annotation task.
Chart Review annotation schemas provide the following basic entities:
•
Classifications
•
Attributes (text, numeric, date, option list) – can be reused on classifications
Figure 35. Admin – Schema List
Table 34: Admin – Schema List
Item/Action
Oct 2014
Description/Result
Chart Review 1.0 User Manual
49
Inquire
Name Column
Sorts the schema list by schema name.
Name link
Takes you to the pages that edit the specified
schema.
Name
The name of the schema.
Edit
Takes you to pages to edit the specified schema.
Delete
Deletes the specified schema!
Copy
Copes the specified schema and takes you to the
pages to edit it.
Export
Opens a new tab in the browser and displays the
specified schema in XML format. This format can
be uploaded in another project or another Chart
Review system deployment.
Previous…123…Next
Standard list paging mechanism.
Create Schema
Creates a schema and takes you to the pages to edit
it.
Upload New Schema
Uploads a new schema from XML file to the
database.
Browse
Brows the local browser file system for a schema
file to upload.
Submit Query
Uploads the schema file.
Oct 2014
Chart Review 1.0 User Manual
50
Inquire
Figure 36. Admin – Schema – General Configuration
Table 35: Admin – Schema – General Configuration
Item/Action
Description/Result
Name
The name of the schema.
Description
A brief description of the schema.
Delete Schema
Deletes the schema!
Done
Saves the changes to the schema and takes you to
the Schema List page.
Oct 2014
Chart Review 1.0 User Manual
51
Inquire
Figure 37. Admin – Schema – Attributes
Table 36: Admin – Schema – Attributes
Item/Action
Description/Result
Name
The name of the class attributes.
Type
The type of class attribute (i.e.
Text/Numeric/Date/Options).
Min
The minimum valid numeric or date value.
Max
The maximum valid numeric or date value.
Options
The list of options for an option type class attribute.
Edit
Takes you to pages to edit the specified class
attribute.
Delete
Deletes the specified class attribute!
Copy
Copes the specified class attribute and takes you to
the pages to edit it.
Create Class Attribute
Creates a new class attribute and takes you to the
Oct 2014
Chart Review 1.0 User Manual
52
Inquire
pages to edit it.
Delete Schema
Deletes the schema!
Done
Saves the changes to the schema and takes you to
the Schema List page.
Figure 38. Admin – Schema – Attribute – Create/Edit
Table 37: Admin – Schema – Attribute – Create/Edit
Item/Action
Description/Result
Name
The name of the class attribute.
Type
The type of the class attribute (i.e.
Text/Numeric/Date/Option). An option attribute is
presents a list of valid options from which to
choose during Chart Review).
Delete Attribute
Deletes the attribute!
Done
Saves the changes to the attribute and takes you to
the Create/Edit Schema page.
Oct 2014
Chart Review 1.0 User Manual
53
Inquire
Figure 39. Admin – Schema – Attribute – Create/Edit - Numeric
Table 38: Admin – Schema – Attribute – Create/Edit - Numeric
Item/Action
Description/Result
Name
The name of the class attribute.
Type
When numeric type is chosen, Numeric Low and
Numeric High fields appear to specify a valid
numeric range for the attribute.
Numeric Low
The minimum valid numeric value.
Numeric High
The maximum valid numeric value.
Delete Attribute
Deletes the attribute!
Done
Saves the changes to the attribute and takes you to
the Create/Edit Schema page.
Oct 2014
Chart Review 1.0 User Manual
54
Inquire
Figure 40. Admin – Schema – Attribute – Create/Edit - Date
Table 39: Admin – Schema – Attribute – Create/Edit - Date
Item/Action
Description/Result
Name
The name of the class attribute.
Type
When date type is chosen, Min Date and Max Date
fields appear to specify a valid date range for the
attribute.
Min Date
The minimum valid date value.
Max Date
The maximum valid date value.
Delete Attribute
Deletes the attribute!
Done
Saves the changes to the attribute and takes you to
the Create/Edit Schema page.
Oct 2014
Chart Review 1.0 User Manual
55
Inquire
Figure 41. Admin – Schema – Attribute – Create/Edit - Option
Table 40: Admin – Schema – Attribute – Create/Edit - Option
Item/Action
Description/Result
Name
The name of the class attribute.
Type
When option type is chosen, an options list and
create button appear to allow valid options to be
specified.
Delete Attribute
Deletes the attribute!
Done
Saves the changes to the attribute and takes you to
the Create/Edit Schema page.
Options
The list of valid option values for the option
attribute.
Name
The name of the option.
Edit
Takes you to the pages to edit the specified option.
Delete
Deletes the specified option!
Oct 2014
Chart Review 1.0 User Manual
56
Inquire
Copy
Copies the specified option and takes you to the
pages to edit it.
Create Option
Creates an option and takes you to the pages to edit
it.
Figure 42. Admin – Schema – Attribute – Create/Edit - Option Create/Edit Option
Table 41: Admin – Schema – Attribute – Create/Edit - Option
Item/Action
Description/Result
Name
The name of the option.
Delete Option
Deletes the option!
Done
Saves the changes to the option and takes you to
the Create/Edit Attribute page.
Oct 2014
Chart Review 1.0 User Manual
57
Inquire
Figure 43. Admin – Schema – Classifications
Table 42: Admin – Schema – Classifications
Item/Action
Description/Result
Name
The name of the classification.
Color
The color of the classification. This is the highlight
color of an annotation span with this classification.
Attributes
The list of attributes of this classification.
Edit
Takes you to pages to edit the specified class
attribute.
Delete
Deletes the specified class attribute!
Copy
Copes the specified class attribute and takes you to
the pages to edit it.
Create Classification
Creates a classification and takes you to the pages
to edit it.
Delete Schema
Deletes the schema!
Oct 2014
Chart Review 1.0 User Manual
58
Inquire
Done
Saves the changes to the schema and takes you to
the Schema List page.
Figure 44. Admin – Schema – Classification – Create/Edit – General Configuration
Table 43: Admin – Schema – Classification – Create/Edit – General Configuration
Item/Action
Description/Result
Name
The name of the classification.
Color Label
Shows how the color will look in a highlight.
Color
The color of the classification. This is the highlight
color of an annotation span with this classification.
Delete Classification
Deletes the classification!
Done
Saves the changes to the classification and takes
you to the Create/Edit Schema page.
Oct 2014
Chart Review 1.0 User Manual
59
Inquire
Figure 45. Admin – Schema – Classification – Create/Edit – Attributes
Table 44: Admin – Schema – Classification – Create/Edit - Attributes
Item/Action
Description/Result
Name
The name of the class attributes.
Color
The color of the attributes. This is the highlight
color of an annotation span with this classification.
Type
The type of class attribute (i.e.
Text/Numeric/Date/Options).
Min
The minimum valid numeric or date value.
Max
The maximum valid numeric or date value.
Options
The list of options for an option type class attribute.
Delete
Deletes the specified class attribute!
Available Attributes
A list of reusable attributes defined at the schema
level that can be added as class attributes.
Add Attributes
Add the selected attributes to the classification as
Oct 2014
Chart Review 1.0 User Manual
60
Inquire
class attributes.
Create Class Attribute
Creates a new available class attribute and takes
you to the pages to edit it. The resulting attribute
shows up in the list of Available Attributes, but still
needs to be added to the classification.
Delete Classification
Deletes the classification!
Done
Saves the changes to the classification and takes
you to the Schema Create/Edit page.
2.6 Failed Jobs (Admin only)
The Failed Jobs item in the Admin drop down menu takes you to a list of failed workflow processes.
Note that different annotators may be participating in different annotation workflows simultaneously.
Figure 46. Admin – Failed Jobs
Oct 2014
Chart Review 1.0 User Manual
61
Inquire
2.7 Process Templates (Admin only)
The Process Templates item in the Admin drop down menu takes you to the pages that allow upload and
definition of process pre-defined process templates that may be used in creating process instances for a
given project. Any xml file containing a process definition that uses the BMP 2.0 standard can be loaded.
For example, a process defined using Activi Designer will can be loaded. Simple single step and multistep processes should work in Chart Review. More complex process configurations have not yet been
tested.
Figure 47. Admin – Process Templates
Table 45: Admin – Process Templates
Item/Action
Description/Result
Process List
List of process templates available to use when
creating a process for a project. This template
describes the different tasks that need to be defined
and executed as part of an annotation process
workflow. It follows the BMP 2.0 process
definition standard.
ID
The id of the process template.
Name
Name of the process template presented in the
Project process definition.
Description
Description of the process template.
Version
Version of the process template.
Diagram
Diagram of the process template. Clicking on the
diagram button opens a new browser window and
Oct 2014
Chart Review 1.0 User Manual
62
Inquire
displays the diagram.
Delete
Deletes the process template!
Upload Process Template
Allows upload of any xml file containing a process
definition that uses the BMP 2.0. For example, a
process defined using Activi Designer will can be
loaded. Simple single step and multi-step
processes should work in Chart Review. More
complex process configurations have not yet been
tested.
Browse
Find the BMP 2.0 xml process definition file in the
browser’s local file system.
Upload
Uploads the process template to the database.
2.8 Tools and Utilities (Admin only)
The Process Templates item in the Admin drop down menu takes you to the pages that provide tools and
utilities to kill processes and view API documentation, for example.
Figure 48. Admin - Tools and Utilities
Table 46: Admin – Tools and Utilities
Item/Action
Description/Result
Admin Tools
Area for various system administration activies.
Delete all running Actviti Process Instances – Do
Delete
Deletes all processes and tasks from all projects!!!
Annotations from any of those tasks will not be
deleted, but an annotation’s association with the
Oct 2014
Chart Review 1.0 User Manual
63
Inquire
task for which it was generated will no longer exist.
Rest API
Area to access various API documents.
View Rest API Docs
Takes you to pages to view the Chart Review API
documents generated by the JSONDoc subsystem.
To get back from these pages, press the browser
back button, because the Chart Review banner will
not be available in this page space.
Figure 49. Admin - Tools and Utilities – API Docs
Table 47: Admin – Tools and Utilities – API Docs
Item/Action
Description/Result
Various
These pages describe the web services the available
in Chart Review to get and submit annotations,
clinical element configurations, and annotation
schemas programmatically. To get back from these
pages, press the browser back button, because the
Chart Review banner will not be available in this
page space. A detailed description of how to use
Oct 2014
Chart Review 1.0 User Manual
64
Inquire
these pages is out of the scope of this document.
Please see JSONDoc documentation for details.
2.9 Users (Admin only)
The Process Templates item in the Admin drop down menu takes you to the pages that allow user
definition and maintenance.
Figure 50. Admin - Users
Table 48: Admin – Users
Item/Action
Description/Result
Username Column
Sorts the user list by username.
Username
The name of each user.
Username link
Takes you to the pages to show user information.
Account Non Expired Column
Sorts the user list by account non-expired status.
Account Non Expired
True if the user account is active. False if the user
account exists but is expired. The user cannot use
the account. See the system administrator to reset.
Account Non Locked Column
Sorts the user list by account non-locked status.
Oct 2014
Chart Review 1.0 User Manual
65
Inquire
Account Non Locked
True if the user account is NOT locked. False if
the user account exists, but is currently locked.
This is usually automatically set because of invalid
login attempts. The user may not used the account.
See the system administrator to reset.
Credentials Non Expired Column
Sorts the user list by credentials non-expired status.
Credentials Non Expired
True if the current password is not expired. This is
set this to False to force the user to enter a new
password.
Enabled Column
Sorts the user list by enabled status.
Enabled
True if the user account is enabled. False if the
user account has been disabled by the system
administrator. See the system administrator to find
out why.
Figure 51. Admin – Show User
Table 49: Admin – Show User
Item/Action
Description/Result
User List link
Takes you back to the User List.
Username
The name of each user.
Account Non Expired
True if the user account is active. False if the user
Oct 2014
Chart Review 1.0 User Manual
66
Inquire
account exists but is expired. The user cannot use
the account. See the system administrator to reset.
Account Non Locked
True if the user account is NOT locked. False if
the user account exists, but is currently locked.
This is usually automatically set because of invalid
login attempts. The user may not used the account.
See the system administrator to reset.
Credentials Non Expired
True if the current password is not expired. This is
set this to False to force the user to enter a new
password.
Enabled
True if the user account is enabled. False if the
user account has been disabled by the system
administrator. See the system administrator to find
out why.
Authorities
A list of the roles that the user has on various
projects.
Edit
Takes you to the pages to edit the user account
definition.
Delete
Deletes the user!
Figure 52. Admin – Edit User
Oct 2014
Chart Review 1.0 User Manual
67
Inquire
Table 50: Admin – Show User
Item/Action
Description/Result
User List link
Takes you back to the User List.
Username
The name of each user.
Account Non Expired
True if the user account is active. False if the user
account exists but is expired. The user cannot use
the account. See the system administrator to reset.
Account Non Locked
True if the user account is NOT locked. False if
the user account exists, but is currently locked.
This is usually automatically set because of invalid
login attempts. The user may not used the account.
See the system administrator to reset.
Credentials Non Expired
True if the current password is not expired. This is
set this to False to force the user to enter a new
password.
Enabled
True if the user account is enabled. False if the
user account has been disabled by the system
administrator. See the system administrator to find
out why.
Authorities
A list of the roles that the user has on various
projects.
Update
Saves the changes to the User account.
Delete
Deletes the user!
Oct 2014
Chart Review 1.0 User Manual
68
Inquire
2.10 About (Admin only)
The About item in the Admin drop down menu takes you to the pages that show information about the
application, its version, structure, dependencies, and components.
Figure 53. Admin - About
Table 51: Admin – About
Item/Action
Description/Result
Application Status
Version information about Chart Review and its
major technology subsystems. Counts of system
components.
Installed Plugins
A list of the plugin components used by this
application with their version numbers.
Oct 2014
Chart Review 1.0 User Manual
69
Inquire
View Rest API Docs
Takes you to pages to view the Chart Review API
documents generated by the JSONDoc subsystem.
To get back from these pages, press the browser
back button, because the Chart Review banner will
not be available in this page space.
Available Controllers
These links call the various controllers they
represent. These may be used for system
understanding and programmer testing.
Figure 54. Admin - About – API Docs
Table 52: Admin – About – API Docs
Item/Action
Description/Result
Various
These pages describe the web services the available
in Chart Review to get and submit annotations,
clinical element configurations, and annotation
schemas programmatically. To get back from these
pages, press the browser back button, because the
Chart Review banner will not be available in this
page space. A detailed description of how to use
these pages is out of the scope of this document.
Oct 2014
Chart Review 1.0 User Manual
70
Inquire
Please see JSONDoc documentation for details.
2.11 Log Level (Admin only)
The Log Level item in the Admin drop down menu takes you to the pages that allow control over the
various levels of system logging available.
Figure 55. Admin - Log Level
Table 53: Admin – Log Level
Item/Action
Description/Result
Controller Loggers
Allows you to set the logging level that Grails
controllers use to log to the chart-review log file
found in the Tomcat logs directory.
Service Loggers
Allows you to set the logging level that Grails
services use to log to the chart-review log file
found in the Tomcat logs directory.
Domain Class Loggers
Allows you to set the logging level that Grails
domain classes use to log to the chart-review log
Oct 2014
Chart Review 1.0 User Manual
71
Inquire
file found in the Tomcat logs directory.
Grails Loggers
Allows you to set the logging level that Grails itself
uses to log to the chart-review log file found in the
Tomcat logs directory.
3rd Party Loggers
Allows you to set the logging level that Grails 3rd
party plugins use to log to the chart-review log file
found in the Tomcat logs directory.
2.12 Performance Monitoring (Admin only)
The Performance Monitoring item in the Admin drop down menu takes you to the pages that show
performance monitoring analytics about the Chart Review system itself.
Figure 56. Admin – Performance Monitoring – Top
Oct 2014
Chart Review 1.0 User Manual
72
Inquire
Figure 57. Admin – Performance Monitoring - Bottom
Table 54: Admin – Performance Monitoring
Item/Action
Description/Result
Various
These pages describe the performance of the Chart
Review system as tracked by the JavaMelody
monitoring subsystem. To get back from these
pages, press the browser back button, because the
Chart Review banner will not be available in this
page space. A detailed description of how to use
these pages is out of the scope of this document.
Please see JavaMelody documentation for details.
Oct 2014
Chart Review 1.0 User Manual
73
Inquire
Oct 2014
Chart Review 1.0 User Manual
74
3 Chart Review
3.1 Overview
Chart Review is a web application that allows manual annotations to be made on multiple elements and
multiple levels of a medical chart simultaneously. The task of classifying a cohort of patients can be done
as a patient is reviewed in the full context of his clinical notes, labs, procedures, problems and
medications. Or a corpus of notes can be annotated in the context of the patient, labs, problems,
procedures and medications that clarify the notes. The type and set of clinical elements that can be
viewed as part of an annotation task is completely customizable and configurable by an annotation project
administrator.
Figure 58. Chart Review
Oct 2014
Chart Review 1.0 User Manual
75
Line Editor
Annotators who have been assigned to an annotation project can open Chart Review with a new or
previous assignment that they have been given from the an annotation process defined in the project and
see the requirements of the task and all of the information necessary to perform the annotation task that
has been assigned. Annotators can finish a task, move to another task, or put a task on hold. Within the
Chart Review tool, an annotator can peruse a chart independent of the annotation task at hand (he can
collapse the annotation panel entirely), or he can be taken to the parts of the chart that have been preannotated by sorting, filtering, grouping, and selecting annotations from the annotation list that show
features of interest in the chart. In addition, the annotator has control over the content and layout of the
chart presentation as well as the annotation list. The following sections describe how the Chart Review
tool can be used to accomplish an annotation task.
3.2 Quick-Start
The following outlines the basic annotation workflow steps, starting from the Chart Review Home page:
1. Pick a project and process
2. Press Get Next Assignment
3. Find out what annotation is required by pressing the Task Info button in the task panel
4. Select the appropriate schema classification for the task
5. Scroll to the clinical element view
6. Select a clinical element item
7. Scroll to the desired place in the content text
8. Highlight the desired text (an annotation will appear in the annotations list on the left)
9. Fill out any annotation attribute features presented in the annotation editor panel on the lower
left
10. When annotation is finished, press Submit/Next to submit the annotations and get the next task
That’s it!
3.3 Initiating a Chart Review
A user can see his recent task work for a given project and process, including work on completed
processes. A user can fetch a new task assignment or work on existing open assignments, or assignments
that have been put on hold.
Oct 2014
Chart Review 1.0 User Manual
76
Line Editor
Figure 59. Chart Review – Initiating a Chart Review
Table 55: Chart Review – Initiating a Chart Review
Item/Action
Description/Result
Project
The project you want to perform an annotation task
on.
Show Completed Processes
If checked, completed processes are provided in the
Process dropdown as well as incomplete processes.
Process
The project process workflow you want to perform
an annotation task on.
Gets a new task assignment from the chosen project
process and initiates chart review on that task. The
task moves to an ASSIGNED state.
Get Next Assignment
Note that the processes listed in the Process
dropdown show how many unassigned tasks they
have left.
Oct 2014
Chart Review 1.0 User Manual
77
Line Editor
Your Recent Work
This is a list of tasks that have been assigned to you
for the specified project process. These tasks may
be open, on hold, or completed.
Task Id link
Initiates chart review on the specified task.
Task Id
The id of the task.
Type
ASSIGNED/COMPLETED
Status
open/hold/completed
Comment
A comment that was added for a hold.
Date
The date/time the task was assigned or completed.
3.4 Layout Options
A reviewer has several layout options available, including:
3.4.1 Two Column Mode
Two column mode allows a user to have two instances of the same type of clinical element view open
side by side for comparison. For example, a user could open a note that was annotated well, according to
the task standard and use it to guide annotation of another note of the same type of clinical element.
Oct 2014
Chart Review 1.0 User Manual
78
Line Editor
Figure 60. Chart Review – Two Column Mode
Figure 61. Chart Review – Single Column Mode
Oct 2014
Chart Review 1.0 User Manual
79
Line Editor
Table 56: Chart Review – Two Column Mode
Item/Action
Description/Result
Two Column Mode Toggle (app upper right)
Toggles between two columns and one column,
distributing the views between the two columns or
coalescing them into one column.
Auto-Select
3.4.2 Variable Height Views
View height can be adjusted by dragging the bottom or top borders of the view window.
Oct 2014
Chart Review 1.0 User Manual
80
Line Editor
Figure 62. Chart Review – Variable Height Views
Table 57: Chart Review – Variable Height Views
Item/Action
Description/Result
Drag View Top/Bottom
Adjusts the height of the view.
3.4.3 View Detail Docking/Hiding Options
A clinical element view of type LIST has a grid part and a detail part. The user may change the docking
of the detail panel to the right or the bottom. He may also choose to hide the detail panel altogether
through the Detail dropdown button
Oct 2014
Chart Review 1.0 User Manual
81
Line Editor
Figure 63. Chart Review – View Detail Docking/Hiding Options
Table 58: Chart Review – Variable Height Views
Item/Action
Description/Result
Detail Right (default)
Shows the detail at the right of the view.
Detail Bottom
Shows the detail at the bottom of the view.
Detail Hide
Hides the detail from the view.
3.4.4 Optional Column Inclusion
Columns may be optionally included/excluded from the grid view. Column inclusion/exclusion is
toggled through the column header dropdown menu.
Oct 2014
Chart Review 1.0 User Manual
82
Line Editor
Figure 64. Chart Review – Optional Column Inclusion
Table 59: Chart Review – Optional Column Inclusion
Item/Action
Description/Result
Dropdown on Right of Colum -> Columns
Toggles the visibility of each column that has
Include checked in the process task definition.
Oct 2014
Chart Review 1.0 User Manual
83
Line Editor
3.4.5 List Sorting
The grid list may be sorted ascending/descending by any of the columns. Column sorting is toggled
through the column header dropdown menu.
Figure 65. Chart Review – List Sorting
Table 60: Chart Review – List Sorting
Item/Action
Description/Result
Dropdown on Right of Column -> Sort
Ascending/Descending
Sorts by the column values ascending or
descending. An indicator is displayed on the
column header to show column sort and direction.
3.4.6 List Grouping
The grid list may be grouped by any of the columns. Column grouping is toggled through the column
header dropdown menu.
Oct 2014
Chart Review 1.0 User Manual
84
Line Editor
Figure 66. Chart Review – List Grouping
Table 61: Chart Review – List Grouping
Item/Action
Description/Result
Groups the grid list by the specified column.
Dropdown on Right of Colum -> Group by this
Field
Dropdown on Right of Column -> Show in groups
Oct 2014
Note: The list can be both grouped and sorted
simultaneously.
Toggles the grouping by the specified column.
Chart Review 1.0 User Manual
85
Line Editor
3.4.7 Variable Column Order and Size
Figure 67. Chart Review – Variable Column Order and Size
Table 62: Chart Review – Variable Column Order and Size
Item/Action
Description/Result
Drag Column Order/Size
Columns can be reordered by dragging and they
can be resized by grabbing the edge of the column
headers. These changes persist until the view is
closed. Two views of the same type may have
different column layouts.
Oct 2014
Chart Review 1.0 User Manual
86
Line Editor
3.4.8 Collapsible Views
Figure 68. Chart Review – Collapsible Views
Table 63: Chart Review – Collapsible Views
Item/Action
Description/Result
Collapse/Expand View
Collapses or expands a view.
Oct 2014
Chart Review 1.0 User Manual
87
Line Editor
3.4.9 Delete View
Figure 69. Chart Review – Delete View
Table 64: Chart Review – Delete Views
Item/Action
Description/Result
Delete View
Deletes the view. Another instance of a view type
can be added through the Add View dropdown
menu.
Oct 2014
Chart Review 1.0 User Manual
88
Line Editor
3.4.10
Add View
Figure 70. Chart Review – Add View
Table 65: Chart Review – Add View
Item/Action
Description/Result
Add View
Adds an instance of the specified view type.
Multiple instances of the same view type are
allowed.
Oct 2014
Chart Review 1.0 User Manual
89
Line Editor
3.4.11
Multiple Instances of the Same View (comparison)
and the Auto-select Toggle
Two instances of the same type of view can be opened simultaneously, affording a comparison capability
where the annotation on one document of a given type may be used as a model for annotating another
document of a given type, for example.
Note that when an annotation is created on one type of clinical element, all views of that type of
clinical element will be auto-selected to show the annotation, unless the Auto-select toggle is OFF. Turn
the Auto-select toggle off when comparing two documents of the same clinical element type so that the
reference document will not be changed as annotations are added to the second document of that type.
Figure 71. Chart Review – Multiple Instances of the Same View (Comparison)
Oct 2014
Chart Review 1.0 User Manual
90
Line Editor
Figure 72. Chart Review – Auto-select Toggle
3.4.12
Closable Annotation Panel
The annotation panel can be collapse if the user wants more room for chart review activities.
Oct 2014
Chart Review 1.0 User Manual
91
Line Editor
Figure 73. Chart Review – Closable Annotation Panel
Table 66: Chart Review – Closable Annotation Panel
Item/Action
Description/Result
Collapse Annotation Panel
Collapses/expands the annotation panel.
3.5 Workflow Support
There are several features of the Chart Review interface that support project workflow issues, including
saving a detail view as a separate tab to refer to later, and a Done button to keep track of items for which
the task has been completed.
3.5.1 View In New Tab
A user can save a detail view as a separate tab so that he may come back to it at a later point.
Note: The column that is displayed as the tab title is specified in the Title Field of the clinical element
definition.
Oct 2014
Chart Review 1.0 User Manual
92
Line Editor
Figure 74. Chart Review – View in New Tab
Table 67: Chart Review – View In New Tab
Item/Action
Description/Result
View in new tab
Opens the current detail in a separate tab.
Annotations selected in the annotation list will be
auto-selected and viewed in a separate tab, if there
is a separate tab opened for that clinical element. If
there is not a separate tab for that clinical element,
the auto-select view will show it in the detail panel
as usual.
Oct 2014
Chart Review 1.0 User Manual
93
Line Editor
3.5.2 Marking Records As Done
To help a user keep track of which clinical elements he has already performed the annotation task on, he
may mark the element as Done. Clinical elements that are done have a check mark by them in the grid.
Note that the task may be marked as done by pressing the Done button in the Task panel. The task is
marked as completed and the user is returned to the Chart Review home page.
Figure 75. Chart Review – Marking Records As Done
Table 68: Chart Review – Marking records as Done
Item/Action
Description/Result
Done
Toggles the clinical element between done and not
done. Done is indicated by a green checkmark in
the grid.
3.5.3 Optional Text Wrapping
The user may allow cell text in a clinical element view grid to be wrapped or truncated.
Oct 2014
Chart Review 1.0 User Manual
94
Line Editor
Figure 76. Chart Review – Optional Text W rapping
Table 69: Chart Review – Optional Text Wrapping
Item/Action
Description/Result
Wrap
Toggles wrapping of text in the grid cells. If
wrapping is off, the text in a cell is truncated. If
wrapping is on, cell text is wrapped and the row
height is increased.
Oct 2014
Chart Review 1.0 User Manual
95
Line Editor
3.5.4 Description Hiding
Each row of a clinical element view grid may display a description or not by toggling with the
Description toggle button.
Note: The column that is displayed as the description is specified in the Description Field of the
clinical element definition.
Figure 77. Chart Review – Description Hiding
Oct 2014
Chart Review 1.0 User Manual
96
Line Editor
Table 70: Chart Review – Description Hiding
Item/Action
Description/Result
Description
Toggles display of the clinical element description
in the grid as a preview.
3.6 Annotation Workflow
All interaction with the task that is being performed in Chart Review is displayed in the Task panel in the
upper left part of the application screen, at the top of the Annotation panel. The name of the task is
displayed, along with the task id in parenthesis. The task id may help in referencing the task in reports
and when choosing the task again from the Chart Review Home page’s Your Recent Work list. A user
may also view a brief description of the task, or a detailed description of the task to understand the nature
of the work he has been assigned. Finally, the user may choose how to change the task status after the
task is done being performed.
Figure 78. Chart Review – Task Panel and Toolbar
Table 71: Chart Review – Task Panel and Toolbar
Item/Action
Description/Result
The name of the task and the task id (in
parenthesis).
Task Name and Task Id
Oct 2014
Note The task id may help in referencing the
task in reports and when choosing the task again
from the Chart Review Home page’s Your Recent
Work list.
Chart Review 1.0 User Manual
97
Line Editor
The type of the principal clinical element upon
which the task is being performed.
Principal
A somewhat brief description of the task to be
performed.
Documentation
Note: The Task panel is scrollable, allowing the
user to view a longer description.
Done
Prompts for save, if needed, and exits Chart
Review.
Save
Save annotations, but keeps the current task open.
Hold/Next
Save annotations and submit the task as being onhold until later. Get the next task assignment.
Submit/Next
Save annotations and submit the task as completed.
Get the next task assignment.
View the detailed task information. A poup-up
window is displayed with task information in it.
Press close to close the task information window.
Task Info
Note: If a pdf document, for example, is
included in the process task definition as
documentation for the task, a separate tab will be
opened in the browser to display that document.
3.7 Annotation Schema
The annotation schema associated with the given task is displayed in a collapsible tree in the Annotations
schema panel. All classifications available in that schema are displayed and may be selected. To
annotate a clinical element text, first select the desired classification and then highlight the text. To
annotate a whole clinical element, first select the desired classification and then press the Classify button
on the selected clinical element.
Oct 2014
Chart Review 1.0 User Manual
98
Line Editor
Figure 79. Chart Review – Annotation Schema
Table 72: Chart Review – Annotation Schema
Item/Action
Select Classification
Description/Result
The currently selected classification will be used in
creating annotations on clinical element text and on
whole clinical elements.
Note: If you try to highlight before picking a
classification from the annotation schema, an error
message is displayed.
3.8 Annotation of Clinical Element Text
Clinical element text may be annotated by selecting an annotation schema classification in the Schema
panel and then highlighting the text with a swipe. Annotation spans may overlap in all combinations of
ways. Annotation span colors are blended to show overlaps. An annotation appears in the annotation list
for every highlight swipe made in the text. Features for that annotation are displayed and able to be edited
in the Annotation Editor panel at the lower left of the screen.
Oct 2014
Chart Review 1.0 User Manual
99
Line Editor
Figure 80. Chart Review – Annotation of Clinical Element Text
Table 73: Chart Review – Annotation of Clinical Element Text
Item/Action
Description/Result
Creates an annotation which is displayed in the list
on the left.
Highlight
Select Annotation from Text
Note: When you create an annotation by
highlighting the text, an annotation will be created
in the annotation list and annotation features that
need to be filled in will be displayed in the
Annotation Editor panel at the bottom left of the
screen.
When you click on an annotation span in the text,
the corresponding annotation item will be selected
in the Annotation List to the left.
Note: A selected annotation is show with black
under and over lining in the text.
Select Annotation from List
When you select an annotation in the Annotation
List on the left, the clinical element to which the
annotation belongs will be opened and the
annotation will be scrolled into view and shown as
selected.
Note: A selected annotation is show with black
Oct 2014
Chart Review 1.0 User Manual
100
Line Editor
under and over lining in the text.
3.9 Annotation of Whole Context Clinical Element (i.e. Note,
Lab)
A whole clinical element may be annotated by selecting a classification in the Schema panel and pressing
the Classify button found in the detail area of the clinical element view. A clinical element may have
multiple classifications. Each classification is displayed to the right of the Classify button.
Figure 81. Chart Review – Annotation of Whole Clinical Element
Table 74: Chart Review – Annotation of Clinical Element Text
Item/Action
Description/Result
Classify
Creates an annotation for the whole clinical
element record which is displayed in the list on the
left.
Oct 2014
Chart Review 1.0 User Manual
101
Line Editor
Note: When you create an annotation by
pressing the Classify button, an annotation will be
created in the annotation list and annotation
features that need to be filled in will be displayed in
the Annotation Editor panel at the bottom left of
the screen.
Select Annotation from Classify panel
When you click on an annotation classification
label in the are next to the Classify button, the
corresponding annotation item will be selected in
the Annotation List to the left.
Note: A selected annotation is show with black
under and over lining in the text.
Select Annotation from List
When you select an annotation for a whole clinical
element in the Annotation List on the left, the
clinical element to which the annotation belongs
will be opened and the annotation will be shown as
selected.
Note: A selected annotation is show with black
under and over lining in the text.
3.10 Annotation of Principal Clinical Element (i.e. Patient)
The principal clinical element of a task may be displayed (or not) in a view just like the context clinical
elements. It is commonly displayed with a Summary tab rather than with the default grid/detail display
because the principal clinical element is only one element (i.e. patient), not a list of elements like may of
the context clinical elements. It is annotated in the same way as any other clinical element displayed.
Figure 82. Chart Review – Annotation of Principal Clinical Element
Oct 2014
Chart Review 1.0 User Manual
102
Line Editor
3.11 The Annotation List
All annotations associated with a given task whether they be on the principal clinical element itself or any
of the context clinical elements, are displayed in a grid in the Annotation panel. This grid may be
grouped, sorted, filtered, and deleted. Selecting annotations in this list will open the corresponding
clinical element view (if not already open) and will auto-scroll to the selected annotation. As annotations
are created they appear in the list and their features are displayed in the Annotation Editor panel below
the list. The grid may be sorted, grouped and filtered by accessing a dropdown menu on the right of the
column header.
Oct 2014
Chart Review 1.0 User Manual
103
Line Editor
Figure 83. Chart Review – Annotation List
Table 75: Chart Review – Annotation List
Item/Action
Description/Result
All Annotations / Selected Document Annotations
Toggles between showing all annotations
belonging to the task (and all of its clinical element
documents) and showing only those annotations
belonging to the currently selected clinical element
document in the views to the right.
Show Column Filters
Shows the current column filters in a popup
message.
Clear Column Filters
Clears all column filters.
Deletes all currently selected annotations.
Delete Selected Annotations
Oct 2014
Unless one of the save buttons is pressed,
an unintended delete will not be saved to the
Chart Review 1.0 User Manual
104
Line Editor
database. So an unintended delete may be undone
by exiting going back to the Chart Review Home
page without saving – but, this will not save any
other changes as well.
Refreshes the annotation grid.
Refresh
Wrap
The annotation grid may be refreshed to display
edits that have been made in the Annotation Editor.
Toggles wrapping of text in the grid cells. If
wrapping is off, the text in a cell is truncated. If
wrapping is on, cell text is wrapped and the row
height is increased.
3.12 Editing Annotation Attributes
Annotations have attributes features that may be edited when an annotation is created or modified at a
later time. The attributes are displayed in the Annotation Editor panel immediately when an annotation is
created or selected. After editing the attributes, you may need to refresh the Annotation list.
Oct 2014
Chart Review 1.0 User Manual
105
Line Editor
Figure 84. Chart Review – Editing Annotation Attributes
Oct 2014
Chart Review 1.0 User Manual
106
Line Editor
Table 76: Chart Review – Editing Annotation Attributes
Item/Action
Description/Result
Text
Text attributes may be edited by entering text in a
simple text field.
Numeric
Numeric attributes may be edited by entering a
valid number in a simple text field. If the number
is out of range, an indication of the invalid state of
the field will be indicated with a red border and a
popup stating what is invalid.
Date
Date attributes may be edited by entering a valid
date in a simple text field or by picking a date from
a date picker. If the date is out of range, an
indication of the invalid state of the field will be
indicated with a red border and a popup stating
what is invalid.
Option
Option attributes may be edited by choosing an
option from the dropdown menu.
Oct 2014
Chart Review 1.0 User Manual
107
Index
3 Annotation of Whole Clinical Element, 101
3rd Party Loggers, 72
Annotation of Whole Context Clinical Element,
101
A Annotation Panel, 91
About, 69
Annotation Schema, 98, 99
About – API Docs, 70
Annotation Type, 39
Account Non Expired, 65, 66, 68
Annotation Workflow, 97
Account Non Expired Column, 65
Annotations Per Annotator Detail, 38
Account Non Locked, 66, 67, 68
Annotations Per Annotator Detail – Clinical
Element, 40
Account Non Locked Column, 65
API Docs, 64, 70
Active, 9, 10
Application Status, 69
Active link, 9
Architecture, 1
Add, 29
Assignment Style, 35
Add Attributes, 60
Associated Project Document For This Task, 34
Add Process, 27
Add Process – Step 1 – Choose the Process to
Add, 30
Assumptions, xiii
Attribute – Create/Edit, 53
Add Process – Step 2 – Process Parameters, 31
Attribute – Create/Edit - Date, 55
Add Process – Step 3 – Users and Clinical
Elements In This Process, 34
Attribute – Create/Edit - Numeric, 54
Add View, 89
Attribute – Create/Edit - Option, 56
Admin Tools, 63
Attribute – Create/Edit - Option - Create/Edit
Option, 57
All Annotations, 104
Attributes, 52, 60
All Annotations / Selected Document
Annotations, 104
Authorities, 67
Auto-Select, 80
All Elements By Patient Id Query, 11, 13, 17
Annotation, 101, 103
Auto-select Toggle, 91
Available Attributes, 60
Annotation Attributes, 105, 106
Available Controllers, 70
Annotation Group, 33
Annotation List, 103, 104
B Annotation of Clinical Element Text, 99
Back to reports, 37, 39, 40, 41, 42, 43, 45, 46,
47, 48
Annotation of Principal Clinical Element, 102
Oct 2014
Chart Review 1.0 User Manual
108
Index
Browse, 10, 11, 50, 63
concordence, 47, 49
Connection String, 16
C Content Template, 15, 20, 21
Change, 37, 40, 41, 42, 43, 46, 48
Content Template Toggle, 19
Chart Review, i, 75
Context Clinical Element, 101
ChartReview, 4
Controller Loggers, 71
Choose the Process to Add, 30
Chose Project and Processes For Reports, 36
Classification, 99
Classification – Create/Edit – Attributes, 60
Classification – Create/Edit – General
Configuration, 59
Controllers, 70
Conventions
Documentation, xiii
Copy, 27
Copy To Project, 10
Classifications, 58
Covered Text, 39, 40
Classify, 101
Create Class Attribute, 52, 61
Classify panel, 102
Create Classification, 58
Clear Column Filters, 104
Create Clinical Element Configuration – Step 1
–Define Test Connection and Queries, 16
Clinical Element, 33, 39
Clinical Element Configurations, 4
Clinical Element Content, 40
Clinical Element Group, 32
Clinical Element Text, 99, 100
Create Clinical Element Configuration – Step 2
– Data Set Column Definition & Other
Metadata, 18
Create Clinical Element Configuration – Step 3
– Preview Output, 20
Clinical Elements, 32
Create Clinical Element Configuration – Step 4
– Name and Description, 21
Closable Annotation Panel, 91, 92
Create Option, 57
Collapse Annotation Panel, 92
Create Schema, 50
Collapse/Expand View, 87
Create Siman Tables, 24
Collapsible Views, 87
Create Tasks and Finish, 35
Color, 59
Create/Edit, 53
Color Label, 59
Create/Edit – Attributes, 60
Colum, 83
Create/Edit - Date, 55
Column, 84
Create/Edit – General Configuration, 59
Column Filters, 104
Create/Edit - Numeric, 54
Column Name, 14, 18
Create/Edit - Option, 56
Column Order and Size, 86
Create/Edit - Option - Create/Edit Option, 57
Column Order/Size, 86
Created By, 11, 13
comparison, 90
Created Date, 11, 12, 13
Oct 2014
Chart Review 1.0 User Manual
109
Index
Credentials Non Expired, 66, 67, 68
Drag Column Order/Size, 86
Credentials Non Expired Column, 66
Drag View Top/Bottom, 81
Drop Siman Tables, 24
D Data Set Column Definition & Other Metadata,
18
Database Connection, 28
Edit – General Configuration, 28
Date, 55
Edit - Project Users, 29
Define Test Connection and Queries, 16
Delete all running Actviti Process Instances –
Do Delete, 63
Delete Classification, 59, 61
Delete Option, 57
Delete Project, 24
Delete Schema, 51, 53, 58, 59
Delete Selected Annotations, 104
E Edit, 67
Database Connection URL, 23
Delete Attribute, 53, 54, 55, 56
Dropdown on Right of Colum, 83, 84
Edit User, 67
Editing Annotation Attributes, 105
Enabled, 68
Enabled Column, 66
Example Patient Id, 17
Exclude, 14
Export, 10
Export to CSV, 39, 41, 42, 43, 45, 46
Delete View, 88
F Description, 25
Failed Jobs, 5, 61
Description Field, 11, 13, 19
Figures, v
Description Hiding, 96, 97
Find User, 29
Description link, 9
Fleiss’ kappa, 47, 48
Detail Bottom, 82
Detail Hide, 82
Detail Right, 82
Disclaimers, xii
Display Name, 14, 18
Do Delete, 63
Documentation
Conventions, xiii
Symbols, xiii
G General Configuration, 10, 23, 28, 51, 59
General Configuration – Edit, 12
General Setup, 6
Get Next Assignment, 77
Grails Loggers, 72
Group, 84, 85
Grouping, 84
Documentation Conventions, xiii
H Documents, 25
Hold/Next, 98
Domain Class Loggers, 71
Home Page, 3, 4
Done, 51, 53, 54, 55, 56, 57, 59, 94
Oct 2014
Chart Review 1.0 User Manual
110
Index
How Many Annotations By Annotator And
Type, 37, 42
How Many Annotations By Type, 37, 41
How to
Log, 71
Log Level, 5, 71
Loggers, 71
Logout, 6
Use this Manual, xii
M How to Use this Manual, xii
Main Toolbar, 4
I Marking Records As Done, 94
ID, 62, 63
Max Date, 55
Include/exclude all clinical elements, 32, 33
Initiating a Chart Review, 76, 77
More…, 37, 39, 40, 41, 42, 43, 45, 46, 47, 48
Inquire
Multiple Instances of the Same View, 90
Inquire to File Entries Option, 61, 62, 65
Installed Plugins, 69
Integration, 2
Name, 9, 25, 26, 51, 53
Inter-Annotator Agreement, 38
Inter-Annotator Agreement – Original Report,
47
Jdbc Driver, 16, 24, 28
JDBC Password, 24, 28
JDBC Username, 24, 28
Jdbc Username/Password, 17
Multiple Instances of the Same View
(Comparison), 90
N Intended Audience, xii
J Min Date, 55
Name and Description, 21
Name Column, 50
Name link, 9, 50
New Clinical Element Configuration, 8
New Report, 48
Next, 17, 30
Numeric, 54
Numeric High, 54
K Numeric Low, 54
k, 47, 48
O Key Field, 14, 19
Online Demo, xiii, 1
L Option, 56, 57
Layout Options, 78
Option - Create/Edit Option, 57
Left column values, 47, 49
Optional Column Inclusion, 82, 83
Legal Requirements, xii
Optional Text Wrapping, 94
List Grouping, 84
Options
List item name, 9
List Sorting, 84
Oct 2014
Inquire to File Entries, 61, 62, 65
Orientation, xi, xii
Chart Review 1.0 User Manual
111
Index
Original Report, 47
Project – Show – General Configuration, 23, 27
Project - Show – Processes, 27
P Project - Show – Project Users, 26
Patient Count, 44
Project Clinical Element Configurations, 8, 9
Patient Id, 45, 46
Patients Per Annotator and Process, 37, 43
Patients Per Annotator and Process Detail, 38,
44
Project List, 22
Project Name, 23, 28
Project Users, 26, 29
Projects, 5
Patients Reviewed by More Than One
Annotator, 38
Patients Reviewed More Than Once, 46
Q Quick-Start, 76
Performance Monitoring, 5, 6, 72
Plugins, 69
R Position, 33
References, xiii
Preview Output, 20
Refresh, 105
Previous, 35
Report – Annotations Per Annotator Detail, 38
Previous…123…Next, 50
Report – Annotations Per Annotator Detail –
Clinical Element, 40
Previous…Page Numbers…Next, 40, 42, 43, 44,
45, 47
Principal Clinical Element, 102
Report – How Many Annotations By Annotator
And Type, 42
Process, 77
Report – How Many Annotations By Type, 41
Process List, 62
Report – Inter-Annotator Agreement – New
Report, 48
Process Name, 32
Process Parameters, 31
Report – Inter-Annotator Agreement – Original
Report, 47
Process Steps, 32
Report – Patients Per Annotator and Process, 43
Process Templates, 62
Processes, 5
Report – Patients Per Annotator And Process
DETAIL, 44
Project – Add Process – Step 1 – Choose the
Process to Add, 30
Report – Patients Reviewed More Than Once,
46
Project – Add Process – Step 2 – Process
Parameters, 31
Reports, 36, 37
Project – Add Process – Step 3 – Users and
Clinical Elements In This Process, 34
Project – Edit – General Configuration, 28
Project – Edit - Project Users, 29
Project – Run SQL Query, 35
Project - Show – Documents, 25
Oct 2014
Requirements
Legal, xii
Rest API Docs, 70
Reviewed Count, 46
Run SQL Query, 24, 35
Running/Historic, 27
Chart Review 1.0 User Manual
112
Index
Show Clinical Element Configuration – General
Configuration, 10
S Same View, 90
Schema, 99
Show Clinical Element Configuration – General
Configuration – Edit, 12
Schema – Attribute – Create/Edit, 53
Show Column Filters, 104
Schema – Attribute – Create/Edit - Date, 55
Show Completed Processes, 77
Schema – Attribute – Create/Edit - Numeric, 54
Show N entries, 39, 41, 42, 44, 45, 46
Schema – Attribute – Create/Edit - Option, 56
Show User, 66
Schema – Attribute – Create/Edit - Option Create/Edit Option, 57
Showing x to y of N entries, 40, 41, 43, 44, 45,
47
Schema – Attributes, 52
Siman Tables Do Not Exist, 24
Schema – Classification – Create/Edit –
Attributes, 60
Siman Tables Exist, 24
Schema – Classification – Create/Edit – General
Configuration, 59
Single Element Query, 11, 13, 17
Single Column Mode, 79
Schema – Classifications, 58
Single Sign On (SSO) Setup, 6
Schema – General Configuration, 51
Sort, 84
Schema List, 49
Sorting, 84
Schemas, 49
Start Over, 21, 22
Search, 39, 41, 42, 43, 44, 45, 46
Submit Query, 50
Select Annotation from Classify panel, 102
Submit/Next, 98
Select Annotation from List, 100, 102
Switch User, 6, 7
Select Annotation from Text, 100
Symbols
Found in the Documentation, xiii
Select Classification, 99
Select process, 30
T Selected Document Annotations, 104
Table of Contents, iii
Service Loggers, 71
Tables, viii
Setting up your Browser for Chart Review, 6
Show – Documents, 25
Task, 39
Task Creation Query, 35
Show – General Configuration, 23
Task Documentation, 33
Show – Processes, 27
Task Id, 45, 78
Show – Project Users, 26
Task Id link, 78
Show Clinical Element Configuration –
Columns, 14
Show Clinical Element Configuration – Content
Template, 15
Task Info, 98
Task Name, 33
Task Name and Task Id, 97, 98
Task Panel, 97
Oct 2014
Chart Review 1.0 User Manual
113
Index
Task Panel and Toolbar, 97
User List link, 66, 68
Task Pre-Annotation Group, 33
Username, 29, 65
Task Principal Clinical Element, 33
Username Column, 65
Text, 107
Username link, 65
Text Wrapping, 94, 95
Users, 5, 65
Title Field, 11, 13, 19
Users and Clinical Elements In This Process, 34
Toolbar, 4, 97
V Tools and Utilities, 5, 63
Variable Column Order and Size, 86
Tools and Utilities – API Docs, 64
Variable Height Views, 80, 81
Top row values, 48, 49
View Detail Docking/Hiding Options, 81, 82
Two Column Mode, 78, 79
View In New Tab, 92, 93
Two Column Mode Toggle, 80
View Rest API Docs, 64, 70
Two instances, 90
W Type Name, 14, 18
What is Chart Review?, xi
U Whole Context Clinical Element, 101
Update, 14
Workflow, 97
Update Annotation Text, 24
Workflow Support, 92
Upload Document, 25
Upload New Clinical Element Configuration, 10
Wrapping, 95
Upload New Schema, 50
Y Upload Process Template, 63
Your Recent Work, 78
Oct 2014
Chart Review 1.0 User Manual
114