1
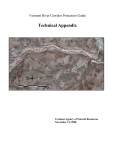
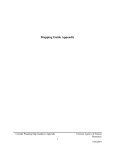
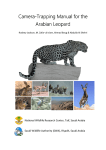
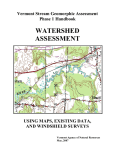
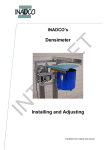
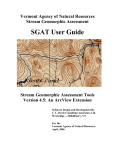
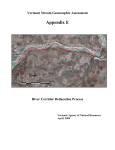
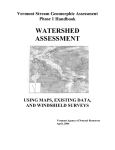
Vermont Stream Geomorphic Assessment Appendix E River Corridor Delineation Process Vermont Agency of Natural Resources May, 2009 Stream Geomorphic Assessment Handbooks VT Agency of Natural Resources - E0 - May, 2009 River Corridor Delineation Process Purpose A stream and river corridor delineation process has been developed as part of the Phase 1 Stream Geomorphic Assessment (SGA) protocol to create a map overlay area and assess: Surficial geologic materials and soils (Steps 3.3 and 3.5) Land cover / land use (Step 4.2) Berms, roads, and developments (Steps 6.1 and 6.2) The corridor will also be used in the Phase 2 SGA protocols to evaluate parameters in the field. River corridor encroachments (Step 1.3) River corridor land use (Step 3.3) The delineation process recognizes that in some cases, the geologic and land use factors influencing runoff and erosion may extend beyond the toe of the side slope in a narrow valley. The process also recognizes that in wider valleys, human structures on the valley floor do not always alter floodplain characteristics. The process defines a width of land on either side of the river, together called the river corridor, that will capture: Factors influencing runoff and erosion; Factors influencing floodplain function; and A minimum width of land within the overall valley width that may be occupied by the active stream channel, as slope and dimension remain in balance with the watershed inputs. SGAT and the Corridor Delineation Process The SGAT extension designed for use with GIS is a significant time-saving tool in delineating the river corridor. For those stream reaches where you have used GIS to draw valley toe and meander centerlines, SGAT can be used to carry out the four-step process described below in a matter of minutes. For stream reaches where no valley toes and meander center lines were drawn, a default corridor of either 2.5 times the channel width (for a total of 5 channel widths) either side of the centerline or 100 ft (for a total of 200 feet) either side of the centerline, which ever is greatest, will be drawn by SGAT. Note, that this width is determined off the stream centerline; the 2.5 times the channel width is an attempt to recognize a portion of the channel width inherent in buffering off the stream centerline. If you are drawing the corridor from the top of the stream bank; than the calculaOriginal Valley Toes tion will be 2 times the channel width (for a Original valley toes drawn Corrected Valley Toe total of 4 channel widths) either side of the Contour Lines based only on contour stream bank or 100 ft (for a total of 200 ft), Alluvial Material which ever is greatest. Glacial Lake Glacial Till A method for defining meander centerlines is described in Step 2 of the river corridor delineation process. A method for defining the toes of valley walls is described below. Draw the valley toes as a polygon theme and the meander centerlines as a line theme. See SGAT User Manual (Steps 7 and 9) for details on theme requirements and uses within the SGAT program. Defining the Toe of the Valley: Using soils maps and data in conjunction Corrected valley toe based on soils map, showing alluvial material beyond change in slope contours. Stream Geomorphic Assessment Handbooks VT Agency of Natural Resources - E1 - May, 2009 with topographic maps determine the location of the toe of the right and left valley walls. Generally, the toe of a valley wall can be identified by looking for the break in slope as the steeper valley wall turns into the gentle sloped valley floor. Soils data help with identifying changes in slope and include other soil characteristics that may indicate the need to adjust a valley wall line one way or the other. Starting at the mouth of the main stem and tributaries, draw right and left valley wall toes as continuous lines to an upstream point where distinguishing between the valley toes and the stream line becomes difficult (in confined valleys). Additional valley wall delineation tips and rules of thumb are offered at the end of this Appendix. I. River Corridor Delineation Process SGAT and the Corridor Delineation Process The SGAT extension designed for use with GIS is a significant time-saving tool in delineating the river corridor. For those stream reaches where you have used GIS to draw valley toe and meander centerlines, SGAT can be used to carry out the four-step process described below in a matter of minutes. For stream reaches where no valley toes and meander center lines were drawn, a default corridor of either 2.5 times the channel width (for a total of 5 channel widths) either side of the centerline or 100 ft (for a total of 200 feet) either side of the centerline, which ever is greatest, will be drawn by SGAT. Note, that this width is determined off the stream centerline; the 2.5 times the channel width is an attempt to recognize a portion of the channel width inherent in buffering off the stream centerline. If you are drawing the corridor from the top of the stream bank; than the calculation will be 2 times the channel width (for a total of 4 channel widths) either side of the stream bank or 100 ft (for a total of 200 ft), which ever is greatest. A method for defining meander centerlines is described in Step 2 below. Remember to draw valley walls as polygon themes and meander centerlines as line themes. See SGAT User Manual (Steps 7 and 9) for details on theme requirements and uses within the SGAT program. 5 Channel Widths or 200 ft (if W bkf ≤40) Valley Wall Stream Total Step 1 Corridor equals 5 channel widths or 200 ft. measured from the centerline of stream extended laterally beyond the toe of the valley. Corridor Delineation Process In Phase 1 and Phase 2 Assessments, river corridors are defined using the following 4 step process: Figure A-1: Step 1 in Corridor Delineation Stream Geomorphic Assessment Handbooks VT Agency of Natural Resources - E2 - May, 2009 Step 1: This delineation process requires the use of the most recent ortho-photo and topographic map of the reach. The ortho-photo is used to draw the corridor and the topographic map is used as a guide to determine the proximity of the channel and A meander centerline is the toe of the valley walls. The ideal mapping drawn through points placed base to work on is an ortho-photo with topogas meander crossovers and raphic lines overlain using a computer mapping along the channel every 7-10 tool such as GIS. channel widths where there is little or no meandering. Shown as the dotted red lines in the example to the right, the Step 1 corridor lines are drawn parallel to the stream at a distance from the centerline of the stream of: 2.5 x channel widths, where the bankfull width is > 40 feet (for a total of 5 channel widths); or 100 feet, where the bankfull width is ≤ 40 feet (for a total Step 1 Corridor of 200 feet). The stream can be used as a centerline where it appears to be a single line. Where the valley is narrow it is important to draw the corridor lines, so that they extend laterally beyond the toe of the valley walls. 8 Channel Widths measured 4 widths on each side of a meander centerline. These lines do not extend laterally beyond the toe of the valley. Rationale: This step identifies those land areas beyond the toe of the valley wall that, may or may not be important to the stream for planform and slope adjustment, but involve land uses that significantly change runoff patterns and sediment discharges to streams in confined valleys. Step 2: Shown as the dashed brown lines in the example below, the Step 2 corridor lines are drawn parallel to a line that is drawn down-valley through meander crossover points. For the purposes of this delineation process this line is called the meander centerline. Complete Step 2 of the corridor delineation process for streams and rivers flowing in valleys measured to be at least 4 channel widths wide (valley types NW, BD, and VB). To draw the meander centerline, first place crossover points on the channel. These points are generally located in the center of the channel where the deepest thread of water (or thalweg) “crosses over” Stream Geomorphic Assessment Handbooks VT Agency of Natural Resources - E3 - May, 2009 Figure A-2b: Step 2 in Corridor Delineation from the outside bank of one meander to the opposite bank on the next meander downstream. Figure A-2a: Thalweg Crossover Point Where there are no discernible meanders (in a straight or straightened reaches of channel), continue to add points along the centerline of the stream at a 7-10 channel widths interval. Draw corridor lines 4 channel widths either side of and parallel to a meander centerline drawn through the crossover points. The total corridor in an unconfined valley is 8 channel widths. Since this stream corridor delineates lands that may influence runoff patterns and sediment discharges, as well as planform and slope adjustments in unconfined, depositional streams, the corridor lines should not extend laterally beyond the toe of the valley. As shown in Figure 2, discontinue the corridor line where the stream is close to the valley wall. Rationale: In addition to lands affecting runoff, the Step 2 corridor includes the belt width (4-8 channel widths, depending on the stream type). The belt width is the lateral extent of stable meanders and is an area critical to unconfined streams as they adjust their slope consistent with their sediment regime. 8 Channel Widths measured from the toe of the valley, where the proximity of the channel and valley wall results in a corridor (drawn using Steps 1 & 2) that is less than 8 channels. (Used in unconfined valleys.) Step 3: Shown as the dotted purple lines in the example below, a Step 3 corridor line is drawn parallel to the valley wall at a distance of 8 channel widths from the toe of the valley. Complete Step 3 of the corridor delineation process for streams and rivers flowing in valleys greater than 4 channel widths wide (Step 2-10: valley types 2 and 3). The Step 3 delineation process is necessary only in those situations where the stream or river reach is in a broad unconfined valley and flowing within a distance of 4 channel widths Figure A-3: Step 3 in Corridor Delineation Stream Geomorphic Assessment Handbooks VT Agency of Natural Resources - E4 - May, 2009 from the valley wall. In reaches where the stream comes close to the valley wall, draw a line parallel to the toe of the valley at a distance of 8 channel widths. This line need not extend longitudinally (upstream or downstream) beyond lines drawn during Step 2 of this process. Rationale: In lieu of any geologic information that may explain the straighter course of a stream, this step assumes that a straight reach in a wide, shallow-sloped valley may attempt to adjust its planform and slope. The channel will become more sinuous to regain equilibrium with the large supply of fine grained sediA ments typically found in unconfined valley segments. The Step 3 delineation process attempts to include those land areas into the corridor that may be important to this adjustment process. Step 4: If more than one of the Steps 1 through 3 were required for a given reach, then you will want to complete Step 4 of this river corridor delineation process. The Step 4 corridor lines encompass all corridor lines drawn in Steps 1 through 3 to form a single stream or river corridor delineation. B Shown as the solid black lines in the example to the right, the Step 4 corridor lines follow those segments of the Step 1-3 lines that extend laterally away from the channel. C The only corridor lines to be included outside the toe of the valley walls are Step 1 corridor lines; for streams in confined valleys where a valley wall and meander centerline could not be drawn. River Corridor delineation is made as continuous lines connecting those portions of corridor (drawn using Steps 1-3) that extend the most from the channel. In the example to the right, the corridor for the stream reach in the valley segment labeled A, the stream corridor follows the Step 1 corridor lines. This follows because Step 2 and 3 lines are drawn for streams flowing in broader valleys at least 4 channel widths wide. Step 1 and 2 corridor lines were both drawn for the stream in valley segment B. The Step 2 lines were followed for the final corFigure A-4: Step 4 in Corridor Delineation ridor delineation (solid black line) because they extend further laterally than the Step 1 lines. Had there been an atypical meander with larger amplitude (not shown) the Step 1 lines may have extended beyond the Step 2 lines around the meander. Stream Geomorphic Assessment Handbooks VT Agency of Natural Resources - E5 - May, 2009 Step 1, 2, and 3 corridor lines were drawn for the stream in valley segment C. The Step 1 corridor line (on the right side) and the Step 3 corridor line (on the left side) were followed from the final corridor delineation because they extend further laterally than any other line drawn in this valley segment. NOTE: The stream and river corridors delineated for the Phase 1 and Phase 2 Stream Geomorphic Assessment are determined for the purposes of evaluating the possible impacts of various factors influencing runoff (i.e., land use/cover) and floodplain modifications. They are not intended to empirically show floodplains, flood prone areas, or flood hazard areas. These delineations are determined through Phase 2 and Phase 3 field assessments. II. Valley Wall Delineation Tips and Rules of Thumb The valley walls are used, in part, to help define the lateral constraints on the river. Polygon shape files showing the location of the toes of valley walls are one of the user-created inputs to the Stream Geomorphic Assessment Tool (SGAT) and are used in Step 7 of SGAT to determine valley length and average valley width (used to calculate sinuosity and confinement). For Phase 1 uses, relatively crude valley walls are generally sufficient. However, applications of Phase 2 geomorphic assessment data (especially Fluvial Erosion Hazard (FEH) Mapping) require a much more accurate delineation of the toe of valley wall. During the development of FEH areas, either in SGAT (Part E, Step FEH03) or in the SGAT 9.2 FEH tool, the area is clipped to the valley wall, as erosion hazards do not extend outside the valley floor (see Appendix H of the SGAT Manual for a more detailed look at corridor development). As a result, the valley wall locations often define the limits of the FEH area, making an accurate, field-verified valley wall shapefile essential to the process. This is especially true in many of Vermont’s narrower valleys, where the valley walls often define one or even both sides of the FEH area. While identifying valley walls is generally a simple task, it can be complicated by the presence of features, both man-made (road and railroad beds, development), and natural (e.g., terraces or abandoned floodplains), which may be confining. The purpose of this guidance is to clarify both the intent and application of the valley wall shape file in the VT Agency of Natural Resources (VTANR) Stream Geomorphic Assessment and related applications, and to provide guidelines that will help assessors develop the best possible valley wall shape files. This section outlines the basic process of delineating phase 1 valley walls, while the next chapter details the field verification and modification of valley walls needed for Phase 2 and FEH mapping. Considerations when Developing Phase 1 Valley Walls Even though the accuracy of the toe of valley wall delineation is most essential during Phase 2 (and FEH mapping), it is important to develop the best possible valley wall shape file during Phase 1. 1. Before going into the field for windshield surveys, use remote sensing data to draw the best possible valley wall.* One effective technique is to overlay 20-foot contours onto the latest orthophotos. 2. The contour lines on topographic maps may not be detailed enough to give a clear indication of where the toe of the valley wall may be. To assist in determining the outer limits or toes of the valley wall, it may be helpful to use the NRCS soils in conjunction with the topographic map. The soils can be linked to the NRCS Top20 table; then displayed on parent material. One of the key parent materials to look for is alluvium. Using the surficial geology maps to locate bedrock outcrops will also provide insight into where the geology is restricting the river from moving laterally across a valley. Stream Geomorphic Assessment Handbooks VT Agency of Natural Resources - E6 - May, 2009 3. When drawing valley walls for a tributary entering another stream, draw a separate valley wall polygon for the tributary, and make sure that the polygon includes the tributary reach break near the confluence. Valley wall polygons for tributaries and the rivers they meet can overlap without creating problems. 4. Print out the initial valley wall shape file overlain on an ortho-photo base (make sure to use a useful scale, even if it means the map extends onto multiple sheets of paper) and bring these with you whenever you go into the field to complete the windshield survey, or any bridge and culvert surveys. During your time in the field, verify the location of the valley wall whenever possible. If the valley wall location differs from your original delineation, make note of the true location on your map and change it when you return to the office. Some people like to take a laptop into the field to cut out this intermediate step. Another approach is to capture toe of valley wall locations with a GPS unit. If using this approach, be aware of the accuracy of the GPS unit being used. Given the margin of error for many handheld GPS units in many situations, it is often possible to more accurately identify locations manually using ortho-photos. 5. If accuracy of the valley walls is essential,* but it is not possible to verify them in the field, you may consider completing a stereoscopic analysis of air photos. Stereoscopic analysis allows the user to view the landscape in 3D and to see rises as detailed as 5 to 10 feet. 6. If SGAT is to be used; review Step 7 “Requirements for Digitizing Valley Walls” on page 128 of the SGAT manual in the Arcview 3x environment for additional information on the data requirements for valley walls used in SGAT. (There are a few examples below that address SGAT issues.) 7. Include all alluvial material, except unreasonable rises, as indicated by topography. 8. Use the outer limits of the valley as indicated by the contour lines (where topographic map indicates a wide Figure A-5 valley), even if the alluvial material Valley Toes Contour Lines does not fill the valAlluvial Material ley. Overlaying the Dense Till topographic conGlacial Fluvial tours on the soils Glacial Lake map can be a good Glacial Till Other way of reviewing both topographic features and soils at the same time. 9. Delineate the toe of the valley wall at changes in elevation greater than 20 feet (indicated by 2 or more contour lines within a short distance of each other), as this is a good indicator that the river is not likely to utilize the taller, steeper feature. 10. Include alluvial fans that are within the main stem valley. Stream Geomorphic Assessment Handbooks VT Agency of Natural Resources - E7 - May, 2009 * In locations where LIDAR (Light Detection and Imaging) has been flown (such as much of Chittenden County, see the Vermont Mapping Program’s website at: http://www.state.vt.us/tax/mapping.shtml) and an accurate digital elevation model has been produced, it may be possible to develop a very accurate valley wall based solely on remotely sensed data. See “Section II C. Considerations when Using Digital Elevation Models and LIDAR when Developing Phase 2 Valley Walls,” below. Figure A-6 Valley Toes Contour Lines Alluvial Material Dense Till Glacial Fluvial Glacial Lake Glacial Till Other An often asked question is whether to include or not include pockets of other (non-alluvium) material within the valley wall. In Figure A-5, the non-alluvial material was included due to the location of the contour lines, signifying that the valley walls may be further back than indicated by the location of the alluvial material. This is appropriate until field verification can be done. Area not likely occupied by river The valley wall in Figure A-6 was not extended up to the outer extent of the alluvial depicted on the soils map. Alluvial material in the surrounding area did not extend up the contours in the same way as this lobe of alluvium. To keep the valley wall more consistent, and to not create an odd “point” in the valley, the valley wall bisected the lobe. A compromise was also made in the valley wall, where the contour lines indicated a change in elevation of greater than 20 feet. The valley wall was drawn to include as much of the alluvial material as possible without extending up the slope significantly. Valley wall outside sub-waterhsed Figure A-7 Sub-Watershed Valley Toes Contour Lines Alluvial Material Dense Till Glacial Fluvial Glacial Lake Glacial Till Other In Figure A-7, the small tributary had a separate polygon drawn for the valley walls (highlighted in yellow for ease of viewing). In the downstream portion the valley walls are outside of the sub-watershed for that reach. This can cause an error in the calculation of the valley width, because the program will not recognize the valley wall outside of the subwatershed. The walls also appear to occupy an area that is not likely accessed by the river; due to elevation change indicated by contours. Until field verified, the valley wall was moved into a lower elevation. Corrected valley walls Stream Geomorphic Assessment Handbooks VT Agency of Natural Resources - E8 - May, 2009 Be careful with valley walls outside of the sub-watershed boundaries. In SGAT, if the valley line is outside of the sub-watershed it will not be considered for the reach. If it is not possible to contain both valley walls within the sub-watershed for the reach, the user will have to manually measure the valley data for that reach (see Figure A-8). Figure A-8 is an example where the user would not be able to include both sides of the valley (highlighted in yellow for ease of viewing) for one of the mainstem reaches. A tributary enters the valley and divides the valley into “two” sub-watersheds. The user will get an error in SGAT – Step 7 that the valley information can not be calculated for this reach. The user will be able to have SGAT skip this reach and continue with calculating data for the remaining reaches. Be sure to note the reach number indicated in the error message, then come back and manually measure the valley information. Reach where only one valley wall is contained in the sub-watershed Valley Toes Sub-Watershed Figure A-8 PHASE 2 AND FEH VALLEY WALL GUIDANCE Considerations when Developing Phase 2 Valley Walls The following check list should help you verify valley walls most efficiently: Verify valley walls, preferably in the spring and fall, when there are no leaves on the trees so that you can see landscape conditions more easily. Walking along rivers in the snow during the winter months is inefficient and should be avoided; Verify valley walls for targeted Phase 2 segments or reaches. You may come across situations in which there isn’t a Phase 1 valley wall for a particular segment or reach. We recommend verifying the valley wall, unless the segment or reach is in a highly confined, bedrock-dominated headwater setting or it is very remote and does not face severe development pressures that could have an impact Stream Geomorphic Assessment Handbooks VT Agency of Natural Resources - E9 - May, 2009 on stream conditions. In such situations, the utility of verifying those segments would be marginal, in comparison to the cost in time and dollars to verify them. Bring maps of the reaches you need to verify; the scale MUST be 1" = 300' - 450' MAXIMUM (1:3600 – 1:5400); Larger scale maps are not useful; you will not be able to see the landscape in detail; Maps should display the most recent color ortho-photo, since the ortho-photo is likely to show the current location of the stream and recent development. Consider bringing a second version of each map showing black and white ortho-photos as well, since the lack of leaves on the trees will help you pick up the stream and possibly flood chutes in wooded areas. Prepare the maps with either the 20-foot contour lines overlaid onto the ortho-photo or as a separate topographic map for the same segments and reaches; The map should have the most recent valley wall shapefile on it; You will be verifying this shape file; Include the Phase 1 valley wall shape file, and, if you have it, the draft Fluvial Erosion Hazard (FEH) area; Consider using a GPS to capture the toe of the valley walls in more confined areas or areas that are wooded and difficult to see from an aerial photo; Bring a clipboard and permanent markers to indicate along the map’s Phase 1 valley wall the location of the actual, “verified” valley wall. Bring the Phase 2, Phase 1, and Feature Indexing Tool (FIT) data if you have it. The data will help you know whether there are any flood chutes, avulsions, or adjacent ponds/wetlands to consider and approximate bankfull widths for your segments or reaches. Bring your lunch, water, sunscreen, and insect repellent. Wear long pants and sturdy shoes. Prepare to get wet in case you need to cross the stream. Always check yourself for ticks and watch out for poison ivy, poison parsnip, and barbed wire. Knock on doors, leave a note at the door of private residences and businesses, and leave a note on the windshield of your vehicle to ask permission to access private land. Don’t forget to register the new, field-verified Valley Wall in the SGAT project before running the steps to create the FEH. Considerations when Using Digital Elevation Models and LIDAR when Developing Phase 2 Valley Walls Digital Elevation Models (DEM) for Delineating Valley Walls Recent valley wall mapping in the State of Vermont has relied heavily on USGS 1:24K topographic maps and field observations. We anticipate using more sophisticated remote sensing GIS data (that derived from satellites, airplanes, or similar means) to verify valley walls as data become more available. Valley wall mapping becomes easier when vegetation is not interfering with site lines in the field. Similarly, technologies such as Digital Elevation Models (DEM) allow the use of bare earth images that “remove” vegetation that would appear on an ortho-photograph A DEM — also sometimes called a digital terrain model (DTM) generally refers to a representation of the Earth's surface, excluding features such as vegetation, buildings, and bridges. The DEM often comprises much of the raw dataset, which may have been acquired through techniques such as photo-grammetry, LIDAR, LFSAR (Low Frequency Synthetic Aperture Radar), and land surveying. (Note that DEMs are distinct from digital surface models (DSM), which include buildings, vegetation, and roads, as well as natural terrain features.) The DEM provides a so-called bare-earth model, devoid of landscape features. DEM maps display the elevation of the land based on a grid of data points. DEMs can be derived from a variety of sources. In Vermont, two DEMs cover the entire state: (a) one data set created by the USGS from the 1:24K topography known as the National Elevation Dataset (NED); and (b) a second data set created by the Vermont Center for Geographic Information (VCGI). Stream Geomorphic Assessment Handbooks VT Agency of Natural Resources - E10 - May, 2009 The latter dataset, referred to as the “VTHydroDEM,” has been corrected to ensure stream flows are all downhill. Figures A-9 and A-10 display a comparison of DEMs derived from the VTHydroDEM and LIDAR data. The LIDAR derived data is significantly sharper. While the VTHydroDEM may be useful for creating a rough valley wall delineation in large river systems (for example, the Winooski River, Lamoille River, and Otter Creek), the data is not sharp enough to allow for the precision that is necessary for planning and zoning purposes. Figure A-9. Image of the Winooski Valley (where valley walls are very distinct) derived from the VCGI Statewide Hydro Digital Elevation Model (DEM). Figure A-10. Image of the Winooski Valley derived from LIDAR captured data. The subtle topographic variations are clearly evident. Use of LIDAR in Valley Wall Verification Light Detection and Ranging (LIDAR) is a remote sensing system used to collect information about the surface of the earth. LIDAR data are typically collected from an airplane equipped with a laser, GPS, internal navigation system, and computer (although it may also be collected via satellite or on the ground instrumentation). During the flight, the LIDAR sensor pulses a Stream Geomorphic Assessment Handbooks VT Agency of Natural Resources - E11 - May, 2009 narrow, high frequency laser beam toward the earth. The LIDAR sensor records the time difference between the emission of the laser beam and the return of the reflected laser signal to the aircraft. Numerous laser reflections over a set area may be are averaged and the resulting data point (elevation, orientation, and location) recorded. The combination of these spatial data (x, y, z) points creates what is known as a “point cloud” of information. As the LIDAR sensor collects data points, the location of the data are simultaneously recorded by a GPS sensor. The end product is accurate, geographically registered longitude, latitude, and elevation (x, y, z) positions for every data point. These "x, y, z" data points allow the generation of a highly accurate map of the earth’s surface (bare earth). Various types of post-processing techniques are usually performed on the point cloud to make the data more useful to various applications, such as the development of bare earth digital DEMs. LIDAR data represent a significant improvement in the accuracy of landshape information, in comparison to USGS topographic maps and 50-foot contour maps. A combination of field survey and LIDARassisted valley wall delineation will likely provide the most accurate data for the purposes of creating FEH maps. Where has LIDAR DATA been Collected in Vermont? Unprocessed LIDAR data (cloud-point) is available for Essex County, Vermont via NRCS data on the USGS website, “CLICK: The Center for LIDAR Information Coordination and Knowledge” http://lidar.cr.usgs.gov/ (also a useful website for more information on LIDAR and its derivatives). LIDAR data have been generated for most of Chittenden County. This data were collected by the Chittenden Metropolitan Planning Organization and Chittenden Regional Planning Commission in 2004. (For specific information on the process, costs, and accuracy of the data visit: http://www.ccmpo.org/assistance/imagery.html). The Chittenden County data are available from the University of Vermont Bailey Howe Library Map and Documents Department. The data are also available from the UVM Spatial Analysis Lab (http://www.uvm.edu/envnr/sal/) as well from the Vermont Mapping Program for a $150 per DVD of data (you can order either the raw cloud data, bare earth, or reflective layer information) (http://www.state.vt.us/tax/mappingproducts.shtml). The UVM Spatial Analyst Lab has already converted the Chittenden LIDAR data into a DEM with 3.2 meter resolution (the LIDAR data was captured in 3.2 meter square data grid) and a hillshade layer (which, similar to a topographic map, shades a certain slope thus creating a 3D-like image of the earth’s surface), which can be useful for valley wall verification. The download site for these files is: http://www.uvm.edu/~joneildu/downloads/Chittenden/. A small LIDAR dataset was created in 2007 to capture the Battenkill and Walloomsac/Roaring Branch in Bennington. This data is available at the Vermont ANR. ANR plans to collect LIDAR data for the Rock River watershed in Franklin County in 2008. Working with LIDAR and Other Tools in a GIS Environment LIDAR creates a high resolution scan of the earth surface, which can be used to derive a DEM, 2-foot elevation contour maps, and hillshade maps. The combination of these LIDAR-derived coverages, soils maps (to check that alluvial soils are present), ortho-photos, and, where available, high resolution aerial photographs provided by Microsoft’s online mapping program (http://www.maps.live.com) may provide enough information for a trained eye to delineate valley walls with a high degree of accuracy in most circumstances. LIDAR-derived information (specifically the hillshade layer) proved most useful to map valley walls where: (a) access is remote; (b) valleys are well defined; or, (c) where canopy cover prevents visual verification in the field. Stream Geomorphic Assessment Handbooks VT Agency of Natural Resources - E12 - May, 2009 There are numerous online mapping programs available that compile satellite and aerial photography together into a simple desktop viewing platform. The two most well known are GoogleEarth and LiveSearchMaps. While these tools help locate specific stream reaches, LiveSearchMap provides an added “birds eye view” feature. This feature provides a prospective view of the earth from that can be rotated 360 degrees. This feature helps to identify bedrock and other landforms, although it currently is only available for Chittenden County. Consider the following steps as you use the available LIDAR data in your effort to verify valley walls: 1. Contact UVM Spatial Analysis Lab to obtain LIDAR derived DEM, hillshade, and contour data layers. 2. Contact the county Regional Planning Commission to obtain digital ortho-photos (infrared and/or black and white), and if available, contour lines. 3. Download soils maps from VCGI. 4. Organize the data layers into an ArcMap project, and make a copy of the valley wall shape file. 5. Print field maps (ortho-photos with contour lines) of your project site. 6. Modify the valley wall shape file or delineate a new valley wall using the digital information, windshield surveys, and if available LiveSearchMaps. 7. Field verify where necessary. When is Field Verification for Valley Wall Mapping Necessary? Situations may arise where it will be difficult to rely solely on remote sensing data to determine where the toe of the valley wall is. For example, it may be difficult to determine the boundary conditions for a stream that is flowing through a broad valley that lacks distinct hillsides. Other examples include situations where the geology and soils are unknown for a particular reach, or where you do not know whether bedrock is present, which is difficult to ascertain using remote sensing. In such circumstances, valley wall determination will require field verification. III. Meander Center Line (MCL) and FEH Area Evaluating the Meander Center Line Before Developing the FEH Area The MCL may need to be modified before developing FEH areas. Review the meander center line (MCL) to verify that: 1. There is one MCL that passes though multiple reaches in any given stream or tributary. The ends of the polyline segments are snapped together; (if they are not, you will need to snap the segments together and complete the “union features” step); 2. The MCL does not pass through the field-verified valley wall; 3. The polyline nodes are placed at the current cross-over points of the stream. (You will need to pull up the most recent ortho-rectified aerial photos to check. The stream may have adjusted laterally since the VHD stream line had been drawn); and, 4. Make sure that the MCL is on the stream line when passing though stream crossings. If you are extending the MCL into a confined reach, have the MCL follow the stream line. An easy way to accomplish this step is to copy and paste the streamline feature for the confined reach into the MCL shape file. (Keep in mind that if the reach has a less confined section of river, the river may demonstrate a meander pattern that is influenced by the presence of alluvium parent material. If that is the case, the meander center line should connect the cross over point of the meanders at that location. Don’t forget to register modified MCL in the SGAT or Arcgis project before running the steps to create the FEH. Considerations When Modifying the FEH Area Stream Geomorphic Assessment Handbooks VT Agency of Natural Resources - E13 - May, 2009 If you are constructing an FEH area and are working in Arcview 3x, refer to the step-by-step instructions in Appendix J of the Stream Geomorphic Assessment Tools (SGAT) entitle, “Processing Steps for the Development of Fluvial Erosion Hazard Zones.” The Vermont ANR will release a tool for developing FEH area shape files in the Arcgis 9.2 platform in 2009. The automated FEH area shape file may require some modifications to more fully reflect local conditions or fix any anomaly to the shape file that resulted from the automation function. For example, local conditions may warrant extending the FEH area beyond the automated belt width. Pages 37-46 of Appendix J describe how to modify the FEH shape file. This section provides additional guidance to assist you in determining when to make a modification. Evaluate the FEH area using the following shape files: (a) soils, to see how the area compares to the portion of the valley containing alluvium parent material; (b) state special wetland inventory maps that can help to identify flood chutes, oxbow wetlands, and abandoned channels that could be accessed by the stream at a larger storm event; (c) topographic contour lines to help determine the degree of confinement, (d) black and white and color ortho-photos to evaluate land uses or help to identify existing man-made ponds or gravel pits in floodplains that could become captured by the stream during flooding; and, (e) FIT data — particularly bank armoring, mass failure, and migration impacts — to determine existing or potential fluvial erosion. Select one of the following reasons to describe the modification to the FEH area in the Description column of the modification shape file’s attribute table: Capture active channel: The FEH area may not be wide enough to capture the existing channel; Capture meander: The FEH area may not be wide enough to capture the existing channel at the meander bend; Smoothing at meander: The automation of the FEH area may result in anomalous bends at the meander bend. Smoothing the boundary at the bends aids in the administration of the FEH area; Evidence of active flooding: Low lying areas may become available to the river during the more frequent storm events (1-2 year discharge, such as a spring runoff event). This modification ensures that these areas are included as flood hazard areas; Evidence of an old channel: Abandoned channels may become reoccupied by the river at some time in the future. Consider including them in the FEH area, particularly if the channels are adjacent to the FEH area and are known to be hydrologically connected to the current channel and contain floodwaters during bankfull events; Evidence of old meander: Similar to old channels, consider adding oxbow wetlands and other old meanders that are adjacent to the FEH area and contain flow during bankfull events; High potential for bank erosion: There may be cases in which certain local conditions make bank erosion imminent, such as a recent removal of vegetation from the top of a bank or concentrated stormwater runoff that has been redirected over a bank toward the channel; Active bank erosion: The FIT data may identify stream banks that are actively eroding. If field evidence indicates active toe erosion and the presence of large mass wasting or bank failures, the FEH area should be modified to extend laterally, as appropriate, to provide some additional protection. Although it is difficult to predict without a slope stability analysis how far laterally a stream bank exhibiting a mass failure will retreat, the FEH area should be modified to include at least the top of the eroding bank; Smoothing at reach break: The automation of the FEH area occasionally produces anomalies at reach breaks that need smoothing. A common example occurs at reach breaks between fairly long reaches. The FEH area is built using the Phase 1 bankfull width (which typically is a function of the drainage size). If the subwatershed sizes and bankfull widths of the two adjacent reaches are very different, the meander belt widths will be significantly different. Smoothing will ensure a more gentle transition between reaches; Adjust anomalous shape: The automation of the FEH may produce anomalies. Consider modifications to facilitate the administration of the FEH area; Stream Geomorphic Assessment Handbooks VT Agency of Natural Resources - E14 - May, 2009 Encroachment: Occasionally, a modification will need to occur to recognize an encroachment. Consider a major road, for example. If it is highly unlikely that the major road will be moved at some time in the future due to the amount of development along that road, the road may become the boundary of the FEH area. Another example is a municipal waste water facility situated within the FEH area. Although new facilities should avoid FEH areas, modifications to the FEH may need to occur to recognize existing facilities. It is important to note that removing encroachments from the FEH area does not suggest that these buildings or roads are safe from damage caused by future flooding events; Correct shape file at tributary; The automation of FEH may produce anomalies at tributary confluences which will need to be modified; Capture a low-lying area, pond, or excavation pit: A modification may be necessary to recognize the added risk that the stream channel could capture a low lying area, pond, or excavation pit during a high flow event. This risk is particularly heightened if the depression is adjacent to the FEH area, and the elevation of the pond’s floor approaches or is below the elevation of the stream channel; and, Other (describe). This option provides the user the flexibility to describe a specific circum- stance that requires a modification to the FEH area. There are times when the FEH area is modified for administrative purposes. A community may request an administrative change to allow development within the FEH area along one side of the stream. Keep in mind that the width of the FEH area is based on the stream's meander belt width — the lateral extent of the river meanders in a stable condition, which is governed by the valley conditions, geology, stream type, and drainage area. Adjusting the location of the area to allow for certain land uses on one side of the stream, must not compromise the science that served as the basis for the development of the FEH area. Moreover, an adjustment to allow development on adjacent floodplain causes an incremental loss in flood storage. Reducing the meander belt width and loss in flood storage capacity will reduce the municipality’s resiliency to flooding, making it paramount that the municipality take action to protect its remaining floodplains. Consider allowing such adjustments if the following conditions are satisfied: The area can be extended an equal distance on the opposite bank to maintain the meander beltwidth necessary to accommodate fluvial and floodplain processes, as long as it remains within the valley wall; The adjustment will not result in implementing additional channelization practices, such as bank armoring, berming, dredging, or straightening; The adjustment does not create an unstable planform, such as "dog-leg" in the FEH area or a condition, in which the stream meander pattern is adjusted away from a more stable "down-valley" migration pattern and towards an unstable "cross-valley" meander configuration; and, Other key flood attenuation areas are protected from future encroachment. Stream Geomorphic Assessment Handbooks VT Agency of Natural Resources - E15 - May, 2009