1
Operator's Guide
Version 2.8.0
for Windows
Predictive Maintenance
Information System
Issue 2.2
Rovsing Dynamics A/S. Marielundvej 41. DK-2730 Herlev. Phone: +45-4690 7200. Fax: +45-4484 6040
www.rovsing-dynamics.dk - VAT No.: DK-1613 9084
Table of Contents
Note: When using the electronic version of the Guide, the page number
serves as a link to the section.
Table of Contents
1-1
Copyrights & Trademarks
1-3
1
Introduction
1.1
About this Operator's Guide
1.1.1
Conventions for this Guide
1.2
About OPENpredictor™
1.2.1
History and background
1.2.2
Present status
1.2.3
OPENpredictor™ main building blocks
1.3
Disclaimers
1-4
1-4
1-4
1-5
1-5
1-6
1-7
1-8
2
How to use OPENpredictor™
2-1
2.1
Opening the OPENpredictor™ User Interface Application
2-2
2.2
The OPENpredictor™ Menu Bar
2-4
2.2.1
Menus and their related toolbar icons
2-4
2.2.1.1
Measurement warning List Menus, Icon and Lamps
2-5
2.2.2
Customizing the OPENpredictor™ Menu Bar toolbars
2-6
2.2.2.1
Moving the Warning Indicator toolbars in the OPENpredictor™
Menu Bar
2-6
2.3
Warning systems
2-8
2.3.1
AutoDiagnosis™ Messages
2-9
2.3.1.1
How to react on a new AutoDiagnosis™ warning
2-9
2.3.1.2
Acknowledging and removing an AutoDiagnosis™
2-9
2.3.1.3
Predictive AutoDiagnosis™ messages
2-9
2.3.1.4
Instantaneous AutoDiagnosis™ (IAD) messages
2-11
2.3.1.5
AutoDiagnosis™ message explanation
2-13
2.3.2
Measurement warnings
2-15
2.3.2.1
Measurement warning 'types' and warning 'systems'
2-15
2.3.2.2
Measurement warnings overview table:
2-16
2.3.2.3
How to react on a new Measurement warning
2-16
2.3.2.4
Opening a Warning List
2-17
2.3.2.5
Acknowledging and removing a measurement warning
2-19
2.3.2.6
Reading Warning list details
2-19
2.3.3
The AutoDiagnosis™ and Warning Browser
2-21
2.3.4
Measurement warning indicators in Mimics
2-22
2.3.5
Maintenance Override Switch (MOS)
2-23
2.3.5.1
The 'MOS' flag
2-23
2.3.5.2
The 'Enabled' flag
2-23
2.3.5.3
Checking/changing the position of the 'MOS' and 'Enabled' flags 224
2.3.5.4
How to see which transducers are switched off
2-25
2.4
Reports
2-26
2.4.1
How to generate a Shift Report
2-27
2.4.1.1
Shift Report fields
2-28
How to generate a Management Report
2-29
2.4.2
Diagnostic report
2-30
2.4.3
Measurements Statistics report
2-30
2.4.4
Note Reports
2-31
2.4.5
Oil Analysis (special module)
2-32
2.4.5.1
Importing Oil report data
2-33
2.4.6
Reliability monitoring (special module)
2-34
2.4.6.1
Menu Bar indicator
2-34
2.4.6.2
The Downtime List
2-34
2.4.6.3
The RDM Report
2-34
2.4.6.4
The Machine Reliability Report
2-35
2.4.6.5
RDM machine Info
2-36
2.5
Mimics
2-37
2.5.1
Opening a Mimic
2-37
2.5.2
Working with a Mimic
2-39
2.5.3
How to make a Mimic Report
2-40
2008-11-20 OPENpredictor™ 2.8.0 Operator's Guide Issue 2.2 Page 1-1
2.5.4
Mimic menus and related toolbar icons
2-41
The Browser Window
2-42
2.6.1
Item/Measurement Selector
2-42
2.6.2
Floating menu
2-43
2.6.2.1
Displaying AutoDiagnosis™ messages for a machine (component)
2-44
2.7
Working with predefined plots
2-45
2.7.1
How to make a Single Plot Report
2-45
2.7.2
How to make a Multiple Plot Report
2-46
2.7.3
User defined plots
2-46
2.7.4
How to open a user defined plot
2-47
2.7.5
Navigation facilities of a plot
2-48
2.7.5.1
Zooming by selecting
2-48
2.7.5.2
Zooming, moving and scrolling using shortcuts
2-48
2.7.5.3
Zooming to fit to the actual data
2-48
2.7.5.4
Zooming out by a factor of 1/2
2-49
2.7.5.5
Scrolling the selection one grid-width using the mouse
2-49
2.7.5.6
Cursor position readout
2-49
2.7.5.7
The date & time format
2-50
2.7.5.8
Peak position readout
2-50
2.7.5.9
Changing data-period for a scalar plot window
2-50
2.8
Off-line data collector (special module)
2-52
2.8.1
Uploading the route to the data collector
2-52
2.8.2
Downloading the tour-data from the data collector
2-52
2.9
Bearing Wear Monitoring (special module)
2-53
2.9.1
Basic principles
2-53
2.9.2
BDC baseline calibration
2-55
2.9.2.1
Background
2-55
2.9.2.2
Reset Zero Gap / Recalculate BDC Baseline
2-55
2.9.2.3
Set Initial Wear
2-57
2.9.2.4
Explanation to the baseline calculations
2-58
2.9.2.5
Reset zero gap/Recalculate BDC Baseline – what happens?
2-59
Server starting and rebooting procedures
2-60
2.9.3
Starting/closing the OPENpredictor™ system
2-60
2.9.3.1
Start the Server Computer and software
2-60
2.9.3.2
Closing down the system
2-60
2.9.4
SPU rebooting procedures
2-61
2.9.4.1
Remote reboot of the SPU
2-61
2.9.4.2
On-site reboot of the SPU
2-62
2.9.4.3
On-site power cycling of the SPU
2-62
2.9.5
Stopping and restarting the Data Server only
2-62
2.9.6
How to verify that the System is operating properly
2-62
2.10 OPENpredictor™ System Hardware
2-64
2.10.1 The RO2000 Signature Processing Unit (SPU)
2-64
2.10.2 The RO2010 Communication Processor Module (CPM)
2-65
2.10.3 The RO2020 Signal Processor Module (SPM)
2-66
2.6
3
Glossary
3-1
4
Index
4-2
Document information
4-4
2008-11-20 OPENpredictor™ 2.8.0 Operator's Guide Issue 2.2 Page 1-2
Copyrights & Trademarks
This manual is copyright © 2001-2008 Rovsing Dynamics A/S, Denmark.
All rights, title and interest in the software, hardware and services detailed
in this document and all copyrights, patents, trademarks, service marks or
other intellectual property or proprietary rights relating thereto belong
exclusively to Rovsing Dynamics A/S.
No part of this manual may be reproduced or distributed in any form –
e.g. copied, transferred, printed or transcribed, by any manual, optical,
photographic, electronic or other means – without specific written
permission from Rovsing Dynamics A/S, Denmark.
OPENpredictor™ and AutoDiagnosis™ are trademarks of Rovsing
Dynamics A/S, Denmark. All other products or services mentioned in this
manual are identified by the trademarks, service marks, or product names
as designated by the companies who market those products. The
trademarks and registered trademarks are held by the companies
producing them. Inquiries concerning such trademarks should be made
directly to those companies.
2008-11-20 OPENpredictor™ 2.8.0 Operator's Guide Issue 2.2 Page 1-3
1
Introduction
OPENpredictor™ provides information about a wide variety of machinery
faults in order to minimise plant operation risk and prioritise maintenance
activities. OPENpredictor™ executes AutoMonitoring, AutoDiagnosis™,
AutoForecasting and AutoReporting, to inform the users of current and
potential machine problems. The users can pre-define reporting both for the
daily shift operators for short-term action and for maintenance management
to prioritise activities.
Definitions and acronyms: see chapter 3 'Glossary'.
1.1
About this Operator's Guide
The contents of this document provide guidance to the plant operators about
the actions they may need to execute with the OPENpredictor™ Predictive
Maintenance Information System (PMIS).
Furthermore, the managers legally responsible for the use of the system
must read and accept the content of section 1.3 Disclaimers and the
'Copyrights & Trademarks' notice above.
A comprehensive description for the total system, intended for the experienced Condition Monitoring expert, can be found in the 'User Manual'.
This manual covers all versions of the OPENpredictor™ system. If you
for example have not bought the AutoDiagnosis™ module, these functions
are not displayed in the OPENpredictor™ user interface. Please disregard
them when reading the manual!
OPENpredictor™ contains functions that are accessible in this version but not
described in any of the manuals delivered with the system. Such functions
shall be regarded as non-existent, as they are only for use by the personnel
of Rovsing Dynamics A/S, its distributors or service partners.
1.1.1
Conventions for this Guide
The character sequence: 'menu Xxxx > Yyyy' means: click on menu item
Xxxx and open submenu item Yyyy (= select menu Xxxx, submenu Yyyy).
•
Bulleted lists indicate alternatives to be selected from (unless otherwise specifically indicated), – or simply a list.
1.
Numbered lists represent a set of ordered steps to be followed, oneby-one.
[Button-name] represents a Windows button with the caption 'Buttonname'.
½
'Key-name': The key 'Key-name' on the PC-keyboard.
'Field-name': The field 'Field-name' in a Windows window.
<descriptive text>: the <> field is to be replaced by the relevant text as
described. Example: menu 'Filter Column' > '<column name>' could be
•
menu 'Filter Column' > 'Value', or
•
menu 'Filter Column' > 'State'.
2008-11-20 OPENpredictor™ 2.8.0 Operator's Guide Issue 2.2 Page 1-4
1.2
About OPENpredictor™
OPENpredictor™ 2.8.0 is an automatic Predictive Maintenance Information
System (PMIS), advancing traditional 'Condition Monitoring' (CM) to the next
level for Predictive Maintenance. The system identifies and forecasts potential
machinery problems on a wide range of rotating and stationary machinery
components, typically encountered in power plants and other continuous
operating process industries.
1.2.1
History and background
Historically, the experienced and skilled mechanic or engineer would listen to
his machines, put his hand on the machines to sense its vibrations and kept
an eye on simple parameters like flows and temperatures. He would then use
his experience to judge the machine health and possibly diagnose an existing
problem. No historic data was present so fault prediction was difficult. This
created the need to record data in order to manually identify trends over
time.
As technology developed this engineer was supported by 'Condition Monitoring' (CM) systems that provided registration of condition related measurements (typically vibration values) on paper rolls and providing basic alarming
in the control system for shutdown actions. The tedious routine work to analyse enormous amounts of mostly redundant data was typically done by a
vibration expert. Typically the data investigation was carried out when
strange phenomena were encountered on routine plant inspections or when
alerts or alarms were identified at the control system. Diagnostic analysis to
investigate why a vibration was high was not integrated into the systems so
(trans)portable vibration analysers were used to analyse vibration signals.
The next generation of CM systems integrated diagnostic measurements such
as vectors, orbits and frequency spectra. When warnings occurred on basic
condition parameters such as overall vibration levels, bearing temperatures
and casing expansion the system would execute the diagnostic
measurements. The vibration specialist used these diagnostic measurements
for trouble shooting in order to explain why vibration was high. Later it
became possible to periodically collect and store the diagnostic data, so
trends of some fault phenomena could manually be retrieved from a
database. The drawback of this 'traditional approach' was that not many
machine faults (cause of problems) were being monitored, rather a range of
derivative parameters (effect of problems) which resulted in late warnings
and a limited number of machine faults actually being monitored. The term
'post mortem' analysis was created as typically the analyses were carried out
after a machine had failed in order to investigate why it had happened.
The reliability of automatic warnings was therefore inadequate for early fault
detection and fault forecasting, both prerequisites for Predictive Maintenance.
This therefore called for a new pro-active approach.
2008-11-20 OPENpredictor™ 2.8.0 Operator's Guide Issue 2.2 Page 1-5
1.2.2
Present status
The present OPENpredictor™ Predictive Maintenance Information System
(PMIS) Version 2.8.0 provides AutoDiagnosis™, which eliminates the need for
periodical data analysis to be done by the Condition Monitoring specialist as
the data-evaluation and interpretation, is completely automated. The tasks
left to the CM specialists are reduced to system control, evaluation of warnings and AutoDiagnosis™ Messages with fault-predictions – and ultimately
the maintenance planning. System operation can be taken over by the
operators of the machinery. When an AutoDiagnosis™ Message appears on
the PC-screen a machine problem is identified. For gradually developing
problems the 'Predictive AutoDiagnosis™' Message identifies approximately
when the problem will become serious, days, weeks or even months ahead.
This makes it possible to plan corrective tasks on that specific component to
the best economical period – or ultimately during a planned stop.
For changes in the dynamic behaviour of the machine where no experience
exists yet, a warning will be issued without AutoDiagnosis™ Message in order
to minimise operation risk. For vibration experts all the traditional tools for
manual machine analysis are present such as, Multiple Trend Analysis, 3-D
AS (AutoSpectrum) Waterfall plot, Nyquist analysis, Orbit and Shaft Centre
Line analysis.
OPENpredictor™ automatically compares actual values and 'signatures' (i.e.
vibration spectra and transient curves) with reference signatures measured
under defined 'machine states': Run-up, Coast-Down, Idle, Low load, High
Load, Full Load, etc. to identify fault symptoms. Data comparison is executed
under pre-classified operation conditions to compensate for RPM, load, temperature, etc. variations. Classification by 'Machine State' is essential to avoid
false warnings, improve fault identification sensitivity and create realistic
forecasts. Identified changes in the machine behaviour are then automatically
used as basis for AutoDiagnosis™ and AutoForecasting. An AutoDiagnosis™
prediction is based on complex calculations using many parameters from
different sensors. Historic measurement data is also available for AutoDiagnosis™ verification and troubleshooting.
The measurement results can be presented graphically in real time, including
warning levels ('Alert' and 'Alarm') for 'traditional' interpretation. All information may be included in Shift Reports for short-term actions and Management
Reports for long-term maintenance planning.
In this way, OPENpredictor™ has automated machine fault identification and
prediction, stating in clear text which machine problems have been identified
and when inspection or maintenance is advised. OPENpredictor™ is consequently a very useful tool to identify operation risk and schedule corrective
actions. The information is used to reduce
•
Unforeseen breakdowns
•
Scheduled downtime for time based maintenance tasks
•
Repair and maintenance costs
For further information about the philosophies behind OPENpredictor™ and
Condition Monitoring basics, etc. see the OPENpredictor™ User Manual
chapter 2 "General system description" and 7 "Bibliography".
2008-11-20 OPENpredictor™ 2.8.0 Operator's Guide Issue 2.2 Page 1-6
1.2.3
OPENpredictor™ main building blocks
The OPENpredictor™ PMIS system typically consists of:
•
A variety of transducers mounted on/inside the machines converting
physical parameters to electrical signals from which health information
will be extracted. Existing transducers (pre)mounted on the equipment
are used as far as possible.
•
Signal Processing Units (SPU) for processing transducer signals into fault
selective 'signatures'. The signal from a single transducer is often
transformed into many dedicated 'signatures', for example amplitude
and phase for harmonics, Autospectrum, Envelope Spectrum, etc., to
enhance fault detection sensitivity and selectivity.
Identified changes in these signatures are transferred to the
OPENpredictor™ Server for storage and automated interpretation by
'AutoDiagnosis™ Methods'.
•
The OPENpredictor™ Server. This is a PC operating on Windows 2000
Pro, 2003 Server or XP Pro. It receives processed data from the SPUs.
Data is saved in an Oracle relational database. The OPENpredictor™
system software runs on the Server in English.
•
The User Interface Applications (UIA) running on Windows 2000 Pro,
2003 Server or XP. PC -workstations for displaying warnings, predictions
and AutoDiagnosis™ Messages, etc. The UIA is available in different
languages.
2008-11-20 OPENpredictor™ 2.8.0 Operator's Guide Issue 2.2 Page 1-7
1.3
Disclaimers
The OPENpredictor™ system is only intended for providing information about
machinery faults under development. Rovsing Dynamics A/S, its suppliers,
distributors and subcontractors will under no circumstances accept any
liabilities for any mental or physical injuries, any losses or any damage on
anybody's property (incl. personal belongings, equipment and buildings and
their surroundings in the widest sense) due to the use of any part of the
system.
It is the full and sole responsibility of the corporation/organization/person in
charge of the use of the equipment, to ensure that each person using
OPENpredictor™ has been properly trained. This responsibility includes: •
Giving sufficient instructions to all relevant persons concerning all safety
related matters in general, and in particular as described in manuals for
the equipment, on the equipment and in/on manuals, packages and
safety sheets for consumables, incl. manuals and packages from third
party suppliers.
•
Ensuring that all safety related instructions given in manuals for the
equipment, on the equipment and in/on manuals, packages and safety
sheets for consumables – including the manuals and packages from third
party suppliers – are followed carefully.
•
Keeping all untrained persons – especially children – and animals safely
away from all equipment and chemicals (to be) used for the
OPENpredictor™ system.
Rovsing Dynamics A/S, its suppliers and subcontractors will under no
circumstances accept any liability for any physical or mental injuries, any
losses or any damage on anybody's property (incl. personal belongings,
equipment, buildings and their surroundings in the widest sense) due to: •
The use of the OPENpredictor™ system, including wrong fault diagnosis
or any kind of transducer or transducer system fault and its consequences.
•
Products manufactured by means of systems using the OPENpredictor™
system.
•
The design and manufacturing of third-party equipment included in or
connected to the OPENpredictor™ system.
•
The (lack of) information contained in manuals for the OPENpredictor™
system and equipment manufactured by third parties, incl. safety related
matters. The content – incl. safety related warnings and instructions – of
manuals for equipment from third party manufacturers is solely the
responsibility of the vendor/manufacturer of this equipment.
•
Failure to follow or comply with any safety related instruction given in
manuals for the equipment used for or connected to the OPENpredictor™
system, on the equipment and in/on manuals, packages and safety
sheets for the consumables – incl. manuals and packages from third
party suppliers.
2008-11-20 OPENpredictor™ 2.8.0 Operator's Guide Issue 2.2 Page 1-8
2
How to use OPENpredictor™
The user interface is described in section 2.2. It gives access to a number
of visualizing tools:
•
Warning messages, see section 2.3. When a combination of measurements over time indicates, that a mechanical failure is on its way, a
warning message appears on the user interfaces, either as an AutoDiagnosis™ message window or as a flashing warning 'lamp' on the user
interface main panel. The warning system is described in section 2.3.
•
Reports, see section 2.4: Maintenance management reports, shift
reports, plot reports, etc.
•
Mimics, see section 2.5: Interactive graphics with selected measurements and alarms.
•
Browser, see section 2.6: The browser gives access to the details about
each item (plant, machine, transducer, etc.) and each measurement with
links to plots, AutoDiagnosis™ per machine and configuration data. The
Browser is mainly aimed at the 'condition monitoring' specialist.
•
Plot Manager, see section 2.7. Data can be presented in a large variety
of plots, mainly aimed at the 'condition monitoring' specialist.
Off-line data collection (optional) is described in section 2.8.
Restart of the on-line data-collection system is described in section 2.9.
Description of the hardware (the intelligent data-logger) is provided in
section 2.10.
2008-11-20 OPENpredictor™ 2.8.0 Operator's Guide Issue 2.2 Page 2-1
2.1
Opening the OPENpredictor™ User
Interface Application
IMPORTANT: Before opening the OPENpredictor™ User Interface
Application, all the OPENpredictor™ Servers top be used must be
running if the User Interface is to be used online. (But the OPENpredictor™ User Interface Application can run offline without the
Servers.)
About starting the Servers, etc., see section 2.9.
The SPU (see section 2.10) may be restarted without restarting the
Servers and the User Interface Application.
1.
icon to start the OPENpredictor™ User
Double-click the
Interface Application. This opens a 'Work Console' window, from where
the OPENpredictor™ User Interface Application is started. It may take a
minute or more to start, depending of the number of warnings present.
When completed the 'OPENpredictor login' window is displayed: -
2.
Type your User ID, (for example 'John') and your Password (for example
'wàeY38.9u1'). Note: The Password is case sensitive.
To change your Password:
3.
1.
In the login window: After
entering a valid User ID +
Password combination – but
before clicking [OK]: Click the
icon to open the 'User Configuration' window.
2.
Enter the new password in
'Password' (max. 32 characters)
and repeat it in 'Confirm
Password'.
3.
Click [OK] to change the Password.
In the login window click [OK] to continue.
2008-11-20 OPENpredictor™ 2.8.0 Operator's Guide Issue 2.2 Page 2-2
4.
When the Password session has been completed correctly, the
OPENpredictor™ Menu Bar opens (this may also take some time):
5.
Check for new measurement warnings (see section 2.3.2): If any
'traffic lights' ar flashing, click
for opening the warning list.
6.
Check for new AutoDiagnosis™ messages (see section 2.3.1):
Select
•
(menu 'Browse' > 'AutoDiagnosis list') for Predictive
AutoDiagnosis™,
AND
•
(menu 'Browse' > 'Instantaneous AutoDiagnosis list') for
Instantaneous AutoDiagnosis™.
IMPORTANT:
Autodiagnosis messages are not indicated trough the warning 'traffic
lights'.
Tip:
To see a short explanation of an icon, hold the mouse pointer over the icon
for a short time: -
Important !
Do NOT close the
'Work Console' window (shown
below), as this will terminate the OPENpredictor™ User Interface Application. OPENpredictor™ uses – among other things – this window for displaying system, log and error messages. It is however OK to minimise the
window.
2008-11-20 OPENpredictor™ 2.8.0 Operator's Guide Issue 2.2 Page 2-3
2.2
The OPENpredictor™ Menu Bar
The OPENpredictor™ Menu Bar is the basic control centre for the OPENpredictor™ system. Measurement warnings (see section 2.3.2) are indicated
here by a flashing warning 'lamp'. AutoDiagnosis™ warnings (see section
2.3.1) will pop-up as a separate window and are not indicated via these
'traffic lights'.
The buttons and warning lamp sections displayed are selected from the 'View'
> 'Toolbars' menu.
To make sure the Menu Bar is always visible on the pc monitor screen, use
the menu 'Tools' > 'Options' > 'Always on top'.
2.2.1
Menus and their related toolbar icons
Note: Some menus and tools, available with certain specialist user login
rights, are only shown in the 'User Manual' section 5.1. Menus related to
special installation configurations could be mentioned here, but now shown.
Menu
File
View
–
Browse
Icon
Submenu
Exit
Toolbars
Warning
History list
AutoDiagnosis
and Warning
Browser
Browser
Mimic Viewer
Plot Manager
AutoDiagnosis
List
3rd level submenus and explanations
Close the OPENpredictor™ application.
Select/deselect the File, Browse, Tools,
Warnings (> 'Operation', 'Maintenance',
'Performance', 'Offline', 'RDM', 'MOS',
'System' warning group) items to be
displayed. See section 2.3.2.1.
Toolbar icon: 'All Warnings' list.
Menu: Complete Warning History List.
Submenus: 'Performance', 'Maintenance',
'Operation', 'Offline', 'RDM', 'System', 'All'.
Deeper submenu level, e.g., 'Alert',
'Alarm', 'System', 'All'. See section
2.2.1.1.
Opens the 'AutoDiagnosis and Warning
Browser', see section 2.3.3.
Open: Open the 'Browser', see section
2.6.
Find: Open the Browser 'Find' window.
When an item is selected, the Browser
opens with the item selected.
Open: Open the 'Mimic Viewer'. See
section 2.5.
Find: Open the Mimic Viewer 'Find'
window. When an item is selected, the
Mimic Viewer opens with the item
selected.
Open the 'Plot Manager' window. The plot
must then be selected. See section 2.7.
Open the Predictive Auto Diagnosis™ List.
Contents: see section 2.3.1.5.
2008-11-20 OPENpredictor™ 2.8.0 Operator's Guide Issue 2.2 Page 2-4
Instantaneous
AutoDiagnosis
List
MOS
Report
Tools
Help
Open the Instantaneous Auto Diagnosis™
List. Contents: see section 2.3.1.5.
Maintenance Override Switch list.
Equivalent to clicking the MOS button in
the Tool Bar, see section 2.2.1.1.
Shift Report Open the Shift Report Generator. See
section 2.4.1.
Open the Management Report Generator.
ManageSee section 0.
ment Report
Import Oil Data Used with the special module 'Oil analysis'.
See the 'Operators Guide' section 2.4.6.
Routes
Open the Route MMI for handling of
Routes for off-line data collection. See
section 2.8.
Options
•
'Always on top': When checkmarked
;, the 'MMI main panel' always stays
on top of the screen in front of all
other windows.
•
'Beep when warning': Checkmark ;
for making a beep in the PC
loudspeaker in case of a new warning.
•
'Beep when AutoDiagnosis message':
Checkmark ; for making a beep in the
PC loudspeaker in case of a new
AutoDiagnosis™.
•
'Display milliseconds': ; for displaying
milliseconds in tables, mimics and
plots. Else integer seconds are
displayed.
•
'OTA option' > 'Phase lead'/'Phase
lag': Sign of phase in OTA measurements. Default: Phase lag.
•
'Unit system': Select 'Metric', 'USA',
'Imperial', or 'SP' (SP = metric with
acceleration in G, etc.).
Contents
Open the on-line help (this manual).
About
Display the window with information about
the current version of OPENpredictor™.
If a menu is not enabled (grey text), or if it's not displayed, its function is
currently not available.
2.2.1.1
Measurement warning List Menus, Icon and Lamps
Measurement warnings and how to work with them are described in section
2.3.2.
Icon
Menu
All
System
Operation
Submenus and explanations
Click to open a list of all actual warnings.
See section 2.2.2.1.
System = SPU System warning.
An SPU has lost the connection.
In the 'System' group click
(blue) to
display a list of all SPU system warnings.
Warnings for problems that would require
an action within a one or two shift period. In
the 'Operation' group:
All:
Click 'All' to display a list of all
Operation warnings.
Alarm: Click
(red) to display a list of all
Operation Alarm warnings.
Alert:
Click
(yellow) to display a list of
all Operation Alert warnings.
System: Click
(blue) to display a list of
all Operation System warnings.
2008-11-20 OPENpredictor™ 2.8.0 Operator's Guide Issue 2.2 Page 2-5
Maintenance Warnings for changes in machine behaviour
related to maintenance activities. In the
'Maintenance' group:
All:
Click 'All' to display a list of all
Maintenance warnings.
Alarm: Click
(red) to display a list of all
Maintenance Alarm warnings.
Alert:
Click
(yellow) to display a list of
all Maintenance Alert warnings.
System: Click
(blue) to display a list of
all Maintenance System warnings.
Performance Warnings related to efficiency reduction or
process problems of a machine. In the
'Performance' group:
All:
Click 'All' to display a list of all
Performance warnings.
Alarm: Click
(red) to display a list of all
Performance Alarm warnings.
Alert:
Click
(yellow) to display a list of
all Performance Alert warnings.
System: Click
(blue) to display a list of
all Performance System warnings.
Offline
Warnings from offline measurements for Oil
Analysis. In the 'Offline' group:
All:
Click 'All' to display a list of all Oil
Analysis warnings.
Alarm: Click
(red) to display a list of all
Oil Analysis Alarm warnings.
RDM
MOS
RDM= Reliability Data Management.
Alert:
Click
(yellow) to display a list of
all machine stops (scheduled and
unscheduled).
System: Click
(blue) to display a list of
all RDM System warnings.
MOS = Maintenance Override Switch.
Displays the number of transducers, where
the 'MOS Flag' is set.
In the 'MOS' group click
(red) to display a
list of all MOS marked transducers. See
section 2.3.5.
The number to the right of each warning 'lamp' is the number of actual
warnings to be found in the Warning List for this group.
2.2.2
Customizing the OPENpredictor™ Menu Bar
toolbars
To change which toolbars are displayed in a user interface window, select the
menu View > Toolbars (there may be further levels). Then select or deselect
the toolbars as desired.
The settings are saved per user (specified by the 'User ID'). This means that
each user can have her or his own personal toolbar setting.
2.2.2.1
Moving the Warning Indicator toolbars in the OPENpredictor™
Menu Bar
The Warning Indicator Blocks can become individual windows: To transform a Warning Indicator Block into an individual floating window,
click inside the group – except on any button – and drag the group out:
2008-11-20 OPENpredictor™ 2.8.0 Operator's Guide Issue 2.2 Page 2-6
When released, it is a separate window and not any longer shown in the
Menu Bar:
To put it back at the end of the Menu Bar: close the separate window by
button.
clicking its
2008-11-20 OPENpredictor™ 2.8.0 Operator's Guide Issue 2.2 Page 2-7
2.3
Warning systems
There are two types of warning indicators: •
AutoDiagnosis™ Messages. See section 2.3.1.
•
'Measurement Warning' 'traffic light' type indicators in the Menu
Bar with links to Warning Lists, see section 2.3.2. Selected 'measurement warnings' may be shown in Mimics, too, see section 2.3.4.
An overview of AutoDiagnosis™ messages and measurement warnings is
shown in the 'AutoDiagnosis™ and Warning Browser', see section 2.3.3.
IMPORTANT !
AutoDiagnosis™ warnings are NOT signalled by the 'traffic light'
system. To check for them, click
and
, or use the 'AutoDiagnosis™ and
Warning Browser'
To send a beep to the PC loudspeaker at: •
A new AutoDiagnosis™, checkmark the OPENpredictor™ main panel menu
'Tools' > 'Options' > Beep when AutoDiagnosis message'
•
A new measurement warning, checkmark the OPENpredictor™ main panel
menu 'Tools' > 'Options' > Beep when warning'
OPENpredictor™ identifies changes in the dynamic behaviour of machines
using automated signature (see chapter 3) comparison. OPENpredictorTM will
issue an AutoDiagnosis™ Message for identified changes incorporated into the
AutoDiagnosis™ Fault Library.
For gradually developing faults a prediction will be given. This is called
Predictive AutoDiagnosis™; see section 2.3.1.3.
For faults with an intermittent character no prediction can be specified so
only the fault diagnosis will be available. This is called Instantaneous
AutoDiagnosis™; see section 2.3.1.4.
To see a list of possible AutoDiagnosis™ (both types):
1.
2.
3.
Open the Browser (click
).
Right-click the unit (for example plant, machine or machine component).
Select the floating menu 'View AutoDiagnosis Messages' or 'View
Instantaneous AutoDiagnosis Messages' to display a list of
AutoDiagnosis™ for the unit selected.
For identified changes not incorporated into the AutoDiagnosis™ Fault
Library, warnings will be issued via the Measurement Warning Indicators
(the 'lamps' on the OPENpredictor™ main panel). These warnings have to be
investigated manually. Rovsing Dynamics can offer this analysis as a remote
service.
2008-11-20 OPENpredictor™ 2.8.0 Operator's Guide Issue 2.2 Page 2-8
2.3.1
AutoDiagnosis™ Messages
2.3.1.1
How to react on a new AutoDiagnosis™ warning
AutoDiagnosis™ Message windows pop up automatically when a potential
fault related to a defined AutoDiagnosis™ has been identified.
The advised reaction is to follow the recommendation!
If no recommendation is given: Inform – dependent on the
type of fault reported – the Operation or Maintenance
Department management and seek advice.
Note: the local person in charge of the OPENpredictor™ system can define
the AutoDiagnosis™ 'Recommendation' messages. Consequently, neither
Rovsing Dynamics A/S nor its local representative has any responsibility for
the content of these messages.
There are two types of AutoDiagnosis™ messages:
•
Predictive AutoDiagnosis™ messages: displayed when a gradually
developing fault has been identified and reached a defined fault strength.
Example: A specific vibration pattern during full load combined with a gear
lubrication oil temperature. See section 2.3.1.3 for a detailed description.
•
Instantaneous AutoDiagnosis™ messages: displayed when a specific
parameter for a short period of time has exceeded the warning limit set.
Example: Vibrations due to a rub. See section 2.3.1.4 for a detailed
description.
For further details of how to read the fields see section 2.3.1.5.
2.3.1.2
Acknowledging and removing an AutoDiagnosis™
When an AutoDiagnosis™ is acknowledged it remains on the list until the
AutoDiagnosis™ data moves into the next region of severity (Detected,
Predicted, Action Required) – which causes a new AutoDiagnosis™.
When the data is back in the normal range (for example because the problem
has been solved), the AutoDiagnosis™ system will automatically detect it and
remove the acknowledged AutoDiagnosis™ messages for this fault.
2.3.1.3
Predictive AutoDiagnosis™ messages
Predictive AutoDiagnosis™ messages are labelled 'AutoDiagnosis messages'.
They are per standard calculated every 24 hours based on the measurements
from the last 24 hours compared with the development in the past. They are
most often intended for the maintenance people.
To open the window with a list of all activated predictive AutoDiagnosis™
Messages select the menu 'Browse' > 'AutoDiagnosis List' on the
OPENpredictor™ Menu Bar.
2008-11-20 OPENpredictor™ 2.8.0 Operator's Guide Issue 2.2 Page 2-9
For details about the fields in the (predictive) AutoDiagnosis™ Message
Window, see section 2.3.1.5. The information provided is: •
'Location' and 'Component' - identify where the fault has been
diagnosed.
•
'Diagnosis' - identifies what the fault is. The numbers in parentheses
above the field are internal codes for the text strings displayed.
½
'Prediction' - identifies
•
Date of Diagnosis: the date and time of this AutoDiagnosis™.
•
How soon the fault is predicted to become serious:
•
Nominal Prediction: The expected development of the fault
using the standard extrapolation algorithm.
•
Early/Late Prediction: The variation to the best estimate using
the standard confidence level for the forecast.
•
The AutoDiagnosis™ Message is issued at three Symptom Strength
levels indicated by the background colour of the icon:
Detected As soon an incipient fault is detected by the AutoDiagnosis™ system, the DETECTED message is issued.
However, it's still too early to predict the date when the
fault will become severe with a reasonable confidence.
Predicted The Symptom Strength has developed to a level where
•
its history can provide a statistical model for future
development, and
•
the date at which the fault strength will become
severe can be predicted,
the PREDICTED message is issued.
Action
The Symptom Strength for <value> or <acceptable
Required predicted time to fault> has developed to a level, where
ACTION REQUIRED warning is issued. At this level an
action is required, for example an inspection and/or a
preventive maintenance task.
•
'Recommendation' - identifies for the user the particular fault and the
actions that are required. Local users with 'AutoDiagnosis™
Recommendation' rights may edit the content of recommendation field.
•
'Confidence' - identifies the certainty of the prediction: - 'None', 'Low',
'Significant' or 'High'.
2008-11-20 OPENpredictor™ 2.8.0 Operator's Guide Issue 2.2 Page 2-10
•
'Status' – [Accept] – 'By' - is used to identify that an AutoDiagnosis™
has been accepted (acknowledged), acknowledge it, and by whom. See
section 2.3.1.2.
To view the symptom history and forecast, click on 'Plot Manager'. This
launches the Default plot for the prediction.
To display/close a list of all the current predictive AutoDiagnosis™ Messages,
click [More]/[Less]: -
To display a specific AutoDiagnosis™ Message, select it by clicking it.
2.3.1.4
Instantaneous AutoDiagnosis™ (IAD) messages
Instantaneous AutoDiagnosis™ messages are calculated continuously whenever there is a change in the related parameter(s) at the relevant machine
state(s). They are mainly intended for the operation people and they often
require a fast response.
To open the window with a list of all activated Instantaneous AutoDiagnosis™
Messages select the menu 'Browse' > 'Instantaneous AutoDiagnosis List' on
the OPENpredictor™ Menu Bar.
The instantaneous AutoDiagnosis™ message window has fewer fields than
the Predictive AutoDiagnosis™ messages. The explanations to the fields are
the same as for Predictive AutoDiagnosis™ messages except the 'Warning
Level' field, which can have the following messages:
2008-11-20 OPENpredictor™ 2.8.0 Operator's Guide Issue 2.2 Page 2-11
Detected
As soon an incipient fault is detected by the AutoDiagnosis™ system, the DETECTED message is issued.
Action
Required
If the Symptom Strength develops to this level, the
ACTION REQUIRED warning is issued. At this level an
action is required, for example an inspection and/or
maintenance work.
The reason for creating this special type of AutoDiagnosis™ messages is the
nature of the development of Instantaneous AutoDiagnosis™ faults, which
makes predictions for the time of a serious breakdown impossible.
Like the Predictive AutoDiagnosis™ messages clicking [More]/[Less] will
display/hide a list of all current Instantaneous AutoDiagnosis™ messages: -
How to get a survey over all AutoDiagnosis™ messages for a machine,
see section 2.6.2.1.
2008-11-20 OPENpredictor™ 2.8.0 Operator's Guide Issue 2.2 Page 2-12
2.3.1.5
AutoDiagnosis™ message explanation
Predictive AutoDiagnosis™ window. The Instantaneous AutoDiagnosis™
window is similar with the differences specified below.
Fields/buttons – AutoDiagnosis™ message area: Field/button Explanation
Location
Identification of the Machine (Section) with the pending fault
Component
Name of the Machine Component with the pending fault
Alarm level 2) 'Detected' or 'Action Required'. See section 2.3.1.4 for
definitions.
Diagnosis
Description of the diagnosed fault
Prediction 1)
Line 1: The date/time the diagnosis was made.
Line 2: Always: "Prediction of Required Action Level:"
Line 3: If possible: The nominal time from now where the
problem is predicted to become severe.
Line 4: As line 3, but the earliest predicted time.
Line 5: As line 3, but the latest predicted time.
The earliest and latest time depends on the confidence level
set for the calculation. The values may be negative!
RecommenThe text in this field is user-defined, possibly entered by the
dation
local system administrator. The intention is to tell the plant
operator which action to take in case of a specific fault
diagnosis at a particular AutoDiagnosis™ Message level.
Confidence 1) A statistical classification for the confidence of the diagnosis.
Levels:
• None
• Low
• Significant
• High
Date 2)
The date/time the diagnosis was made.
Status:
'Accepted by User ID' of the person who accepted the
message or 'Not accepted' (= not acknowledged).
Accept
Click to accept (= acknowledge) by the person logged in.
Browser
Click to display the Browser with the item selected, which
initiated the AutoDiagnosis™.
Plot Manager Click to display a plot showing the history of the symptom
development and a prediction (with statistical confidence
levels) of further development.
More / Less
Open/Close the 'Pending Faults' list, see below.
Close
Close the AutoDiagnosis™ window.
1
) Only in the Predictive AutoDiagnosis™ window.
2
) Only in the Instantaneous AutoDiagnosis™ window.
2008-11-20 OPENpredictor™ 2.8.0 Operator's Guide Issue 2.2 Page 2-13
Columns – 'Pending Faults' list: Field
Explanation
Fault
The problem.
Level
The severity level of the problem. Levels:
•
Detected
•
Predicted
•
Action Required
Date
Machine
Mach. Section
Component
For definitions see section 2.3.1.3.
The date and time of the diagnosis.
Name of the machine with the pending fault.
Name of the machine section with the pending fault.
Name of the machine component with the pending
fault.
2008-11-20 OPENpredictor™ 2.8.0 Operator's Guide Issue 2.2 Page 2-14
2.3.2
Measurement warnings
Measurement warnings are shown by 'traffic light' indicators in the Menu Bar.
The warnings may be investigated by means of Warning Lists giving directly
access to the related measurement data. Some of these bars may be hidden,
see section 2.2.2.
The flashing Warning Indicators shows that there are unacknowledged
measurement warnings of the related type (System, Operation, Maintenance,
Performance, Offline, RDM / Alarm, Alert, System), see section 2.3.2.1. The
MOS indicator doesn't flash as it only warns for deactivated transducers.
The number to the right of a measurement Warning Indicator shows the
actual number of different warnings in the Warning List from this particular
group. The number at the MOS (Maintenance Override Switch) indicator
shows the number of transducers in MOS or 'not Enabled' mode.
Clicking on a measurement Warning Indicator opens the related 'Actual
Warning List' (see below). The 'Actual Warning List' shows only one – the
most severe – alert or alarm per measurement and per machine state (runup, idle, full load, etc.). An alert or alarm for a particular measurement can
only be assigned to one group 1 . See also section 2.2.2.1.
2.3.2.1
Measurement warning 'types' and warning 'systems'
OPENpredictor™ has three types of measurement warnings with related
colours: Red
Alarm ('Action Required') warnings: the 'alarm' limit has been
passed.
Yellow Alert warnings: the 'alert' limit has been passed.
Blue
System warnings: warning for system functionality, see 2.3.2.2.
Warnings are divided into five Warning Systems (groups):
System: General System warnings (only
is lost.
) that the connection to the SPU
Operation: Warnings for problems that require action within a one- or twoshift period.
Maintenance: Warning for long-term maintenance planning.
Performance: Warning about reduced machine efficiency or process
problem.
RDM: Warnings about 'Reliability Data Management', which is a special
module for certain applications. See section 2.4.6
1
For example: if measurement m1 has an outstanding alert (yellow) and a
more severe alarm (red) is encountered for the same measurement, the
number of alerts in the Alert group will be decreased, and the number of
alarms in the Alarm group will be increased.
2008-11-20 OPENpredictor™ 2.8.0 Operator's Guide Issue 2.2 Page 2-15
Offline: Warnings originating from offline Oil Analysis measurements, which
is a special module for certain applications. See section 2.4.5.
MOS: Maintenance Override Switch warnings (only
): The 'Maintenance
Override Switch' flag is set for one or more (the number) transducers.
MOS warnings and how to handle them are described in more details in
section 2.3.5.
In the OPENpredictor™ Menu Bar, the number of warnings in each group is
displayed next to each warning 'lamp'.
2.3.2.2
Measurement warnings overview table:
Function
System
Alarm
Alert
Operation
Operator action
required, improving
operation and
minimising risk. AD
Inspection or
maintenance to be
scheduled (action
required). AD
Pre-warning for
operator. AD
Maintenance
Performance
RDM*) See
section 2.4.6
System
The connection to
the SPU has been
lost.
Inspection or longterm maintenance
The range limit for
to be defined. AD
the transducer or
the measurement
Performance proPerformance
has been passed,
blem has passed the problem to be
related to this
AD
acceptable level
investigated.
function.
AD
(action required).
Machine stops.
RDM = Reliability
Data Management
Offline*). See Offline Oil Analysis
Offline Oil Analysis
section 2.4.5 data has reached an data has reached
alarm level.
an alert level.
The MOS flag is set
MOS
(Maintenance for <the number>
transducers
Override
Switch)
Transducer Enabled flag NOT checked:
–
NO open indication – NO measurements – NO warnings.
AD
: Predictive and Instantaneous AutoDiagnosis™ messages may appear for
this type of fault.
*: Only used and consequently shown with certain user applications.
IMPORTANT: SYSTEM warning measurements are not included in
plots or in the calculation of AutoDiagnosis™ messages.
2.3.2.3
How to react on a new Measurement warning
Indication: the related Warning Lamp on the Menu Bar starts flashing
(example:
one or more.
1.
) and the number next to the flashing lamp is increased by
Check physically if the transducer with warning is under maintenance, but 'somebody' has forgotten to mark the transducer as
2008-11-20 OPENpredictor™ 2.8.0 Operator's Guide Issue 2.2 Page 2-16
'Under maintenance' (set the 'MOS' flag) or disable the transducer
(uncheck 'Enabled'). If the transducer is under maintenance and: •
If you have 'Flag' rights: depending on the situation set the 'MOS'
flag or uncheck 'Enabled' for the transducer. See section 2.3.5.
•
If you do NOT have 'Flag' rights: Notify the person in charge of the
system about the problem. See section 2.3.5.
2.
If according to point 1 the warning is reliable:
•
If the warning is an
(Alarm) for OPERATION: Action required.
Immediately notify the person on watch in charge of the plant.
•
If the warning is a
(System) warning: Immediately notify the
person on watch in charge of the OPENpredictor™ system.
•
Else: consider what to do. Normally no immediate action should be
necessary. The warning will be reported automatically in the next
Shift and/or Management Reports (see section 2.4).
See below about using Warning Lists and for more warning information
incl. when and how to acknowledge a warning, and when a warning
disappears from the Actual Warning Lists.
2.3.2.4
Opening a Warning List
There are three types of measurement warning lists:
•
Actual Warning Lists (called 'Warning lists') only include details for the
current measurement warnings to give a quick and accurate overview of
the plant status. Any measurement may generate several warnings per
state, but only the most severe warning per state will be shown in the
Actual Warning List. The value causing the warning is shown in the Value
field. The default setting is to list the latest warnings first. For access see
below.
A measurement will at most appear once per machine state. This means
that when a measurement has generated warnings of different warning
types in the same machine state, only the most severe warning type will
be shown. The default sorting order is by time with the oldest warning
first
•
Warning History Lists are Warning Lists with details for all actual and
historical measurement warnings. All measurements in the warning
condition are displayed. Historical Warning Lists are for CM-specialist
use. For details see section 2.3.2.6. For access use the menu 'Browse' >
'Warning History List'.
IMPORTANT: Displaying the Warning History list may take quite some
time depending of the number of historical warnings in the database.
•
MOS Warning list is a list of transducers where the MOS (Maintenance
Override Switch) flag is set. The MOS system is described in section
2.3.5.
Select the Actual Warning List to be displayed: -
•
To display all actual measurement warnings: click the 'All warnings'
Warning List icon
.
2008-11-20 OPENpredictor™ 2.8.0 Operator's Guide Issue 2.2 Page 2-17
•
To display all actual measurement warnings in one of the five Warning
. Example: to display all
Systems: click the 'All' word (button):
Operation warnings, click 'All' in the Operation group.
•
To display all actual measurement warnings of a specific warning type in
a warning system: click its lamp. Example: To display all Operation
Alarm warnings: click the red 'lamp' in the Operation warning group:
.
This displays the related Warning list. For a full description see section
2.2.2.1.
In an Actual Warning List a warning will at most appear once per machine
state. This means that when a measurement has generated warnings of
different warning types in the same machine state, only the most severe
warning type will be shown.
The title bar shows, which Warning List has been selected, here 'All
Warnings'. The
three lamps).
lamps indicate the selected warning levels (one or
The Warning List is by default sorted by 'Meas. Time' with the latest warnings
first. To sort it by any other parameter, click the heading for this parameter,
e.g. click 'Severity' or 'Machine'. To reverse the sorting order, click the
selected sorting heading once.
To investigate a specific warning: 1. Select the warning: Click it. It is then marked with blue.
2. Right-click the warning to display the floating menu.
The floating menu (right (secondary) mouse button) has the following
options: View Browser
Opens the Browser showing the measurement
causing the warning.
View Warning Setting
For CM specialists only.
Acknowledge Selected
Acknowledge the warning(s) selected.
Plot Manager – add in
measurements list
For CM specialists only.
Plot Manager – add in filters
list
<list of plots (plot scripts)> Display the plot related. Use DEFAULT with the
last 7 days of data as your first choice to
display the Default plot for the measurement.
Double-clicking the warning will display the DEFAULT plot.
Consider in each case if any of these above floating menu options will give
useful additional information to act upon. For the regular operator most often
the answer is 'no' – except maybe 'View Browser' and 'Acknowledge
selected'.
2008-11-20 OPENpredictor™ 2.8.0 Operator's Guide Issue 2.2 Page 2-18
2.3.2.5
Acknowledging and removing a measurement warning
To acknowledge a measurement warning use the following procedure: In the
Warning List window: 1. Select the warning(s) to be acknowledged. To select more than one
warning, hold down the Ctrl (add selected) or Shift (mark end of group)
keys in the usual way while selecting.
2. Select the menu 'Edit' > 'Acknowledge selected' or the floating menu
'Acknowledge selected'.
Alternatively, all warnings can be acknowledged by selecting the menu 'Edit'
> 'Acknowledge All'.
A measurement warning is automatically removed: •
When it is acknowledged.
AND
•
Its value is back within the accepted range
OR
the machine has moved to another machine state.
The warning data remains in the historical list. To see all current and
removed warning data: select the menu 'Browse' > 'Warning History List'.
WARNING: The 'acknowledged mark' cannot be removed.
IMPORTANT: When a warning has been acknowledged the 'Value' field for a
scalar measurement is no longer the worst data for the parameter. From now
on the last data for the parameter of the related machine state is displayed in
the 'Value' field.
2.3.2.6
Reading Warning list details
To display an Actual Warning List, either
•
Click the 'All warnings' icon
. This displays the Actual Warning List
window with all warnings except MOS warnings.
•
Click the text of the Warning Indicator Block, for example 'Operation'.
This displays the Actual Warning List window with all warnings in the
related Warning Indicator block.
•
Click the appropriate warning indictor lamp, for example
. This
displays the Actual Warning List window with all warnings of the related
type, for example 'Operation' Alarm warnings.
For a better view, maximize the window.
To display the Warning History List: In the Menu Bar select the menu
'Browse' > 'Warning History List'. From here select the relevant list.
The title bar shows which Warning List has been selected, for example 'All
lamps below the
Warnings' or 'Operation' Alarm Warnings. The
menus indicate the selected warning types. The actually selected warning is
highlighted in blue.
To display the parameter/signature which caused the warning: right-click the
warning and select the floating menu 'Plot window - Add in measurements
list'.
2008-11-20 OPENpredictor™ 2.8.0 Operator's Guide Issue 2.2 Page 2-19
The data field columns of the Warning List are: Name
Explanation
Code
A unique number for the warning measurement.
Warning Type
System:
An SPU has lost the connection. See
2.2.1.1.
Operation:
Operator Warning System
Maintenance: Maintenance Warning system.
Performance: Performance Warning System.
Severity
OVERLOAD/UNDERLOAD: Result out-of-range.
SPU OVERLOAD: the transducer voltage output is out-ofrange.
Level names: Alarm High, Alert High II,
Alert High I, Alert High - (normal) - Alert
Low, Alert Low I, Alert Low II, Alarm Low.
Examples:
Severity=High II: Above High II level but
below High level.
Severity=Low I: Below Low I level but
above Low II level.
Acknowledged
:
Not acknowledged.
Measurement
Description
Value
Meas.Time
Machine
RPM
State
Type
Info
:
Acknowledged.
A warning is automatically removed from the Actual
Warning List if it is acknowledged AND its measurement
value is back in its non-warning range.
Measurement code.
Description of the measurement.
Unacknowledged: the value measured for the warning.
Acknowledged: the latest value measured for the
machine state of the warning.
The time of the measurement. The time stamp for a
measurement executed by the SPU is given in the SPU.
The time stamped data is transferred to the OPENpredictor™ Server.
The SPU time is synchronised to the OPENpredictor™
Server clock.
The name of the machine with the warning.
The primary tacho RPM value of the machine at the
moment of the warning.
The name of the machine state at the moment of the
warning. The names are different for all machines.
For example 'Scalar', 'Spectral Band', 'Harmonic',
'Envelope', 'Profile'.
Additional information:
•
The harmonic which initiated the error ('1xRPM
Amplitude' or '3xRPM Phase').
•
The number of 'lines' in a signature.
•
Spectral band identifier for spectral band warnings.
The columns may be moved by clicking the column header and then drag and
drop it to a new position by means of the mouse.
Icons: Red:
Yellow:
Blue:
Alarm warnings are included.
Alert warnings are included.
System warnings are included.
2008-11-20 OPENpredictor™ 2.8.0 Operator's Guide Issue 2.2 Page 2-20
Menus: Menu level 1
File
Edit
Filter Columns
Menu level 2
Exit
Acknowledge All
Acknowledge
Selected
<Column name>
Explanation
Close the Warning List window.
Acknowledge all warnings.
Acknowledge the warning(s) selected.
Hide/display the column.
Right (secondary) mouse-button floating menus: View Browser
Opens the Browser showing the measurement
causing the warning.
View Warning Setting
Opens the related window with the warning limit
set-up for this measurement.
Acknowledge Selected
Acknowledge the warning selected.
Plot Window - Add in
measurements list
For CM specialists only.
Plot Window - Add in
filters list
2.3.3
The AutoDiagnosis™ and Warning Browser
The 'AutoDiagnosis™ and Warning Browser' is used for getting an overview
over where there currently are warnings, AutoDiagnosis and/or Instantaneous AutoDiagnosis messages.
In order to open the 'AutoDiagnosis™ and Warning Browser' select the menu
'Browse' > 'AutoDiagnosis™ and Warning Browser'.
The basic layout is the same as for the normal Browser, but the information
displayed for each item is here warning oriented.
If the 'Warning Severity' button is activated, the worst warning condition of
each item is displayed in front of the name of the item:
•
•
/
/
Alarm / Alert / System:
.½
AutoDiagnosis™ or Instantaneous AutoDiagnosis™:
depending on severity, see 2.3.1.3 and 2.3.1.4.
/
/
You can track an alarm down from 'Plant' level to 'Machine Component' level
which item the problems relates to by expanding the items (Click [+]).
2008-11-20 OPENpredictor™ 2.8.0 Operator's Guide Issue 2.2 Page 2-21
To display the complete message for an AutoDiagnosis™ or Instantaneous
AutoDiagnosis™ right-click the item, select the floating menu 'Browser', and
then in the browser right-click the item.
To display the item in the normal Browser with access to graphics, etc. rightclick the item and select the floating menu 'Browser'.
For further information about the other functions, please see the 'OPENpredictor™ User Manual' section 6.2.
2.3.4
Measurement warning indicators in Mimics
A Mimic is an image of a plant, machine or machine sections, which can be
used as an informative background to display selected measurements and
provide links, via active buttons, to related machinery and equipment for
ease of use.
If a displayed measurement is in a warning condition the status is indicated
by the colour for the warning type (red – yellow – blue, see section 2.3.2.1).
See the example in the lower left corner of the Mimic viewer.
If the colour of a button is different from green, it relates to a Mimic with one
or more measurement warnings at a more detailed Mimic level. The colour of
the button indicates the worst warning type indicated on the related Mimic.
Note: Only warnings on scalar measurements (e.g. Over-all vibration)
are reflected in the colour of the buttons in the Mimics.
Further information on Mimics – including Mimic warning indications – is
found in section 2.5.
2008-11-20 OPENpredictor™ 2.8.0 Operator's Guide Issue 2.2 Page 2-22
2.3.5
Maintenance Override Switch (MOS)
The number next to the MOS lamp indicates the number of transducers,
which are marked for maintenance.
To display a list of transducers marked for maintenance click the
'lamp' or use the menu 'Browse' > 'MOS'.
MOS
To display the transducer in the browser: right-click the transducer and select
the floating menu 'View Browser'.
The Maintenance Override Switch (MOS) is used when measurements are
irrelevant or unreliable. There are two levels of cutting-off a transducer:
'MOS' and 'not Enabled'.
2.3.5.1
The 'MOS' flag
The 'MOS' flag is used to avoid warnings from a machine or transducer under
repair/maintenance while the machine is running.
When the 'MOS' flag is set (;): •
SPU relay functions will ignore warnings from measurement related to
this transducer.
•
AutoDiagnosis™ Messages are not generated for warnings from
measurement related to this transducer.
•
Measurement data is stored as usual.
•
Alarms, alerts and system (overload) warnings are not recorded.
The 'MOS' flag should be set if: •
The related machine under repair/maintenance/modification, whilst still
running, may cause false warnings due to noise from tools.
•
The related transducer loop is being tested for a fault.
•
The related transducer loop is being tested or calibrated after repair.
•
The related transducer loop is defective, but is still used and is to some
extent reliable i.e. has a periodic fault.
2.3.5.2
The 'Enabled' flag
If the 'Enabled' flag for a transducer is NOT check-marked (
), no measurements are transferred to the database at all.
The 'Enabled' flag should be NOT check-marked if: •
The related transducer has been removed or its cable is broken.
•
The related transducer is defective and causes unreliable warnings.
WARNING:
Even if the 'Enabled' flag for a transducer is NOT check-marked, the transducer is NOT included in the MOS list of transducers marked for
maintenance (see section 2.3.5). To see which transducers are not
enabled see section 2.3.5.4.
2008-11-20 OPENpredictor™ 2.8.0 Operator's Guide Issue 2.2 Page 2-23
2.3.5.3
Checking/changing the position of the 'MOS' and 'Enabled' flags
To change the 'Enabled' flag setting you must have 'Flags' rights.
1.
In the 'Browser' right-click the transducer (
or
) related to the
measurement ( ), and select the floating menu 'View Definition': -
This displays the definition for the transducer, in the above case: -
2.
Check if the 'MOS' flag is check-marked
.
IMPORTANT when you have changed a flag !!!
In order to activate the changed setting of a 'MOS' flag or 'Enabled' flag,
•
the SPU must be rebooted, see section 2.9.4.
•
the Data Server must be stopped and restarted, see section
2.9.5.
2008-11-20 OPENpredictor™ 2.8.0 Operator's Guide Issue 2.2 Page 2-24
2.3.5.4
How to see which transducers are switched off
To see which transducers are switched off for maintenance by means of the
Enabled or Maintenance (MOS) flags: 1.
In the 'Browser', select the menu 'View' > 'SPU Definition'. This opens
the 'SPUs' window:
2.
For each SPU (in the above case SPU1 and SPU2) check if any 'Enabled'
flags are unchecked, or if any 'MOS flags' are set.
Note: It is also possible to see/change 'MOS' and 'Enabled' flags in the
browser when
•
The right part of the browser window is displayed, and
•
The related Machine, Machine Section or Machine Part is displayed.
2008-11-20 OPENpredictor™ 2.8.0 Operator's Guide Issue 2.2 Page 2-25
2.4
Reports
There are five types of main reports in the system: Shift Report
A report on the current problems i.e. for hand over
to the next shift. The report covers faults to be
dealt with within the next few hours or days. It is
generated automatically at the end of each shift.
The format is normally fixed, but can be changed.
Each user can store their preferred report format
under a unique name. Comments on the current
status can be included. Procedures: see section
2.4.1.
Management Report
A report for the maintenance manager, focusing on
predictions of future machine faults and the general
health of the plant. The report is generated e.g.
monthly. The format is normally fixed, but can be
changed. Each user can store their preferred report
format under a unique name. Comments on the
current status can be included. Procedures: see
section 0.
Diagnostic Report
An Excel file containing data for AutoDiagnosises
and alarms.
Measurements
A text file containing data for the number of meaStatistics report
surements recorded in the specified period of time.
Oil Analysis
Excel file containing oil data.
(special module *)
RDM reports
RDM (Reliability Data Management) is a system
(special module *)
reporting how often a machine is running and why
it's stopped.
Single graph plot
A report for a single plot in HTML format. The file
report
contains the requested plot and all relevant data for
evaluating the plot. Procedures: see section 2.7.1.
Multiple graph plots
A report for all the plots within a 'Plot Manager'
report
window. The HTML file contains all plots and all
relevant data for evaluating the plots. Procedures:
see section 2.7.2.
Mimic Report
A report from a Mimic in HTML format. The file
contains a screen dump of the Mimic. Procedures:
see section 2.5.3.
*) Special modules are not relevant for all applications, and may not be
included in your installation.
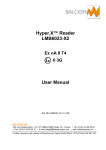
All reports are in HTML format. The benefits of this are: •
They can then be read and printed out by means of the generally wellknown Microsoft Internet Explorer, which comes with Windows.
•
In the Microsoft Internet Explorer you can use the Favourites (Ctrl+I) or
History (Ctrl+H) facilities to display them.
The image below shows a typical layout of a Management or Shift report.
2008-11-20 OPENpredictor™ 2.8.0 Operator's Guide Issue 2.2 Page 2-26
2.4.1
How to generate a Shift Report
A Shift Report is automatically generated at the end of each shift for handing
over the status to the next shift. The intended receiver is the user of
OPENpredictor™ on the next shift. The content selected should reflect the
needs of the next shift.
The Shift Reports are generated at the times defined in scripts, which can be
edited by the OPENpredictor™ system administrator.
To change the contents of the Shift Report, for example the 'Report
comments':
1.
In the OPENpredictor™ Menu Bar, select the menu 'Report' > 'Shift
Report'.
2.
In the Report drop down list, select the script for Shift Reports, in the
above example 'Shift Report'.
2008-11-20 OPENpredictor™ 2.8.0 Operator's Guide Issue 2.2 Page 2-27
3.
(If needed, make amendments to the window settings, see below.)
4.
Click [Save] to save the contents to the script selected in point 2.
5.
Click [Close] to close the window.
To open the report use
> 'Documents', or – if that fails – open the
file (defined in 'Html path' for example: c:\OPENpredictor\Reports\
ShiftReport.html) with the Internet browser (for example Microsoft Internet
Explorer). They are always saved on the OPENpredictor™ Server.
2.4.1.1
Shift Report fields
Report
(dropdown list)
Days
Report
comments
Report options
Report fields
Save /
Displays the script-name of the current settings for the
report. To enter a new setting name (e.g. 'ShiftReport2'),
type it here.
Delete the currently selected script from the list of
possible settings.
List of selectable report settings (scripts). Select the
report setting you want.
The report should cover warnings from the last <Days>
days.
Here you can enter any comment to be added in the next
reports.
Comments
Any free text.
Recommendations
Include AutoDiagnosis™
recommendations.
AutoDiagnosis
Include AutoDiagnosis™
Message(s).
Report only warnings
Report only warnings not
not acknowledged
acknowledged.
Html Path
Relative path (ref: OPENpredictor™ path) and the file
name of the report (.html is
omitted). Preferably use a path
on the OPENpredictor™ Server.
Change the 'Html path'.
Date
Include the date and time of the
(AutoDiagnosis™) warnings.
Include these warnings in the
Operation/
report.
Maintenance/
Performance/
RDM/
Offline/
System warnings
Machine code
Include machine code.
Measurement
Include measurement code.
Machine State
Include machine state.
Measurement Value
Include measurement value of
the warnings.
Warning Settings
Include warning settings.
Value examples:
'0.4': The last warning limit
passed.
'Normal': The value is now back
in the normal range.
Forecast Time
Include Min and Max forecasted
time where the fault becomes
critical.
Value = 0: No forecast.
Warning Status
Include warning status (for
example: 'HIGH2').
;: Acknowledged/Accepted.
Acknowledges
: Not Acknowl./Accepted.
Save the settings selected.
2008-11-20 OPENpredictor™ 2.8.0 Operator's Guide Issue 2.2 Page 2-28
How to generate a Management Report
The Management Report is a report which may be generated e.g. monthly or
after a serious warning. It is intended for maintenance management. The
report contains the current warning history of the entire plant. The content
selected should reflect the detailed needs of the plant maintenance
management.
The report is saved in the directory specified as an .html format file. The
directory should be on the OPENpredictor™ Server.
1.
In the OPENpredictor™ Menu Bar select the menu 'Report' >
'Management Report'.
2.
In the Report drop-down list
, select the script for
Management Reports, in the above example 'Management' (there may
be several others, for example 'After fault'.)
3.
Check/Select the number of days the report is to cover.
4.
Insert the relevant 'Report comments'.
5.
(If relevant, make other amendments to the window. For details about
the fields, see section 2.4.1.1 'Shift Report Fields'. )
6.
Click [Generate] to generate the report (and to save the list of contents
to the script selected in point 2.) The progress of the generation is
shown in the progress bar (here marked '0 %'.) The generation may
take some time depending on the number of warnings and data to be
included into the report.
7.
Click [Close] to close the window.
To open the report use
> 'Documents', or – if that fails – open the
file (defined in 'Html path' for example: c:\OPENpredictor\Reports\
ManagementReport.html) with the Internet browser (for example Microsoft
Internet Explorer).
2008-11-20 OPENpredictor™ 2.8.0 Operator's Guide Issue 2.2 Page 2-29
2.4.2
Diagnostic report
In the OPENpredictor™ menu bar select the menu 'Reports' > 'Diagnostic
report' to save an Excel file with the following content:
It is used for giving an overview over the condition of a plant. The list contains specific fault data for each machine, one worksheet per machine.
2.4.3
Measurements Statistics report
In the OPENpredictor™ menu bar select the menu 'Reports' > 'Measurements
Statistics'. This opens a box to open the file database-analysis.txt, placed in
the OPENpredictor\reports directory.
The file is generated by a script, which is run as a 'Windows Service' at a
specified time, typically daily. It shows how many data of each type, which
have been added to the database.
The data are mainly used for trimming the system, but a significant change in
the number of measurements is a good indicator, that something is wrong.
The data are shown in this window (Machine: … = all machines):
To export the data to another text file, e.g. including the date in the file name (tip: use the yyyy.mm.dd format), click the Report Generate button
.
2008-11-20 OPENpredictor™ 2.8.0 Operator's Guide Issue 2.2 Page 2-30
2.4.4
Note Reports
If using the 'Movipack' module for offline data collection (see section 2.8),
'Note Reports' displays stored standard notes, or notes typed in on the
module.
'Note Reports' are accessible from the Browser: Right-click a Machine, Machine Part or Transducer and select 'View Note Reports' on the floating menu.
For a Machine or Machine Part, a 'Note Report' looks like this:
For a Transducer, a 'Note Report' looks like this:
Click
to print the 'Note Report'.
Click
to save the 'Note Report' as an HTML-file.
By means of the 'Period' functions you can select the period for which the
reports are displayed.
2008-11-20 OPENpredictor™ 2.8.0 Operator's Guide Issue 2.2 Page 2-31
2.4.5
Oil Analysis (special module)
'Oil Analyses' is a tool used in some installations for reading and recording oil
data.
The measurement is defined as a server source:
Each parameter has – as usual – a definition (right-click the parameter and
select the floating menu 'View Definition'), e.g.:
Data may be measured automatically or entered manually. To enter the data
manually and/or read the data:
1. Open the 'Oil Analyses' window: In the OPENpredictor™ menu bar, select
the menu 'Reports' > 'Oil Reports':
2.
In this window, select the surveillance period, click [Update] if changed,
and double click a record (one machine, one date) to display its data:
2008-11-20 OPENpredictor™ 2.8.0 Operator's Guide Issue 2.2 Page 2-32
•
•
•
•
To insert a new data column (date), select the menu 'Edit' > 'Insert
Oil Report' (Ctrl-N) or click the
button. You will be prompted for a
date.
To copy a previous data column, select the menu 'Edit' > 'Copy Oil
Report' (Ctrl-C). You will be prompted for a date and time. Please
note the button [Now].
To delete a new data column, select the menu 'Edit' > 'Delete Oil
Report' (Ctrl-X). or click the
button, and select the date of the
record to be deleted.
To export all records to an Excel file, select the menu 'Report' >
'Generate' or click the
button.
All data fields except 'Parameter' and 'Unit' are freely editable.
3.
After editing save the changes: Click
(Ctrl-S)
or select the menu 'File' > 'Save'
2.4.5.1
Importing Oil report data
To import oil report data, the data must have the same format as the export
Excel file.
In the OPENpredictor™ Menu Bar, select the menu 'Tools' > 'Import Oil data',
and then select the Excel file to import.
If the import fails, you will get an error message, which could be:
If the Data Server is not running, you will get an error message about that.
In that case, start the server, see section 2.9.5.
The imported data will appear as a new line in the 'Oil Analysis' window, if
the date is inside the 'Surveillance Period':
If the 'Sample Date' is the same as an existing 'Sample Date' the old data will
be replaced.
2008-11-20 OPENpredictor™ 2.8.0 Operator's Guide Issue 2.2 Page 2-33
2.4.6
Reliability monitoring (special module)
RDM (Reliability Data Management) is a system used in some installations
reporting how often a machine is running and why it's stopped.
2.4.6.1
Menu Bar indicator
Whenever a machine is stopped, it causes a 'Reliability warning'. The number
of machine stops can be shown in the Menu Bar: Select the menu View >
Toolbars > Warnings > RDM.
(yellow) is the number machine stops (scheduled and unscheduled).
(blue) is the number of RDM System warnings (no contact to the system).
2.4.6.2
The Downtime List
The 'Downtime list' is available
•
directly from the Browser: Right click the 'Machine' icon and select
the floating menu 'Downtime list'.
•
by clicking the 'Downtime List' icon in the 'Machine Reliability Report'
(see below).
Here you can edit four columns
•
'Type': Right-click the field to select any of the two standard causes:
o Scheduled
o Unscheduled
•
'Cause'. Right-click the field to select any of the three standard
causes:
o External (EXT)
o Failed Whilst Running (FWR)
o Failure To Start (FTS)
•
'Root Cause'. When 'Cause' has been selected, right-click to select a
related 'Root Cause'.
•
'Comment': To enter/edit, double-click the field.
When a cause has been changed, click [Recalculate] to change the statistics
bars accordingly.
If the 'Period' data have been changed, click [Update] to display the new list
of stops.
2.4.6.3
The RDM Report
In the Menu Bar select the menu 'Report' > 'RDM Report' to open the RDM
Report window giving a survey over the reliability of the machines included in
the system.
2008-11-20 OPENpredictor™ 2.8.0 Operator's Guide Issue 2.2 Page 2-34
The bars for the machine selected are marked with a medium blue background.
The report displays for one or more machines
•
Reliability (light blue bar): Uptime in %, where downtime is unscheduled downtime caused by the machine.
•
Availability (red bar): Uptime in % no matter the cause of the stop.
•
Utilization (yellow bar): Uptime in %, where downtime includes
scheduled + unscheduled stops, only.
If the 'Surveillance Period' data have been changed, click [Update] to
recalculate the bars.
Click
to save the window as an HTML-report. You will be prompted for file
name and directory.
2.4.6.4
The Machine Reliability Report
To get more details for the machine highlighted
•
In the 'RDM Report' window click 'Reliability Report'.
•
directly from the browser: Right click the 'Machine' icon and select the
floating menu 'Reliability report'.
This window contains a number of tabs, on each of which you can read
further details, for example about each stop.
2008-11-20 OPENpredictor™ 2.8.0 Operator's Guide Issue 2.2 Page 2-35
To enter/edit data about each stop, in the 'RDM report' click the 'Downtime
list' button.
2.4.6.5
RDM machine Info
In the 'Machine Reliability Report' or the 'Downtime List' (see below): click
[RDM Machine Info] to open a window with basic RDM data and alarm/ alert
settings for this machine:
For an explanation to the fields, see
the OPENpredictor™ User Manual
section 5.12.5.7.
2008-11-20 OPENpredictor™ 2.8.0 Operator's Guide Issue 2.2 Page 2-36
2.5
Mimics
Mimics are interactive graphical user interface windows displaying: –
•
Images of the system.
•
Images of system components with selected measurements and
warnings related to the items currently displayed.
Data values without warning are green. If a measurement shown is in a
warning condition, the colour of the measured value is the colour for the
warning condition: red = Alarm, yellow = Alert.
Coloured buttons are links to other Mimics. The colour of the button indicates
the colour of the worst measurement on the linked mimic.
TIPS:
•
•
2.5.1
If holding the mouse pointer over a data field, the time for the
measurement is displayed as a 'tool-tip-text'.
For more information about a measurement, right-click the name of
the measurement, see section 2.5.2.
Opening a Mimic
1.
In the OPENpredictor™ Menu Bar, click
to select the Mimic Viewer:
2008-11-20 OPENpredictor™ 2.8.0 Operator's Guide Issue 2.2 Page 2-37
If a default Mimic has been defined, this is immediately shown below the
panel, see point 3 below.
2.
Click
3.
Select (highlighted) the desired Mimic and click [OK].
to open a Mimic. This opens the 'Mimic Viewer – Open' window:
The image above shows a system overview without measuring values.
4.
To switch to another Mimic (alternative methods): •
Click the link-button for the Mimic desired.
•
Select the Mimic from the list (step 2-3 above).
•
Click the
(back) or
(forward) icon to get the previous or next
Mimic previously displayed.
2008-11-20 OPENpredictor™ 2.8.0 Operator's Guide Issue 2.2 Page 2-38
2.5.2
Working with a Mimic
The images above are showing examples of detailed Mimics.
A measurement is shown as a leading text (normally the parameter name) +
the actual value for the parameter. Values without warning are green. If in a
warning condition, the measurement is shown in the colour of the warning
condition (Alert: yellow, Alarm: red, System fault: blue).
Buttons are links to other mimics. If the colour of a button is different from
green, it relates to a measurement with one or more warnings. The colour of
the button indicates the worst warning level indicated on the related Mimic.
For more information on a specific measurement displayed: •
or
•
Double-click the tag name, value or meter to display the Default Plot of
the measurement.
Select the measurement (click its label or value) and click:
2008-11-20 OPENpredictor™ 2.8.0 Operator's Guide Issue 2.2 Page 2-39
•
•
to display the Default Plot of the measurement.
to display the measurement in the Browser. From there you can
select any plot script related to the measurement.
or
•
Right-click the measurement to open the 'Mimic Viewer – Select
Measurement' window with all measurements for the transducer:
The buttons are
•
[Plot Manager]: Open the DEFAULT plot for this measurement.
•
[Browser]: Open the Browser with the measurement selected.
•
[Warning Settings]: Open the warning settings window for this
measurement.
2.5.3
How to make a Mimic Report
1.
In the Mimic window, click the
(Generate Report) icon and select a
name and path for it. The name must end with '.htm' or '.html'.
2.
To open the report use
> 'Documents', or – if that fails – open
the file ('Html path' for example: C:\OPENpredictor\Reports\xxxx.html)
with the Internet browser (for example Microsoft Internet Explorer):
2008-11-20 OPENpredictor™ 2.8.0 Operator's Guide Issue 2.2 Page 2-40
2.5.4
Mimic menus and related toolbar icons
Menu
File
View
Submenu
Explanation
Open
Open the 'Mimic Viewer – Open' window to select
which Mimic to open:
Print
Print the Mimic (screen dump – no additional text –
landscape view).
Exit the Mimic Viewer
Exit
Toolbars
File
Go
Browse
Go
Back
Browse
Forward
Browser
Report
Help
Plot manager
Generate
Content
About
Report
Switch to previous Mimic (originally selected by
link)
Switch to next Mimic (originally selected by link)
Open the Browser. If a measurement is selected
this measurement is displayed in the Browser.
Open a Scalar Trend plot for the measurement
selected.
Creates an HTML report with the content of the
Mimic window. '.HTML' is automatically added to the
name typed.
Open the help file.
Open the 'About OPENpredictor™' window.
2008-11-20 OPENpredictor™ 2.8.0 Operator's Guide Issue 2.2 Page 2-41
2.6
The Browser Window
The Browser is used for selecting measurements to be displayed, and for
displaying details about plant and machine items and measurements.
To open: click the
icon.
To open/close the right side field with the details, select menu 'Options' >
'Right Part of Browser visible'. This setting is stored.
The window contains five areas below the title bar: •
Menus.
•
Toolbars.
•
Item/measurement selected.
•
Left field: Item/Measurement selector. See section 2.6.1.
•
Right field (if displayed): Item/Measurement data.
To select an item click it with the left (primary) mouse button. You can use
the arrow keys to navigate in the Browser window.
2.6.1
Item/Measurement Selector
Icons used in the left side field showing the hierarchical structure of the CM
system:
Company
Plant
Plant Section
Machine
Machine Section
Machine Component
Transducer
Virtual transducer or AutoDiagnosis™ Server
Measurement
Closed (default): Items/measurements in the next level(s) are
hidden. Click to expand.
Open. Items/measurements in the next level(s) are displayed. Click
to hide lower level contents.
2008-11-20 OPENpredictor™ 2.8.0 Operator's Guide Issue 2.2 Page 2-42
The item/measurement displayed with blue background is the currently
selected one. Its data is displayed in the right-hand data field (if displayed),
and its name (full path) is displayed above the window.
2.6.2
Floating menu
Put the pointer over an item/measurement and right-click to activate the
floating menu for that item. Floating menu example for a measurement: -
The menu selected is highlighted (blue background). The possible menus are:
Menu
Used with
View Definition
All
Explanation
Display the definition window for the
item/measurement clicked.
View Note
All except
Display 'Note Reports', see section
Reports
Measurement
2.4.4.
Opens the 'View AutoDiagnosis™
View
Company
Plant
Configuration' window for the item
AutoDiagnosis
Plant section
selected. From here, you have an
Configuration
Machine
overview of the related possible AutoMachine section Diagnosis™, and the AutoDiagnosis™
Machine
recommendation can be edited if you
component
have the proper rights.
View RDM
Company
Display the 'RDM Reports' window, if
Plant
Report (RDM=
RDM is installed for this item or any
Plant section
Reliability Data
item below, see section 2.4.6.
Machine
Management)
View Reliability
Machine
Display the 'Reliability Report' window,
Report
if RDM is installed for this machine,
see section 2.4.6.
View Downtime
Machine
Display the 'Downtime Report' window,
Report
if RDM is installed for this machine,
see section 2.4.6.
Displays the latest + a list of all
View
Machine
Machine
Predictive AutoDiagnosis™ messages
AutoDiagnosis
component
for this machine.
Messages
View
Machine
Displays the latest + a list of all
Machine
Instantaneous
Instantaneous AutoDiagnosis™
component
AutoDiagnosis
messages for this machine.
Messages
View Machine
Machine
Open the Machine States window with
States
a list of machine states of the machine
selected during the last week. You can
change the display period by clicking
the Time from/to icons and then click
[Apply].
2008-11-20 OPENpredictor™ 2.8.0 Operator's Guide Issue 2.2 Page 2-43
Set MOS Flag
Reset MOS Flag
Plot Manager Add in measurements list
Plot Manager Add in filters
list
Clear Baseline
Set Baseline
DEFAULT
<list of other
plot scripts>
2.6.2.1
All except
Measurement
Measurement
Set/Reset the MOS flag for the
transducer /all transducers below this
item. See section 2.3.5.1.
Add this measurement to the last
opened Plot Manager window.
Measurement
Add the measurement to the Plot
Manager 'Filters list'.
Machine
Machine section
Machine component
Measurement
Measurement
For specialists, only. See the OPENpredictor™ 2.8.0 manual section 3.3
for details.
All
Measurement
The default plot-script for this parameter with default state if specified in
its Range-Settings.
Other plot scripts for this parameter.
Displaying AutoDiagnosis™ messages for a machine (component)
From the browser you can display lists of AutoDiagnosis™ messages for a
specific machine or machine component.
To open the AutoDiagnosis™ message window:
1. Open the Browser.
2.
Select the machine or a machine component: Click its
3.
Right-click the
or
icon to display the floating menu for the
machine (component):
4.
Select the menu 'View AutoDiagnosis Messages' or 'View
Instantaneous AutoDiagnosis Messages'. This will open the related
AutoDiagnosis™ list window, see section 2.3.1.5.
or
icon.
2008-11-20 OPENpredictor™ 2.8.0 Operator's Guide Issue 2.2 Page 2-44
2.7
Working with predefined plots
Each measurement has an associated Default plot (called 'DEFAULT'). There
are many ways to launch a Default plot as described in other sections of this
chapter, and in section 2.7.4.
The most common Default plot is the 'Scalar Trend' plot shown below: -
The Plot Manager with a Scalar Trend plot, where the yellow 'Alert' line is
crossed by the upper prognosis confidence-range trend curve.
To copy the active (= top) plot in black-white, e.g. for using in a Word report,
just press Ctrl-c (the standard Windows shortcut for Copy). For a colour copy
press Ctrl-d.
2.7.1
How to make a Single Plot Report
The report is an HTML report for a single plot. The HTML file contains a plot
and all relevant data for evaluating the plot.
2008-11-20 OPENpredictor™ 2.8.0 Operator's Guide Issue 2.2 Page 2-45
1.
In the individual plot window,
•
Select the menu 'View' > 'Toolbars' > 'Report' and then click the
icon
or
•
use the menu 'Report' > 'Generate'. This opens a normal 'Save As'
box.
2.
In the 'Generate report – Save' box, select a name with the extension
'.HTML' (normally accept the proposed name) and click [Save].
3.
To open the report use
> 'Documents', or – if that fails – open
the file ('Html path' for example: C:\OPENpredictor\Reports\xxxx.html)
with the Internet browser (for example Microsoft Internet Explorer).
2.7.2
How to make a Multiple Plot Report
The report is an HTML report for all the plots within the Plot Manager window.
The HTML file contains all plots and all relevant data for evaluating the plots.
1.
In the Plot Manager main window (not the individual plot),
•
Select the menu 'View' > 'Toolbars' > 'Advanced toolbar' and then
click the
icon.
or
•
Select the menu 'Report' > 'Generate'.
This opens a 'Save As' box.
2.7.3
2.
In the 'Generate report – Save' box, select a name with the extension
'.HTML' and click 'Save'.
3.
To open the report use
> 'Documents', or – if that fails – open
the file ('Html path' for example: C:\OPENpredictor\Reports\xxxx.html)
with the Internet browser (for example Microsoft Internet Explorer).
User defined plots
It is possible to create other predefined plots for easy data presentation. The
CM specialist may have predefined 'Scripts' under a dedicated name to
display measurement data e.g. 'Run-up Gas turbine'. This would present all
Bode diagrams for all the bearings without having to request the data per
bearing. Most predefined plots are used for advanced Condition Monitoring
data analysis, to be made by the maintenance engineer or vibration
specialist.
However, several types of plots are also useful for analysing plant operation,
for example displaying actual load, output power and relationships between
parameters, e.g. Load, temperature and efficiency.
Please ask your OPENpredictor™ system administrator to set-up the plots you
need. The plots can then be found on your list of default plots, see 2.7.4.
2008-11-20 OPENpredictor™ 2.8.0 Operator's Guide Issue 2.2 Page 2-46
2.7.4
How to open a user defined plot
To display a user defined plot: -
1.
Open the Plot Manager window: In the OPENpredictor™ Menu Bar click
.
2.
If you want to work with icons in the Plot Manager window, select
(check-mark) the menu 'View' > 'Toolbars' > '9 Advanced toolbar'. This
setting will be saved with your user profile.
3.
Open the 'Open Data Selection' window: In the 'Plot Manager' window: -
•
•
4.
icon, or
Click the
Select the menu 'View' > 'Data selection' > 'Open'.
Select the desired stored plot settings, which may contain one or several
plots, by clicking its name in the left field. The selected setting is shown
in blue.
Examples of the results of different stored plot scripts
5.
Click [OK]. Opening the plots may take quite some time depending on
the amount of data to calculated and displayed. A progress bar is
displayed.
If more than one plot is displayed in the same Plot Manager window, they
may be cascaded (click
), tiled (click
) or tiled vertically (click
). To
.
close all plots click
2008-11-20 OPENpredictor™ 2.8.0 Operator's Guide Issue 2.2 Page 2-47
The plots may also be maximized, normalized, minimized and closed in the
normal way using the
2.7.5
buttons.
Navigation facilities of a plot
This section aims to give you the skills to work with pre-defined plots.
2.7.5.1
Zooming by selecting
Click and hold down the primary (left) mouse button while moving the
pointer, to select the part of the plot to zoom-in. When the mouse button is
released the zooming takes place: -
Please note:
•
•
•
2.7.5.2
If the selection doesn't contain any curve points, no zoom is
made. This can be used for cancelling the zooming.
As shown above, going outside the borders includes an
equivalent area outside the current selection.
The co-ordinates of the starting point corner and the pointer
are displayed at the selection.
Zooming, moving and scrolling using shortcuts
Shortcut keys Function
ÍÎ
Move the point selected in the direction of the key.
Ctrl ÍÎÏÐ
Scroll the window approx. one grid width in the direction of
the key.
Num+
Vertical zoom in by a factor of 2. New centre at the point
selected.
NumVertical zoom out by a factor of 2. New centre at the point
selected.
Ctrl Num+
Horizontal zoom in by a factor of 2. New centre at the
point selected.
Ctrl NumHorizontal zoom out by a factor of 2. New centre at the
point selected.
'Num' indicates the keys in the numeric pad section of the keyboard.
2.7.5.3
Zooming to fit to the actual data
Select the menu 'Options' > 'Fit to data' or use the buttons
and/or
.
2008-11-20 OPENpredictor™ 2.8.0 Operator's Guide Issue 2.2 Page 2-48
2.7.5.4
Zooming out by a factor of 1/2
Shortcut: Right-click inside the curve area of the plot.
Icon:
Access: select ( -mark) the menu 'View' > 'Toolbars' > '
appropriate plot sub-window.
Zoom 1/2
Zoom 1/2
2.7.5.5
Zoom' in the
Activated: clicking anywhere inside the plot will zoom out
both axes by a factor of 2 keeping the centre point of the
plot.
Deactivated. Clicking inside the plot leads to normal pointer
functions. (The shortcut will still work.)
Scrolling the selection one grid-width using the mouse
Right-click (secondary mouse button) the plot sub-window outside the curve
area itself to scroll the plot approx. one grid-width in the direction of the
arrow displayed (the direction away from the curve area). In the screenshot
below, the arrow
2.7.5.6
is shown to the right of the curve area: -
Cursor position readout
Right-click (secondary mouse button) the plot sub-window anywhere inside
the curve area to show the exact position of the + cursor in a small sub-field:
Line 1: x-axis position. For a time-axis date & time, see section 2.7.5.7.
Line 2: y-axis position.
2008-11-20 OPENpredictor™ 2.8.0 Operator's Guide Issue 2.2 Page 2-49
2.7.5.7
The date & time format
The date & time format refers to the format displayed at the bottom of the
window:
In this case the first part '2003-01-13 12:' is fixed for all points and therefore
only the part 'mn:s' (min:sec) in this case '54:27' is displayed on axis, etc.
If for example the format was '2003-M-D ' the date & time stamp displayed
would have been '01-13 (in this case no time).
If the plot shown is a signature, the time format text is replaced by the time
of the signature.
2.7.5.8
Peak position readout
Left-click the plot sub-window near a peak to set the selected point to the
nearest peak value. The position is indicated in the plot by border-to-border
dotted orange lines, and the position data is shown in the data field to the
right of the plot together with other important information about the
measurement: -
Note: the data field may be switched on/off by means of the
2.7.5.9
icon.
Changing data-period for a scalar plot window
In the icon tool-bar of most scalar plot windows there is a drop-down list with
five choices:
2008-11-20 OPENpredictor™ 2.8.0 Operator's Guide Issue 2.2 Page 2-50
•
Short term: Reloads the data using the period 'Short term' defined
for the 'Plot Manager' (menu 'View' > 'Settings' > 'View settings',
field 'Time Base').
•
Medium term: Reloads the data using the period 'Medium term'
defined for the 'Plot Manager'.
•
Long term: Reloads the data using the period 'Long term' defined for
the 'Plot Manager'.
•
Previous term: Load the data of the period prior to the actual period
and with the same length of period. In case of no more data, a
message is displayed instead.
•
Next term: Load the data of the period just after the actual period
and with the same length of period.
The drop-down list may be hidden/displayed by (de)selecting the menu 'View'
> 'Toolbars' > 'Selection'.
2008-11-20 OPENpredictor™ 2.8.0 Operator's Guide Issue 2.2 Page 2-51
2.8
Off-line data collector (special module)
Some installations of the OPENpredictor™ system use off-line data collection
by means of a hand-held 'data collector'. Various types are used. It could for
example look like this:
For the handling of the data collector and the data collection procedures,
please refer to the user manuals for the data collector.
Before collecting the data, the 'route' must be loaded into the data collector.
The route data contains information about where to get which measurements
and in which (suggested) order.
2.8.1
Uploading the route to the data collector
1.
Connect the data collector to the PC-port specified, for example 'COM1:'.
Make sure the battery is full and in good condition.
2.
In the main window, select the menu 'Tools' > 'Routes'. This opens the
'Route MMI' window:
(To display the route definition, double-click the Message field of the
route.)
3.
Select the route to be uploaded (even there is only one route.)
4.
In the 'Route MMI' window select the menu 'DataCollector' > 'Upload to
Data Collector'.
5.
Wait until the data collector reports the route is loaded (for example: the
progress bar disappears).
6.
Disconnect the data collector from the PC.
2.8.2
Downloading the tour-data from the data
collector
When the data has been collected do as follow:
1.
Connect the data collector to the PC-port specified, for example 'COM1:'.
2.
In the main window, select the menu 'Tools' > 'Routes'. This opens the
'Route MMI' window.
3.
Select the route with the data to be downloaded.
4.
In the 'Route MMI' window select the menu 'DataCollector' > 'Download
from Data Collector'.
5.
You are notified when the data has been downloaded. Then disconnect
the data collector and make sure the battery is being recharged.
2008-11-20 OPENpredictor™ 2.8.0 Operator's Guide Issue 2.2 Page 2-52
2.9
Bearing Wear Monitoring (special
module)
OPENpredictor™ uses BDC (Bottom Dead Centre) measurements for Bearing
Wear Monitoring (BWM) on piston engine bearings. A typical application is
large ship diesel engines. Connected to the general ship alarm system, it can
give an instant sound alarm for spontaneous bearing damage as well as early
warning messages for slowly developing bearing wear.
2.9.1
Basic principles
The basic idea of the BDC measurements is – for each cylinder – to place a
proximity sensor at the bottom of the crosshead guide just below the BDC
point. (BDC for a piston engine is the position of the piston in which it is
closest to the crankshaft.) When the wear of the bearings is growing, each
stroke will become slightly longer because of the wear in the bearings at and
below the crosshead. This means that the lowest position of the crosshead
comes closer to this sensor, and the change in the data from the proximity
sensor over time is a measure for the wear in the crosshead bearing, the
crank bearing and the main bearings.
Crosshead Guides
Crosshead
Bearing
Sensor position
Crank Bearing
Main Bearing
For a more reliable measurement, the OPENpredictor™ BDC measurement
uses two sensors in each cylinder to measure tilting of the crosshead, too.
The measurement values are influenced by and compensated for shaft speed
(RPM).
2008-11-20 OPENpredictor™ 2.8.0 Operator's Guide Issue 2.2 Page 2-53
The data can be displayed in two ways:
•
On a graph, where it's easy to see if the wear is coming close to or has
crossed the acceptable limits.
•
On a mimic with a schematic drawing of the engine as background and
e.g. a level bar with data and limit lines to display the actual situation.
The level bar colour indicates the warning condition:
o Green: OK.
o Yellow: Alert.
o Red:
Alarm.
o Blue:
System error.
o A white line inside the coloured column means that the measurement is under calibration: a temporary correction curve is used.
If the measurement is out of the range displayed, this is indicated by a
blue arrow (up or down).
2008-11-20 OPENpredictor™ 2.8.0 Operator's Guide Issue 2.2 Page 2-54
2.9.2
BDC baseline calibration
Whenever a bearing or a sensor has been replaced, repaired, moved or
reassembled it is necessary to calibrate the baseline again. This automated
procedure is described below.
2.9.2.1
Background
In order to convert the measured BDC to wear, a number of factors may
influence the measurement. By far the most important factor is the actual
RPM of the machine.
The 'BDC baseline' (normal values) includes the curve for correcting the BDC
wear measurement for RPM. In theory, the faster the machine runs, due to
the inertia of the piston, the deeper the piston at BDC will come down
towards the crank. The BDC correction curve is used to correct the BDC for
RPM to its RPM-compensated value, BDCc.
To compensate for tilting of the crosshead, OPENpredictor™ is using two
transducers, one on each side of the crosshead guides. The final measured
value is the average of these two measurements. However, if one transducer
fails, the measured values from the other transducer will be used directly.
There are four types of BDC 'measurements' (in the Browser):
BDC:
The raw measurement of each transducer.
BDCc:
The measurement corrected for RPM (and other if relevant).
Wear:
The average of BDCc for the two transducers of the cylinder minus
the initial value. The initial value compensates for the placement of
the sensors ('Initial wear', see below).
Position: Used for adjusting the sensor and sensor validation during operation. An 'Alert High' on a Position measurement indicates a faulty
transducer.
'Initial wear': Initial wear is always zero for a new bearing. The 'Initial
wear' of interest here is the wear at the time the 'Initial wear' is entered into
the database.
If for some reason, which could be a severe mechanical problem, the crosshead comes too close (inserted limit value) to the transducer, an 'Alert High'
on the BDC (raw) measurement is released. The machinery must then be
inspected a.s.a.p. to find out if the alarm was caused by a transducer
problem or a mechanical problem.
2.9.2.2
Reset Zero Gap / Recalculate BDC Baseline
Purpose: To clear the correction curve parameters and to initiate calculation
of the parameters starting from a time entered by the user.
•
Reset Zero Gap (the correction curve is calculated from new values,
only) must be carried out each time a sensor or bearing part has been
replaced or a sensor may have been moved.
•
Recalculate BDC Baseline (the correction curve is calculated using old
parameters as preliminary values) should only be carried out on
recommendation from Rovsing Dynamics in case of too many false
alarms.
In both cases an 'Initial wear' value may be inserted if known.
The time it takes to make the calculation of the correction curve and
consequently the baseline depends a lot on the operation conditions of the
machine. The system needs a certain amount of data at various different RPM
value bands. It may take from a few hours to a few weeks.
1.
In the Browser, right-click on a Machine, Machine Section, Machine
Component or Transducer, and
•
Select the menu 'Reset Zero Gap' or 'Recalculate BDC Baseline' as
indicated above.
2008-11-20 OPENpredictor™ 2.8.0 Operator's Guide Issue 2.2 Page 2-55
•
•
•
If a machine is selected, all BDC transducers related to that machine
is reset. This is typically used for a new installation (Reset Zero Gap)
or if a main bearing has been replaced.
If a machine part, for example a cylinder, is selected, all BDC transducers related to that machine part is reset. This is typically used if a
crosshead or crank bearing has been replaced.
If a transducer is selected, this transducer only is reset. This is typically used if a transducer has been replaced.
2.
This message is displayed if 'Reset Zero Gap' is selected. The condition is
only needed to be true when the [OK] button is clicked. Click OK to
proceed, Cancel to quit.
3.
Set the start time for the baseline (correction curve parameters) calculation. BDC values, which are time stamped before this time, are not used
in the calculation. If the correction curve has previously been calculated,
this date is displayed (Previous Baseline Data). Default start time is the
current time.
a.
, select
If changing the start time, click on the calendar button
a date and time as desired and click OK. The value should be set
to the date and time, where reliable measurements with the
current bearings and transducer installation started.
b.
Click [OK] to insert the new date and time. The 'Recalculate Zero
Gap Baseline' window is now updated.
2008-11-20 OPENpredictor™ 2.8.0 Operator's Guide Issue 2.2 Page 2-56
c.
If a start time before the previous baseline date is selected you
will get a warning message. Click [Cancel] to enter a new date
and time.
Click [OK] on the 'Recalculate Zero Gap Baseline' window.
4.
Answer this question.
•
•
5.
2.9.2.3
If Yes: Continue at section 2.9.2.3. 'Set Initial Wear', step 2.
If No: 'Initial wear' will be set to 0. Continue with step 5 below.
One of these messages is displayed:
Set Initial Wear
Purpose: To insert the value of initial wear if known.
1.
In the Browser, right-click on a Machine, Machine Section, Machine
Component or Transducer, and select 'Set Initial Wear'.
2.
A table is displayed in which values of all Wear measurements under the
selected component can be entered:
3.
Enter manually the values for those measurements for which the value
shall be changed and click OK.
2008-11-20 OPENpredictor™ 2.8.0 Operator's Guide Issue 2.2 Page 2-57
4.
2.9.2.4
This message is displayed (in the above case the value of DP3F Wear will
be set to 50 µm and DP7F Wear will be set to 10 µm).
Explanation to the baseline calculations
The Baseline calculation takes typically from a few hours to weeks, where a
sufficient number of BDC measurements must be made in certain defined
RPM ranges. These ranges are defined in the 'BDC RPM Range Settings'
window.
To open this window
1.
2.
3.
4.
Open the Browser
.
Select the 'Main engine'
.
Right-click the machine icon
or name, and select the floating menu
'View Definition'. This opens the 'Machine definition' window.
In the 'Machine definition' window click the [BDC Settings] button. This
opens the 'BDC RPM Range Settings' window.
Warning: In this window it is possible to change the figures inserted except
the 'State' definitions. Do NOT change these figures UNLESS you really know
what you are doing and why!
Explanation to the fields:
Column 'State': Defines a number of RPM ranges where a defined number of
measurements must be made. In the above case there are five states:
•
'20-48' (not shown): In this state the machine is running at a constant
RPM between 20 and 48 RPM.
•
'->20-48': The RPM is changing in the 20-48 RPM range.
2008-11-20 OPENpredictor™ 2.8.0 Operator's Guide Issue 2.2 Page 2-58
•
'48-105': In this state the machine is running at a constant RPM between
48 and 105 RPM.
'->48-105': The RPM is changing in the 48-105 RPM range.
'10-20': In this state the machine is running at a constant RPM between
10 and 20 RPM.
•
•
Columns 'Range from (%)' and 'Range to (%)': 'Ranges' are sub-states
defined in % of max. RPM for the machine, in the above case 105 RPM
(defined in the Machine configuration window).
Column 'Min. Values': The minimum number of measurements in this speed
range required for calculating the baseline in this state.
Column 'Max. Values': The maximum number of measurements in this speed
range utilized for calculating the baseline in this state. If there is more than
the maximum number required, the latest values are used.
Column 'Max. days': The maximum number of days where measurements are
taken into consideration for calculation of the baseline in this state.
Column 'Alpha Averages': The minimum number of measurements needed in
this state for the calculation of the preliminary correction curve in 'Reset zero
gap'.
The baseline is calculated separately in each state. The RPM-ranges for each
state depends on the design of the engine.
2.9.2.5
Reset zero gap/Recalculate BDC Baseline – what happens?
Reset zero gap
1. A preliminary correction curve is
calculated from the first 'Alpha
average' number of measurements in each speed range.
Recalculate BDC Baseline
1. Some of the old correction curve
parameters are used for the
preliminary correction curve.
2.
Data are collected until there are enough data in all data ranges (see
below) or the 'Max. Days' since the 'Start Time for Baseline Calculation'
has expired.
3.
The final correction curve is calculated. Data used in each speed range:
• Too many data in a speed range: The most recent 'Max. Values'
data.
• Enough data in a speed range (between 'Min. Values' and 'Max.
Values': All data are used.
• Not enough data in some speed ranges within a machine state:
• Enough data in 3+ ranges: Data from all ranges are used.
• Enough data in 0-2 ranges, only: Wait until enough in 3 ranges,
but not more than the highest value of 'Max. Days' days for
each machine state. Afterwards: The correction curve is
calculated best possible. Advice: contact Rovsing Dynamics!
• No data: No calculation. OPENpredictor™ will try every hour to
see if there are any data in the machine state range and
calculate the correction curve if there are 2+ measurements.
Advice: contact Rovsing Dynamics!
2008-11-20 OPENpredictor™ 2.8.0 Operator's Guide Issue 2.2 Page 2-59
Server starting and rebooting
procedures
IMPORTANT: The Server PC and the User Interface PCs must have the
same time zone. Otherwise the time displayed may be wrong.
Starting and rebooting is normally a job for the system administrator.
However it may be useful for the regular OPENpredictor™ user in an
emergency situation.
The OPENpredictor™ Server Computer is responsible for: •
All communication between the Server, the SPUs and the User
Interface(s).
•
All direct interfaces to the Distributed Control System (DCS), if used.
•
Data storage.
•
Warning generation.
•
AutoDiagnosis™.
The OPENpredictor™ Server Computer must be operating continuously. The
operating language of the Server software is always English. This is required
to allow Rovsing Dynamics to support the users and to service the system via
a remote link.
The OPENpredictor™ User Interface Application runs only on OPENpredictor™ Client Computers, where local language versions can be used. The
OPENpredictor™ User Interface Application should NOT be run on the OPENpredictor™ Server Computer.
2.9.3
Starting/closing the OPENpredictor™ system
In case of a power failure: restart the system completely, starting
with section 2.9.3.1, followed by rebooting the SPU (see section
2.9.4).
The OPENpredictor™ User Interface on the Client Computers may be
started and stopped without restarting any other part of the system.
2.9.3.1
Start the Server Computer and software
Power up the OPENpredictor™ Server Computer and login. The servers are
starting in the correct order as 'Services', which can be checked by means of
Windows 'Control Panel' > 'Administrative tools' > 'Services'.
The last item started is the 'Server Watchdog', which: –
•
checks continuously whether all Servers needed are running.
•
restarts the Server (system) correctly in case any Server fails.
The Servers may be restarted without rebooting the SPU.
2.9.3.2
Closing down the system
Just close the Server PC the usual way, starting with closing Windows.
2008-11-20 OPENpredictor™ 2.8.0 Operator's Guide Issue 2.2 Page 2-60
2.9.4
SPU rebooting procedures
The SPU is to be rebooted in three cases: •
•
•
After changing the position of a 'MOS' flag or 'Enabled' flag; in order to
activate the change.
After downloading a new configuration.
If instructed to do so by Rovsing Dynamics service personnel.
Before rebooting: make sure all Servers are running, see section
2.9.3.1 above.
The SPU may be rebooted without restarting the Servers (see 2.9.3.1).
2.9.4.1
Remote reboot of the SPU
To be able to carry out a remote reboot of the SPU, the SPU and the network
must be running.
Make a Telnet connection to the SPU and send the Ctrl+x 'reboot' order: and select 'Run'.
1.
Open Telnet: Click the Windows Start button
2.
In the dialog box 'Run' type 'telnet ' followed by the IP address of the
SPU. This address can be found as follow: a.
b.
3.
In the OPENpredictor™ 'Browser', select the menu 'View' > 'SPU
Definition'.
The IP address is now found in the 'Host' column of the 'SPU'
definition window.
•
If the system connects properly this opens a DOS window: -
•
In the case of a failed connection (for example: network problems
to your PC) the DOS window is not opened. Then use the on-site
procedure described in section 2.9.4.2.
At the prompt, type Ctrl+x (press the Ctrl button and keep it down while
pressing the 'X' key.) For some seconds, there will be no response.
When the DOS window closes, the reboot procedure has been initiated.
2008-11-20 OPENpredictor™ 2.8.0 Operator's Guide Issue 2.2 Page 2-61
2.9.4.2
On-site reboot of the SPU
On the RO 2010 module(s) in the OPENpredictor™ rack
press the Reset button.
Pressing the button more than 5 seconds will reboot
the SPU.
WARNING: While rebooting, no measurements will be
performed.
It performs a hot boot of the built-in CPM equivalent to
the CPM boot after a power failure.
2.9.4.3
On-site power cycling of the SPU
1.
Switch off the power for the SPU.
2.
Wait for the LED's to go off, and then wait another 10 seconds.
3.
Switch on the power for the SPU.
2.9.5
Stopping and restarting the Data Server only
This procedure is used; for example, when a 'MOS' flag or 'Enabled' flag has
been changed, see section 2.3.5.3.
1.
On the OPENpredictor™ server, start 'Work Console' by clicking its icon
on the desktop, or in the line with the Windows
button.
2.
Close the Watchdog: At the prompt (normally c:\work>), type
op-services stop watchdog and press [Enter].
3.
Close the Data Server: At the next prompt type
op-services stop data and press [Enter].
To restart the data server:
1. Start the Data Server: At the prompt type
op-services start data and press [Enter].
2.
2.9.6
Start the Watchdog: At the next prompt type
op-services start watchdog and press [Enter].
How to verify that the System is operating
properly
The SPU operation may be verified as follow: 3.
On the OPENpredictor™ Server, display the 'Data Server' window (click
the Data Server in the Windows [Start] button line): -
2008-11-20 OPENpredictor™ 2.8.0 Operator's Guide Issue 2.2 Page 2-62
4.
If new data lines are added regularly, the SPU operates and transmits
data to the system. Please note that if the machines are stopped the
measurement intervals are long (minutes).
If the connection between the SPU and the Server doesn't work properly the
blue
System-Warning Lamp will flash.
2008-11-20 OPENpredictor™ 2.8.0 Operator's Guide Issue 2.2 Page 2-63
2.10
OPENpredictor™ System Hardware
There are two versions of the electronics hardware:
•
A 19-inch rack containing the electronics described below.
•
National Instruments cRIO data acquisition unit (Basic Bearing Wear
Monitoring Systems, only.) See the manuals for this unit.
The electronics convert the analogue signals from the transducers into digital
data, which is transferred to a database on the Server PC.
2.10.1
The RO2000 Signature Processing Unit (SPU)
The RO2000 SPU is the heart of the system as it executes all measurements
and data transfer to other parts of the system. Up to three SPUs can be
located in a standard instrumentation rack. Each RO2000 contains:
• 1 pcs. RO2010 Communication Processor Module (CPM), see section
2.10.2.
• 1 to 10 pcs. RO2020 Signal Processing Module (SPM), see section 2.10.3.
• 1 pcs. Integrated Power Supply, placed on the rear panel behind the
motherboard. It is fused with one 230V/10 Amp T (slow) fuse placed on
the rear panel of RO2000 in a small drawer below the power inlet
connector. The normal maximum power consumption is 6 Amps.
• A separate Cooling Unit mounted below each RO2000 Unit with 3 fans and
a 'Power' lamp. The 'Power' lamp is connected to +12VDC from the
RO2000 power supply, which also powers the fans.
• Various installation dependent accessories: Cable terminal blocks, relays,
galvanic isolators, etc.
(1): RO 2000 with one RO 2010
and one to ten RO 2020.
(2): Cooling unit with 'Power'
lamp.
19" OPENpredictor™ rack with one RO2000.
Rebooting the SPU is described in section 2.9.4.
2008-11-20 OPENpredictor™ 2.8.0 Operator's Guide Issue 2.2 Page 2-64
2.10.2
The RO2010 Communication Processor Module
(CPM)
The RO2010 CPM controls all internal and external data communication from
and to the SPU. It controls the data communication between the RO2020
Signal Processing Modules (SPM) and the OPENpredictor™ Server.
Each RO2010 contains: • Ethernet port.
• Port to control external relays.
• Slots for expansion of memory and number of ports.
• LED's for operation indication, Reset button.
The lamps, controls and inputs are: Ethernet (1)
Standard 10/100 Mb/s Ethernet connector.
Console (2)
Service connector used by Rovsing Dynamics
A/S personnel when setting-up the system.
SATA(3)
Serial ATA interface
'Auxiliary' module
(4-6, reserved)
Optional module card position. May be used for
a second serial port module (see below) or e.g.
a PCMCIA card docking station.
'Serial' module
(7-9)
Optional module card position for a RO2021
Serial Port Upgrade with 3 RS232/RS485 serial
ports:
Serial 9: RS232.
Serial 7 & 8: RS485.
(There is one more unused port on the rear
panel).
Reset button
There are several possible applications, but the
ports are typically used for
•
control of a Warning Relay Unit.
•
receiving data from a PLC using the Modbus
Interface.
Pressing the button more than 5 seconds will
reboot the SPU – see section 2.9.4.2.
WARNING: While rebooting, no measurements
will be performed.
It performs a hot boot of the built-in CPM
equivalent to the CPM boot after a power failure.
Activity
Off: No activity
Blinking Green: Activity proportional to
bandwidth utilization.
Speed
Off: No link
Yellow:10/100Base-T operation
Green: 1000Base-T operation
Fail
Yellow: Board has a failure. After Power On or
reset this LED is ON until extinguished by
firmware or software.
User
Green: Board is running and status is OK.
.
2008-11-20 OPENpredictor™ 2.8.0 Operator's Guide Issue 2.2 Page 2-65
2.10.3
The RO2020 Signal Processor Module (SPM)
The RO2020 SPM executes all defined measurements and transfers results
internally to the RO2010 CPM.
•
Each RO2020 contains:
•
8 Analogue inputs
•
Power supply for transducers
•
LED's for operation indication
The lamps and inputs are: -
'Power' lamp (left lamp)
Lights when the module receives power.
'Run' lamp (right lamp)
Lights/flashes due to data activity on any of
the inputs.
8 pcs. analogue 'Input'
connectors
Each analogue input is connected to a fast A/D
converter. The SPM has its own on-board
signal-processing units, which also calculates
signatures defined in the measurement set-up,
e.g. FFT, FRF, STA calculations. Digital
transducer signals like tachometer-pulses are
handled as analogue voltages.
2008-11-20 OPENpredictor™ 2.8.0 Operator's Guide Issue 2.2 Page 2-66
3
Glossary
AutoDiagnosis™
BDC
CM
CPM
CPU
DCS
Event
Event Window
HTML
Measurement
Mimic
MOS
OPENpredictor™
User Interface
Parameter
Plot
PMIS
RPM
Scalar
Script
Signature
SPM
SPU
System
Vector
Automatic Diagnosis methodology developed by
Rovsing Dynamics A/S. It is used for automatically
diagnosing potential machinery problems and predicting
the time of the final fault.
Bottom Dead Centre. See section 2.9.
Condition Monitoring. See section 1.2.1.
Communication Processor Module. RO2010 Module in
SPU to control internal and external data communication.
Abbreviation for the frequency unit Cycles Per Minute. 1
Hz = 60 CPM.
Central Processing Unit. The data processing part of a
computer.
Distributed Control System. The control system architecture of many large plants.
An 'event' is any measurement where its value has
passed its 'Event Window' (see below). The measurement
result is time stamped. Storage of the 'event' is in the
OPENpredictor™ database.
An Event Window is the acceptance range for variations
of a parameter, where no data transfer or storage is
required. If the actual measured value stays within the
window, no data transfer will take place between the SPU
and Server. The aim of the event principle is to reduce
the quantity of redundant data to be transferred and
stored. Hence only values (events) with a significant
difference are stored. Each event has its own timestamp.
HyperText Markup Language. The standard code
language for Internet webpages.
Signal processing algorithm, for example OTA, Overall,
Tacho, CPB, FFT, Etc. A measurement is defined in a
'measurement configuration' specifying the parameters of
the measurement. The SPU will perform the measurements repeatedly. A measurement is only stored in the
database if the 'Event' criteria for the measurement are
met, see 'Event'.
Interactive image of e.g. a plant or machine, e.g. showing the position of the transducers and their main data.
Maintenance Override Switch: Shows transducers where
warning is temporarily disengaged. Measurement data
still can be viewed.
The application programme described in this manual,
used to operate the OPENpredictor™ system.
Item in a measurement configuration, for example Lower
Frequency, Number of Lines or Gain.
Graphical presentation of measurement result(s).
Predictive Maintenance Information System.
Revolutions Per Minute.
One-dimensional measuring value, e.g. a temperature or
over-all vibration value.
A named user-accessible sub-programme.
A set of data taken at a specified (starting) time,
describing physical parameter properties in time,
frequency, transient and process domain. Examples:
•
A spectrum (amplitude versus frequency).
•
A time domain curve for a short-time incident, for
example Orbit or FSA.
•
A vector measured for example during a run-up.
Signal Processing Module. RO2020 with 8 transducer
inputs.
Signature Processing Unit. RO2000 19" frame for 1 pcs.
RO2010 CPU unit + 1 to 10 pcs. RO2020 SPM modules.
System warning. The connection to an SPU is lost.
Multi-dimensional measuring value, e.g. the amplitude
and phase of a vibration, or the x- and y-position of a
rotor relative to a fixed centre line. In OPENpredictor™
vectors are handled as multiple scalars.
2008/11/20 OPENpredictor™ 2.8.0 Operator's Guide Issue 2.1 Page 3-1
4
Index
Bold page number = Major information about the subject.
[Name], 1-4
19 inch rack, 2-65
2020 SPM module, 2-67
Acknowledge, 2-19
Actual Warning lists, 2-17
Alarm warnings, 2-15
Alert warnings, 2-15
Analog Input connectors, 2-67
AutoDiagnosis List menu, 2-4
AutoDiagnosis™, 1-6, 2-3, 2-9, 31
Recommendation, 2-10
AutoDiagnosis™ lists, 2-11
AutoDiagnosis™ messages, 2-9
Beep when warning, 2-5
Browser, 2-4, 2-42
Bulleted list, 1-4
Change password, 2-2
CM, 3-1
Condition Monitoring, 1-5
Cooling fans, 2-65
Copyrights, 1-3
CPM, 3-1
Data Server, 2-63
Date & time format, 2-50
DEFAULT, 2-45
Delete Warnings from list, 2-19
Diagnostic report, 2-30
Disclaimers, 1-4
Efficiency reduction warnings, 215
Electronics, 1-7, 2-65
Enabled flag, 2-63
Ethernet connector, 2-66
Existing transducers, 1-7
Fit to data, 2-48
Graph. See Plot
Hardware, 2-65
Input connectors, 2-67
Liabilities, 1-4
Login, 2-2
Long-term maintenance planning
warnings, 2-15
Main panel, 2-4
Maintenance, 2-16
Maintenance Override Switch, 2-6,
2-16
Maintenance warnings, 2-15
Man Machine Interface, 2-4
Management report, 2-5, 2-26, 229
Measurement, 1-7
Measurements Statistics report, 230
Menu Xxxx > Yyyy, 1-4
Mimic, 3-1
Mimic report, 2-26, 2-40
Mimic Viewer, 2-4, 2-37
Mimics
Warnings, 2-22
MOS, 3-1
MOS flag, 2-6, 2-23, 2-63
MOS Warning list, 2-17
MOS warnings, 2-6, 2-16, 2-23
Multiple graph plots report, 2-26
Note Reports, 2-31
Numbered list, 1-4
Off-line data collection, 2-52
Oil Analysis, 2-32
Opening OPENpredictor™, 2-2
Opening User Interface, 2-2
OPENpredictor™ main panel, 2-4
OPENpredictor™ User Interface
panel, 2-4
Operation warnings, 2-15
Operator Warning System, 2-15
Password, 2-2
Password, change, 2-2
PC server, 2-66
Peak position data display (plot),
2-50
Performance warnings, 2-15
Plot Manager, 2-4
Plot reports, 2-26
Multiple, 2-46
Single, 2-45
Plots, 2-4
Navigation facilities, 2-48
Peak position data display, 2-50
Scroll one grid width, 2-49
User defined, 2-46
Zoom 1/2, 2-49
Zooming, 2-48
PMIS, 1-5, 3-1
Power lamp, 2-65
Power supply, electronics, 2-65
RDM reports, 2-34
Rebooting
Servers, 2-61
SPU, 2-62
Reliability Data Management. See
RDM
Remove Warnings from list, 2-19
Report
Management, 2-5, 2-29
Mimic, 2-40
Shift, 2-5, 2-27
Reports, survey, 2-26
RO2000 SPU unit, 2-65
RO2010 CPU module, 2-65
RO2020 SPM module, 2-65
RPM, 3-1
Scalar, 3-1
Scroll one grid width, 2-49
Server
Rebooting, 2-61
Starting, 2-61
Server (PC), 2-66
Shift report, 2-26
Shift Report, 2-5, 2-27
Short-term risks warnings, 2-15
Signal Processing Module (SPM),
2-67
Signature, 1-7, 3-1
Single plot report, 2-26
SPM, 3-1
SPU, 1-7, 3-1
Rebooting, 2-62
SPU operation, verify, 2-63
Starting
2008/11/20 OPENpredictor™ 2.8.0 Operator's Guide Issue 2.1 Page 4-2
Servers, 2-61
Starting OPENpredictor™, 2-2
System warnings, 2-15
System, warnings, 2-5
Trademarks, 1-3
Transducers, 1-7
Transducers, existing, 1-7
Transducers, list of
Enabled, 2-25
MOS flag, 2-25
User ID, 2-2
User Interface main panel, 2-4
User Interface, opening, 2-2
Vector, 3-1
Verify SPU operation, 2-63
Warning history lists, 2-17
Warning History lists, 2-19
Warning indicators, 2-15
Warning levels, 2-15
Warning List window, 2-18
Warning lists, 2-4, 2-17
Actual, 2-17
MOS, 2-17
Warnings, 2-6, 2-15
Acknowledge, 2-19
Alarm, 2-5, 2-15
Alert, 2-5, 2-15
All, 2-5
Displayed on mimics, 2-22
Maintenance, 2-15
MOS, 2-6, 2-16, 2-23
Operation, 2-15
Overload, 2-5, 2-15
Performance, 2-15
Remove from list, 2-19
System, 2-5, 2-15
Watchdog, 2-61
Zoom 1/2, 2-49
Zooming, 2-48
2008/11/20 OPENpredictor™ 2.8.0 Operator's Guide Issue 2.1 Page 4-3
Document information
CLASSIFICATION
1. Unclassified
2. Industry
3. Restricted
4. Confidential
CONTRACT
Programme1:
Issuing organisation:
9
9
CATEGORY
1. Config controlled for approval
2. Config controlled for review
3. Non config controlled for review
4. For information
9
9
OPENpredictor™
Rovsing Dynamics A/S
www.rovsing-dynamics.dk
Contract number:
Contractual date:
Work package number:
Title1:
Operator's Guide - Issue 2.1 - OPENpredictor™ Version
2.8.0
Internal
O:\Peter Ring\Manuals & Bundles\2.8.0 - English\2008reference1:
03-28\OP 2.8.0 OPERATOR guide - En.doc
Software:
Microsoft Word XP for Windows
Last saved2:
2008-Nov-20 13:31
Language:
English (UK)
No. of pages2: 79
No. of annexes: 0
Summary1:
Keywords1:
operator's guide, OPENpredictor™
Prepared by1:
Peter Ring
Approved by:
Lars Glæsel
Authorized by: Ole Døssing
CCB date:
1
2
Date:
Date:
Sign:
Sign:
Automatically inserted from File > Properties field. Refresh with F9.
Automatically generated. Refresh with F9.
Document change log
Issue
Date
Modified
sections
All
0.93
2001-Sep-18
1.0
1.1
1.2
1.3
1.4
1.5
1.6
1.7
1.8
2001-Nov-1
2002-Apr-8
2002-May-14
2002-Oct-29
2002-Dec-20
2003-Mar-12
2003-Aug-1
2004-Mar-31
2004-Oct-14
2.0
2007-Nov-23
All
All
All
All
All
Warnings
All
All
2.9.3
2.10
Many
2.1
2008-Mar-28
Various
2.2
2008-Nov-20
2.9.4.2
2.10.2
Reason for change
Derived from User Manual v. 0.93
(draft) for version 2.6.2.
Updates following review.
Updated for version 2.6.4.
Final amendments for version 2.6.4a.
First amendments for version 2.7.0.
Final amendments for version 2.7.0.
Minor amendments due to changes.
Amendments for version 2.7.1.
Amendments for version 2.7.2.
Simplified procedures.
New section on database backup.
New structure with special modules +
changes for OP 2.8.0
More BDC info + Minor corrections
found.
Reboot of SPU
Legend updated for new design of
RO2010 Communication Processor
Module
2008/11/20 OPENpredictor™ 2.8.0 Operator's Guide Issue 2.1 Page 4-4