1
23 8911 CH18
10/16/00
424
1:44 PM
Page 424
Developer Tools and Support
PART IV
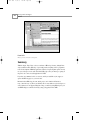
Setting breakpoints is one of the easiest tasks. The editor windows have a gray pane on the
left; you just have to click the line on which you want to stop, and a breakpoint symbol is
placed. The context menu over this pane offers advanced options to the debugger as well as
switching between breakpoint and bookmark modes. Then the debugger will start your program and the debugging options and windows will be available. These are
• Run—Executes or continues the program.
• Run to Cursor—Executes the program until the current cursor position in the source code
is reached.
• Step Over—Executes one line of code and will stop the application on the next line.
• Step Over Instruction—Executes exactly one machine instruction. The assembler code
that is executed and where the machine instructions can be monitored is the Disassemble
tab in the output window.
• Step In—Executes one line of code where you will step into the method call, if necessary.
• Step In Instruction—Executes one machine instruction as described previously.
• Step Out—Runs to the end of the stack frame and out of the function the application is
currently processing.
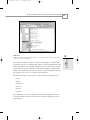
• Viewers—Opens the debugging viewers dialog where you can inspect a variety of values
of the running application, such as the disassembled code, memory status, library status,
and CPU register states.
• Stop—Stops the application execution.
• Exit—Stops the application execution and exits the debugger.
With these options, you can control the processing of your application’s execution at runtime.
On the other hand, you certainly don’t want only to hop through the source code, but you
might also want to know which values your variables have during execution time. This is the
easiest way to find the cause of a segmentation fault. To those who aren’t experts with programming yet, you may have encountered a program suddenly exiting without you wanting it
to exit. It is just gone and your work is lost. The cause of this is most often a segmentation
fault. That means that the computer tries to access an object the program refers to, but the
object doesn’t exist. The program will crash in that case because it violates the memory protection by wanting to access an address area that it isn’t allowed to. Development of C++ and C
applications often involve the use of pointers to objects that are the cause of most segmentation
faults; therefore, you surely want to watch if a pointer is valid during runtime. The KDevelop
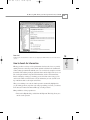
debugger now offers the Watch functionality for variables. In the VAR tabulator, you get a Tree
View of all objects of the application and their status. There, you can select which variables