1
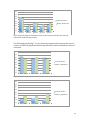
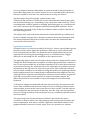
BACHELOR THESIS Percieved Difference in Equalizing Workflow Between a Control Surface and a Mouse and Keyboard What Differences in Workflow do Sound Engineers Perceive Between Rotary Controllers and Mouse and Keyboard when Equalizing with Parametric Ludvig Larsson 2014 Bachelor of Arts Audio Engineering Luleå University of Technology Institutionen för konst, kommunikation och lärande Perceived difference in equalizing workflow between a control surface and a mouse and keyboard What differences in workflow do sound engineers perceive between rotary controllers and mouse and keyboard when equalizing with parametric equalizer software? Ludvig Larsson Lulea University of Technology 2014 Abstract In this research an experiment was made to understand how engineers perceive the differences between using a physical rotary knob and graphical user interface (GUI) for an equalizing task. Subjects were given tasks with control surfaces and with GUIs and a questionnaire to find out if there is a perceived difference in workflow in two different interaction situations with a software parametric equalizer. Comparisons based on tasks and questions and overall comparisons are made between the perception of control surface interaction and the mouse and keyboard interaction. Different comments from the subjects are discussed and an evaluation of the experiment and influencing variables was made. Results show that there are perceived differences but they are also task and experience dependent so there is no way of saying that an interaction method is doing the job better than the other. What could be concluded are that overall, almost all subjects, preferred the interaction with the control surface. 1 Table of Contents Abstract .................................................................................................................. 1 Introduction ........................................................................................................... 3 The equalizer interface and interaction ................................................................................................... 3 The equalizing task ............................................................................................................................................ 4 Method .................................................................................................................. 5 Equipment and setup ........................................................................................................................................ 5 Stimuli ..................................................................................................................................................................... 6 Tasks ........................................................................................................................................................................ 7 Questionnaire ....................................................................................................................................................... 7 Additional data collected ................................................................................................................................ 8 Pilot study .............................................................................................................................................................. 8 Subjects ................................................................................................................................................................... 8 Experimental Procedure ................................................................................................................................. 8 Results & Analysis ................................................................................................... 9 Results from questions between each task ............................................................................................. 9 Results from questions after tasks .......................................................................................................... 13 Discussion ............................................................................................................. 15 Experiment evaluation .................................................................................................................................. 16 Further research .............................................................................................................................................. 17 Conclusions ........................................................................................................................................................ 17 References ............................................................................................................ 18 Appendix .............................................................................................................. 19 2 Introduction Audio engineers using tools with different types of interfaces, some physical as knobs and faders, which provide tactile feedback. We also have purely virtual tools that often require adjustments with a mouse and keyboard. In addition our tools function and features, the visual and tactile feedback influences how we use it [1]. It is important to understand how visual and tactile information could affect the use of audio tools. And since graphical and visual interfaces are becoming more and more important in audio engineering, it is vital to understand how this changes the workflow. One tool where the visual interface is particularly important is the parametric equalizer. This is used in most audio application to for example alter the frequency response of a sound, remove resonance or adjust the timbre of instruments. In most of the different software parametric EQ designs the underlying signal processing function is basically the same and mostly only the user interfaces are different. Nonetheless it has to be considered that the graphics and visual information will affect the workflow and how the users equalize. One outcome of this is that it will affect how effective the user does the task that is intended but there are also other aspects. The intuitive and creative part of the equalizing workflow also affects the result. Because equalizing sometimes is a task guided by subjective preferences the “technical” visuals, graphics and interaction could be a hindrance for the process. [2] The purpose with this work is to determine whether the method of interacting with a software parametric equalizer have a significant impact on the perception of the workflow. This could give relevant information in how to think around these different interaction systems when equalizing and creating new systems. The equalizer interface and interaction In the early days of the digital recording and processing area the concept of control surfaces often was to reduce the physical size of the traditional mixing desk, but keep the idea of a similar device used as a remote [3]. Today various kinds of control surfaces have been developed for different budgets and tasks, generally using the faders and rotary knobs as a basic layout and menu buttons and layers for different functions. There is also very common to mix “in the box” and only use a mouse and keyboard with the computer to adjust all parameters in the mixing process. When using mouse and keyboard you are selecting, clicking and dragging visual knobs, faders and buttons on the screen, typing in numbers or use combined mouse and keyboard combination to get quick access to certain functions. In that situation there could be bad precision, struggle with zoom commands and knobs who has unnatural movement patterns for the mouse. Because these often are substitutes for real analogue counterparts with higher precision and a natural tactile input it could be preferred to drag in the EQ-‐curve, which is more natural and effective with the mouse. [4] Another problem to consider with visual displays is the fact that it can make the user want to draw a good-‐looking EQ-‐curve instead of listening to the results. 3 The user can shift the focus from listening to watching, because of the limitation in human perception. [2] [5] The equalizing task The adjustments of the equalizer parameters are ideally made in response to the spectral content of the audio. The focus on the sonic content of the audio that the user wishes to process is significant. The rotary knobs in the traditional mixing desk meets this need and works with a tactile and sensorial relationship with the audio. Mycroft and Paterson observes, “The engineer can place fingers on the dials and adjust them in a way that does not break his or her connection with the sonic artifact but rather takes them into his or her experience of the world” [2]. The possibility to focus on the audio without having to watch the screen and at the same time changes the parameters could be an advantage. At the same time the parameter information displayed by the knobs provides an important source of data and if the user can choose to attend to the information whenever it is necessary, it creates a valuable tool for verification and reference. The basic parameters of the equalizer are the frequency band, q-‐value and gain. The q-‐value is how wide frequency spectrum that will be affected and gain is the amount of boost or cut in the chosen frequency area. There is also different type of filters where the most common is peak, shelving and pass-‐filters. The pass filter (low or high) let all the frequencies above or below the set frequency pass, and takes away the rest. The peak filter creates a dip or peak in the frequency spectrum around the chosen frequency with a bell shaped curve, which width is dependent on the q-‐value. The shelving filter (low or high) is designed to increase or reduce the frequencies below or above the set frequency with an equal gain. The pass-‐ and shelving filter also has a slope, depending on the filter construction or setting (See Fig 1). [6][7] Fig.1 Curve examples of a high pass filter, a peak and low shelving filter with increased gain. There are a number of typical trends in the ways people use the equalizer [6]. In the workflow to improve the sound of single instruments in a mix it is common that engineers first cut away the unwanted bass-‐frequencies with a high-‐pass filter. Then try to find unwanted and/or resonant frequencies by boosting a band with narrow q-‐value and sweep through the frequencies to find it and then remove a certain amount in that frequency area or areas. Thereafter the same procedure could be made to find preferred frequencies and boost them to satisfaction. This method is often used to get an EQ-‐setting to work from for an instrument in the mix. 4 Method To investigate if there is a perceived difference in the workflow and result between the two different interaction methods of a control surface and mouse and keyboard, an experiment, consisting of an active user task and a questionnaire, was made. The active task contained the two different interaction methods for equalizing. The subject was given a set of equalizing tasks to complete with each of the interaction methods. There were three different tasks each with different stimulus and all the tasks were made with both ways of interaction. Both the order of the tasks and the interaction method was randomized. With the control surface the subjects could choose to use the screen or not, because all parameters was able to perceive from the surface. Which give the possibility, as previously discussed, to focus on the audio without having to watch the screen and at the same time changes the parameters. In the key mouse it is mostly necessary to watch the screen to be able to interact and see how parameters are changed. To evaluate the perceived workflow several factors of interaction was treated in the questionnaire. For example the feeling of certainty, understanding how to do what is intended, how much time it takes to get to get from start to end in the task and what the end result is or sounds like. The number of frequency bands, type of filters and equalizer parameters were defined to four bands, two with peak-‐filters and two that were switchable between peak-‐ and shelving filters. Every band has a frequency, gain and Q-‐value parameter. The definition is based on its simplicity and it is a commonly used design in both classic console EQs and software EQs [5] [7]. The EQ-‐curve was visual represented when using the control surface and both visual and interactive represented when using the mouse and keyboard. Equipment and setup A Behringer BCR 2000 [9] was used as control surface in the experiment. It contains programmable buttons, rotary encoders and the layout was able to adjust to a graphic software parametric EQ with some extra functions. The control surface was assigned to a visual representation of a parametric EQ built up in Apple MainStage2 [10] as an “on screen control” (See Fig 2 and 3) This was thereafter mapped to a 4-‐band software parametric equalizer, the Waves Renaissance Equalizer [11], in 6 different “mixes”. Each mix had one of the 3 stimuli and one of the 6 tasks. Fig 2 – Control surface used in experiment Fig 3 – Visual eq-‐representation in MainStage 5 The Waves Renaissance Equalizer has the possibility to limit the EQ to four band with a draggable visual EQ-‐curve, it can change the filters between bell and shelving and it was possible to hide its unwanted functions below the edge of the screen. (See Fig 4) Fig 4 – The screen during the experiment Except for the rotary knobs for the four bands there was buttons both on the screen and on the CS for: Shelving on/off for the highest and lowest frequency band, band on/off for each frequency band, EQ on/off, play/pause, jump to start and loop. There was also an adjustable volume knob, the waveform that is playing and a virtual VU-‐meter. In the center there was a textbox explaining the task and which interaction method that was going to be used. To get as natural interaction as possible with the Control Surface some parameters were set in main stage. The bands were limited to a certain frequency range of Lo: Lo mid: Hi mid: High: Because of the limited resolution of 127 steps in the MIDI protocol. The Q-‐value and Gain also had a point set as “normal” were more than one number of MIDI input values represented that point, Gain at +-‐0dB and Q-‐value at 0,8. Stimuli Recordings of a grand piano, an electric bass and a steel string guitar were used as stimuli for the different tasks. The piano was boosted with 13,5 dB at 740 Hz to create at least one obvious resonant frequency. The bass was cut with 15,5dB at 3000 Hz to remove the clear finger sounds. The acoustic guitar was kept unprocessed. All examples were between 10-‐15 sec so the frequency response did not change too much over time and so the subject could get comfortable with the audio content pretty quick. The chosen stimuli were based on the different tasks. The audio is, before these filters, unprocessed recordings that could be 6 found as material to mix in popular music, trying to represent a common mix situation. Tasks There was one cutting, one boosting and one more subjective and practice-‐ related task for each method of interaction. This is because variations of the type of task give a more justified picture of the workflow. The tasks were: “Remove the resonant frequency/frequencies in the piano.” “Make the string/finger sound clear and distinct in the bass guitar, without cutting or remove any low-‐end frequencies in the instrument. “ “Use the equalizer to improve the sound on this acoustic guitar from your own preferences.” Questionnaire The questions had the NASA Task Load Index, a subjective workload assessment tool [8], as a point of departure. With changes and additions to fit this experiment. The questions to be answered by the subject between each task was: “How well did you accomplish what you were asked to?” “How frustrated were you?” “How much time did you have to spend to complete the task?” “How insecure were you?” “How hard did you have to work to accomplish your level of performance?” Every question had five check boxes with a scale from very bad/little to very good/much. For example: How well did you accomplish what you were asked to? (See appendix for the whole question forms) These questions were showed to the subjects before the experiment so that the result would not be affected between the first and second task. After all tasks were completed, subjects answered a final set of questions: “What was your overall impression of difficulty in the interaction with the mouse and keyboard?” “What was your overall impression of difficulty the interaction with the control surface?” “How big difference did you notice in efficiency of your workflow between the two interaction methods?” These questions also had the scale with five checkboxes. Then there were one question of “Which interaction method did you prefer?” and two open questions for the subject to write down their thoughts “If you preferred one of the 7 interaction methods motivate” and “Other thoughts or comments around the interaction that you want to share” All questions and tasks were in the subject’s main language Swedish during the experiment, to exclude linguistic misunderstandings, these are the translations. Additional data collected Except for the questionnaire the actual time for each task was captured with a stopwatch. The time was captured from the moment the subjects had understood the task instructions and pressed play until they were done with the task. This was done for comparisons with the perceived time of interaction and to have one parameter of efficiency to compare the subject’s perceived workflow with. Pilot study A pilot study was made with three sound engineer students at Luleå University of Technology. Each with different main experience with equalizing; music studio, post production and live. This was made to evaluate the experiment and ensure that everything was understood correctly and that nothing was unclear or felt strange. This was set up in the same way as the main experiment except for a few improvements that was made after their experiment evaluations. The question of the boost task was refined to prevent the subject from cutting in the low frequencies. The control surface was given printed frequency, Q-‐ and gain values for each band, before it just had function and colors printed. The significance of clear experiment instructions was also discovered in the pilot study. Subjects The subjects were 15 sound engineer students that were experienced in the use of a parametric equalizer with both a mouse and some kind of pots or rotary controllers. Experimental Procedure The instructions were verbally given to the subjects at the same time as all the functions of the control surface, the on screen EQ functions etcetera, were shown. “In this test you are going to do a couple of equalizing tasks. Then you are going to answer these questions between each task on how you perceived it. The task instructions will be given to you on the screen. When it says CS you can only use the control surface. When it says M/K you can only use the mouse and keyboard. When using M/K everything on the screen can be used but no windows should be moved. Everything that is on the CS has a representation on the screen. When you feel that you are done with a task you press pause and fill in the questions.“ After the instructions they tried all the functions and the feeling of the different interaction methods out on their own before the actual tasks. This to exclude some of the problem with the subject’s learning curve in the experiment. 8 The audio playback setup was the internal soundcard from a laptop and AKG k240 headphones. The rest of the equipment during the experiment was a wireless Logitech mouse and keyboard and the control surface in front of an external screen connected to the laptop with Main Stage running. (See Fig 5) Fig 5 – The experiment situation Results & Analysis Results from questions between each task Though it is task and dependent if there is a statistical difference between the interaction methods for each question, an overall difference is visible if all type of tasks is combined. This table (Table 1) compares the different interaction methods for each question with summed tasks. A number: 1,2,3,4 or 5 represent the subject’s answer from the checkboxes for each question. A paired t-‐test was made between the two interaction methods to see if the difference was statistically significant. The questions in all tables and graphs is marked with: Quest 1: How well did you accomplish what you were asked to? Quest 2: How frustrated were you? Quest 3: How much time did you have to spend to complete the task? Quest 4: How insecure were you? Quest 5: How hard did you have to work to accomplish your level of performance? And the tasks in all tables and graphs is marked with: Task 1 and 4: Remove the resonant frequency/frequencies in the piano. Task 2 and 5: Make the string/finger sound clear and distinct in the bass guitar, without cutting or remove any low-‐end frequencies in the instrument. Task 3 and 6: Use the equalizer to improve the sound on this acoustic guitar from your own preferences. 9 Table 1 shows summed tasks divided by interaction method and questions. Two-‐tailed critical t-‐value for statistical significance is 2,01 when α= 0,05 and df= 44. Because three different tests are made on the same set of data a Bonferroni correction had to be made to maintain the statistical significance. This means that α is lowered to 0,01 and the two-‐tailed critical t-‐value becomes 2,692. This gives a statistical difference between the interaction methods in the question about frustration level (Quest 2). Table 1. Table with summed tasks divided by interaction method and questions. 10 5,0 4,5 4,0 3,5 3,0 Control Surface 2,5 Mouse / Keyboard 2,0 1,5 1,0 Quest 1 Quest 2 Quest 3 Quest 4 Quest 5 Fig 6. Graph showing the arithmetic mean of the summed tasks broken down by interaction method and questions. The following graphs (fig 7-‐11) are showing comparisons between the control surface and mouse/keyboard divided by questions with the arithmetic mean of each task. 5,0 4,5 4,0 3,5 Control Surface 3,0 Mouse / Keyboard 2,5 2,0 1,5 1,0 TASK 1 TASK 4 TASK 2 TASK 5 TASK 3 TASK 6 Fig 7. Mean of the question: How well did you accomplish what you were asked to? 5,0 4,5 4,0 3,5 Control Surface 3,0 Mouse / Keyboard 2,5 2,0 1,5 1,0 TASK 1 TASK 4 TASK 2 TASK 5 TASK 3 TASK 6 Fig 8. Mean of the question: How frustrated were you? 11 5,0 4,5 4,0 3,5 Control Surface 3,0 Mouse / Keyboard 2,5 2,0 1,5 1,0 TASK 1 TASK 4 TASK 2 TASK 5 TASK 3 TASK 6 Fig 9. Mean of the question: How much time did you have to spend to complete the task? 5,0 4,5 4,0 3,5 Control Surface 3,0 Mouse / Keyboard 2,5 2,0 1,5 1,0 TASK 1 TASK 4 TASK 2 TASK 5 TASK 3 TASK 6 Fig 10. Mean of the question: How insecure were you? 5,0 4,5 4,0 3,5 Control Surface 3,0 Mouse / Keyboard 2,5 2,0 1,5 1,0 TASK 1 TASK 4 TASK 2 TASK 5 TASK 3 TASK 6 Fig 11. Mean of the question: How hard did you have to work to accomplish your level of performance? 12 Table 2 is showing the actual time for each task and subject, with results written in seconds. There is no statistical significant difference between the interaction methods in the tasks. The critical t-‐value is 2,718 df= 14 and α= 0,016667 with Bonferroni correction. The graph (fig 12) shows the arithmetic mean of the time in each task. Table 2. Seconds to complete each task 140 120 100 80 Control Surface 60 Mouse / Keyboard 40 20 0 TASK 1 TASK 4 TASK 2 TASK 5 TASK 3 TASK 6 Fig 12. Average time to complete each task Results from questions after tasks These were questions asked after all tasks had been completed, so it is an overall assessment of the perceived workflow for each subject. The critical t-‐value is 2,145 with α= 0,05 and df= 14 in both Table 3 and 4, which give a statistical significance in both cases. 13 Table 3 is showing the answers of the two questions: “What was your overall impression of difficulty in the interaction with the mouse and keyboard?” and “What was your overall impression of difficulty in the interaction with the control surface?” And the graph shows the mean of the answers. 5,0 4,5 4,0 3,5 3,0 2,5 2,0 1,5 1,0 Control Surface Mouse / Keyboard Table 3. Answers of overall difficulty Fig 13. Showing mean value of Table 3 with interaction (high value is very easy) Table 4 is showing the answers of the question: “How big difference did you notice in efficiency of your workflow between the two interaction methods?” 1 -‐ Very small, 2 – Small, 3 – Fairly, 4 – big, 5 -‐ Very big 5,0 4,5 4,0 3,5 3,0 2,5 2,0 1,5 1,0 Difference in efoiciency between the interaction methods Table 4. Difference in efficiency of workflow Fig 14. Showing mean value of Table 4 14 All except one, that is 93,3% of the subjects, prefer the interaction of the control surface rather than the mouse and keyboard. Which give a statistical significance in a binominal test with α set to 0,05 (The cumulative probability is in this case 0,0005). Some comments and motivation around why the questions, after all the tasks were finished, give a clear statistical significance will be brought up in the discussion section. Discussion In the questions answered between each task (see Table 1) there is only one question were it is a statistically significant difference between the users perceived interaction and that is the question “How frustrated were you?”. This could have several reasons; one obvious is that the perceived difference in the workflow was unessential but it could also be because of the number of subjects participating and difficulty level of the tasks for example. Some other reasons are discussed in the experiment evaluation. But in almost all cases except in the bass boost task, subjects show a preference for the control surface in the average results in the graphs (fig 7-‐11). Even if it is not statistically significant it is a trend that could give a hint of something and in most cases the subjects were less frustrated, insecure and had to work less hard with the control surface than the mouse and keyboard. This should not be seen as something to make a clear definition from. But it give a good explanation for the answers to the questions asked after all the tasks were finished, were there is a significant result, and all except one of the 15 subjects prefer the control surface as interaction method. When looking at the chart of the average of the actual time it took to complete the tasks and comparing it to what the subjects perceived as time spent to complete the tasks they do have similar trends. In the questions asked after all tasks had been completed the mouse and keyboard is clearly seen as more difficult to interact with than the control surface. There is also a significant perception that there is a difference in efficiency between the different interaction methods, somewhere between a fairly and big efficiency difference due to the scale of the questionnaire. The perception of how well the subjects accomplish what they were asked to and how much time it took does not show any major differences. So the end result and the time it takes to get there may not be especially different all between the interaction methods. What you experience on the way to the end result in frustration, certainty and work seem to differ a lot more. As the two comments from the subjects confirm "Both formats have their advantages and disadvantages. One can quickly locate frequencies with your mouse while you can do it more carefully with a control surface. " "Can depend on the control surface you're working on but generally I think I prefer the surface over the mouse / keyboard." 15 It is very task and situation dependent on which method of interaction that is preferable. Many times the control surface is not so well adjusted to the actual software equalizer as in this case, and in some cases they are indeed. One motivation for preferring the control surface was: "When you did not have to look at the screen it became that I mixed more with the ears than with my eyes. Something I very easily does with visual EQ." This is something that could be applied to working with analog gear too, which may be one of the reasons to preferring the traditional mixing desk equalizer. It also confirms the reasoning in [2] of that the technical visuals could be a hinder for the equalizing process. The subject who preferred mouse interaction commented that it probably was because of habit and experience. Another comment about the advantages with the mouse/keyboard interaction is that it does not have the limitations that come with a control surface. Experiment evaluation All subjects were very used to working “in the box”. A more varied subject group may have shown more significant preference differences. If the subjects had been some generations older, for which the mouse and keyboard not were a natural part of learning the equalizing process, it could have been a bigger difference in advantage for the workflow of the control surface. The particular plug-‐in and control surface chosen may have impacted the results. Though the Waves Renaissance equalizes is widely spread and quite common to use it is not representable for all software equalizers GUI. It was chosen because of practical reasons in the experiment but was a little bit oversensitive to mouse movements in the EQ-‐curve as some users perceived. This could have affected the perceived workflow for the subjects using this method of equalizing with the mouse and keyboard. One comment that confirmed that this might be true was: “Hate the Waves-‐equalizer specifically but still prefer control surface in general.” If the EQ-‐curve had been less sensitive to mouse movements may be the differences had been even smaller or more advantages for the mouse and keyboard. To be able to change the tasks and take time the researcher was present in the room. That could have affected some subject’s focus or feeling of time pressure when another person in the room could perceive their actions. But the subjects used headphones and was aware of that they were the only ones hearing what they were doing and many of the situations were you ordinarily equalize you are not alone either. The answering scale for the questions could have been wider for better resolution to may be able to see other patterns and create proper boxplots and other comparisons. Now there could be a difference that did not shown in the graphs and tables because of coarse steps. There are, however, no obvious 16 indicators that data with greater resolution would have led to different conclusions in this study. It should be discussed if the EQ-‐curve should be visual and/or interactive represented in the graphics of the parametric equalizer. It is very common to interact with the help of dragging the EQ-‐curve in the mouse-‐keyboard situation but also common to use the virtual knobs. With the rotary controllers you can only interact by turning the rotary knobs and watch an EQ-‐curve. With an interactive EQ-‐curve the engineer may have a different workflow. This addition would offer more ecological validity, but the cost would be control over the variables or the ability to compare interactions in the experiment. In this experiment were the result is based on the subject’s perception of the interaction it was chosen to have an interactive EQ-‐curve because of the ecological validity. No subjects asked questions about the interaction methods or meaning of the questions after the introduction. So there were no visible uncertainties or doubts during the experiment. Further research To examine this further other type of equalization situations could be considered, were the task is something else than music mix situations. Also the equalizing process is something that depends on the audio and other factors around it. Could there be a difference in the workflow of equalization with different interaction methods when actually mixing? There is also a lot of different situations were a control surface could be used to control plug-‐ins or other parameters in audio production, these areas would be interesting to see if there is a different outcome. In this research there is many different aspects and considerations to why the control surface is preferred, even if the end result does not differ that much it would be interesting to isolate these aspects and examine them further. It would also be fascinating to look at the actual difference in equalization results, and not just what the user perceive, to see if there is any difference in the frequency responses and workflow. Conclusions In the summed table, which divides the answers by interaction method and not by task, there is a statistical significant difference in perceived frustration between the interaction methods to the control surface advantage. There are perceived differences but they are also task and experience dependent, so there is no way of saying that an interaction method is doing the job better than the other. What could be concluded is that almost all subjects preferred one way of interaction overall, which is concluded by the questions answered after the tasks. This could also have an affect to a certain amount in the long run, to enjoy or prefer the tool you work with and not get tired or frustrated after using it during a long period, even if the end result and the time it takes to get there do not differ that much. 17 References [1] E. Bruce Goldstein (1981). The Ecology of J. J. Gibson's Perception. Leonardo Vol. 14 No. 3 pp. 191-‐195. [2] Mycroft, J., Paterson, J. (2011) Activity Flow in Music Equalization: the Cognitive and Creative Implications of Interface Design. AES Convention E-‐Brief, 10. Presented at AES 130th Convention, London. [3] East, John W., Frindle, P. A., Harrison, S. I. (1995) Philosophy and Implementation of a High-‐End Assignable Control Surface for a Digital Audio Mix System. Presented at AES 99th Convention, New York. Preprint 4123. [4] Hlatky, M., Gohlke, K., Black, D., Loviscach, J. (2009) Enhanced Control of On-‐ Screen Faders with a Computer Mouse. AES Convention paper, 7738. Presented at AES 126th Convention, Munich. [5] Dewey, C., Wakefield, J. (2013) Novel designs for the parametric peaking EQ user interface for single channel corrective EQ tasks. AES Convention paper, 8855. Presented at the 134th AES Convention, Rome. [6] Jay Hodgson (2010). A field guide to equalisation and dynamics processing on rock and electronica records. Popular Music, 29, pp. 283-‐297. doi:10.1017/S0261143010000085 [7] Massenburg, G. (1972) Parametric Equalization. Presented at AES 42nd Convention, Los Angeles. [8] NASA TLX: Task load index. Historical reference for NASA TLX. Retrieved 2014-‐04-‐23 from http://humansystems.arc.nasa.gov/groups/tlx/index.html [9] Behringer. BCR 2000 product description. Retrieved 2014-‐04-‐23 from http://www.behringer.com/EN/Products/BCR2000.aspx [10] Apple Inc. MainStage 2 user manual. Retrieved 2014-‐04-‐7 from https://documentation.apple.com/en/mainstage/usermanual/index.html#chapt er=1%26section=1%26tasks=true [11] Waves. Renaissance Equalizer Manual. Retrieved 2014-‐04-‐23 from http://www.waves.com/1lib/pdf/plugins/renaissance-‐equalizer.pdf 18 Appendix Questions between each task 19 Questions after tasks 20