1
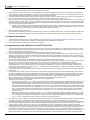
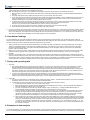
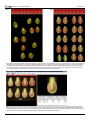
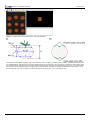
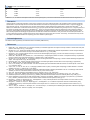
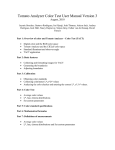
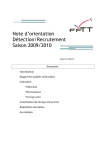
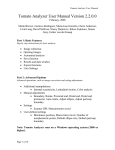
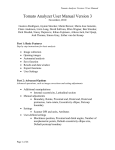
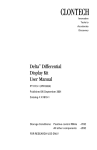
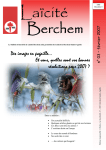
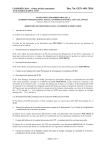
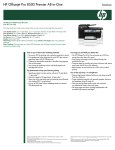
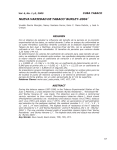
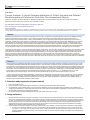
Journal of Visualized Experiments
www.jove.com
Video Article
Tomato Analyzer: A Useful Software Application to Collect Accurate and Detailed
Morphological and Colorimetric Data from Two-dimensional Objects
Gustavo R. Rodríguez, Jennifer B. Moyseenko, Matthew D. Robbins, Nancy Huarachi Morejón, David M. Francis, Esther van der Knaap
Department of Horticulture and Crop Science, The Ohio State University
Correspondence to: Esther van der Knaap at [email protected]
URL: http://www.jove.com/index/Details.stp?ID=1856
DOI: 10.3791/1856
Citation: Rodríguez G.R., Moyseenko J.B., Robbins M.D., Huarachi Morejón N., Francis D.M., van der Knaap E. (2010). Tomato Analyzer: A Useful Software Application to Collect
Accurate and Detailed Morphological and Colorimetric Data from Two-dimensional Objects. JoVE. 37. http://www.jove.com/index/Details.stp?ID=1856, doi: 10.3791/1856
Abstract
Measuring fruit morphology and color traits of vegetable and fruit crops in an objective and reproducible way is important for detailed phenotypic
analyses of these traits. Tomato Analyzer (TA) is a software program that measures 37 attributes related to two-dimensional shape in a
semi-automatic and reproducible manner1,2. Many of these attributes, such as angles at the distal and proximal ends of the fruit and areas of
indentation, are difficult to quantify manually. The attributes are organized in ten categories within the software: Basic Measurement, Fruit Shape
Index, Blockiness, Homogeneity, Proximal Fruit End Shape, Distal Fruit End Shape, Asymmetry, Internal Eccentricity, Latitudinal Section and
Morphometrics. The last category requires neither prior knowledge nor predetermined notions of the shape attributes, so morphometric analysis
offers an unbiased option that may be better adapted to high-throughput analyses than attribute analysis. TA also offers the Color Test application
that was designed to collect color measurements from scanned images and allow scanning devices to be calibrated using color standards3.
TA provides several options to export and analyze shape attribute, morphometric, and color data. The data may be exported to an excel file in batch
mode (more than 100 images at one time) or exported as individual images. The user can choose between output that displays the average for
each attribute for the objects in each image (including standard deviation), or an output that displays the attribute values for each object on the
image. TA has been a valuable and effective tool for indentifying and confirming tomato fruit shape Quantitative Trait Loci (QTL), as well as
performing in-depth analyses of the effect of key fruit shape genes on plant morphology. Also, TA can be used to objectively classify fruit into various
shape categories. Lastly, fruit shape and color traits in other plant species as well as other plant organs such as leaves and seeds can be evaluated
with TA.
Protocol
Tomato Analyzer (TA) software is designed to recognize objects of a certain size and image resolution, measured in dots (pixels) per inch (dpi).
The software automatically determines the boundaries of fruit in a scanned image. The object boundary is determined through contour tracing,
which results in a list of adjacent points describing the border of an object in an image. All fruit shape measurements are calculated based on the
boundaries. The color test module "Tomato Analyzer Color Test" is designed to quantify the color parameters inside the boundaries recognized by
the software. The color measurements are based on the RGB color space: R (red), G (green), and B (Blue). The average RGB values for each
pixel is taken by Color test module and then translated to the CIELAB color space which uses L*, a*, b* to describe color in a way that
approximates human visual perception. The Color test module calculates Hue and Chroma color descriptors based on a* and b*.
A step-by-step protocol is described for digitalization of tomato fruit and subsequent semi-automatic analysis of morphology and color attributes
using the TA software package. The protocol is divided into eight steps: 1) Selection and preparation of plant material, 2) Image collection, 3)
Software installation, 4) Image analysis and calibration for the TA Color Test, 5) Manual adjustment of attributes, 6) User-defined settings, 7)
Saving and exporting data, and 8) Examples of data analysis.
1. Selection and preparation of plant material
1. Fruit must be clean and dry.
2. Fleshy fruit should not be overripe because softening may cause shape deformation when cutting the fruit.
3. Cut the fruit with a sharp serrated knife or a new razor blade. Depending on the type of analysis and the attributes to be evaluated, fruit
should be cut longitudinally or transversely through the center. Color analysis can be applied to longitudinally or transversely cut fruit as well
as other sections designed to highlight specific features.
4. Dry the internal part of the fruit by blotting with tissue or paper towels if the fruit is very juicy.
2. Image collection
1. Cut fruit and place on the scanner with the cut side down. Place a ruler above and a label below the fruit. The ruler is used to verify that the
correct scan resolution has been selected, and is important for the accurate measurement of fruit attributes. For high-throughput analysis of
the data, it is essential to scan fruit from only one plant (or genotype) at a time and to scan fruit that is either longitudinally or transversely cut
but not a mixture of both on the same scan. Place fruits close together, but avoid having adjacent fruit touching. Also avoid large empty
spaces between the fruits on the scanner. If the objects are too far apart from each other, the image must be manipulated using imaging
software such as Adobe Photoshop or GIMP prior to analysis with TA.
2. Since TA software uses image resolution to accurately measure size, proper selection of the scan resolution is important for later analysis.
1. As a rule, if the objects are between 1 and 8 cm, scan at 200 or 300 dpi (pixels/inch). If the objects are > 8 cm, scan at 100 dpi. For
very small (< 1 cm) objects such as seeds, scan at 750 dpi or higher. When batch analysis is planned (see below) and the fruit size is
not highly variable among different plants, it is convenient to select one scanner resolution setting for all images to be collected for the
same experiment.
Copyright © 2010 Journal of Visualized Experiments
Page 1 of 9
Journal of Visualized Experiments
www.jove.com
2. For Color test, set the resolution of the scanner to 200 dpi if the fruits are < 8 cm. If the fruits are >8 cm, scan at 100 dpi. Also, set the
output image size at highest number of color available in the scanner.
3. Objects should be scanned with a black or very dark background to prevent shadows that will interfere with the analysis. A dark background
can be obtained by placing a cardboard box over the scanner so that all light is restricted from the screen. If a white background is used, TA
will fail to function because the application is optimized for the use of a dark background.
4. The image should be cropped after the initial scan (before saving the image) to avoid large empty spaces. If the image is not cropped at this
stage, it must be cropped using imaging software such as Adobe Photoshop or GIMP prior to analysis with TA.
5. For Color analyses, the scanner will need to be calibrated if the user intends to translate RGB values to the universal L*, a* and b* scale. The
scanning of the color checker (Figure 1) should occur before or during the scanning of the fruits. The scanned color checker should be saved
in the same folder as the fruit images. Scanner calibration is necessary because scanners differ in how they capture color data and the light
source may change over time with repeated use.
1. Obtaining color standards and scanning. Color standards should be chosen based on the broad range of colors observed in the crop of
interest. For this example, we chose a standard 24-color rendition chart (ColorChecker, X-Rite, Grand Rapids, MI, Figure 1). Scan the
color checker as you would scan the fruits. Scanner calibration is explained in section 4.7.
6. Save the scanned image as a JPEG file.
Note: Be careful and precise when placing the objects on the scanner during the image collection step. The better the objects are aligned, the
less manual adjustment will be necessary when analyzing the fruit in TA. Examples of low and high quality images are shown in Figure 2.
3. Software installation
1. Tomato Analyzer (TA) version 2.2.0.0 can be downloaded from http://www.oardc.osu.edu/vanderknaap/tomato_analyzer.htm. The Tomato
Analyzer User Manual and the Tomato Analyzer Color Test Manual are also available from this website.
2. TA requires a Windows operating system (version 2000 or higher).
4. Image analysis and calibration for the TA Color Test
1. The folder with images must be placed on the hard drive and not in the "My Documents" folder or on a remote server. Otherwise, TA will not
save the adjusted images in the same folder as the original images. Ensure that the adjusted images with the extension .tmt are in the same
folder as the original .jpg images (see step 6.1.1).
2. Launch the TA program as you would any other software application by double clicking on the icon.
3. The user must set the dpi and measurement units to the appropriate settings by selecting "Scanner DPI" from the "Settings" menu. The dpi
setting must be the same as the image file so that the size measurements (height, width, perimeter, area) are accurate. The "Units used" in
the dialog box determines the units (cm, mm, in, or pixel) for the data output. In the same dialog box, the brightness may need to be adjusted
when the objects are relatively dark.
Note: The DPI and Units can also be adjusted after making manual adjustments or after image analysis.
4. The user may select the attributes to be measured by selecting "Measurement Saved" from the "Setting" menu. This can be done at any time
during or after the analysis. The attributes are grouped in ten categories (i.e. Basic Measurement, Fruit Shape Index, Blockiness,
Homogenity, Proximal Fruit End Shape, Distal Fruit End Shape, Asymmetry, Internal Eccentricity, Latitudinal Section and Morphometrics).
Individual attributes or an entire measurement group can be selected or deselected by clicking on the group or attribute. All attributes of a
measurement group can be shown by clicking on the "+". The selected attributes are displayed by category in the window in the bottom right
corner of the screen as shown in Figure 3.
5. To get started, click on the "Open image" button and select the image file from the pop-up dialog box. The selected image will be displayed in
the left window.
6. To analyze the opened image, click the "Analyze" button. When finished, the perimeter of each fruit will be highlighted with a yellow line and
the data will be displayed in the lower-right data window. The software will automatically deselect very large or small objects, such as a ruler
or label. The deselected objects will be highlighted with a blue line. Additional fruits can be deselected by right clicking on their image. Only
items outlined in yellow will be displayed in the data window and exported (Figure 3). Items outlined in blue will not be included in the
analyses. Individual objects are displayed in the upper-right window by left-clicking on them with the mouse.
Note: The data of the Color test module are not shown in the lower right data window.
7. Analyze the color checker for Color analysis.
1. Color checker and collecting L*, a*, b* values. Open the scanned color checker image and analyze as described for fruit. Make sure TA
recognizes each patch as an object to analyze (yellow boundary). If you are using a standard color checker, the software may not be
able to recognize the darker swaths. These colors will not be included in the calibration. Under the Settings menu, select "Color Test".
The dialog box will appear. Make sure the correction values are set to 1 for the slope (left boxes) and 0 for the y-intercept (right boxes).
Minimum blue value should be set to 0, and parameters 1 and 2 can be ignored. Click on the Analyze button within the color test dialog
box. A new window will appear to save the output as a "CSV" document which can be opened in EXCEL. Specify the name and the
directory for the data file. The output data file will contain the RGB values; L*, a*, b* values; and calculations for hue and chroma for
each color patch.
2. Determining correction values for calibration. Plot the L*, a*, b* values for each color patch against colorimeter values for L*, a*, and b*
which are available from the manufacturer of the color checker or in Table 1. Determine the regression equation and record the slope
and y-intercept for each parameter. In the dialog box, enter the inverse of the slope and the reverse of the sign of the y-intercept value
for L*, a*, and b*. These values are used as correction values for the "Color Test" settings.
8. Color test allows the user to define two parameters that report the proportion (%) of pixels that fall into specified ranges of hue values chosen.
For analysis of tomato, for example, the lower and upper values for parameter 1 are 70 and 100 respectively, which correspond to
undesirable yellow and green-yellow flesh color. The lower and upper values for parameter 2 are 0 and 50 and correspond to the desired red
color. Save the settings for these values. These values will be applied to all images that are being analyzed until the program is closed. For
scanned images, select the "Illuminant C 2°"option. The "Illuminant D65 10°" option is only applied for images acquired in natural light.
9. Results visualization (see Figure 3): Each row of data in the lower-right data window corresponds to a particular object in the image. The data
is displayed in the same order as the objects in the image. The first row displays the values for the object in the upper left hand corner and
the last data row displays the values for the object in the lower right corner of the image. Click on a row to display the corresponding fruit in
the top window on the right. Alternatively, click on a fruit and the corresponding data row will be highlighted. By clicking on the attribute tab in
the lower-right window it is possible to view how the attribute is being measured for each particular fruit. For example, by clicking on distal
Copyright © 2010 Journal of Visualized Experiments
Page 2 of 9
Journal of Visualized Experiments
www.jove.com
end angle, the angle measured by the software on the fruit in the left window will be shown. This feature is very useful when identifying
objects that require manual adjustment for more accurate measurement.
Figure 4 shows an image to analyze with Color test module. However, the results are not seen in the data window. Data can only be
accessed in an Excel file after the analysis is saved.
5. Manual adjustment of attributes
Sometimes the boundary of the fruit and the proximal and distal ends are not found correctly by TA. Also, if fruit are placed at an angle on the
scanner, the image must be adjusted to obtain correct measurements. These and other features can be corrected through manual adjustment of
the images after initial analysis. The available adjustments appear under the "Revise" menu button and include: Rotate, Boundary, Proximal End,
Distal End, Auto-rotate, Adjust Ellipse, Adjust Distal Protrusion, Adjust Pericarp Boundary, Default Pericarp Boundary.
Note: If adjustments are to be made, first adjust the boundary, followed by the rotation. All other adjustments can be made in any order following
these two adjustments. An adjustment selected under the Revise menu remains selected until a different adjustment is chosen. This allows the
user to perform the same adjustment on a sequence of slices by clicking on the slice image and clicking the Revise button. Below, manual
adjustments on different fruit attributes are detailed.
1. Boundary
1. Left click on the fruit in the left window. It will appear in the upper right window.
2. Click the arrow next to the "Revise" button and select "Boundary" from the drop down list in the upper-right window. Select the
boundary location to be modified by left clicking on the start point and end point of the incorrect boundary. As a result, the delimited
boundary will be removed.
3. To add a new boundary, left click from the start point toward the end point. Continue clicking to follow the desired contour. Right clicking
will undo a previous modification. Multiple modifications can be undone by consecutive right clicks.
4. To confirm the new boundary, press the "Enter" key. Otherwise, press the "Esc" key to cancel this operation.
5. Click on "Reset Boundary" to return to the original boundary setting.
2. Rotate. This feature is used when an object is not completely vertical.
1. Click on the appropriate fruit in the left window. It will appear in the upper-right window.
2. Click the arrow next to the "Revise" button and select "Rotate" from the drop down list.
3. An axis will be displayed in the upper-right window. Drag the green square at the end of the axis and the fruit will rotate accordingly.
4. Double click inside the window or press the "Enter" key to finish.
5. Click on "Reset Rotation" to return to the original alignment.
3. Adjust proximal end. If there is an error in the position of the proximal end, the measurements derived from this feature will be incorrect.
Select a fruit that requires adjustments so that it appears in the window on the right. Next, select the "Proximal fruit end shape" tab and the
"Proximal angle micro or macro" in the data output section below the selected fruit. The proximal angles will now be shown for each fruit in
the image on the left. In this way, angles that seem unusual can be identified. To change the position of the proximal end, follow these steps:
1. Click on the desired fruit in the left window. It will appear in the upper right window.
2. Click the arrow next to the "Revise" button and select "Proximal End" from the drop down list.
3. In the upper-right window, click and drag the vertex indicator to the correct position.
4. Double click or press the "Enter" key to finish.
4. Adjust distal end. The position of the distal end of the object can also be changed manually. To efficiently find fruit that need distal end
adjustments, follow the same procedure as for the proximal end.
1. Click on the desired fruit in the left window. It will appear in the upper-right corner.
Click the arrow next to the "Revise" button and select "Distal End" from the drop down list.
2. In the upper-right window, click and drag the vertex indicator to the correct position.
3. Double click or press the "Enter" key to finish.
5. Distal end protrusion. This function allows the user to define the endpoints on the boundary of the tip.
1. Under the "Distal Fruit End Shape" tab, select the column labeled "Distal End Protrusion" and select the object to adjust.
2. Click the arrow next to the "Revise" button and select "Adjust Distal Protrusion" from the drop down menu.
3. Drag the points that appear to the desired positions along the boundary.
4. Press the Enter key to finish. A line will appear showing the cutoff of the tip area and recalculate the tip area. The results will appear in
the Distal End Protrusion column. If the tip area is not in the desired position, selecting "Reset Distal Protrusion" under the "Revise"
button will reset the points to their initial positions. If a tip area is found but should not exist, selecting "Eliminate Distal Protrusion" from
the "Revise" button will move the points to the bottom of the fruit, resulting in a value of 0.0 for the "Distal End Protrusion" column.
6. Auto-rotate. This function is specifically developed for tomato seed so that they can be automatically aligned with the pointed end facing the
same direction. At this time, auto-rotate function does not work on other objects such as fruit.
7. Adjust ellipse. This function allows the user to resize and/or move the internal ellipse to define internal fruit areas. This attribute is used for the
Internal Eccentricity function and Fruit Shape Index Internal attribute of TA.
1. Select the Internal Eccentricity tab, and then select any of the columns in the tab. Select a "Default ellipse size" from the "Settings"
menu.
2. Select an object, and click on the "Revise" button. Select "Adjust Ellipse" from the drop down menu.
3. Two points will appear representing the top and left points of the ellipse. Moving them both resizes and re-centers the ellipse with
respect to the two new points.
4. Once these points have been set to their desired positions, press the Enter key. The ellipse will be redrawn. If the position is
acceptable, press Enter again and the values in the columns will be updated.
5. If the internal ellipse needs to be moved without being reshaped, click on the center of the objects, where the points were. Two lines
and three green points will appear. Move the point positioned approximately in the center of the fruit to a new location to move the
ellipse without resizing it.
6. Press Enter to finish.
Copyright © 2010 Journal of Visualized Experiments
Page 3 of 9
Journal of Visualized Experiments
www.jove.com
8. Adjust pericarp boundary. This function allows the user to define the pericarp region and needs to be adjusted when Pericarp area" and
"Pericarp thickness" are selected in the "Latitudinal section" tab.
Note: for fruits that are over-ripe, it may be difficult or impossible to distinguish the pericarp from the remainder of the fruit.
1. Select an object, and click on the "Revise" drop down menu. Select "Default pericarp boundary" and set the default that best fits the
pericarp.
2. For further adjustments, select "Adjust pericarp boundary" from the "Revise" drop down menu.
3. In the upper-right window, select the pericarp boundary location that needs to be modified. This is accomplished by left clicking on the
start point and end point of the incorrect boundary. As a result, the delimited boundary will be removed. For the best outcome, the
smallest possible section of boundary should be selected at any one time.
4. To add a new boundary, left click from the second point back to the first point. Continue clicking to follow the desired contour. Right
clicking will undo a previous modification. Multiple modifications can be undone by consecutive right clicks.
Note: Too many pericarp boundary modifications may result in crashing of the program.
5. To confirm new boundary, press the "Enter" key. Otherwise, press the "Esc" key to cancel this operation.
6. Select "Reset Pericarp Boundary" to return the boundary to its original position.
9. For the color analysis, when the boundary of the flesh is not at the edge of the fruit image (e.g., a transverse cut at the fruit shoulder, showing
the skin of the fruit above the transverse cut as shown in Figure 4), the user needs to open the "Color Test" dialog box under the "Settings"
menu. In this dialog box, the minimum blue value needs to be set to 30 and saved. If the fruits are < 3 cm, set the minimum blue value to 20.
This value may need be further adjusted if TA has trouble finding the correct boundaries.
6. User-defined settings
For some attributes, the user needs to select the settings at which the measurement should be taken. This can be done before or after the
analysis and will depend whether an experiment is to be repeated at the same settings as were used previously or whether the user wants to do
exploratory analyses in order to define the appropriate setting for the new analysis.
1. Setting of distal and proximal end blockiness. Blockiness is calculated as the ratio of the width at a user-selected proportion of the height
closest to the distal/proximal end of the fruit to the mid-width (Figure 5A). This allows the user to select or alter the location on the object
where the measurement is taken. The upper and lower blockiness positions can be changed by entering a new value in the "Blockiness
position" under the "Setting" button.
2. Setting of micro and macro angles. These settings are used for calculating angles at various positions from the ends of the fruit (Figure 5B).
The macro setting is typically used for angles from 5 to 40% along the boundary and the micro setting is used for 2 to 10% along the
boundary.
3. Number of morphometric points. This function finds points along the boundary of each object in the loaded image. The distal and proximal
ends are used as landmark points for every object in the image. The number of points measured along the boundary can be selected by "# of
morphometric points" under the "Settings" menu. Between 4 and 30 points can be selected. The software will automatically divide the number
of points selected in half and evenly distribute them on each side of the fruit between the distal and proximal ends.
7. Saving and exporting data
1. Save data
1. After manual adjustments of an image and image analysis by TA, click on the "Save Fruit" button. All current information, including
manual adjustments and deselected objects, will be saved in a new file with the same name as of the original image and a tmt
extension. Every time a file is selected, the saved tmt file with the same name will automatically be opened because it is linked to the
original file. However, the tmt file should be stored in the same folder as the jpg image file (see section 4.1). If the software does not
store the tmt and jpg files in the same folder, move the image folder to the C drive.
2. To revert to the original image file, without any of the adjustments, simply delete the associated tmt file. An alternative is to select
"Analyze" and reanalyze the original image. However, be aware that any tmt with the same name as the image will still be associated
with the image the next time that the file is opened unless, of course, adjustments are saved over the tmt file.
2. Export data
1. The user can export data for an individual image by selecting the button "Export". The data will be exported to an Excel file and display
the attribute values for each fruit, the average and the standard deviation.
2. TA application can also export attribute values from two or more images ("Batch Analysis" function).
1. To start up the batch analysis, click on the "Open Image" button.
2. Select the image files to be batch analyzed. Multiple files are selected using the "Shift" or "Ctrl" key while selecting additional
files. After the files are selected, click on the "Open" key.
3. The user will be asked to select the type of batch analysis output: "Average Only", "Average and Standard Deviation" or
"Individual Measurements per image". An example of two modes of export is shown in Figure 6.
4. Choose a name for the Excel file that will be created and click on the "Save" key. The software will automatically open the files
and begin the batch analysis. If the image files have been previously analyzed and saved by TA, the saved .tmt files will be
opened for the batch analysis. If the files have not been previously analyzed, the software will perform the analysis of images
without manual adjustments and deselections. TA can perform a batch analysis of at least 100 images at 600 dpi.
5. Batch Analysis for Color Analysis. Open the "Color Test" option under setting menu. Check the Batch Analysis and click Analyze.
A new window will appear to select the images to analyze. In the next window specify the name and the directory for the data file.
Click Save. The output file will contain the name of each image (based on the file name) and average color values for each fruit
on the image. The parameters included in the output are: parameter 1, parameter 2, R, G, and B values, luminosity, L*, a*, and
b* values, as well as hue and chroma values. Color test module can do a batch analysis of up to 100 fruit images depending on
the computer s hardware.
8. Examples of data analysis
The output generated by TA can be used for many applications. In genetic studies, the output is used to detect fruit shape QTL (Quantitative Trait
Loci) in several segregating populations derived from crosses between different cultivated tomato varieties (S. lycopersicum) and the wild species
Copyright © 2010 Journal of Visualized Experiments
Page 4 of 9
Journal of Visualized Experiments
LA15891,4,5.
www.jove.com
categories6
S. pimpinellifolium accession
TA can also be used to classify fruit in shape
and analyze tomato fruit color discoloration
due to the physiological disorder "yellow shoulder"3. Moreover, the software has been used to analyze other plant organs such as leaves7 and
seeds8,9.
9. Representative Results
The output of TA has been used for widely varied applications. In fruit shape QTL studies, fruit images (8 to 10 fruit per plant in one image) were
collected from a total of 96 to 130 plants in each population. Subsequently, these images were analyzed by TA4,5. To detect association between
phenotypes and genotypes, QTL analyses were performed using composite interval mapping10,11 and by multitrait composite interval mapping for
subsets of attributes in each population12. As a result, many regions of the tomato genome controlling fruit shape were identified. Some of these
regions were present in several populations, whereas others were unique to one population. While some fruit shape QTLs (such as ovate, sun,
and fs8.1) were known from previous mapping studies, several other loci were newly discovered. In total, 17 to 36 QTLs controlling fruit shape
attributes were detected in three segregating populations2,4.
Data generated by TA has also been analyzed using Principal Components Analysis (PCA). In one study, fifteen shape attributes were subjected
to PCA, and the first three principal components (PC) were subsequently mapped as traits. The data show that PC QTLs overlapped with
attribute QTLs that were contributing to the component4. Segregating populations were also used to compare the QTL identified with
morphometrics to the QTL identified with the shape attributes. Again, the morphometrics QTL were shown to coincide with QTL controlling fruit
shape and size attributes in 93% of the cases2. These results clearly show the validity and reproducibility of data produced by TA in analyzing fruit
morphology.
Another application of TA is the creation of a fruit shape classification system to identify tomato cultivars based on objective fruit shape
measurements. A germplasm collection of ~350 tomato accessions of diverse origin and fruit morphology was evaluated. Approximately eight fruit
from each plant were digitalized and analyzed with TA. Two existing classification systems, IPGRI13 and UPOV14, were evaluated and compared
using visual comparisons to fruit images in our collection. We modified the morphological classification of these two systems by combining
several categories and by creating two new ones6. The proposed categories are flat, round, long, rectangular, obovoid, ellipsoid, heart, and
oxheart. The eight new categories adapted from the IPGRI13 and UPOV14 systems are more visually distinguishable, and were tested using TA
measurements. The TA output of 37 attributes from each accession was subjected to PCA and Linear Discriminant Analysis (LDA) to identify the
measurements that best define each fruit shape category, and also to assess how accurately the discriminator attributes explain the visual
classification of each accession. One possible application of this fruit shape classification system would be to use the output of TA to cluster
accessions based on phenotypic data, and identify associations between different fruit shape categories.
The Color Test module in TA was compared to color measurements taken with a colorimeter (CR300) in an inbred backcross (IBC) population
derived from crosses between S. lycopersicum processing cultivars3. The L*, a*, and b* values from the colorimeter were comparable to color
values obtained from three different scanners with TA. However, differences among the three scanners were observed due to hardware, software,
or nonstandardized RGB values. Consequently, an option to enter correction values was implemented in Color Test to allow scanner calibration.
In a genetic study using Color Test from TA, the genetic variance for color and color uniformity was significantly higher than when those values
were obtained from a colorimeter. These differences are due to TA measuring color parameters of an entire surface whereas the colorimeter
analyzes only a few points on the surface. Lastly, TA was tested and was able to analyze color and color uniformity in other crops such as potato,
cucumber, muskmelon, and strawberry3.
Figure 1. Standard color checker for Color Test module to calibrate the color values obtained from different scanners and at different times.
Copyright © 2010 Journal of Visualized Experiments
Page 5 of 9
Journal of Visualized Experiments
www.jove.com
Figure 2. High quality digitalized images are required for the proper functioning of TA. A) An example of a low quality image. TA will attempt to
find objects throughout the image. When there are large empty spaces such as shown here, TA may not work properly or crash. Some fruits were
not blotted dry, and the juice on the scanner screen will prevent TA from recognizing the correct fruit boundary. Also, when most of the fruits are
incorrectly vertically oriented, many attributes will not be calculated correctly. These poor quality images will significantly slow down the analysis
of fruit shape because of extensive manual adjustments that will have to be made prior to the analysis. B) An example of a high quality image.
The fruit are vertically oriented correctly, spaced close while not touching each other and blotted dry.
Figure 3. Screen shot of the TA software. The top window shows the buttons for several available tools (i.e, open image, save fruit, export data,
fit size, analyze and revise). The object in the upper-right window has been selected for manual adjustments and the data are displayed in the
lower-right window. The values for this fruit are highlighted in gray in the lower right data window. The objects outlined in yellow in the left window
will be included in the analyses whereas objects outlined in blue will not be included in the analyses.
Copyright © 2010 Journal of Visualized Experiments
Page 6 of 9
Journal of Visualized Experiments
www.jove.com
Figure 4. An image used for the Tomato Analyzer - Color Test application.
Figure 5. User-defined settings. A) Blockiness attributes. The upper position is used to calculate proximal end blockiness and triangle attributes.
The setting for Upper position determines where X is measured (=10% in the figure). The lower position is used to calculate distal end blockiness
and triangle attributes. The setting for Lower position determines where Y is measured (= 90% in the figure). The values for these positions equal
the percentage of the height from the top of the fruit. B) Macro angle attributes. The green lines represent percentage (=20 % in the figure) along
the boundary from the end (black square in the figure) where the angle will be measured. The software will determine the slope using +/- 5% of
the selected value. For the micro angles the software will determine the slope using +/- 2% of the selected value.
Copyright © 2010 Journal of Visualized Experiments
Page 7 of 9
Journal of Visualized Experiments
www.jove.com
Figure 6. An example of the output data obtained with Export tool from the image showed in Figure 3. A) Output displaying the attribute values for
each fruit, the average and the standard deviation. B) Output displaying the average attribute values and the standard deviation for 10 tomato
varieties.
L*
a*
b*
1
37.986
13.555
14.059
2
65.711
18.13
17.81
3
49.927
-4.88
-21.925
4
43.139
-13.095
21.905
5
55.112
8.844
-25.399
6
70.719
-33.397
-0.199
7
62.661
36.067
57.096
8
40.02
10.41
-45.964
9
51.124
48.239
16.248
10
30.325
22.976
-21.587
11
72.532
-23.709
57.255
12
71.941
19.363
67.857
13
28.778
14.179
-50.297
14
55.261
-38.342
31.37
15
42.101
53.378
28.19
16
81.733
4.039
79.819
17
51.935
49.986
-14.574
18
51.038
-28.631
-28.638
19
96.539
-0.425
1.186
20
81.257
-0.638
-0.335
Copyright © 2010 Journal of Visualized Experiments
Page 8 of 9
Journal of Visualized Experiments
www.jove.com
21
66.766
-0.734
-0.504
22
50.867
-0.153
-0.27
23
35.656
-0.421
-1.231
24
20.461
-0.079
-0.973
Table 1. L*, a*, b* values for each patch of the color checker (see Figure 1). The source of illuminant was D50 and the observer angle was 2°.
Discussion
High-throughput and accurate evaluation of plant organ morphology and color is difficult because of its quantitative nature and often subjective
quantification. TA provides objective and accurate measurements of several fruit morphological and colorimetric traits in a high-throughput and
semi-automatic manner. The usefulness of TA has been demonstrated in studies that led to the identification of tomato fruit shape QTL2,4,5. In
addition, the classification of cultivars6 and the taxonomy of a group of species has been evaluated using the output of TA15,16. High expression of
the tomato fruit shape gene SUN results in elongated fruit17. Using TA, leaf and cotyledon shape was determined in lines expressing SUN to a
high level7, demonstrating that the application can be used effectively to measure morphology of other plant organs as well. Moreover, TA has
been critically important in identifying the genetic basis of seed size in tomato and sunflower8,9. Lastly, the Color Test module implemented in TA
is more precise and accurate, and less expensive than other methods to analyze fruit color in tomato. In summary, TA has become a key tool for
the objective and reliable evaluation of morphology and color variation of plant organs.
Acknowledgements
This research was supported by the National Science Foundation (DBI 0227541).
References
1. Brewer, M.T. et al., Development of a controlled vocabulary and software application to analyze fruit shape variation in tomato and other plant
species. Plant Physiol 141 (1), 15-25 (2006).
2. Gonzalo, M.J. et al., Tomato Fruit Shape Analysis Using Morphometric and Morphology Attributes Implemented in Tomato Analyzer Software
Program. Journal of the American Society for Horticultural Science 134 (1), 77-87 (2009).
3. Darrigues, A. et al., Tomato analyzer-color test: A new tool for efficient digital phenotyping. Journal of the American Society for Horticultural
Science 133 (4), 579-586 (2008).
4. Brewer, M.T., Moyseenko, J.B., Monforte, A.J., & van der Knaap, E., Morphological variation in tomato: a comprehensive study of quantitative
trait loci controlling fruit shape and development. J Exp Bot 58 (6), 1339-1349 (2007).
5. Gonzalo, M.J. & van der Knaap, E., A comparative analysis into the genetic bases of morphology in tomato varieties exhibiting elongated fruit
shape. Theor Appl Genet 116 (5), 647-656 (2008).
6. Rodríguez, G.R. et al., Diversity of SUN, OVATE and FAS in the tomato germplasm and their effect on fruit morphology (in preparation).
7. Wu, S., Masters Thesis, The Ohio State University, 2009.
8. Orsi, C.H. & Tanksley, S.D., Natural variation in an ABC transporter gene associated with seed size evolution in tomato species. PLoS Genet
5 (1), e1000347 (2009).
9. Yue, B., Cai, X., Yuan, W., Vick, B., Hu, J., Mapping quantitative trait loci (QTL) controlling seed morphology and disk diameter in sunflower
(Helianthus annuus L.). Helia 32 (50), 17-35 (2009).
10. Zeng, Z.B., Theoretical Basis for Separation of Multiple Linked Gene Effects in Mapping Quantitative Trait Loci. Proceedings of the National
Academy of Sciences of the United States of America 90 (23), 10972-10976 (1993).
11. Zeng, Z.B., Precision Mapping of Quantitative Trait Loci. Genetics 136 (4), 1457-1468 (1994).
12. Jiang, C.J. & Zeng, Z.B., Multiple-Trait Analysis of Genetic-Mapping for Quantitative Trait Loci. Genetics 140 (3), 1111-1127 (1995).
13. IPGRI Descriptors for Tomato (Lycopersicon spp.), edited by International Plant Genetic Resources Institute (Roma, Italy, 1996), pp. 47.
14. UPOV Guidelines for the Conduct of Tests for Distinctness, Uniformity, and Stability. TOMATO (Lycopersicon Lycopersicum (L.) Karsten Ex
Farw.), edited by International Union for the Protection of New Varieties of Plants (Geneva, 2001), pp. 51.
15. Depypere, L., Chaerle, P., Mijnsbrugge, K.V., & Goetghebeur, P., Stony endocarp dimension and shape variation in Prunus section Prunus.
Annals of Botany 100 (7), 1585-1597 (2007).
16. Depypere, L., Chaerle, P., Breyne, P., Mijnsbrugge, K.V., & Goetghebeur, P., A combined morphometric and AFLP based diversity study
challenges the taxonomy of the European members of the complex Prunus L. section Prunus. Plant systematics and evolution 279 (1-4),
219-231 (2009).
17. Xiao, H., Jiang, N., Schaffner, E., Stockinger, E.J., & van der Knaap, E., A retrotransposon-mediated gene duplication underlies morphological
variation of tomato fruit. Science 319 (5869), 1527-1530 (2008).
Copyright © 2010 Journal of Visualized Experiments
Page 9 of 9