1
Journal of Visualized Experiments
www.jove.com
2. For Color test, set the resolution of the scanner to 200 dpi if the fruits are < 8 cm. If the fruits are >8 cm, scan at 100 dpi. Also, set the
output image size at highest number of color available in the scanner.
3. Objects should be scanned with a black or very dark background to prevent shadows that will interfere with the analysis. A dark background
can be obtained by placing a cardboard box over the scanner so that all light is restricted from the screen. If a white background is used, TA
will fail to function because the application is optimized for the use of a dark background.
4. The image should be cropped after the initial scan (before saving the image) to avoid large empty spaces. If the image is not cropped at this
stage, it must be cropped using imaging software such as Adobe Photoshop or GIMP prior to analysis with TA.
5. For Color analyses, the scanner will need to be calibrated if the user intends to translate RGB values to the universal L*, a* and b* scale. The
scanning of the color checker (Figure 1) should occur before or during the scanning of the fruits. The scanned color checker should be saved
in the same folder as the fruit images. Scanner calibration is necessary because scanners differ in how they capture color data and the light
source may change over time with repeated use.
1. Obtaining color standards and scanning. Color standards should be chosen based on the broad range of colors observed in the crop of
interest. For this example, we chose a standard 24-color rendition chart (ColorChecker, X-Rite, Grand Rapids, MI, Figure 1). Scan the
color checker as you would scan the fruits. Scanner calibration is explained in section 4.7.
6. Save the scanned image as a JPEG file.
Note: Be careful and precise when placing the objects on the scanner during the image collection step. The better the objects are aligned, the
less manual adjustment will be necessary when analyzing the fruit in TA. Examples of low and high quality images are shown in Figure 2.
3. Software installation
1. Tomato Analyzer (TA) version 2.2.0.0 can be downloaded from http://www.oardc.osu.edu/vanderknaap/tomato_analyzer.htm. The Tomato
Analyzer User Manual and the Tomato Analyzer Color Test Manual are also available from this website.
2. TA requires a Windows operating system (version 2000 or higher).
4. Image analysis and calibration for the TA Color Test
1. The folder with images must be placed on the hard drive and not in the "My Documents" folder or on a remote server. Otherwise, TA will not
save the adjusted images in the same folder as the original images. Ensure that the adjusted images with the extension .tmt are in the same
folder as the original .jpg images (see step 6.1.1).
2. Launch the TA program as you would any other software application by double clicking on the icon.
3. The user must set the dpi and measurement units to the appropriate settings by selecting "Scanner DPI" from the "Settings" menu. The dpi
setting must be the same as the image file so that the size measurements (height, width, perimeter, area) are accurate. The "Units used" in
the dialog box determines the units (cm, mm, in, or pixel) for the data output. In the same dialog box, the brightness may need to be adjusted
when the objects are relatively dark.
Note: The DPI and Units can also be adjusted after making manual adjustments or after image analysis.
4. The user may select the attributes to be measured by selecting "Measurement Saved" from the "Setting" menu. This can be done at any time
during or after the analysis. The attributes are grouped in ten categories (i.e. Basic Measurement, Fruit Shape Index, Blockiness,
Homogenity, Proximal Fruit End Shape, Distal Fruit End Shape, Asymmetry, Internal Eccentricity, Latitudinal Section and Morphometrics).
Individual attributes or an entire measurement group can be selected or deselected by clicking on the group or attribute. All attributes of a
measurement group can be shown by clicking on the "+". The selected attributes are displayed by category in the window in the bottom right
corner of the screen as shown in Figure 3.
5. To get started, click on the "Open image" button and select the image file from the pop-up dialog box. The selected image will be displayed in
the left window.
6. To analyze the opened image, click the "Analyze" button. When finished, the perimeter of each fruit will be highlighted with a yellow line and
the data will be displayed in the lower-right data window. The software will automatically deselect very large or small objects, such as a ruler
or label. The deselected objects will be highlighted with a blue line. Additional fruits can be deselected by right clicking on their image. Only
items outlined in yellow will be displayed in the data window and exported (Figure 3). Items outlined in blue will not be included in the
analyses. Individual objects are displayed in the upper-right window by left-clicking on them with the mouse.
Note: The data of the Color test module are not shown in the lower right data window.
7. Analyze the color checker for Color analysis.
1. Color checker and collecting L*, a*, b* values. Open the scanned color checker image and analyze as described for fruit. Make sure TA
recognizes each patch as an object to analyze (yellow boundary). If you are using a standard color checker, the software may not be
able to recognize the darker swaths. These colors will not be included in the calibration. Under the Settings menu, select "Color Test".
The dialog box will appear. Make sure the correction values are set to 1 for the slope (left boxes) and 0 for the y-intercept (right boxes).
Minimum blue value should be set to 0, and parameters 1 and 2 can be ignored. Click on the Analyze button within the color test dialog
box. A new window will appear to save the output as a "CSV" document which can be opened in EXCEL. Specify the name and the
directory for the data file. The output data file will contain the RGB values; L*, a*, b* values; and calculations for hue and chroma for
each color patch.
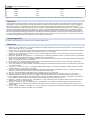
2. Determining correction values for calibration. Plot the L*, a*, b* values for each color patch against colorimeter values for L*, a*, and b*
which are available from the manufacturer of the color checker or in Table 1. Determine the regression equation and record the slope
and y-intercept for each parameter. In the dialog box, enter the inverse of the slope and the reverse of the sign of the y-intercept value
for L*, a*, and b*. These values are used as correction values for the "Color Test" settings.
8. Color test allows the user to define two parameters that report the proportion (%) of pixels that fall into specified ranges of hue values chosen.
For analysis of tomato, for example, the lower and upper values for parameter 1 are 70 and 100 respectively, which correspond to
undesirable yellow and green-yellow flesh color. The lower and upper values for parameter 2 are 0 and 50 and correspond to the desired red
color. Save the settings for these values. These values will be applied to all images that are being analyzed until the program is closed. For
scanned images, select the "Illuminant C 2°"option. The "Illuminant D65 10°" option is only applied for images acquired in natural light.
9. Results visualization (see Figure 3): Each row of data in the lower-right data window corresponds to a particular object in the image. The data
is displayed in the same order as the objects in the image. The first row displays the values for the object in the upper left hand corner and
the last data row displays the values for the object in the lower right corner of the image. Click on a row to display the corresponding fruit in
the top window on the right. Alternatively, click on a fruit and the corresponding data row will be highlighted. By clicking on the attribute tab in
the lower-right window it is possible to view how the attribute is being measured for each particular fruit. For example, by clicking on distal
Copyright © 2010 Journal of Visualized Experiments
Page 2 of 9