1
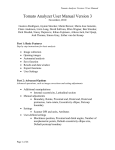
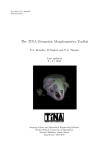
Tomato Analyzer User Manual
Tomato Analyzer User Manual Version 2.2.0.0
February, 2008
Marin Brewer, Gustavo Rodriguez, Maria Jose Gonzalo, Claire Anderson,
Lixin Lang, David Sullivan, Nancy Dujmovic, Kikuo Fujimuro, Simon
Gray, Esther van der Knaap
Part 1: Basic Features
Step by step instructions for basic analysis
•
•
•
•
•
•
•
Image collection
Opening images
Automated analysis
Save function
Results and data window
Export functions
User Settings
Part 2: Advanced Options
Advanced operations, such as image corrections and setting adjustments
• Additional manipulations
• Internal eccentricity, Latitudinal section, Color analysis
• Manual adjustments
• Boundary, Rotate, Proximal end, Distal end, Distal end
protrusion, Auto-rotate, Adjust ellipse, Adjust pericarp
boundary
• Settings
• Scanner DPI, Measurements saved
• User-defined settings
• Blockiness position, Macro/micro level, Number of
morphometric points, Default ellipse size, Default pericarp
boundary
Note: Tomato Analyzer runs on a Windows operating system (2000 or
higher).
Page 1 of 18
Tomato Analyzer User Manual
Part 1: Basic Features
Image collection
Objects should be scanned with a black background. This prevents shadows from
interfering with the analysis. Dark objects, such as leaves, may need to be scanned with a
white background for contrast, but shadows will need to be eliminated. The image also
needs to be cropped during scanning or later with imaging software such as Adobe
Photoshop. The Tomato Analyzer software will attempt to find objects throughout the
image and if most of the image is empty (i.e. no objects) the software will not work
properly.
The software is sensitive to image resolution and object size. Most fruits from 1
cm to 8 cm can be scanned and analyzed at 300 dpi (pixels/inch). If the fruits are large (>
8 cm), the resolution of the original image should be adjusted to approximately 100 dpi or
smaller. The resolution of the original image needs to be set to approximately 750 dpi or
larger in order to analyze very small objects, such as seeds. For accurate analysis, the dpi
setting on Tomato Analyzer needs to be set to the same value as the images. See Part 2,
“Settings: Scanner DPI” of this manual. If analyzing multiple images at once (see Part 1,
“Export functions”), it is best that all images are saved at the same resolution.
Opening images
Start the Tomato Analyzer program and click on the “Open image”
button. Select and open the image file from the pop-up dialog box. The
selected image will be displayed in the left window.
Page 2 of 18
Tomato Analyzer User Manual
Automatic analysis
Prior to the analysis, the user needs to set the dpi and measurement units to the
appropriate settings by selecting “Scanner DPI” from the “Settings” menu. The dpi
setting needs to be the same as the image file so that the size measurements (height,
width, perimeter, area) are accurate. The “Units used” in the dialog box determines the
units (cm, mm, in, or pixel) for the data output. Also, the user must select the attributes
to be measured (see Part 2, “Settings: Measurement saved” in this manual). When
blockiness, triangle, distal and proximal end angle are being measured, the user will have
to choose settings for these attributes (see Part 2, “Settings: Blockiness position” and
“Macro/micro level” in this manual). In addition, settings for “Morphometric Points”
(for the morphometric or geometric analyses), “Default ellipse size” (for the internal
eccentricity) and “Color test” will need to be selected if these attributes are to be
measured. When the settings are not adjusted by the current user, the images will be
analyzed at the settings that were chosen by the previous user.
button. When
To analyze the opened image, click the “Analyze”
finished, the perimeter of each fruit will be highlighted with a yellow line and the data
will be displayed in the lower-right data window. The software will automatically
deselect very large or small objects, such as a ruler or label. Additional fruits can be
deselected by right clicking on them. Only items outlined in yellow will be displayed in
the data window or exported. Items outlined in blue will not be included in any analyses.
Individual fruits are displayed in the upper-right window by left-clicking on them with
the mouse.
Data window
Page 3 of 18
Tomato Analyzer User Manual
Save function
Click on the “Save Fruit”
button. All current information,
including manual adjustments and deselected objects, will be saved as a tmt file. The
name of the file is the same as that of the original image except it has a different
extension (tmt). Every time a file is selected, the saved tmt file with the same name will
automatically be opened because it is linked to the original file. The tmt file should
appear in the same folder as the jpg image file. To revert to the original image file,
without any of the adjustments, simply delete the associated tmt file. An alternative is to
select “Analyze” to reanalyze the original image. However, beware that any tmt with the
same name as the image will still be associated with the image the next time that the file
is opened unless, of course, adjustments are saved over the tmt.
Results and data window
Shape attributes are divided into ten groups: Basic Measurements, Fruit Shape
Index, Blockiness, Homogeneity, Distal Fruit End Shape, Proximal Fruit End Shape,
Asymmetry, Internal Eccentricity, Latitudinal Section, and Morphometrics. By default,
the “Basic Measurement” group is displayed. To view another group, click on the tab of
the corresponding group. For detailed explanations of shape attributes, see the
measurement reference document, “Tomato Shape Analysis”.
Each row of data in the window corresponds to a particular fruit. The data is
displayed in the same order as the objects in the image. The first row displays the values
of the object in the upper left hand corner and the last data row displays the values of the
object in the lower right corner of the image. Click on a row to display the corresponding
fruit in the top window on the right. Alternatively, click on a fruit and the corresponding
data row will be highlighted.
By clicking on the attribute tab in the lower-right window it is possible to view
how that attribute is being measured for each particular fruit. For example, by clicking
on distal end angle, the angle measured by the software for all of the fruits in the left
window will be shown. This feature is very useful when identifying objects that require
manual adjustments (see Part 2, “Manual adjustments”).
Page 4 of 18
Tomato Analyzer User Manual
Export functions
The user can export data for an individual image by selecting the
button. The data will be exported to an Excel file and display the values for each fruit,
the average and the standard deviation.
The “Batch Analysis” function is used to export the values of the attribute from
two or more images. Click on the “Open Image” button. Select the image files to be
batch analyzed. Multiple files are selected using the “Shift” or “Ctrl” key while selecting
additional files. After the files are selected, click on the “Open” key. The user will be
asked to select the type of batch analysis output: Average Only, Average and Standard
Deviation and Individual Measurements per image.
Choose a name for the Excel file that will be created and click on the “Save” key.
The software will automatically open the files and begin the batch analysis.
If the image files have been previously analyzed and saved by Tomato Analyzer,
the saved files (tmt) will be opened for the batch analysis. If the files have not been
previously analyzed, the software will perform the analysis with the original images. If
the files were analyzed with an older version of Tomato Analyzer, the user will be
prompted to save the images as tmt for each image in the batch. The application will then
recalculate the existing as well as analyze new attributes. The software may crash if too
many images have been chosen for batch analysis. If this happens, select fewer files in
subsequent analyses.
User Settings
This feature allows the user to apply exactly the same measurements at the
selected settings for blockiness, triangle, distal and proximal end angle, number of
morphometric points, default ellipse and/or color to a population analyzed at another time
by the same or another user. To save the settings for later use select “User settings: save
settings” from the “Settings” menu. A file dialog will pop up, prompting the user for a
name for the user settings file (*.ctmt). The user can save the file anywhere on their
computer. The saved settings can be loaded by choosing “User settings: Load settings”
from the “Settings” menu and locating the settings file.
Page 5 of 18
Tomato Analyzer User Manual
Part 2: Advanced Options
Additional manipulations
Whereas most features of Tomato Analyzer are measured using the external
boundary of the objects, shape attributes of internal features can be measured as well.
Tomato Analyzer allows the user to draw an ellipse on the object around the feature of
interest. Several measurements can be taken using the dimensions of the ellipse and the
outer boundary.
Internal Eccentricity
This feature was developed to measure the degree of fruit eccentricity of
longitudinally cut fruit. The user can set the “Default ellipse size” in the “Settings” menu
to approximate the features to be measured (see image below). After the default size, the
user can adjust each ellipse manually using the “Adjust ellipse” function in the “Revise”
button (see: “Adjust ellipse” in the “Manual adjustments” section, and “Default ellipse
size” in the “User defined settings” of this manual). Tomato Analyzer will measure
various eccentricity features from the ellipse and the boundary of the object.
Page 6 of 18
Tomato Analyzer User Manual
Latitudinal section
The “Latitudinal section” tab houses features that are measured in cross sections
of the tomato fruit. The attributes are called: “Pericarp area”, “Pericarp thickness” and
“Lobedness Degree”. The pericarp attributes measure thickness of the walls of the tomato
fruit. To set the pericarp boundary, select a fruit to appear in the upper right corner and
use the “Default pericarp boundary” feature in the “Revise” button. The pericarp
thickness varies per fruit therefore the user can select a default specific for each object in
the image. The default setting will result in a boundary that is a fraction of the outer
boundary. The pericarp boundary can be further adjusted via the “Adjust pericarp
boundary” feature (see also: “Manual adjustments” in this manual). The “Pericarp area”
and “thickness” features can also be used to measure placenta and columella area. Be
aware that when saving the tmt with another measurement, e.g. from pericarp area to
placental area, the boundary for the placental area will be saved over the pericarp area.
“Lobedness degree” does not require manual manipulations and is measured
automatically.
Color analysis
This feature was developed to assess fruit color and color uniformity of cut
tomato. To analyze color uniformity, the percentage of red and white area can be
calculated using the color test feature in the “Settings” menu. Tomato Analyzer will
check each pixel of the tomato slice to see if it is “red” or “white”. The color of the pixels
is measured using both the RGB and HSL color scales. In order for a pixel to be red, the
pixel should have a low hue value. The user needs to define this range, which is [0, hue],
where hue is the highest hue value that is considered to be red. Likewise, the user needs
define what makes a pixel white by finding its luminosity value. A pixel that is “white”
has a high luminosity value and the user needs to provide the range [lum, 240], where
lum is the lowest luminosity value that is still “white”. The border or skin of the fruit (see
image below) should not be included in the calculation of red-white percentages.
Therefore, the minimum blue value needs to be set so that only the cut surface will be
analyzed for the red-white percentages. By default, minimum blue value is 0.
Color analysis output produces a CSV file with the average RGB, Hue and
Luminosity values of each tomato slice, along with the percentages of the “white” and
“red” area. Batch analysis can be used for color analysis also. If “batch” is checked in the
“Settings, color test” box, Tomato Analyzer will prompt the user for selecting images for
batch analysis. If batch is not checked, TA will analyze the current image and save it in a
CSV file.
For more details see also Color Test User Manual at http://www.oardc.ohiostate.edu/vanderknaap/TArelease.htm.
Page 7 of 18
Tomato Analyzer User Manual
Manual adjustments
Occasionally the outline of the fruit and the proximal and distal ends are not
found correctly by Tomato Analyzer. This would lead to incorrect results of many
measurements. Usually this can be corrected through manual adjustment of the image
and objects. The available adjustments appear under the “Revise” menu button and
include: Rotate, Boundary, Proximal End, Distal End, Auto-rotate, Adjust Ellipse,
Adjust Distal Protrusion, Adjust Pericarp Boundary, Default Pericarp Boundary.
Note 1: The software functions best if the boundary is adjusted prior to any other
manual adjustments. The rotation should be adjusted, if necessary, prior to
adjustment of the distal and proximal ends and subsequent manual adjustments
Note 2: An adjustment selected under the Revise menu remains selected until a
different adjustment is chosen. This allows the user to perform the same adjustment
on a sequence of slices by clicking on the slice image and clicking the Revise button.
Page 8 of 18
Tomato Analyzer User Manual
1. Boundary
To adjust the boundary:
a) Click on the fruit in the left window. It will appear in the upper right
window.
b) Click the arrow next to the “Revise” button and select “Boundary” from
the drop down list
c) In the upper-right window, select the boundary location that needs to be
modified. This is accomplished by left clicking on the start point and end
point of the incorrect boundary. As a result, the delimited boundary will be
removed (see figure below).
d) To add a new boundary, left click from the start point toward the end
point. Continue clicking to follow the desired contour. Right clicking will
undo a previous modification. Multiple modifications can be undone by
consecutive right clicks (see figure below).
e) To confirm new boundary, press the “Enter” key. Otherwise, press the
“Esc” key to cancel this operation.
f) Click on “Reset Boundary” to return to the original boundary setting.
Page 9 of 18
Original boundary
Select the segment of the boundary
that needs to be modified.
Draw new boundary
Adjusted boundary
Tomato Analyzer User Manual
2. Rotate
This feature is used when an object is not completely vertical.
a) Click on the appropriate fruit in the left window. It will appear in the
upper-right window
b) Click the arrow next to the “Revise” button and select “Rotate” from the
drop down list.
c) An axis will be displayed in the upper-right window. Drag the green
square at the end of the axis and the fruit will rotate accordingly.
d) Double click inside of the window or press the “Enter” key to finish.
e) Click on “Reset Rotation” to return to the original alignment.
Original image
After rotation
3. Proximal end
If there is an error with the position of proximal end, the measurements derived
from this feature will be incorrect. To efficiently find the fruit in an image that
requires adjustments, select one fruit so that it appears in the window on the right.
Select the “Proximal fruit end shape” tab and the “Proximal angle micro or
micro” in data output section below the selected fruit. The proximal angles will
now be shown for each fruit in the image on the left and angles that seem unusual
can be found. To change the position of the proximal end:
a) Click on the desired fruit in the left window. It will appear in the upper
right window.
b) Click the arrow next to the “Revise” button and select “Proximal End”
from the drop down list.
Page 10 of 18
Tomato Analyzer User Manual
c) In the upper-right window, click and drag the vertex indicator to the
correct position.
d) Double click or press the “Enter” key to finish.
Original image
After adjust Proximal End
4. Distal end
The position of the distal end of the object can also be changed manually. To
efficiently find fruit that need distal end adjustments, follow similar directions
that were described for the proximal end. To change the position of the distal
end:
a) Click on the desired fruit in the left window. It will appear in the upperright corner.
b) Click the arrow next to the “Revise” button and select “Distal End” from
the drop down list.
c) In the upper-right window, click and drag the vertex indicator to the
correct position.
d) Double click or press the “Enter” key to finish.
Original image
Page 11 of 18
After adjust Distal End
Tomato Analyzer User Manual
5. Distal end protrusion
This function allows the user to define the endpoints on the boundary of the tip.
a) Under the “Distal Fruit End Shape” tab, select the column labeled “Distal
End Protrusion” and select a slice to adjust.
b) Click the arrow next to the “Revise” button and select “Adjust Distal
Protrusion” from the drop down menu.
c) Drag the points that appear to the desired positions along the boundary.
d) Press the Enter key to finish. A line will appear showing the cutoff of the
tip area and recalculates the tip area. The results will appear in the Distal
End Protrusion column.
e) If the tip area is not in the desired position, selecting “Reset Distal
Protrusion” under the “Revise” button will reset the points to their initial
positions.
f) If a tip area is found but should not exist, selecting “Eliminate Distal
Protrusion” from the “Revise” button will move the points to the bottom
of the fruit, resulting in a value of 0.0 for the “Distal End Protrusion”
column.
Original image
Click “Revise” - “Adjust
Distal Protrusion”
Adjust right endpoint
Press the “Enter” key to finish
Page 12 of 18
Adjust left endpoint
Tomato Analyzer User Manual
6. Auto-rotate
This function is specifically developed for tomato seed such that they can be
aligned with the pointed end facing the same direction automatically. At this
time, auto-rotate function does not work on other objects such as fruit.
7. Adjust ellipse
This function allows the user to resize and/or move the internal ellipse to define
internal fruit areas. This attribute is used for the Internal Eccentricity function and
Fruit Shape Index Internal attribute of Tomato Analyzer.
a) Select the Internal Eccentricity tab, and then select any of the columns in
the tab. Select a “Default ellipse size” from the “Settings” menu.
b) Select a slice, and click on the “Revise” button. Select “Adjust Ellipse”
from the drop down menu.
c) Two points will appear representing the top and left points of the ellipse.
Moving them both resizes and re-centers the ellipse with respect to the two
new points.
d) Once these points have been set to their desired positions, press the Enter
key.
e) The ellipse will be redrawn. If the position is acceptable, press Enter again
and the values in the columns will be updated.
f) If the internal ellipse needs to be moved without being reshaped, click on
the center of the slice, where the points were. Two lines appear and three
green points. Move the point positioned approximately in the center of the
fruit to a new location to move the ellipse without resizing it.
g) Press Enter to finish.
8. Adjust pericarp boundary
This function allows the user to define the pericarp region and needs to be
adjusted when ‘Pericarp area” and “Pericarp thickness” are selected in the
“Latitudinal section” tab. Note: for fruits that are over-ripe, it may be difficult or
impossible to distinguish the pericarp from the remainder of the fruit.
a) Select a slice, and click on the “Revise” drop down menu. Select “Default
Pericarp Boundary” and set the default that best fits the pericarp.
b) For further adjustments, select “Adjust Pericarp Boundary” from the
“Revise” drop down menu.
c) In the upper-right window, select the pericarp boundary location that
needs to be modified. This is accomplished by left clicking on the start
point and end point of the incorrect boundary. As a result, the delimited
boundary will be removed (see figure below). For the best outcome, the
smallest possible section of boundary should be selected at any one time.
d) To add a new boundary, left click from the second point back to the first
point. Continue clicking to follow the desired contour. Right clicking will
Page 13 of 18
Tomato Analyzer User Manual
undo a previous modification. Multiple modifications can be undone by
consecutive right clicks (see figure below). NOTE: multiple pericarp
boundary modifications may result in crashing of the program.
e) To confirm new boundary, press the “Enter” key. Otherwise, press the
“Esc” key to cancel this operation.
f) Select “Reset Pericarp Boundary” to return the boundary to its original
position.
Original boundary
Select the segment of the boundary that
needs to be modified.
Add new boundary
Adjusted boundary
Page 14 of 18
Tomato Analyzer User Manual
Settings
Settings can be changed by selecting “Settings” from the menu.
Scanner DPI
The dpi value of the scanned image and the unit of the measurement can be
adjusted by entering a new dpi value or selecting a new unit. Units include pixels,
centimeters, millimeters, and inches and refer to output data values that are size
measurements, such as area, perimeter, length and width. The default settings are 300 dpi
and pixels. The brightness can be adjusted if the objects of the image are too similar in
color to the background. This will make it easier for the software to accurately determine
the boundary.
Measurements saved
The traits that are measured and displayed in the data window, saved in the data
export file (csv), or saved in the batch analysis can be selected. Individual attributes or
an entire measurement group can be selected or deselected by clicking on the group or
attribute. All attributes of a measurement group can be shown by clicking on the “+”.
All columns are displayed by default the first time a user runs the program.
Page 15 of 18
Tomato Analyzer User Manual
User-defined settings
User-defined settings can be changed by selecting “Settings” from the menu.
Blockiness position
The upper and lower blockiness positions can be changed by entering a new
value. The default settings are 0.1 and 0.9 for the upper and lower positions,
respectively.
The upper position is used for calculating proximal end blockiness and triangle.
The setting for “Upper position” determines where X (see figure below) is measured.
The lower position is used to calculate distal end blockiness and triangle. The setting for
“Lower position” determines where Y (see figure below) is measured. In the figure
below, upper position = 10% and lower position = 90%. The values for these positions
equal the percentage of the height from the top of the fruit.
10%H
X
W mid
90% *H
Page 16 of 18
Y
H
Tomato Analyzer User Manual
Macro/micro level
These settings are used for calculating angles at various positions from the ends of
the fruit. The setting for macro level determines the percentage of the perimeter from the
end where the angle will be measured, typically ranging from 5-40 %. The software will
determine the slope using +/- 5% of the selected value. The micro level setting uses a
smaller range, typically 2-10% from the end of the fruit. The software will determine the
slope using +/- 1% of the selected value.
Number of morphometrics points
To measure shape without selecting individual attributes, TA offers a
morphometric or geometric analysis of each object. This function finds points along the
boundary of each tomato slice in the loaded image. For this feature to work properly, the
user needs to adjust boundary, and proximal and distal ends in the “Revise” menu, if
necessary (see “Manual adjustments: Boundary, Proximal and Distal end” in this
manual). The distal and proximal ends are used as landmark points for every tomato
slice. The number of points measured along the boundary can be selected by “# of
morphometrics points” under the “Settings” menu. The number of points that can be
measured ranges from 4 to 30. In addition, regardless of how many points were selected
under the “# of morphometric points”, make sure that all points are selected under
“Measurements saved” in the “Settings” menu.
The software will automatically divide the number of points selected in half and
evenly distribute them on each side of the fruit between the distal and proximal ends. The
points are listed with both the x and y coordinates along the boundary with point 1 being
the proximal end and moving counter-clockwise around the slice. To determine which
point along the fruit corresponds with each number, the user can click on the column in
the output file in the bottom right corner and the corresponding point will be highlighted
in blue on the slice.
Page 17 of 18
Tomato Analyzer User Manual
When the images are batch analyzed, the coordinates for each point are averaged
for the objects in each image using the “Averages only” selection, and saved to the .csv
file. Statistical tools such as Principal Component Analyses can be used to analyze the
output.
Default ellipse size
To allow the user to set the default size of the “Internal eccentricity” ellipse
“Default Ellipse Size” can be selected from the “Settings” menu. The software will
resize the ellipse based on the value chosen in the dialog box, which represents a
percentage of the tomato size. The ellipse of all objects in the image will be resized to
the selected default.
Default pericarp boundary
This feature is NOT listed under the “Settings” menu, but instead under the
“Revise” menu. This allows the user to select a default setting for the pericarp boundary
based on each object individually.
Page 18 of 18