1
Journal of Visualized Experiments
www.jove.com
8. Adjust pericarp boundary. This function allows the user to define the pericarp region and needs to be adjusted when Pericarp area" and
"Pericarp thickness" are selected in the "Latitudinal section" tab.
Note: for fruits that are over-ripe, it may be difficult or impossible to distinguish the pericarp from the remainder of the fruit.
1. Select an object, and click on the "Revise" drop down menu. Select "Default pericarp boundary" and set the default that best fits the
pericarp.
2. For further adjustments, select "Adjust pericarp boundary" from the "Revise" drop down menu.
3. In the upper-right window, select the pericarp boundary location that needs to be modified. This is accomplished by left clicking on the
start point and end point of the incorrect boundary. As a result, the delimited boundary will be removed. For the best outcome, the
smallest possible section of boundary should be selected at any one time.
4. To add a new boundary, left click from the second point back to the first point. Continue clicking to follow the desired contour. Right
clicking will undo a previous modification. Multiple modifications can be undone by consecutive right clicks.
Note: Too many pericarp boundary modifications may result in crashing of the program.
5. To confirm new boundary, press the "Enter" key. Otherwise, press the "Esc" key to cancel this operation.
6. Select "Reset Pericarp Boundary" to return the boundary to its original position.
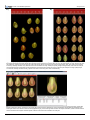
9. For the color analysis, when the boundary of the flesh is not at the edge of the fruit image (e.g., a transverse cut at the fruit shoulder, showing
the skin of the fruit above the transverse cut as shown in Figure 4), the user needs to open the "Color Test" dialog box under the "Settings"
menu. In this dialog box, the minimum blue value needs to be set to 30 and saved. If the fruits are < 3 cm, set the minimum blue value to 20.
This value may need be further adjusted if TA has trouble finding the correct boundaries.
6. User-defined settings
For some attributes, the user needs to select the settings at which the measurement should be taken. This can be done before or after the
analysis and will depend whether an experiment is to be repeated at the same settings as were used previously or whether the user wants to do
exploratory analyses in order to define the appropriate setting for the new analysis.
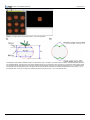
1. Setting of distal and proximal end blockiness. Blockiness is calculated as the ratio of the width at a user-selected proportion of the height
closest to the distal/proximal end of the fruit to the mid-width (Figure 5A). This allows the user to select or alter the location on the object
where the measurement is taken. The upper and lower blockiness positions can be changed by entering a new value in the "Blockiness
position" under the "Setting" button.
2. Setting of micro and macro angles. These settings are used for calculating angles at various positions from the ends of the fruit (Figure 5B).
The macro setting is typically used for angles from 5 to 40% along the boundary and the micro setting is used for 2 to 10% along the
boundary.
3. Number of morphometric points. This function finds points along the boundary of each object in the loaded image. The distal and proximal
ends are used as landmark points for every object in the image. The number of points measured along the boundary can be selected by "# of
morphometric points" under the "Settings" menu. Between 4 and 30 points can be selected. The software will automatically divide the number
of points selected in half and evenly distribute them on each side of the fruit between the distal and proximal ends.
7. Saving and exporting data
1. Save data
1. After manual adjustments of an image and image analysis by TA, click on the "Save Fruit" button. All current information, including
manual adjustments and deselected objects, will be saved in a new file with the same name as of the original image and a tmt
extension. Every time a file is selected, the saved tmt file with the same name will automatically be opened because it is linked to the
original file. However, the tmt file should be stored in the same folder as the jpg image file (see section 4.1). If the software does not
store the tmt and jpg files in the same folder, move the image folder to the C drive.
2. To revert to the original image file, without any of the adjustments, simply delete the associated tmt file. An alternative is to select
"Analyze" and reanalyze the original image. However, be aware that any tmt with the same name as the image will still be associated
with the image the next time that the file is opened unless, of course, adjustments are saved over the tmt file.
2. Export data
1. The user can export data for an individual image by selecting the button "Export". The data will be exported to an Excel file and display
the attribute values for each fruit, the average and the standard deviation.
2. TA application can also export attribute values from two or more images ("Batch Analysis" function).
1. To start up the batch analysis, click on the "Open Image" button.
2. Select the image files to be batch analyzed. Multiple files are selected using the "Shift" or "Ctrl" key while selecting additional
files. After the files are selected, click on the "Open" key.
3. The user will be asked to select the type of batch analysis output: "Average Only", "Average and Standard Deviation" or
"Individual Measurements per image". An example of two modes of export is shown in Figure 6.
4. Choose a name for the Excel file that will be created and click on the "Save" key. The software will automatically open the files
and begin the batch analysis. If the image files have been previously analyzed and saved by TA, the saved .tmt files will be
opened for the batch analysis. If the files have not been previously analyzed, the software will perform the analysis of images
without manual adjustments and deselections. TA can perform a batch analysis of at least 100 images at 600 dpi.
5. Batch Analysis for Color Analysis. Open the "Color Test" option under setting menu. Check the Batch Analysis and click Analyze.
A new window will appear to select the images to analyze. In the next window specify the name and the directory for the data file.
Click Save. The output file will contain the name of each image (based on the file name) and average color values for each fruit
on the image. The parameters included in the output are: parameter 1, parameter 2, R, G, and B values, luminosity, L*, a*, and
b* values, as well as hue and chroma values. Color test module can do a batch analysis of up to 100 fruit images depending on
the computer s hardware.
8. Examples of data analysis
The output generated by TA can be used for many applications. In genetic studies, the output is used to detect fruit shape QTL (Quantitative Trait
Loci) in several segregating populations derived from crosses between different cultivated tomato varieties (S. lycopersicum) and the wild species
Copyright © 2010 Journal of Visualized Experiments
Page 4 of 9