1
Time Inter val Analyzer
IM 704310-01E
2nd Edition
Foreword
Thank you for purchasing the YOKOGAWA TA520 Time Interval Analyzer.
This User’s Manual contains useful information about the precautions, functions, and
operating procedures of the instrument. To ensure correct use, please read this manual
thoroughly before operation.
Keep this manual in a safe place for quick reference in the event a question arises.
The following manual is also provided in addition to this manual.
Manual Name
Manual No.
Description
TA520 GP-IB Interface
User’s Manual
IM704310-12E
Describes the communication
functions of the GP-IB interface.
Notes
The contents of this manual are subject to change without prior notice as a result of
continuing improvements to the instrument’s performance and functions. The figures
given in this manual may differ from the actual screen.
Every effort has been made in the preparation of this manual to ensure the accuracy of
its contents. However, should you have any questions or find any errors, please contact
your nearest YOKOGAWA dealer as listed on the back cover of this manual.
Copying or reproducing all or any part of the contents of this manual without
YOKOGAWA’s permission is strictly prohibited.
Trademarks
MS-DOS is a registered trademark of Microsoft Corporation.
Other product names are trademarks or registered trademarks of their respective
holders.
Revisions
1st Edition: April 1999
2nd Edition: November 1999
Disk No. HF09
2nd Edition: November 1999 (YK)
All Rights Reserved, Copyright © 1999 Yokogawa Electric Corporation
IM 704310-01E
i
Checking the Contents of the Package
Unpack the box and check the contents before operating the instrument. If some of the
contents are not correct or missing or if there is physical damage, contact the dealer
from which you purchased them.
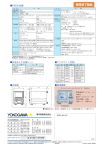
Main Unit
Check that the model name and suffix code given on the name plate match those on the
order.
WARNING
CAUTION
MODEL
SUFFIX
MODEL
SUFFIX
NO.
Made in Japan
NO.
Made in Japan
MODEL (Type Name)
704310
SUFFIX (Suffix code)
Power voltage
Suffix Code
Description
-1
-5
100-120 VAC
200-240 VAC
Power cord
-D
UL/CSA Standards Power Cord (Part No.: A1006WD)
[Maximum Rated Voltage: 125 V, Maximum Rated Current:
7 A]
VDE Standard Power Cord (Part No.: A1009WD)
[Maximum Rated Voltage: 250 V, Maximum Rated Current:
10 A]
BS Standard Power Cord (Part No.: A1054WD)
[Maximum Rated Voltage: 250 V, Maximum Rated Current:
10 A]
SAA Standard Power Cord (Part No.: A1024WD)
[Maximum Rated Voltage: 240 V, Maximum Rated Current:
10 A]
-F
-Q
-R
Optional specifications
/C8
/F1
Internal hard disk + SCSI
Inter-symbolic interference analysis function
NO. (Instrument No.)
When contacting the dealer from which you purchased the instrument, please quote the
instrument No.
Note
We recommend you keep the packing box. The box is useful when you need to transport the
instrument.
ii
IM 704310-01E
Checking the Contents of the Package
Standard Accessories
The following standard accessories are supplied with the instrument.
Part Number
Quantity
Notes
1. Power cord
2. Rubber feet
3. Printer roll chart
Part Name
See page 2
A9088ZM
B9850NX
1
1
1
4. User’s Manual
5. User’s Manual
6. Spare fuse for the power
supply
IM 704310-01E
IM 704310-12E
A1436EF
1
1
1
See page 2
A set of two pieces
Thermalsensible paper
Total length: 30 m
User Manual (this manual)
GP-IB Interface User’s Manual
Spare, attach to fuse holder of the
main unit
1. Power cord (one of the following power cords
is supplied according to the instrument's suffix codes)
UL/CSA standard VDE standard
A1006WD
A1009WD
D
2
BS standard
A1054WD
F
3
Q
SAA standard
A1024WD
R
4, 5
Optional Accessories (sold separately)
The following optional accessories are sold separately.
For information and ordering, contact your dealer.
IM 704310-01E
Part Name
Part No.
Sales Unit
Notes
BNC cable
BNC cable
Rack mount kit
Rack mount kit
Rack mount kit
Rack mount kit
366924
366925
751533-E6
751534-E6
751533-J6
751534-J6
1
1
1
1
1
1
BNC-BNC, Length: 1 m
BNC-BNC, Length: 2 m
For EIA single mount
For EIA dual mount
For JIS single mount
For JIS dual mount
iii
Safety Precautions
This instrument is an IEC safety class I instrument (provided with terminal for protective
grounding).
The following general safety precautions must be observed during all phases of
operation. If the instrument is used in a manner not specified in this manual, the
protection provided by the instrument may be impaired. YOKOGAWA Electric
Corporation assumes no liability for the customer’s failure to comply with these
requirements.
The following symbols are used on this instrument.
“Handle with care.” To avoid injury, death of personnel or damage to the
instrument, the operator must refer to the explanation in the User’s Manual or
Service Manual.
Alternating current
ON (power)
OFF (power)
ON (power) state
OFF (power) state
iv
IM 704310-01E
Safety Precautions
Make sure to comply with the following safety precautions. Not complying might
result in injury, death of personnel, or cause damage to the instrument.
WARNING
Power Supply
Ensure that the source voltage matches the voltage of the power supply before
turning ON the power.
Power Cord and Plug
To prevent an electric shock or fire, be sure to use the power cord supplied by
YOKOGAWA. The main power plug must be plugged into an outlet with a
protective grounding terminal. Do not invalidate protection by using an extension
cord without protective grounding.
Protective Grounding
Make sure to connect the protective grounding to prevent electric shock before
turning ON the power.
Necessity of Protective Grounding
Never cut off the internal or external protective grounding wire or disconnect the
wiring of the protective grounding terminal. Doing so poses a potential shock
hazard.
Defect of Protective Grounding and Fuse
Do not operate the instrument when the protective grounding or the fuse might be
defective. Also, make sure to check them before operation.
Fuse
To avoid fire, only use a fuse that has a rating (voltage, current, and type) that is
specified by the instrument. When replacing a fuse, turn OFF the power switch
and unplug the power cord. Never short the fuse holder.
Do Not Operate in Explosive Atmosphere
Do not operate the instrument in the presence of flammable liquids or vapors.
Operation of any electrical instrument in such an environment constitutes a safety
hazard.
Do Not Remove Covers
Some areas inside the instrument have high voltages. Do not remove the cover if
the power supply is connected. The cover should be removed by YOKOGAWA’s
qualified personnel only.
External Connection
Connect the protective grounding before connecting to the item under
measurement or control unit.
IM 704310-01E
v
Structure of the Manual
This User’s Manual consists of the following 15 chapters and an index.
Chapter 1
Functions
Describes the measurement principles and functions of the instrument. Operating
procedures are not given in this chapter. However, reading this chapter will help you
understand the operating procedures given in the chapters that follow.
Chapter 2
Names and Uses of Parts
Describes the names and uses of each part of the instrument. For keys, references are
given to sections (or pages) in the manual where operating procedures are explained.
Chapter 3
Before Starting Measurements
Describes precautions on use, how to install the instrument, how to connect the power
supply, turn ON/OFF the power switch, connect a probe, and set the date and time.
Chapter 4
Basic Operations
Describes how to start/stop the measurement acquisition of input signals, enter values
using the numerical keys, and operate the rotary knob.
Chapter 5
Setting the Sampling Mode and Measurement Functions
Describes how to set the sampling mode and measurement function (item).
Chapter 6
Setting the Acquisition Conditions of the Measurement Input Signal
Describes how to set the acquisition conditions of the measurement input signal such as
input coupling, input impedance, trigger mode, trigger level, gate, sampling size,
sampling interval, arming source, slope, delay, and inhibit.B
Chapter 7
Displaying the Measured/Calculated Results in the Time Stamp Mode
Describes how to configure the displays such as histograms, time variations, lists,
statistics, and panorama.
Chapter 8
Displaying the Measured/Calculated Results in the Hardware
Histogram Mode
Describes how to configure the displays such as histograms, lists, statistics, multiwindows, panoramas, and histogram sum.
Chapter 9
Using the Inter-symbolic Interference Analysis Function (Option)
Describes how to use the inter-symbolic interference analysis function.
Chapter 10 Storing/Recalling Setup Information from the Internal Memory
Describes how to store and recall setup information from the internal memory and how to
change the setup.
Chapter 11 Saving and Loading Data and Connecting to a PC
Describes how to save and load data such as setup information and measured/
calculated results from the floppy disk, internal hard disk (option), and external SCSI
devices and how to format disks and delete data.
Chapter 12 Outputting Screen Images
Describes how to output screen images to the internal printer, the floppy disk, the internal
hard disk (option), and to an external SCSI device.
Chapter 13 Using Other Functions
Describes how to initialize the settings, calibrate the instrument, output monitor signals,
confirm current conditions, adjust the brightness of the LCD, and other such operations.
Chapter 14 Troubleshooting and Maintenance
Describes the possible causes of problems and their appropriate corrective measures.
Describes the messages that are displayed on the screen. Describes how to log errors,
perform self-tests, adjust the time base, carry out performance tests, and replace fuses.
Chapter 15 Specifications
Describes the specifications of the instrument.
Index
Gives an index.
vi
IM 704310-01E
Conventions Used in this Manual
Unit
k
K
Denotes 1000. Example: 100kHz
Denotes 1024. Example: 720KB (Storage capacity of floppy disks)
Symbols
The following symbols are used in this manual.
Affixed to the instrument. Indicates danger to personnel or
instrument and the operator must refer to the User’s Manual. The
symbol is used in the User’s Manual to indicate the reference.
WARNING
Describes precautions that should be observed to prevent injury or
death to the user.
CAUTION
Note
Describes precautions that should be observed to prevent minor or
moderate injury, or damage to the instrument.
Provides important information for the proper operation of the
instrument.
Symbols used on pages in which operating procedures are given.
In chapters 3 through 13, on pages where operating procedures are given, the following
symbols are used to classify a description.
IM 704310-01E
Procedure
Describes the keys used during operation and the operating
procedures. In some cases, you may not have to follow the steps
in the order they are given.
Explanation
Describes the details of the settings and the restrictions that exist
with the operating procedure. A detailed description of the function
is not provided in this section. See chapter 1 for a detailed
description of the functions.
vii
Contents
Checking the Contents of the Package ........................................................................................... ii
Safety Precautions ...................................................................................................................................... iv
Structure of the Manual ............................................................................................................................ vi
Conventions Used in this Manual ..................................................................................................... vii
Chapter 1
Functions
1.1
1.2
System Configuration and Block Diagram ................................................................................ 1-1
Measurement Principle ............................................................................................................. 1-3
1.3
1.4
Sampling Mode ......................................................................................................................... 1-4
Measurement Functions (Measurement Items) ........................................................................ 1-5
Period, Time Interval, Pulse Width ............................................................................................................... 1-5
1.5
Acquisition Conditions for the Input Signal Being Measured .................................................... 1-6
Measurement Block ..................................................................................................................................... 1-6
Block Sampling ............................................................................................................................................ 1-7
Gate, Sampling Interval ............................................................................................................................... 1-8
Arming, Arming Delay .................................................................................................................................. 1-9
Inhibit ......................................................................................................................................................... 1-10
Input Coupling, Input Impedance ................................................................................................................ 1-11
Trigger Mode/Trigger Level, Reference Signal I/O .................................................................................... 1-12
1.6
Analysis and Calculation ......................................................................................................... 1-13
Readout Function ...................................................................................................................................... 1-13
Statistical Calculation ................................................................................................................................. 1-14
1.7
Displaying the Measured/Calculated Results ......................................................................... 1-18
Histogram Display ...................................................................................................................................... 1-18
List Display ................................................................................................................................................ 1-19
Time Variation Display ............................................................................................................................... 1-20
Statistics Display ........................................................................................................................................ 1-21
Panorama Display ..................................................................................................................................... 1-22
Multi-window function ................................................................................................................................ 1-23
Auto window function, Scaling Function .................................................................................................... 1-24
1.8
Other Functions ...................................................................................................................... 1-25
External Signal Input/Output, Communication, Storing and Recalling Setup Information,
Saving and Loading Data from Floppy Disks, the Internal Hard Disk, and External SCSI Devices,
Initialization of Setup Information ............................................................................................................... 1-25
Calibration, Beep and Click Sounds, Error Logging, Self-test,
Inter-symbol Interference Analysis Function (Option) ................................................................................ 1-26
Chapter 2
2.1
2.2
Front Panel ............................................................................................................................... 2-1
Rear Panel ................................................................................................................................ 2-2
2.3
Screen Display .......................................................................................................................... 2-3
Chapter 3
viii
Names and Uses of Parts
Before Starting Measurements
3.1
Precautions on the Use of the instrument ................................................................................. 3-1
3.2
3.3
Installing the Instrument ............................................................................................................ 3-3
Connecting the Power Cord ...................................................................................................... 3-5
3.4
3.5
Turning the Power Switch ON/OFF ........................................................................................... 3-6
Connecting Cables and Probes ................................................................................................ 3-7
IM 704310-01E
Contents
3.6
Calibrating the Probe (Performing Phase Correction) ............................................................... 3-8
3.7
Setting the Date and Time ...................................................................................................... 3-10
Chapter 4
Basic Operations
4.1
Starting and Stopping the Acquisition of an Input Signal .......................................................... 4-1
4.2
4.3
Setting Numerical Values and Strings ....................................................................................... 4-2
The Way to Look at the Soft Key Menu/Using the Rotary Knob and Select Key ...................... 4-4
1
2
3
Chapter 5
Selecting the Sampling Mode ................................................................................................... 5-1
Setting the Period Measurement .............................................................................................. 5-2
5.3
5.4
Setting the Time Interval Measurement .................................................................................... 5-3
Setting the Pulse Width Measurement ...................................................................................... 5-5
Chapter 6
Setting the Gate ........................................................................................................................ 6-1
6.2
6.3
Setting the Sampling Interval .................................................................................................... 6-4
Performing Block Sampling ....................................................................................................... 6-5
6.4
6.5
Setting the Arming Source, Slope, and Delay ........................................................................... 6-7
Setting the Inhibit Function ..................................................................................................... 6-11
6.6
6.7
Setting the Input Coupling, Input Impedance, and Trigger ...................................................... 6-13
Inputting/Outputting the Reference Signal .............................................................................. 6-15
Displaying the Histogram .......................................................................................................... 7-1
7.2
7.3
Displaying the List ..................................................................................................................... 7-3
Displaying the Time Variation .................................................................................................... 7-5
7.4
7.5
Displaying the Statistics ............................................................................................................ 7-7
Displaying the Panorama Display ............................................................................................. 7-9
7.6
7.7
Setting the Statistical Calculation Parameters (Calc/Stat) ...................................................... 7-12
Changing the Scale Value ....................................................................................................... 7-15
7.8
Reading the Data .................................................................................................................... 7-17
7
9
10
11
Displaying the Measured/Calculated Results in the Hardware
Histogram Mode
8.1
8.2
Displaying the Histogram .......................................................................................................... 8-1
Displaying the List ..................................................................................................................... 8-3
8.3
8.4
Displaying the Statistics ............................................................................................................ 8-5
Displaying the Panorama Display ............................................................................................. 8-7
8.5
8.6
Using the Multi-Window Function ........................................................................................... 8-10
Using the Auto Window Function ............................................................................................ 8-13
8.7
8.8
Setting the Statistical Calculation Parameters (Calc/Stat) ...................................................... 8-16
Changing the Scale Value ....................................................................................................... 8-18
8.9
Reading the Data .................................................................................................................... 8-20
Chapter 9
6
8
Displaying the Measured/Calculated Results in the Time Stamp
Mode
7.1
Chapter 8
4
5
Setting the Acquisition Conditions of the Measurement Input
Signal
6.1
Chapter 7
IM 704310-01E
Setting the Sampling Mode and Measurement Functions
5.1
5.2
Using the Inter-symbol Interference Analysis Function (Option)
12
13
14
15
9.1
Using the Inter-symbol Interference Analysis Function ............................................................. 9-1
9.2
9.3
Setting the Conditions for Data Extraction ................................................................................ 9-3
Analysis Example ...................................................................................................................... 9-6
ix
Index
Contents
Chapter 10 Storing/Recalling Setup Information from the Internal Memory
10.1
10.2
Storing the Setup Information to the Internal Memory ............................................................ 10-1
Recalling Setup Information from the Internal Memory ........................................................... 10-2
Chapter 11 Saving and Loading Data and Connecting to a PC
11.1
11.2
Floppy Disks ........................................................................................................................... 11-1
Internal Hard Disk (Option) ..................................................................................................... 11-2
11.3
11.4
Connecting SCSI Devices ....................................................................................................... 11-3
Changing the SCSI ID Number ............................................................................................... 11-4
11.5
11.6
Formatting the Disk ................................................................................................................. 11-5
Saving and Loading Setup Information ................................................................................... 11-8
11.7
11.8
Saving and Loading the Measurement Results .................................................................... 11-12
Saving the Statistical Calculation Results ............................................................................. 11-16
11.9 Deleting Files ........................................................................................................................ 11-18
11.10 Copying Files ........................................................................................................................ 11-21
11.11 Changing the File Name and Creating Directories................................................................ 11-24
11.12 Connecting the Instrument to a PC ....................................................................................... 11-26
Chapter 12 Outputting Screen Images
12.1
12.2
Attaching the Paper Roll for Printing ....................................................................................... 12-1
Printing .................................................................................................................................... 12-4
12.3
Saving Screen Images to Floppy Disk, Internal Hard Disk (Option),
and External SCSI Device ...................................................................................................... 12-6
Chapter 13 Using Other Functions
13.1
13.2
Initializing the Setup Information ............................................................................................. 13-1
Calibrating the Instrument ....................................................................................................... 13-4
13.3
13.4
Outputting Monitor Signals ...................................................................................................... 13-5
Checking the Setup Conditions of the Instrument and the ROM Version ............................... 13-6
13.5
Turning ON/OFF the Click Sound, Beep Sound, and Warning Display, Setting the Brightness of
the LCD Monitor ...................................................................................................................... 13-7
Chapter 14 Troubleshooting and Maintenance
14.1
14.2
Troubleshooting ...................................................................................................................... 14-1
Messages ................................................................................................................................ 14-2
14.3
14.4
Using the Error Logging Function ........................................................................................... 14-4
Performing a Self-test ............................................................................................................. 14-5
14.5
14.6
Adjusting the Time Base ......................................................................................................... 14-8
Executing the Performance Test ........................................................................................... 14-10
14.7
14.8
Replacing the Power Fuse .................................................................................................... 14-20
Recommended Replacement Parts ...................................................................................... 14-21
Chapter 15 Specifications
x
15.1
15.2
Measurement Input and Trigger .............................................................................................. 15-1
Measurement Functions (Measurement Items) ...................................................................... 15-2
15.3
15.4
Gate, Arming, and Inhibit ........................................................................................................ 15-4
Block Sampling ....................................................................................................................... 15-4
15.5
15.6
Display .................................................................................................................................... 15-5
Auto Window Function ............................................................................................................ 15-6
15.7
15.8
Inter-symbol Interference Analysis Function (Option) ............................................................. 15-7
Rear Panel Input/Output ......................................................................................................... 15-7
IM 704310-01E
Contents
15.9
GP-IB Interface ....................................................................................................................... 15-7
1
15.10 SCSI (Option) .......................................................................................................................... 15-8
15.11 Time Base ............................................................................................................................... 15-8
15.12 Internal Memory Function ....................................................................................................... 15-8
15.13 Built-in Printer ......................................................................................................................... 15-9
2
15.14 Built-in Floppy Disk Drive ........................................................................................................ 15-9
15.15 Internal Hard Disk Drive (Option) ............................................................................................ 15-9
15.16 General Specifications .......................................................................................................... 15-10
15.17 External Dimensions ............................................................................................................. 15-12
Index ........................................................................................................................................................... Index-1
3
4
5
6
7
8
9
10
11
12
13
14
15
IM 704310-01E
xi
Index
Chapter 1 Functions
1.1
1
System Configuration and Block Diagram
External SCSI device
Inhibit input
External arming input
(shared with the external gate input)
Reference input
SCSI (option)
Monitor output
Reference output
CH A
CH B
EXT ARM/GATE IN
INHIBIT IN
Input
signal
Item under
measurement
PC
Remote control
Data collection/analysis
Floppy disk
Block Diagram
10MHz
Reference
PLL Clock
Generator
REF.IN
REF.OUT
Measuring
Clock
Comparator
CHA
Input
AMP
MONITOR
OUT(A)
Trig
DAC
Comparator
CHB
MONITOR
OUT(B)
Input
AMP
TX1
CPU
T/V
Converter
TY1
T/V
Signal
Converter
Multiplexer
&
Fractional
Pulse
T/V
Generator TX2
Converter
Trig
DAC
TY2
T/V
Converter
Acquisition
DATA
Generator
1 to 4
Memory
&
Memory
Controller
LCD
Printer
Acquisition
DATA
Generator
5 to 8
Memory
&
Memory
Controller
SCSI&
HDD
FDD
GP-IB
External Arming Signal
EXT ARM/
EXT GATE
Inhibit Signal
Acquisition Controller
INHIBIT
IM 704310-01E
1-1
Functions
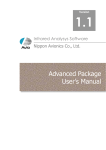
System Configuration
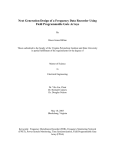
1.1 System Configuration and Block Diagram
Signal Flow
A signal that is input to the input terminal (Ach/Bch) is converted to a low-impedance
signal by the input amplifier (Input AMP). It is then passed to the comparator where it is
converted to a binary signal. The signal from the input amplifier is also output as a
monitor signal (MONITOR OUT(A)/MONITOR OUT(B)).
The signal multiplexer selects the measurement signal according to the specified
measurement function (item) and outputs the fractional sections according to the
measurement clock as fractional pulses. The fractional pulse width is measured with 25ps resolution by the time/voltage converter (T/V Converter) and sent to the data
generator where the measured data are generated.
The TA520 has eight data generator systems that generate data alternately. The
acquisition controller controls the overall acquisition process including the external
arming signal or inhibit signal.
In the time stamp mode, both the measured values and time stamp data (elapsed time)
are acquired in the acquisition memory. In the hardware histogram mode, however, only
the frequencies of occurrence of each measured value are acquired in the acquisition
memory. The acquired data are read by the CPU via the memory controller, at which
point the data are used in statistical calculations or displayed on the LCD.
Either the signal from the internal crystal oscillator (compensated against temperature
drift) or an external reference signal (signal from the REFERENCE IN terminal) can be
used as the reference signal. In either case, the signal is passed through a 10-MHz
band-pass filter and output as a reference clock output. The measurement clock uses
the frequency multiples of this reference clock.
1-2
IM 704310-01E
1.2
1
Measurement Principle
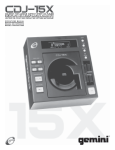
Time shorter than the period of the reference clock is called fractional time. In general,
since the signal being measured and the measurement clock are not synchronized,
fractional time exists at both the beginning and the end of measurements. This
instrument generates a “fractional pulse” which is a pulse signal amounting to the sum of
the fractional time and one cycle of the reference clock.
If the pulse width of the signal being measured, the period of the measurement clock,
and the times of the fractional pulses are taken to be T, t0, Ta, and Tb, respectively, T can
be broken into two terms: integer multiple of the measurement clock, N•t0, and the time
of the fractional pulses, Ta,Tb.
T=N•t0+(Ta–Tb)
This instrument converts the time (Ta, Tb) of the fractional pulse that it generated at the
beginning and end of the measurement to voltage values, which are then converted to
digital values using an 8-bit A/D converter.
In this way, the instrument is able to measure the time of the fractional pulse at 25-ps
time resolution per 1 LSB. T is determined by substituting the measured times of the
fractional pulses into the variables Ta and Tb of the above equation.
T
Signal to be measured
1
Reference clock
2
t0
Ta
N
Tb
Fractional pulse
Time-voltage conversion
Va =k·Ta
A/D conversion
V b =k·Tb
A/D conversion
T =N·t 0 + (Ta –Tb )
k: A/D conversion factor
IM 704310-01E
1-3
Functions
Measurement Principle
1.3
Sampling Mode
Sampling Mode
≡See 5.1 for the operating procedures≡
There are two sampling modes, time stamp mode and hardware histogram mode. The
sampling method (data acquisition method), the display format after measurements, and
methods of analysis and calculation vary depending on the sampling mode. For details
on the display format, see section 1.7 “Displaying the Measured/Calculated Results.”
Time stamp mode
The measured values and their time stamps* are acquired in the acquisition memory and
are handled as time-series data. The maximum sampling size (maximum number of
data points that can be acquired) is 512,000 points. There are four types of display
formats: histogram, list (measured values and time stamps), time variation, and statistics.
* The time elapsed from the point the arming occurred to the point the measurement of
one sample ended is called a time stamp.
Hardware histogram mode
The measured values and the frequencies of occurrence of those values are acquired in
the acquisition memory. The maximum sampling size (maximum number of data points
that can be acquired) is 109 points. There are three display formats: histogram, list
(measured values and frequencies of occurrence), and statistics.
The differences between the time stamp mode (T.S.) and hardware histogram
mode (H.H.)
Histogram display
List display
Time variation
Statistics display
Multi-window function
Maximum sampling size
Longest sampling time
T.S.
H.H.
Yes
Yes
Yes
Yes
No*1
512,000
320 s*2
Yes
Yes
No
Yes
Yes
109
3200 s
*1 When using the ISI (inter-symbolic interference analysis function) in the T.S. mode, the multiwindow function is used.
*2 320 s when the sampling interval is set to [0 µs], 3200 s when it is set to anything else.
1-4
IM 704310-01E
1.4
1
Measurement Functions (Measurement Items)
Functions
≡See 5.2 for the operating procedures≡
Period
Measures the pulse interval (time between rising edges or falling edges) of the input
signal. Either rising edge or falling edge can be selected. Channel A or B can be
selected for the measurement.
Example (rising slope is selected)
Measured
Measured
Measured
CH A/
CH B
Time Interval
≡See 5.3 for the operating procedures≡
Measures the time between the edge of the input signal of channel A and the first edge
of the input signal of channel B. For the various combinations of slopes, see section 5.3
“Setting the Time Interval Measurement.”
Example (Both channels A and B: rise)
Example (Channel A: both rise and fall, channel B: rise)
A B
A B
Measured
Measured Measured Measured
Measured
CH A
CH A
CH B
CH B
Pulse Width
≡See 5.4 for the operating procedures≡
Measures the time of the positive side (between the rising edge and falling edge) or the
negative side (between the falling edge and the rising edge) of the input signal. For the
various patterns of polarities, see section 5.4 “Setting the Pulse Width Measurement.”
Channel A or B can be selected for the measurement.
Example (positive: rising to falling)
Measured
Measured
Measured
Measured
CH A/
CH B
IM 704310-01E
1-5
1.5
Acquisition Conditions for the Input Signal
Being Measured
Measurement Block
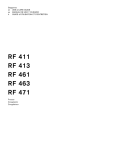
The TA520 repeats the process of making measurements, processing data, and
displaying the result. The “measurement block” refers to the smallest unit of
measurement that is handled in one cycle of the process. If the number of samples
(number of data points) acquired in one cycle of the process is N, then “one
measurement block” refers to measuring, processing, and displaying N samples of data.
As shown in the examples below, each sample (S1, S2, S3, to SN) in the measurement
block is measured for the corresponding sampling pulse (P1, P2, P3, to PN) that occurs
according to the specified sampling interval (see the section on sampling interval given
later).
When the period of the input signal is longer than the sampling interval
Preparation
for measurement
1 block
1 block
Data processing,
display
Measurement block
Measurement block
Input signal
S1
Sampling
pulse
P1
S2
P2
S3
SN
S1
P3
P4
Sampling interval
S2
P2
P3
S3
P4
When the period of the input signal is shorter than the sampling interval
1 block
Preparation
for measurement
1 block
Data processing,
display
Measurement block
Measurement block
Input signal
S1
Sampling
pulse
1-6
P1
S2
P2
S3
P3
S4
SN
P4
PN
Sampling interval
S1
P1
S2
P2
S3
P3
S4
P4
IM 704310-01E
1.5 Acquisition Conditions for the Input Signal Being Measured
Block Sampling
1
≡See 6.3 for the operating procedures≡
During the time stamp mode
The list and time variation for each measurement block can be displayed and statistical
calculations can be performed.
The maximum selectable block size (number of repetitions: N) is 100.
During the hardware histogram mode
An histogram of all measurement blocks can be displayed and statistical calculations can
be performed on them. Lists and statistical calculations on each block are not allowed.
The maximum selectable block size (number of repetitions: N) is 1000.
The relationship between the pause time and arming during block sampling is shown
below.
For Arming: Ext/with arming delay, pause time: OFF
Arming delay
Arming delay
External arming
1st block
2nd block
Input signal
S1
S2 S3
Measurement start
S1
S2 S3
Measurement start
For Arming: Ext/no arming delay, pause time: enabled
Arming delay
Arming delay
External arming
1st block
Pause time
2nd block
Input signal
S1
S2
S3
S1
Measurement start
S2
S3
Measurement start
For Arming: Auto, pause time: OFF
1st block
2nd block
3rd block
Input signal
S1
S2
S3
S1
S2
S3
S1
S2
S3
For Arming: Auto, pause time: enabled
Pause time
1st block
2nd block
Pause time
3rd block
Input signal
S1
IM 704310-01E
S2
S3
S1
S2
S3
S1
S2
S3
1-7
Functions
The single measurement block explained above can be repeated N times. Repetitively
measuring “one measurement block” N times is called block sampling.
In block sampling, data processing and display are done after measuring all N blocks of
data. Also, in block sampling, you can set a pause time, defined as the period of time
between block measurements.
The display and analysis of data that has been block sampled varies depending on the
sampling mode as follows.
1.5 Acquisition Conditions for the Input Signal Being Measured
Gate
≡See 6.1 for the operating procedures≡
You can specify the size of a measurement block in terms of the number of events or the
gate time. Measurement is carried out for the number of events or over the time when
the gate is open. There are three types of gates.
Event gate
Each sample is called an event. For example, measurement of one period is equivalent
to one event. Up to 512,000 events during time stamp mode, and up to 109 events
during the hardware histogram mode can be set as long as the time is within the
maximum sampling time (see page 1-4) since arming (see next page).
Time gate
Up to 10 s of gate time can be set as long as the maximum sampling size of each
sampling mode is not exceeded.
External gate
The external arming input terminal (see next page) is used to control the gate. The gate
can be open for up to the longest allowed sampling time (see page 1-4) as long as the
maximum sampling size of each sampling mode is not exceeded. You can also select
which polarity, positive or negative, to use in opening the gate.
Gate is open
External gate
1 Measurement block
Input signal
S1
S2
S3
Start of measurement
Sampling Interval ≡See 6.2 for the operating procedures≡
The sampling interval is the interval at which data samples are acquired.
Samples are acquired continuously at the specified interval. However, samples cannot
be acquired continuously if the period of the input signal is shorter than 23 ns.
The operation varies depending on the sampling mode.
During time stamp mode
The TA520 generates sampling pulses (see the measurement block section described
earlier) at the sampling interval. After the sampling pulse, when the input signal meets
the trigger condition (trigger level, slope, etc.), a measurement is made. The available
sampling intervals are 0 µs and 1 µs to 1 s. When 0 µs is selected, the data are sampled
at approximately 23 ns intervals.
During hardware histogram mode
The sampling interval is fixed to approximately 23 ns and cannot be changed.
1-8
IM 704310-01E
1.5 Acquisition Conditions for the Input Signal Being Measured
Arming
1
≡See 6.4 for the operating procedures≡
Auto arming
Arming is activated automatically after the START key is pressed or the START
command is issued. In this case, the arming source is an internal signal.
External arming
After the measurement is started, arming is activated by applying a signal to the external
arming input terminal. In this case, the arming source is an external signal. You can
select whether the rising or falling edge is used to activate the arming. The following
signal levels (arming levels) are available: TTL (1.4 V), TTL/10 (0.14 V), and 0 V.
Start of measurement
Arming
Measurement
block
Arming Delay
≡See 6.4 for the operating procedures≡
When using external arming, you can delay the start of the measurement by a certain
amount of time or number of events after an arming occurs.
There are two types of arming delays.
Time delay
The measurement starts after being delayed for the specified time (up to 1 s).
Event delay
The measurement starts after being delayed for the specified number of events (up to
1000000).
IM 704310-01E
1-9
Functions
Arming is the trigger that starts the measurement of a measurement block. There are
two types of arming: auto arming in which the measurement starts when the START key
is pressed or the START command is issued, and external arming in which the
measurement starts when an external signal is received.
1.5 Acquisition Conditions for the Input Signal Being Measured
Inhibit
≡See 6.5 for the operating procedures≡
You can inhibit measurements by applying a signal to the INHIBIT input terminal. This is
possible even while the gate is open or during measurement after arming activation. You
can inhibit measurements for time periods as long as the longest allowed sampling time
(see page 1-4).
You can select whether the positive or negative polarity of the signal will be used to
inhibit the measurement. The following signal levels (inhibit) are available: TTL (1.4 V),
TTL/10 (0.14 V), and 0 V.
The following examples show some of the relationships between the inhibit signal and
gating/arming.
Relation between the inhibit signal and gating
Mesurement is inhibited.
Inhibit signal
Gate is open.
Gate
Not measured.
Input signal
S4
S5
S1
S2
S3
Start of measurement
Measurement is resumed.
Not counted as an
event during inhibition
of measurement.
Relation between the inhibit signal and gating/external arming
Mesurement is inhibited.
Inhibit signal
Gate is open.
Gate
External arming
Not measured.
Input signal
S4
S5
S1
S2
S3
Measurement is resumed.
Start of measurement
Not counted as an
event during inhibition
of measurement.
Relation between the inhibit signal and gating/external arming/arming delay
Mesurement is inhibited.
Inhibit signal
Gate is open.
Gate
Arming delay
External arming
Not measured.
Input signal
S4
S5
S1
S2
S3
Measurement
Start of measurement
Not counted as an is resumed.
event during inhibition
of measurement.
1-10
IM 704310-01E
1.5 Acquisition Conditions for the Input Signal Being Measured
Input Coupling
1
≡See 6.6 for the operating procedures≡
AC
The signal is input through a capacitor. This setting is used to remove the DC
component from the input signal in order to measure just the amplitude of a signal or a
signal riding on top of a certain DC voltage.
Input terminal
Input
amplifier
DC
The signal is input directly to the amplifier. This setting is used when measuring both the
AC and DC components of a signal.
Input terminal
Input Impedance
Input
amplifier
≡See 6.6 for the operating procedures≡
To reduce attenuation and distortion of the measurement signal, the input impedance of
CHA and CHB of the instrument can be selected so that it matches the output
impedance of the signal source. The available settings are 50 Ω and 1 MΩ.
IM 704310-01E
1-11
Functions
When you want to measure just the amplitude (AC component) of an input signal or a
signal riding on top of a certain DC voltage, measurements can be facilitated if the DC
component is removed from the signal. In other cases, you may want to measure both
the AC and DC components of the input signal. In these cases, an appropriate input
coupling is applied to the signal when entering the input amplifier. The following types of
input coupling are available:
1.5 Acquisition Conditions for the Input Signal Being Measured
Trigger Mode/Trigger Level
≡See 6.6 for the operating procedures≡
When measuring one sample, you can select the level at which the measurement is to
be carried out (trigger condition). The level at which to activate the trigger is called the
trigger level.
Manual trigger
The trigger level is set to the value that is specified using the rotary knob or the
numerical keys.
Single auto trigger
Taking the maximum and minimum values of the input signal during the first
measurement block to be 100% and 0%, respectively, the trigger level is set to the
specified percentage level. The trigger level for all following blocks is set to this level.
Repeat auto trigger
Taking the maximum and minimum values of the input signal during the first
measurement block to be 100% and 0%, respectively, the trigger level is set to the
specified percentage level. Unlike single trigger, the trigger level is reset for each
measurement block.
When the [Level] is set to 50% using single auto trigger
Detect max./min. values
1st measurement block
Max. value (100%)
50% level
Trigger level
(Input signal)
Min. value (0%)
Reference Signal I/O
Trigger activated
≡See 6.7 for the operating procedures≡
Reference input
The instrument has an internal reference clock used for making measurements.
However, a 10-MHz external signal can be applied to the REFERENCE IN terminal on
the rear panel and can be used as the reference clock instead.
Reference output
The internal reference clock signal or the externally applied reference clock signal is
passed through a 10-MHz band-pass filter and is continuously output from the
REFERENCE OUT terminal.
1-12
IM 704310-01E
1.6
1
Analysis and Calculation
X1, X2, and Y markers can be displayed for histogram displays (see section 1.7). X1,
X2, Y1, and Y2 markers can be displayed for time variation displays (see section 1.7).
The coordinates of the cross points of these markers and the histogram and time
variation graphs can be read. In addition, statistical calculation can be performed
independently over the area enclosed by the markers (see next section).
For histogram displays
The values shown on the bottom of the graph represent the following:
X1: X coordinate (measured value) of the X1 marker
V1: Y coordinate (frequency of occurrence X1) of the X1 marker
X2: X coordinate (measured value) of the X2 marker
V2: Y coordinate (frequency of occurrence X2) of the X2 marker
∆X: X2–X1
Num:
Number of samples used in the statistical calculation
X2 marker
X1 marker
Y marker
Readout values
For time variation displays
The values shown on the bottom of the graph represent the following:
X1: X coordinate (time stamp) of the X1 marker
V1: Y coordinate (measured value) of the X1 marker
X2: X coordinate (time stamp) of the X2 marker
V2: Y coordinate (measured value) of the X2 marker
∆X: X2–X1
∆V:
|V2–V1|
Y1: Y coordinate (measured value) of the Y1 marker
Y2: Y coordinate (measured value) of the Y2 marker
∆Y: |Y2–Y1|
T.Num: Number of samples used in the statistical calculation
X1 marker
X2 marker
Y2 marker
Y1 marker
Readout values
Note
•
•
IM 704310-01E
The Y marker on the histogram display is used to set the area for performing statistical
calculations.
During time variation display, if there are multiple data points at the marker position, the
average value is displayed. If there is no data at the marker position, an asterisk (*) is
displayed.
1-13
Functions
Readout Function ≡See 7.8 and 8.9 for the operating procedures≡
1.6 Analysis and Calculation
Statistical Calculation
≡See 7.6 and 8.7 for the operating procedures≡
You can set the area on which to calculate statistics, the constant T, and the parameters
to be calculated.
Select the area to be used in the statistical calculations
Select whether to calculate the statistics over the entire window or the area enclosed by
the markers.
If the time variation is displayed on data that was block sampled in the time stamp
mode, you can also select the [Block] on which to calculate the statistics.
If you are using the multi-window or auto window function, the statistics are calculated
over the area enclosed by markers for each window.
When calculating the statistics over an area enclosed by markers
For histogram display
X1 marker
X2 marker
For time variation display
X1 marker
X2 marker
Y1 marker
Y marker
Y2 marker
Calculate statistics over this area
Setting the slope (Calculation Slope) and polarity (Calculation Polarity)
You can specify the slope and polarity for the statistical calculation only for the following
measurement functions.
The statistics can be calculated separately on data having the specified slope or polarity.
• For time interval measurements, when the slope setting is either A B or A B .
• For pulse width measurements, when the polarity setting is
.
Setting the Constant T
Set the constant T used when calculating the statistical values jitter and MELE. This
value corresponds to the read-out clock when the measured device is an optical disk or
optical disk drive.
You cannot change the value of T when using the auto window function since it is
automatically set.
Statistical calculation parameters
Statistics can be calculated based on the measured values (during time stamp mode) or
histogram (during hardware histogram mode). The results of the statistical calculation
can be displayed on the histogram, statistic, and time variation displays (see section
1.7).
The equations used to calculate some of the statistics vary depending on the sampling
mode. In addition, in the time stamp mode, you can select to calculate the statistics on
the time variation or on the histogram.
During the time stamp mode
The following differences exist between the time variation display and the histogram
display.
Time variation: You can set the area over which to calculate the statistics with the time
stamp and measured value.
Histogram
: You can set the area over which to calculate the statistics with the
measured value (bin) and frequency of occurrence.
1-14
IM 704310-01E
1.6 Analysis and Calculation
• Average value
Calculates the average value of the measured values.
Average =
1
n
n
Σ Xi
i= 1
• Maximum value
Indicates the maximum measured value.
Maximum = [X i ] max
• Minimum value
Indicates the minimum measured value.
Minimum = [X i ] min
• Peak-to-Peak
Calculates the difference between the maximum and minimum values.
Peak - Peak = Maximum – Minimum
• Standard deviation (σ)
Calculates the standard deviation of the measured values. This indicates the
degree to which the values are spread out from the average value.
σ=
1
n
n
Σ(X i – Average) 2
i=1
• Flutter (σ/Average)
Measures the flutter. This indicates the spread in the values in terms of a
percentage of the average value.
σ
σ / Average =
× 100 (%)
Average
• σ/T (only for histograms)
Calculates the histogram jitter using the specified constant T. Indicates the spread
of the values in terms of a percentage of the value T.
σ
σ/T=
× 100 (%)
T
• Effect Length Error, E.L.Error for short (only for histograms)
XCENTER is the center value of the x axis in the window. See section 1.7 for details.
Originally, XCENTER represented the value around which the measured data would
be distributed.
Indicates the offset of the measured average value with respect to XCENTER.
E.L.Error=Average–X CENTER
• Maximum Effect Error, MELE for short (only for histograms)
Indicates the offset of the measured average value with respect to XCENTER in terms
of a percentage of the value T.
MELE =
IM 704310-01E
|Average–X CENTER |
T
×100(%)
1-15
1
Functions
In the following equations, n is the number of samples, Xi is the measured value of
each sample, and Xj (only for histograms) is the class value of each bin of the
histogram.
If the statistics are calculated on the time variation, “T.” is placed in front of the
statistical calculation parameter names.
1.6 Analysis and Calculation
• Median (only for histograms)
Indicates the median of the histogram.
Median= [X j ] Median
• Mode (only for histograms)
Indicates the class value with the highest frequency of occurrence (most frequent
value).
Mode= [X j ] Mode
• T.(P-P/Average)
Indicates the spread in the Peak-to-Peak values in terms of a percentage of the
average value.
P-P
T.(P-P/Average) =
×100
Average
• T.RF (only for time variation)
Calculates the average value of T.(P-P/Average) of all blocks that were block
sampled.
N is the total number of blocks. P-Pk is the Peak-to-Peak value of each block, and
AVEk is the average value of each block.
N
P-P k
1
T.RF =
×100
N k=1 AVE k
During the hardware histogram mode
In the equation below, n is the number of bins in the histogram. A bin of a histogram
refers to a bar that indicates the frequency of occurrence on the histogram. Xi is the
class value of each bin of the histogram. Depending on the span setting of the X-axis,
the interval width of each bin becomes 25 ps in which case Xi becomes the measured
value. For details, see section 1.7 “Histogram Display.”
• Average
Calculates the average value of the histogram. Pi is the relative frequency*.
n
Average =
Σ X i× P i
i= 1
* If the total number of samples on which the statistics are being calculated is N,
and the frequency of occurrence (number of samples) of a certain bin is Ni, then
the relative frequency becomes Pi = Ni/N.
• Maximum value
Indicates the maximum class value.
Maximum = [X i ] max
• Minimum value
Indicates the minimum class value.
Minimum = [X i ] min
• Peak-to-Peak
Calculates the difference between the maximum and minimum values.
Peak- Peak = Maximum – Minimum
1-16
IM 704310-01E
1.6 Analysis and Calculation
n
σ=
Σ(X i – Average) 2 ×P i
i=1
• Flutter (σ/Average)
Measures the flutter of the histogram. Indicates the spread in the values from the
average value in terms of a percentage of the average value.
σ
σ / Average =
× 100 (%)
Average
• σ/T
Calculates the histogram jitter using the specified constant T. Indicates the spread
in the values in terms of a percentage of the value T.
σ
σ/T=
× 100 (%)
T
• Effect Length Error, E.L.Error for short
XCENTER is the center value of the x axis in the window. See section 1.7 for details.
Originally, XCENTER represented the value around which the measured data would
be distributed.
Indicates the offset of the actually measured average value with respect to
XCENTER.
E.L.Error=Average–X CENTER
• Maximum Effect Length Error, MELE for short
Indicates the offset of the measured average value with respect to XCENTER in
terms of a percentage of the value T.
MELE =
|Average–X CENTER |
T
×100(%)
• Median
Indicates the median of the histogram.
Median= [X i ] Median
• Mode
Indicates the class value with the highest frequency of occurrence (most frequent
value).
Mode= [X i ] Mode
IM 704310-01E
1-17
1
Functions
• Standard deviation (σ)
Calculates the standard deviation of the histogram. This indicates the degree to
which the values are spread out from the average value. Pi is the relative
frequency.
1.7
Displaying the Measured/Calculated Results
Histogram Display ≡See 7.1 and 8.1 for the operating procedures≡
By displaying the histogram (frequency distribution) of the measured data, you can see
the data distribution. You can manually set the X-axis (time) and Y-axis (frequency) of
the histogram. You can also have them set automatically using the auto scale function.
The following items can be set.
• The center value of the X-axis (X Center)
• The X-axis width (X Span)
• The scaling format of the Y-axis (select linear scale or log scale)
• The maximum Y-axis value (Y High)
Frequency distribution
The histogram is displayed according to the settings made for the above values. If a
class has a time span, the average value will be used as the class value. For example, if
the minimum and maximum values in a class are 505 ns and 515 ns, respectively, 510
ns will be treated as the class value. The samples in this class are all considered to
correspond to 510 ns (if the value is read out with the marker, the class value is read
out).
As shown in the diagram below, each value on the X-axis of the instrument represents a
class value or a displacement. The histogram is created by accumulating the number of
samples that fall in each class.
Y-axis Scale (Log scale for this example)
Y-axis max.
value (Y High)
One bar is called a “bin.”
X-axis span
(X Span)
Class
Left most value
on the X-axis
X-axis center value
(Class value at the center,
X Center)
(Displacement in the
negative direction from X center)
Right most value
on the X-axis
(Displacement in the
positive direction from
X center)
Items that can be displayed
Besides the histogram, you can select whether or not to display the marker read-out
values, the statistics, and a panorama window.
Panorama window
Displays statistics
Displays readout values
Histograms displayed with overlap
set to OFF and at half size
1-18
IM 704310-01E
1.7 Displaying the Measured/Calculated Results
List Display
1
≡See 7.2 and 8.2 for the operating procedures≡
During time stamp mode
The time stamp and measured values are listed within the range of the number of events
or time specified for the [gate] (see section 1.5). The specified data number is
highlighted and the time variation waveform corresponding to the data number displays a
dotted line and a mark.
When block sampling, each block can be individually listed by specifying the number of
the measurement block.
Data number
Time stamp
Measured value
Highlights the specified data
During hardware histogram mode
The measured values (the class values of the histogram) and the frequencies are listed
within the range of the width of the X-axis (X Span) of the histogram display. The
specified data number is highlighted and the time variation waveform corresponding to
the data number displays a dotted line and a mark.
When using the multi-window or auto window function, the list is displayed for each
window (3T, 4T, All, etc.).
Data number
Class value
Frequency
Highlights the specified data
IM 704310-01E
1-19
Functions
Display a list of the measured data. You can move and display different parts of the list
using the jump function which can move to the top, center, or end of the data or by
specifying the data number. The displayed contents vary depending on the sampling
mode as follows:
1.7 Displaying the Measured/Calculated Results
Time Variation Display
≡See 7.3 for the operating procedures≡
During the time stamp mode, the measured data and time stamps are treated as data
and acquired to the acquisition memory. The time variation display function uses this
time-series data to display the variation of the measured value in relation to the elapsed
time since the arming.
You can manually set the X-axis (time) and Y-axis (measured data) for the time variation
display. You can also have them set automatically using the auto scale function. The
following items can be set.
• The minimum X-axis value (X Minimum)
• The center value of the Y-axis (Y Center)
• The X-axis width (X Span)
• The Y-axis width (Y Span)
Y-axis span (Y Span)
Displacement in the positive direction from Y center
Y-axis
center value
X-axis min. value
Displacement in the negative
direction from Y center
Displacement in the positive
direction from X minimum
X-axis span (X Span)
Items that can be displayed
Besides the histogram, you can select whether or not to display the marker read-out
values, the statistics, and a panorama window.
Panorama window
Displays statistics
Displays readout values
Time stamp displayed at half size
Display method
You can select whether or not to show the grid and whether or not to connect the data
points with a line.
1-20
IM 704310-01E
1.7 Displaying the Measured/Calculated Results
1
Statistics Display ≡See 7.4 and 8.3 for the operating procedures≡
For time stamp mode
You can select to calculate the statistics of the histogram or of the time variation.
Depending on the above selection, the statistical parameters that can be calculated vary.
When calculating the statistics
of the histogram
When calculating the statistics
of the time variation
Statistical parameter
Statistical calculation
area
Statistics
Statistical parameter
Statistical calculation
area
Statistics
• If the statistics are calculated on the time variation, σ/T, E.L.Error, MELE, Median,
and Mode are not calculated or displayed, but T.(P-P/Average) and T.RF are.
• If the statistics are calculated on the time variation of data that was block sampled,
then you can select ALL or Block for the displayed statistics.
All
: Display all of the statistics on each measurement block.
Block : Display only the statistics for the specified block.
• You can select the area over which the statistics are calculated from the following
choices:
Window: Calculate over the entire window.
Marker : Calculate over the area enclosed by the markers.
Block : For data that was block sampled, calculate over each measurement
block.
Calculate over all the data when block sampling is OFF.
For time interval measurement and pulse width measurement, the statistics can be
displayed separately for each slope and polarity setting (see page 1-14 “Setting the
slope and polarity”).
IM 704310-01E
1-21
Functions
The statistics are calculated over the area and on the items that are specified in the
Calculation/Statistics setting menu that is accessed with the [Calc/Stat] soft key. A list of
results is displayed. For information on the parameters of the statistical calculation, the
details of the calculation, and the area, see section 1.6 “Analysis and Calculation.” The
displayed results vary depending on the sampling mode.
1.7 Displaying the Measured/Calculated Results
For hardware histogram mode
When using single window, you can select the area over which to calculate the statistics
from Window (entire window) and Marker (area enclosed by the markers).
When using the multi-window or auto window function, the statistics are calculated over
the area enclosed by the markers. The following display styles are available for
displaying the statistics:
• All
: Display the statistics of all windows that were defined in the multi-window
setting menu (example: 3T to 14T).
• Window: Display the statistics of the window that was defined in the [Window
Parameter Setting] menu or the [Summation] window.
When Window is selected while
When ALL is selected while using the
using the multi-window function or
multi-window function
when using single window
Statistical parameter
Statistical calculation area
Statistical parameter
Statistical calculation area
Statistics
Statistics
Panorama Display ≡See 7.5 and 8.4 for the operating procedures≡
During the histogram display (only for the hardware histogram mode) or the time
variation displayed, the measured data can be displayed in the upper section of the
window (referred to as the panorama display). In addition, a section of the data that is
displayed in the panorama display (waveform in the zoom box) can be displayed in the
main window (zoom display). You can move the zoom box in the panorama window.
For time stamp mode
Displays the time variation waveform in the
zoom box in the main window
Panorama window
Panorama display area
Main window
For hardware histogram mode
Left most value of the panorama display
Displays the time variation waveform
in the zoom box in the main window
Panorama window
Right most value of the panorama
display
Main window
1-22
IM 704310-01E
1.7 Displaying the Measured/Calculated Results
Multi-window function
1
≡See 8.5 for the operating procedures≡
Displays the 3T window in the main window
(Set the window size and etc. in the screen
shown on the right)
Select multi-window
Number of windows
Main window
Display area of each window
Summation display
The histograms (enclosed by the X1 and X2 markers) of all windows that have been set
with the multi-window function can be summed and displayed in one window. The center
values of the X-axis of the histogram of each window are aligned and the frequencies of
each bin are summed.
Only the histograms in the area enclosed by the markers are summed.
You can compare the data distribution between each histogram and calculate the
statistics of all histograms at once.
Statistics of
the summed
histogram
Histogram of
the sum of all
windows
Calculates the
statistics on the
checked
parameters.
IM 704310-01E
Sum
1-23
Functions
When the distribution of the data of one measurement block is distributed over multiple
center values on the X-axis, multiple histograms are created. You can simultaneously
display all the histograms in the main window. However, you can also set multiple
windows and display each histogram in its own window and observe it in detail. The
function that allows for the setting of multiple windows and the display of the histogram of
each window is called the multi-window function. Up to 16 arbitrary sized windows can
be set.
By using this function in conjunction with the panorama display, you can easily see which
histogram among the various windows is being displayed or set.
1.7 Displaying the Measured/Calculated Results
Auto window function
≡See 8.5 for the operating procedures≡
This function is used to measure the signal of several RLL (Run Length Limited) symbols
for which the data rate is unknown. The clock period T is measured, and the X-axis
values are automatically set.
The following modulation methods are supported:
• EFM modulation
• EFM+ modulation
• 1-7 modulation
There are two methods of automatic setting.
• Measured T: Apply the input signal to CHA and the read-out clock signal to CHB. The
value of T is measured from the period of the clock signal.
• Estimated T: The value of T is estimated from the frequency distribution of the input
signal and the modulation method. This is used when the clock signal
cannot be inputted.
Select the method of automated measurement
Auto window
Select the modulation method
Automatically configures the T value and X-axis values of each window
Scaling Function ≡See 7.7 and 8.8 for the operating procedures≡
To display the measured data, various values must be set such as the minimum value or
the center value of the X-axis, the X-axis span, the center or the maximum value of the
Y-axis, and the Y-axis span.
This instrument has auto scaling in which the X-axis and Y-axis parameters are
automatically set according to the data. It also has manual scaling in which the X-axis
and Y-axis parameters can be set arbitrarily.
For histogram display
For time variation display
X-axis center value
X-axis min. value
Y-axis center value
X-axis span
Y-axis max. value
X-axis span
Y-axis span
1-24
IM 704310-01E
1.8
1
Other Functions
≡See chapter 6 and 13.3 for the operating procedures≡
Input/output terminals (BNC) for exchanging signals with external devices are provided
on the front and rear panels. For the locations of the terminals, see section 2.1 “Front
Panel” and 2.2 “Rear Panel.”
Reference input
The instrument has an internal reference clock used for making measurements.
However, a 10-MHz external signal can be applied to the REFERENCE IN terminal on
the rear panel and can be used as the reference clock instead.
Reference output
The internal reference clock signal or the externally applied reference clock signal is
passed through a 10-MHz band-pass filter and continuously output from the
REFERENCE OUT terminal.
Monitor output
The signal applied to the input terminal is voltage divided to approximately half its value
and output from this terminal.
This signal can be used to check the waveform when phase correcting a probe. Which
channel’s input signal is output varies depending on the measurement function.
External arming input/inhibit input
These signals are used to externally control the measurement functions of the
instrument. The external arming input terminal is shared with the external gate input
terminal. For the functions of the external arming or inhibit input signal, see section 1.5
“Acquisition Conditions for the Input Signal Being Measured.”
Communication
≡See the “GP-IB Interface User’s Manual” (IM704310-12E).≡
The GP-IB Interface comes standard with the instrument. The measured data can be
transferred to a PC for analysis or an external controller can be used to control the
instrument.
Storing and Recalling Setup Information
≡See chapter 10 for the operating procedures≡
Up to 10 sets of setup information can be stored in the internal non-volatile memory. The
stored information can also be recalled to set up the instrument. This function is useful
when the same setup is used often.
Saving and Loading Data from Floppy Disks, the Internal Hard Disk, and External SCSI
Devices
≡See chapter 11 for the operating procedures≡
The floppy disk (FD) drive comes standard with the instrument. An internal hard disk can
be installed as an option.
The setup information or measured data can be stored and loaded whenever it is
necessary. You can also save an image of the screen in TIFF, BMP, or PostScript
format. You can create reports by pasting the screen image data to a document created
using a word processor.
Initialization of Setup Information
≡See chapter 13 for the operating procedures≡
The setup information can be reset to their factory default settings.
IM 704310-01E
1-25
Functions
External Signal Input/Output
1.8 Other Functions
Calibration
≡See 13.2 for the operating procedures≡
Using the internal calibration signal, the offset voltage of the input amplifier and the
conversion factors of the time and voltage converters can be calibrated. Calibrate the
instrument when the ambient environment (temperature and humidity) changes
drastically.
Beep and Click Sounds ≡See 13.5 for the operating procedures≡
A beep sound is heard when an error occurs. You can turn OFF this beep sound. You
can also select to turn ON or OFF the click sound that is heard when the rotary knob is
turned.
Error Logging
≡See 14.3 for the operating procedures≡
When a data error such as a data overflow or a communication error occurs, a mark is
displayed in the upper right corner of the screen. In such instance, the error message is
logged. You can review these messages later.
Self-test
≡See 14.4 for the operating procedures≡
If you are in doubt as to whether the instrument has malfunctioned, you can run a selftest before contacting a YOKOGAWA dealer. You can run checks on the circuit board,
the keys, the display, and other functions.
Inter-symbol Interference Analysis Function (Option)
≡See chapter 9 for the operating procedures≡
The data around the spaces and marks of the specified condition can be extracted. The
data can be displayed in a histogram format or their statistics can be calculated. In
addition, the histograms and statistics of all marks and spaces of the measured data can
be displayed at the same time.
Note that inter-symbol interference analysis can only be performed on pulse width
measurements in the time stamp mode when the polarity setting is
.
Analysis Example (Extracting the mark data before the 3T space)
Mark
11T
Space
3T
Mark
11T
Trigger
Extract
Space Mark Space
Mark
3T 3T 6T
14T
Trigger
Extract
Space Mark
3T
7T
Trigger
Extract
Histogram display
of all mark data
Histogram display of
extracted mark data
Statistics of the extracted mark data
Statistics of all mark data
1-26
IM 704310-01E
Chapter 2 Names and Uses of Parts
2.1
Front Panel
MODE key: Select the sampling mode (Section 5.1).
FUNCTION key: Select the measurement function (Section 5.2 to 5.4).
SAMPLE key: Set gate, block sampling, arming, inhibit, and reference clock (Chapter 6).
INPUT key: Set input coupling, input impedance, and trigger mode (Section 6.6, 6.7).
DISPLAY key: Set the display format, calculation, and multi-window (Chapter 7).
SCALE key: Set the manual scaling (Section 7.7, 8.8).
MARKER key: Set the read-out marker (Section 7.8, 8.9).
UTITLITY key: Initialize setup, store and recall from internal memory, etc (Chapter 10, 13).
INITIALIZE key: Initialize setup (Section 13.1).
FILE key: Save and load data from a medium (Chapter 11).
AUTO SCALE key: Execute auto scaling (Section 7.7, 8.8).
COPY key: Copy to the specified device (Chapter 12).
LOCAL key: Release remote mode.
COPY MENU key: Set copy (Chapter 12).
2
Names and Uses of Parts
25ps resolution 43MS/s
TIME INTERVAL ANALYZER
Eject button
Eject floppy disk
(Section 11.1)
Floppy disk drive
Access indicator
ESC key
Clears soft key
menu
Soft keys
ESC
MODE FUNCTION SAMPLE INPUT
INITIALIZE
DISPLAY SCALE
8
9
n
4
5
6
µ
1
2
3
ET
RES
SELS
CT
MARKER UTILITY
LOCAL
COPY MENU
AUTO
SCALE
COPY
SINGLE
FILE
7
SHIFT
m
sec/V/%
0
ENTER
START/STOP
CH A
CH B
EXT ARM/ EXT GATE
POWER
50Ω≤5Vrms
1MΩ≤40Vpk
1MΩ≤40Vpk
INHIBIT
RESET key
(Section 4.3)
SELECT key
(Section 4.3)
Rotary knob
Set numbers,
move markers,
select files, etc
(Section 4.3).
Arrow keys
Move across digits
when setting
numerical values,
backspace
(Section 4.2)
Inhibit input terminal
Power switch
(Section 3.4)
IM 704310-01E
External arming input
terminal (shared with
the external gate
input terminal)
Numerical keys
CHA/CHB input indicator
Blinks when input signal is being applied and the trigger is activated
CHA/CHB input terminal
Connect input signal cables (Section 3.5)
START/STOP key
Start/stop continuous measurement (Section 4.1)
SINGLE key
Carry out one measurement (Section 4.1).
2-1
2.2
Rear Panel
Adjustment hole for the reference clock frequency
Used to adjust the time base (Section 14.5).
Reference input terminal
Inputs external reference clock (Section 6.7).
Reference output terminal
Outputs reference clock (Section 6.7).
CHA/CHB monitor output terminal
Outputs input signals (section 13.3)
WARNING
CAUTION
Do not operate without reading
In user`s manual safety precautions.
Warning plate
(Page 4, Section 3.1)
Protect the Instrument from vibration
or shock when power is ON
(especially for internal hard disk type).
REFERENCE
ADJUST
MONITOR OUT
REFERENCE
IN
OUT
CHA
10MHz 1Vp-p
10MHz 1Vp-p
(50Ω)
CHB
(50Ω)
GP-IB (IEEE488)
SCSI
100-120V AC
200VA MAX 50/60Hz
FUSE 250V T 3A
MODEL
SUFFIX
NO.
Made in Japan
SCSI connector
(option)
Connect SCSI
devices
(Section 11.3).
Power cord
connector
Connect the
power supply
(Section 3.3)
Name plate
(Page2)
Vent holes
GP-IB connector
Connect to external device for communication
See the GP-IB Interface User’s Manual (IM704310-12E)
2-2
IM 704310-01E
2.3
Screen Display
2. Comments
3. Date and time
2
4. System icon
Names and Uses of Parts
1. Setup
information
5. Busy icon
6. Panorama
display
13. Zoom box
12. Y-axis
maximum
value
7. Statistics
display
8. X-axis width
9. Read out value
10. Center value
of the X-axis
11. Soft key menu
1. Setup information
Displays the conditions for measuring the data (sampling mode, measurement
function, etc.).
2. Comments
Displays the comment that is added to the screen image data when they are printed
such as on the internal printer.
3. Date and time (See section 3.7)
4. System icon
Displayed when there is a message or when the system is abnormal.
: Displayed when there is a error message or a warning message (see
section 14.3).
: Displayed when the lithium battery is dead or the system is abnormal.
Perform the self-test when this icon is displayed (see section 14.4).
5. Busy icon
Displayed during the following operations.
: Blinks while accessing a medium.
: Blinks while printing to the internal printer.
: Blinks while processing data.
: Blinks while detecting SCSI devices.
6. Panorama display (see sections 7.5 and 8.4)
7. Statistics display
The statistics can be displayed with the histogram or the time variation display.
8. X-axis width (X Span)
You can set the window range to display.
IM 704310-01E
2-3
2.3 Screen Display
9. Read out value
Displays the read-out values of the X1 and X2 markers.
10.Center value of the X-axis
You can set the center value of the X-axis of the histogram display.
11.Soft key menu
Corresponds to the soft key on the front panel.
12.Y-axis maximum value
You can set this value for the log scale and linear scale.
13.Zoom box
The waveform in the zoom box is displayed zoomed in the main window.
2-4
IM 704310-01E
Chapter 3 Before Starting Measurements
3.1
Precautions on the Use of the instrument
Safety Precautions
• Nothing should be placed on top of the power cord. The power cord should also be
kept away from any heat sources. When unplugging the power cord from the outlet,
never pull the cord itself. Always hold the plug and pull it. If the power cord is
damaged, contact your dealer for replacement. Refer to page 2 for the part number
when placing an order.
IM 704310-01E
3-1
3
Before Starting Measurements
• If you are using this instrument for the first time, make sure to thoroughly read the
“Safety Precautions” given on page 4.
• Do not remove the cover from the instrument
Some sections inside the instrument have high voltages that are extremely
dangerous. For internal inspection or adjustment, contact your nearest YOKOGAWA
dealer.
• Never continue to use the instrument if there are any symptoms of trouble such as
strange smells or smoke coming from the instrument. In such cases, immediately turn
OFF the power and unplug the power cord. Then, contact your nearest YOKOGAWA
dealer.
• If the following error message is displayed, immediately turn OFF the power. The
cooling fan has stopped. From the rear panel, check for and remove any foreign
object that may be obstructing the cooling fan. If the same error message appears
when you turn ON the power switch again, it is probably a malfunction. In this case,
contact your nearest YOKOGAWA dealer.
3.1 Precautions on the Use of the instrument
General Handling Precautions
• Never place any objects containing water on top of the instrument. This may cause
problems.
• Do not apply shock or vibration to the instrument. It can lead to malfunction. Take
extra care when dealing with the internal floppy disk drive and the internal hard disk
(option), because they are prone to shock and vibrations. In addition, applying shock
to the input terminal or the connected cable can cause electrical noise to enter the
instrument.
• Do not bring charged objects near the input/output terminals. This can damage the
instrument.
• When the instrument is not being used for an extended period of time, unplug the
power cord from the outlet.
• When carrying the instrument, be sure to first disconnect the power and measurement
cables. The instrument weighs 5 kg. To carry the instrument, use the handle as
shown in the figure below, and move it carefully.
• Be careful not to scratch the surface of the LCD with sharp objects. It can lead to
malfunction.
• When cleaning the case or the operation panel, first remove the power cord from the
outlet. Then, wipe with a dry, soft cloth. Do not use volatile chemicals since this might
cause discoloring and deformation.
3-2
IM 704310-01E
3.2
Installing the Instrument
WARNING
To avoid the possibility of fire, never use the instrument with the rear side facing
down, as the cooling vents will be obstructed. Placing the instrument with the rear
side down can cause a fire when the instrument malfunctions. If you must use the
instrument in this position, place a metal plate or a flame-resistive barrier (grade
UL94-1 or higher) beneath the instrument.
3
Before Starting Measurements
Installation condition
Install the instrument in a place that meets the following conditions.
Ambient temperature and humidity
Use the instrument in the following environment.
Ambient temperature: 5 to 40°C
For highly accurate measurements, the temperature should be 23±2°C.
Ambient humidity: 20 to 80%RH (no condensation)
For highly accurate measurements, the humidity should be 50±10%.
Note
Internal condensation may occur if the instrument is moved to another place where both the
ambient temperature and humidity are higher, or if the temperature changes rapidly. In this
case, let the instrument adjust to the new environment for at least one hour before using the
instrument.
10cm
Well-ventilated location
Vent holes are located on the top and bottom of the instrument. In addition, vent holes
for the cooling fan are located on the rear. To prevent internal overheating, allow enough
space around the instrument (see the figure below) and do not block the vent holes.
5cm
5cm
10cm
IM 704310-01E
3-3
3.2 Installing the Instrument
Do not install the instrument in the following places:
In direct sunlight or near heat sources.
Near high voltage equipment or power lines.
Where an excessive amount of soot, steam, dust, or corrosive gases are present.
Near strong magnetic field sources.
Where the level of mechanical vibration is high.
In an unstable place.
Installation position
12°
Place the instrument in a horizontal position or inclined position using the stand as
shown in the figure below. When using the stand, pull it forward until it is vertical to the
bottom side of the instrument and lock it. If you are placing the instrument on a slippery
surface, attach rubber feet (two pieces, included in the package) on the rear feet.
If you are not using the stand, return it to the original position while pressing it inward.
Rack Mounting
Rack mount kits are sold separately.
For mounting instructions, see the instruction manual that is supplied with the kit.
3-4
Name
Model
Description
Rack mount kit
Rack mount kit
Rack mount kit
Rack mount kit
751533-E6
751534-E6
751533-J6
751534-J6
For EIA single mount
For EIA dual mount
For JIS single mount
For JIS dual mount
IM 704310-01E
3.3
Connecting the Power Cord
Before connecting the power
Follow the warnings below to avoid electric shock and damage to the instrument.
3
WARNING
Connecting Procedure
1. Check that the power switch on the front panel is OFF.
2. Connect the plug of the accessory power cord to the power connector on the rear
panel of the instrument.
3. Plug the other end of the power cord into a power outlet that satisfies the conditions
below. The AC outlet must be a three-pole type that has a protective grounding
terminal.
IM 704310-01E
Item
Suffix-1
Suffix-5
Rated supply voltage
Permitted supply voltage range
Rated supply voltage frequency
Permitted supply voltage frequency range
Maximum power consumption
100 to 120 VAC
90 to 132 VAC
50/60 Hz
48 to 63 Hz
200 VA
200 to 240 VAC
180 to 264 VAC
50/60Hz
48 to 63 Hz
200 VA
3-5
Before Starting Measurements
• Connect the power cord only after confirming that the voltage of the power
supply matches the rated electric power voltage for the instrument.
• Connect the power cord after checking that the power switch of the instrument is
turned OFF.
• To prevent electric shock or fire, always use the power cord supplied by
YOKOGAWA.
• Always use protective grounding to prevent electric shock. Connect the power
cord of the instrument to a three-pole power outlet that has a protective
grounding terminal.
• Never use an extension cord that does not have protective grounding, otherwise
the protection function will be compromised.
3.4
Turning the Power Switch ON/OFF
Points to Check before Turning ON the Power
Is the instrument properly installed? See section 3.2 “Installing the Instrument.”
Is the power cord properly connected? See section 3.3 “Connecting the Power Cord.”
Location of the Power Switch and ON/OFF Operation
The power switch is located on the lower left corner of the front panel. To turn the power
ON, press the switch once. To turn the power OFF, press it again.
OFF
ON
Power Up Operation
When the power is turned ON, the instrument executes the following initialization checks.
The front operation panel is disabled during the check. When the initialization
completes, the display format screen (the screen that is displayed when the DISPLAY
key is pressed) appears.
• ROM Check
• SRAM Check
• DRAM Check
• SRAM Cal Check : Calibration data check
• Device Check: Internal hardware check
Note
If the instrument fails to power up as described, turn OFF the power switch and check the
following points.
• Is the power cord securely connected?
• Is the correct voltage coming to the power outlet? See section 3.3.
If the instrument still fails to power up after checking these points, the instrument probably
has malfunctioned. Contact your nearest YOKOGAWA dealer.
For Making Accurate Measurements
Under the installation conditions described in 3.2, turn ON the power switch and allow
the instrument to warm up for at least 30 minutes before starting measurements.
Shut Down Operation
When the power switch is turned OFF, the setup information is retained, but the
measured data are not. Make sure to save important data to the floppy disk before
turning OFF the power.
Note
The lithium battery that is used to retain information has a finite life. When the battery
approaches the end of its life, the instrument begins to operate abnormally such as indicating
an incorrect date and time or failing to save or load measured data. If you see these
symptoms, please perform the self-test according to “14.4 Performing a Self-test.” If the “Low
Battery” warning message is displayed, the lithium battery must be replaced immediately.
Because the batteries cannot be replaced by the user, contact your nearest YOKOGAWA
dealer.
3-6
IM 704310-01E
3.5
Connecting Cables and Probes
Location of the Input Terminals
The input terminals are located on the lower section of the front panel. Connect a cable
with a BNC connector or a probe.
CH A
3
CH B
POWER
1MΩ≤40Vpk
Input Specifications
Connector type
: BNC
Number of channels : 2
Input impedance
: 50 Ω/1 MΩ, 20 pF(Typical value*)
Maximum input voltage
• When the input impedance is 50 Ω : 5Vrms
• When the input impedance is 1 MΩ:
• 40 V (DC+ACpeak) when DC≤input frequency ≤100 kHz
• {3.5/f+5}V(DC+ACpeak) when 100 kHz≤ input frequency ≤200 MHz, where f is a
frequency in MHz.
Ground
: Connect to the case’s ground
* Typical values represent typical or average values. They are not strictly guaranteed.
CAUTION
Do not apply a voltage exceeding the maximum input voltage to the input terminals.
It can damage the input section.
Note
If you are using the probe for the first time, perform phase correction according to “3.6
Calibrating the Probe (Performing Phase Correction).” If the probe is not calibrated, the gain
will not be constant across different frequencies and proper measurements cannot be made.
Perform phase correction for each channel.
IM 704310-01E
3-7
Before Starting Measurements
50Ω≤5Vrms
3.6
Calibrating the Probe (Performing Phase
Correction)
Equipment Required
Prepare the following equipment
Calibration signal
Frequency
: 1 kHz
Voltage (amplitude)
: 1 Vp-p
Waveform type
: Square wave
Output impedance
: 1 MΩ
Recommended signal
: CAL signal of YOKOGAWA DL1500 Series Digital
Oscilloscope
Waveform monitor
Frequency characteristics : DC to 200 MHz(–3 dB attenuation point)
Input coupling
: DC
Input impedance
: Connect a 50 Ω terminator to the input terminal of the
waveform monitor.
Recommended device
: YOKOGAWA DL1500 Series Digital Oscilloscope +50 Ω
terminator (YOKOGAWA 700976)
The following section describes the connection and operating procedures when the
recommended signal and device are used.
Connecting Devices
CAUTION
• Do not apply a voltage exceeding the maximum input voltage to the input
terminals. It can damage the input section.
• Do not apply external voltage to the CAL signal output terminal of the DL1500
Series or to the monitor output terminal of this instrument. It can damage the
internal circuitry.
Check that this instrument and the DL1500 Series Oscilloscopes are turned OFF. Then,
connect them as shown below.
1. Use a BNC cable to connect the monitor output terminal on the rear panel of the
instrument (for CHA and CHB) and the input terminal of the DL1500 Series
oscilloscope.
2. Connect the BNC connector of the probe that you are calibrating to the input terminal
of the instrument.
3. Connect the other end of the probe to the CAL signal output terminal of the DL1500
Series oscilloscope, and the grounding wire to the functional grounding terminal.
MONITOR OUT terminal
BNC cable
DL1540
TA520
50Ω terminator
Input terminal
CAL signal output terminal
Phase correction hole
3-8
Function grounding terminal
IM 704310-01E
3.6 Calibrating the Probe (Performing Phase Correction)
Procedure
1.
2.
3.
Turn ON this instrument and the DL1500 Series oscilloscope.
Set the waveform acquisition conditions on the DL1500 Series oscilloscope so that
approximately two periods of the waveform are displayed clearly on the screen.
For the procedures, see the User’s Manual for the DL1500 Series.
Insert a screwdriver into the probe’s phase correction hole and turn the variable
capacitor so that the displayed waveform on the monitor becomes a proper square
wave (see explanation).
Necessity of probe phase correction
If the input capacitance of the probe is not within the appropriate range, the gain will not
be constant across different frequencies and proper waveforms cannot be input to the
instrument. However, the input capacitance of each probe is not necessarily the same.
Thus, a variable capacitor (trimmer) is attached to the probe for making adjustments.
This adjustment is called phase correction.
Perform phase correction on all probes that are to be used for the first time. Since the
appropriate input capacitance varies for different channels, phase correction must also
be performed when changing channels.
Calibration signal
Waveform type : Square wave
Frequency
: 1 kHz
Voltage
: 1 Vp-p
Waveform differences due to probe’s phase correction
Correct waveform
IM 704310-01E
Over-compensated (the gain
at the high frequency region
is too large)
Under-compensated (the
gain at the high frequency
region is too small)
3-9
Before Starting Measurements
Explanation
3
3.7
Setting the Date and Time
Procedure
1.
2.
Press the UTILITIY key to display the Utility menu.
Press the [Config] soft key to display the Configuration menu.
ESC
Setting the date
3.
Press the [Date] soft key to display the Date menu.
ESC
4.
5.
Press the [Year], [Month], and [Day] soft keys, and set the date with the rotary
knob.
Pressing the [Set] soft key updates the date.
ESC
Setting the time
3.
Press the [Time] soft key to display the Time menu.
ESC
4.
5.
Press the [Hour] and [Minute] soft keys, and set the time with the rotary knob.
Pressing the [Set] soft key updates the time.
ESC
3-10
IM 704310-01E
3.7 Setting the Date and Time
Explanation
Setting the date
Set the year, month, and day.
• Year
Selectable range: 1998 to 2047
• Month
Selectable range: 1 to 12
• Day
Selectable range: 1 to 31
3
Location of the date and time displays
The date and time are displayed at the upper right section of the screen.
IM 704310-01E
3-11
Before Starting Measurements
Setting the time
Set the hour and minute.
• Hour
Selectable range: 0 to 23
• Minute
Selectable range: 0 to 59
The seconds are displayed on the screen, but they cannot be set. The seconds will
be set to 00 s when the [Set] soft key is pressed.
Chapter 4 Basic Operations
4.1
Starting and Stopping the Acquisition of an
Input Signal
Procedure
Measurement indicator
SINGLE
START/STOP
When measuring continuously
• Starting the measurement
Press the START/STOP key to start the measurement. The measurement indicator
lights.
When measuring once
Press the SINGLE key. The measurement stops automatically after making one
measurement. The measurement indicator lights while the measurement is in progress
and turns off when the measurement completes.
Explanation
Continuous measurement
Once the measurement is started, it continues until the START/STOP key is pressed
again.
Single measurement
A single measurement is made every time the SINGLE key is pressed.
Note
•
•
•
IM 704310-01E
One set of measurements is called one block (see section 1.5). However, when using block
sampling, [1 block x the number of blocks] is one set of measurements.
If the START/STOP key is pressed in the middle of a measurement block and the
measurement is aborted, the measured data are acquired up to that point and the
measurement stops.
There are input indicators for CHA and CHB above the input terminals. If this indicator is not
blinking, the signal may not be entering the instrument. Check the trigger level setting (see
section 6.6), the cable connection, and the signal source. If the signal is properly entering the
input terminal of the instrument, but the CHA/CHB input indicator is not blinking, then there
may be a malfunction. Contact your nearest YOKOGAWA dealer to have it fixed.
4-1
Basic Operations
• Stopping the measurement
Press the START/STOP key to stop the measurement. The measurement indicator
turns off.
4
4.2
Setting Numerical Values and Strings
Procedure
Entering a numerical value using the numerical keys
If the mark is displayed on the soft key, you can use the numerical keys to set the
numerical value.
1.
Press the numerical keys to enter a numerical value.
2.
Pressing a unit key or ENTER key confirms the value.
This box appears when entering values with the numerical keys.
Canceling the numerical value set with the numerical keys
2.
Pressing the RESET key before the value is confirmed cancels the value that is
being set.
Setting a numerical value using the rotary knob
If the mark or the mark is displayed on the soft key, you can use the rotary knob to
set the value.
1.
Move the cursor to the desired digit using the arrow keys (
).
2.
Turn the rotary knob to select the desired value.
Setting a string (keyboard operation)
1.
Turn the rotary knob to highlight the desired character.
If a string is already entered, such as a file name, move the cursor to the desired
position using the arrow keys.
2.
Pressing the SELECT key, confirms the input character.
3.
Repeat steps 1 and 2 to enter all the characters.
4.
Moving the cursor to [ENT] on the keyboard and pressing the SELECT key
confirms the string and the keyboard disappears.
String input area
4-2
IM 704310-01E
4.2 Setting Numerical Values and Strings
Explanation
File name
Comment
Number of characters
Allowed characters
1 to 8 characters
0 to 25 characters
0 to 9, A to Z, – (minus), %, _, (,)
All characters (includes space)
Arrow keys
The operation varies depending on the method used to input the numerical values.
• When using the numerical keys
Operates as a backspace key.
• When using the rotary knob
Moves along the digits.
• When using the keyboard
Moves the cursor in the string input section.
Note
•
You can reset the numerical values to their factory default values. For details, see section
13.1. However, be careful, because all values are reset.
When using the numerical keys
• Even if you try to set numbers beyond the resolution of each item, they are cut off.
• If you try to set a value that exceeds the maximum value or a value that falls short of the
minimum value, they are set to the maximum and minimum values, respectively.
When using the keyboard
• You can use the keyboard along with the numerical keys. The numerical keys that can be
used are as follows.
0 to 9, ., ENTER, RESET key (keyboard’s CLR operation)
• Upper and lower case letters are not distinguished for file names. Comments distinguish
them. In addition, the following five file names cannot be used due to the limitation of MSDOS.
AUX, CON, PRN, NUL, CLOCK
• When using the GP-IB interface commands to enter a file name, the following symbols that do
not exist on the keyboard of this instrument can be used.
!#$‘-^@~{}
IM 704310-01E
4-3
4
Basic Operations
Setting a numerical value using the numerical keys
If you press another key before pressing a unit key or the ENTER key, the value that you
were setting is not confirmed and it is set back to the value the existed before.
You can cancel a value by pressing the RESET key before the value is confirmed.
Setting a numerical value using the rotary knob
Only numerical values can be set with the rotary knob. You cannot set the unit with the
rotary knob as you can with the numerical keys.
If the value of the digit at the cursor position is increased using the rotary knob, the value
is carried over to the next digit. If the value is decreased, the opposite occurs.
Setting the string
For file names and comments, the keyboard that pops up on the screen is used to set
the string.
• Keys other than the character keys on the keyboard
DEL
: Deletes the character immediately before the cursor.
INS
: Switches the insert/overwrite mode. During the insert mode, the INSERT
indicator on the keyboard lights.
CLR : Clears all characters that are displayed.
SPACE : Enters one space.
ENT : Confirms the string that is displayed.
CAPS : Switches the case of the input character.
• The number and types of characters that can be used on file names and
comments.
4.3
The Way to Look at the Soft Key Menu/Using
the Rotary Knob and Select Key
The way to look at the soft key menu
: Pressing this soft key causes a menu to pop up.
: You can set the value using both the numerical keys and the rotary knob.
: You can set the value or select the setting item using the rotary knob.
Set using the numerical keys
Set using the rotary knob
Pop up a menu
Using the rotary knob and SELECT key
In a setting screen as shown below, values are set using the rotary knob and SELECT
key.
• When selecting an item
Move the cursor to the desired item using the rotary knob and press the SELECT key
to select the item.
1. Use the rotary knob
to move the cursor to
the desired item.
2. Select the item using
the SELECT key.
• When setting a numerical value
Move the cursor to the desired item using the rotary knob, and press the SELECT key
to display the numerical value input area, and enter the value using the numerical
keys.
Press the SELECT key to
display the numerical input
area, then enter the value
using numerical keys.
• When checking a box
Move the cursor to the desired item using the rotary knob, press the SELECT key to
check or uncheck the box.
ON
OFF
Using the ESC key
Press this key to exit the current menu (go back one menu).
Using the RESET key
Use this key to cancel the numerical value that was entered using the numerical keys.
4-4
IM 704310-01E
Chapter 5 Setting the Sampling Mode and Measurement Functions
5.1
Selecting the Sampling Mode
≡For a functional description, see 1.3.≡
Procedure
1.
Press the MODE key to display the MODE menu.
When selecting the time stamp mode
2.
Press the [TimeStamp] soft key.
When selecting the hardware histogram mode
2.
Press the [HardHist] soft key.
5
Explanation
Selecting the sampling mode
Select from the following choices.
• Time stamp mode
: Acquires the measured values and their time stamps to
the acquisition memory.
• Hardware histogram mode : Acquires the measured values and the frequency of
occurrence of those values to the acquisition memory.
Note
If you change the sampling mode or the measurement function, the data acquired up to that
point can no longer be displayed or analyzed. Acquire the data again, or load the data from a
file.
IM 704310-01E
5-1
Setting the Sampling Mode and Measurement Functions
ESC
5.2
Setting the Period Measurement
≡For a functional description, see 1.4.≡
Procedure
1.
2.
Press the FUNCTION key to display the Function menu.
Press the [Function] soft key.
ESC
Selecting period measurement
3.
Press the [Period] soft key.
ESC
Selecting the channel to be measured
4.
Press the [Channel] soft key and select [ChA] or [ChB].
Selecting the slope
5.
Press the [Slope] soft key and select [
↑] or [ ↓ ].
ESC
Explanation
Measurement range
The measurement range varies depending on the sampling mode.
• For time stamp mode
: 8 ns to 20 ms
• For hardware histogram mode : 8 ns to 3.2 µ s
Selecting the channel to be measured
Select either CHA or CHB.
Selecting the slope
Select from the following choices.
• ↑: Measures from a rising edge to the next rising edge of the input signal.
• ↓ : Measures from a falling edge to the next falling edge of the input signal.
Note
If you change the sampling mode or the measurement function, the data acquired up to that
point can no longer be displayed or analyzed. Acquire the data again, or load the data from a
file.
5-2
IM 704310-01E
5.3
Setting the Time Interval Measurement
≡For a functional description, see 1.4.≡
Procedure
1.
2.
Press the FUNCTION key to display the Function menu.
Press the [Function] soft key.
5
Selecting time interval measurement
3.
Press the [TI] soft key.
ESC
Selecting the slope
4.
Turn the rotary knob to select the slope.
Explanation
Measurement range
The measurement range varies depending on the sampling mode.
• For time stamp mode
: 0 ns to 20 ms
• For hardware histogram mode : 0 ns to 3.2 µs
Selecting the slope
• A B : Measures the interval from a rising edge of CHA to the first rising edge of
CHB.
• A B : Measures the interval from a rising edge of CHA to the first falling edge of
CHB.
• A B : Measures the interval from a falling edge of CHA to the first rising edge of
CHB.
• A B : Measures the interval from a falling edge of CHA to the first falling edge of
CHB.
• A B : Measures the interval from a rising or falling edge of CHA to the first rising
edge of CHB. A B and A B are measured alternately. In addition, the
measured data corresponding to A B or A B , and A B can be
separated for the purpose of displaying histograms and calculating statistics.
• A B :Measures the interval from a rising or falling edge of CHA to the first falling
edge of CHB. A B and A B are measured alternately. In addition the
measured data corresponding to A B or A B and A B can be
separated for the purpose of displaying histograms and calculating statistics.
For the procedures related to displaying histograms for the separated data, see sections
7.1 and 8.1. For the procedures related to calculating statistics, see sections 7.6 and
8.7.
IM 704310-01E
5-3
Setting the Sampling Mode and Measurement Functions
ESC
5.3 Setting the Time Interval Measurement
Example of separating the data and displaying the histogram
Select either one
Displays A B
Displays A B
only
Note
•
Continuous measurements are possible if the period of CHA is 23 ns or more and the time
between the slope of CHB and the slope of CHA is 13 ns or more.
A B Example
•
5-4
Continuously measures t2 when the
period of CHA is 23 ns or more.
Measurement Measurement
t1
t2
Measures t3 and not t2 when the
period of CHA is less than 23 ns.
Measurement
Measurement
t2
t1
t3
CHA
CHA
CHB
CHB
13 ns or more
13 ns or more
23 ns or more
23 ns
or more
If you change the sampling mode or the measurement function, the data acquired up to that
point can no longer be displayed or analyzed. Acquire the data again, or load the data from
the file.
IM 704310-01E
5.4
Setting the Pulse Width Measurement
≡For a functional description, see 1.4.≡
Procedure
1.
2.
Press the FUNCTION key to display the Function menu.
Press the [Function] soft key.
5
Setting the Sampling Mode and Measurement Functions
ESC
Selecting pulse width measurement
3.
Press the [Pulse Width] soft key.
ESC
Selecting the channel to be measured
4.
Press the [Channel] soft key and select [ChA] or [ChB].
ESC
Selecting the polarity
5.
Turn the rotary knob to select the polarity.
IM 704310-01E
5-5
5.4 Setting the Pulse Width Measurement
Explanation
Measurement range
The measurement range varies depending on the sampling mode.
• For time stamp mode
: 8 ns to 20 ms
• For hardware histogram mode : 8 ns to 3.2 µ s
Selecting the channel to be measured
Select either CHA or CHB.
Selecting the polarity
Select from the following choices.
•
: Measures the positive side (from a rising edge to the next falling edge).
: Measures the negative side (from a falling edge to the next rising edge).
•
•
: Measures the positive and negative sides alternately. In addition the measured
data corresponding to
or
and
can be separated for the purpose
of displaying histograms. For details see sections 7.1 and 8.1.
Example of separating the data and displaying the histogram
Select either one
Displays
Displays
only
Note
If you change the sampling mode or the measurement function, the data acquired up to that
point can no longer be displayed or analyzed. Acquire the data again, or load the data from a
file.
5-6
IM 704310-01E
Chapter 6 Setting the Acquisition Conditions of the Measurement Input Signal
6.1
Setting the Gate
≡For a functional description, see 1.5.≡
Procedure
1.
2.
Press the SAMPLE key to display the Sample menu.
Press the [GateMode] soft key to display the Gate Mode menu.
6
Setting the Acquisition Conditions of the Measurement Input Signal
ESC
Selecting the gate mode
3.
Press the soft key corresponding to the desired gate mode.
ESC
When event gate (Event) is selected
4.
Use the rotary knob or the numerical keys to set the number of events (Event
Size).
ESC
When time gate (Time) is selected
4.
Use the rotary knob or the numerical keys to set the gate time.
ESC
When external gate (External) is selected
4.
Press the [Polarity] soft key to select the polarity.
ESC
IM 704310-01E
6-1
6.1 Setting the Gate
Explanation
Selecting the gate mode
Select from the following choices.
• Event
: Set the size (range) of a measurement block by specifying the number of
events.
• Time : Set the size (range) of a measurement block by specifying a period of time.
• External : Set the size (range) of a measurement block using the external gate.
Since the external gate input terminal is shared with the external arming
input terminal, selecting external gate will prevent the use of external
arming.
When [External] is selected
Apply a signal to the terminal marked [EXT ARM/EXT GATE] on the front panel. (The
terminal is shared with external arming.)
• Input impedance
: 1 MΩ(Typical value*)
• Input coupling
: DC
• Gate level
: Select TTL (1.4 V), TTL/10 (0.14 V), or 0 V
• Maximum input voltage
: 40 V (DC+ACpeak)
• Minimum input pulse width : 30 ns
• Setup time
: 50 ns (For the gate to become effective, the gate signal
must arrive at least 50 ns earlier than the measurement
signal.)
* Typical values represent typical or average values. They are not strictly guaranteed.
External gate (shared with external arming) input circuit
+5 V
EXT ARM/EXT GATE
500 kΩ
(External gate
input terminal)
Buffer amplifier
500 kΩ
–5 V
CAUTION
Applying a voltage exceeding the maximum input voltage to the external gate input
terminals can damage the input section.
Selectable range for the number of events
The number varies depending on the sampling mode. This value can only be set when
the gate mode is set to event gate.
• During the time stamp mode
: 1 to 512,000
• During the hardware histogram mode : 1 to 109
Note
•
•
6-2
After arming, if the maximum sampling time elapses before the specified number of events is
reached, then the measurement block stops at that point.
The gate level is set using the INPUT key.
IM 704310-01E
6.1 Setting the Gate
Selectable range for the gate time
The selectable range is as follows. This value can only be set when the gate mode is set
to time gate.
1 µ s to 10 s (in 100 ns steps)
Note
If the number of events (samples) reaches the maximum number of events for the appropriate
sampling mode before the specified gate time elapses, then the measurement block stops at
that point.
Selecting the polarity
Select from the following choices. It is set only when the gate mode is set to external
gate.
•
: Measures while a positive signal is being applied to the external gate input
terminal (EXT ARM/EXT GATE)
•
: Measures while a negative signal is being applied to the external gate input
terminal (EXT ARM/EXT GATE)
6
Note
•
IM 704310-01E
Setting the Acquisition Conditions of the Measurement Input Signal
•
Even if the external gate is continuously open for a long period of time, the measurement
block ends when the number of events reaches the maximum sampling size for the
appropriate sampling mode or when the maximum sampling time elapses.
When external gate is selected, block sampling is turned OFF and arming is set to Auto.
6-3
6.2
Setting the Sampling Interval
≡For a functional description, see 1.5.≡
Procedure
1.
Press the SAMPLE key to display the Sample menu.
Selecting the sampling interval
2.
Press the [Interval] soft key.
Use the rotary knob or the numerical keys to set the sampling interval.
Sampling interval
ESC
Explanation
The sampling interval is set only during the time stamp mode.
Setting the sampling interval
Select from the following choices. During the hardware histogram mode, it is fixed to 0
µ s and no menu is displayed.
0 µ s, 1 µ s to 1 s (in 1 µ s steps)
The sampling interval when 0 µ s is selected is approximately 23 ns.
Note
If the sampling interval is changed, the time resolution of the time stamp also changes as
follows:
6-4
Sampling Interval
Time Resolution of the Time Stamp
0 µs
1 µs to 1 s
100 ns
1 µs
IM 704310-01E
6.3
Performing Block Sampling
≡For a functional description, see 1.5.≡
Procedure
1.
2.
Press the SAMPLE key to display the Sample menu.
Press the [Block] soft key to display the Block Sample menu.
6
Setting the Acquisition Conditions of the Measurement Input Signal
ESC
Performing block sampling
3.
Press the [Mode] soft key and select [ON].
Set the number of blocks
4.
Press the [BlockSize] soft key.
Use the rotary knob or the numerical keys to set the number of measurement
blocks.
Select the pause mode
5.
Press the [RestMode] soft key.
Turn the rotary knob to select the pause mode from [OFF], [Time], and [Event].
ESC
• When the pause mode is set to Time
6.
Press the [RestTime] soft key.
Use the rotary knob or the numerical keys to set the pause time.
ESC
• When the pause mode is set to Event
6.
Press the [RestEvent] soft key.
Use the rotary knob or the numerical keys to set the number of events to pause.
ESC
IM 704310-01E
6-5
6.3 Performing Block Sampling
Explanation
The display format and analysis method of the block sampled data differ for the time
stamp mode and the hardware histogram mode.
Time stamp mode
The instrument retains time stamps and measured values for each measurement block.
You can display the time variation display, list display, and calculate statistics on each
measurement block.
Hardware histogram mode
The instrument retains the measured values and the frequency of occurrence of those
values by summing the data of all measurement blocks. You can not use the list display
or calculate statistics on each measurement block.
Setting the number of blocks
• Time stamp mode
: 1 to 100
• Hardware histogram mode : 1 to 1000
Setting the pause time
Select from the following choices.
OFF
: No pause time
RestTime : Set the pause time in units of time
1.0 µ s to 1.0000000 s (in 100 ns steps)
RestEvent : Set the pause time by specifying the number of events
1 to 1000000
Note
•
•
6-6
Block sampling is not possible when external gate is selected or when the inter-symbolic
interference analysis function is being used.
When the pause time is set using the number of events and the pause time is less than 500
ns, it is set to 500 ns.
IM 704310-01E
6.4
Setting the Arming Source, Slope, and Delay
≡For a functional description, see 1.5.≡
Procedure
1.
Press the SAMPLE key to display the Sample menu.
Displaying the arming menu
2.
Press the [Arming] soft key to display the Arming menu. When external gate is
selected the arming menu is not displayed (the ARMING soft key is not displayed).
6
Selecting the arming source
3.
Press the [Source] soft key and select [Auto] or [Ext].
If you select Ext (external arming) proceed to the following steps. If you select Auto
(auto arming), then the following menus will not be displayed.
Selecting the slope (for external arming only)
4.
Select the [Slope] soft key to select [↑] or [↓].
ESC
IM 704310-01E
6-7
Setting the Acquisition Conditions of the Measurement Input Signal
ESC
6.4 Setting the Arming Source, Slope, and Delay
Selecting the type of arming delay (for external arming only)
5.
Press the [DelayMode] soft key.
Turn the rotary knob to select [OFF], [Time], or [Event].
• Set the delay time (when the type of arming delay is set to Time in step 5)
6.
Press the [D.Time] soft key.
Use the rotary knob or the numerical keys to set the delay time.
ESC
• Set the number of events (when the type of arming delay is set to Event in step 5)
6.
Press the [D.Event] soft key.
Use the rotary knob or the numerical keys to set the number of events.
ESC
Selecting the arming level
7.
Press the INPUT key to display the Input menu.
8.
Press the [Setting] soft key to display the Input Setting menu.
ESC
9.
Press the [Arm/Gate] soft key.
ESC
10. Turn the rotary knob to select [TTL], [TTL/10], or [0V].
6-8
IM 704310-01E
6.4 Setting the Arming Source, Slope, and Delay
Explanation
Selecting the arming source
Select from the following choices.
• Auto : Arming is activated automatically after the measurement is started.
• Ext : Arming is activated by an external arming input signal after the measurement is
started.
When [Ext] is selected
Apply a signal to the terminal (this terminal is shared with the external gate) marked
[EXT ARM/GATE IN] on the front panel.
• Input impedance
: 1 MΩ (Typical value*)
• Input coupling
: DC
• Arming level
: Select TTL (1.4 V), TTL/10 (0.14 V), or 0 V
• Maximum input voltage
: 40 V (DC+ACpeak)
• Minimum input pulse width : 30 ns
• Setup time
: 50 ns (For the arming to become effective, the arming
signal must arrive at least 50 ns earlier than the
measurement signal.)
* Typical values represent typical or average values. They are not strictly guaranteed.
6
Setting the Acquisition Conditions of the Measurement Input Signal
External arming (shared with external gate) input circuit
+5 V
EXT ARM/EXT GATE
500 kΩ
(External arming
input terminal)
Buffer amplifier
500 kΩ
–5 V
CAUTION
Applying a voltage exceeding the maximum input voltage to the external arming
input terminals can damage the input section.
Selecting the slope
Select from the following choices. Select only during external arming.
• ↑: Arming occurs on the rising edge of the signal entering the external arming input
terminal.
• ↓: Arming occurs on the falling edge of the signal entering the external arming input
terminal.
IM 704310-01E
6-9
6.4 Setting the Arming Source, Slope, and Delay
Selecting the type of arming delay
Select from the following choices. Select only during external arming.
• OFF : You cannot select the arming delay. Arming delay is not executed.
• Time : The measurement starts after being delaying for the specified time.
• Event : The measurement starts after being delaying for the specified number of
events.
Setting the delay time
Set the time within the following range. Set only when using the time delay.
1.0 µ s to 1.0000000s (in 100 ns steps)
Setting the number of events
Set the number of events within the following range. Set only when using the event
delay.
1 to 1000000
Note
The delay event corresponds to the number of events of the input signal of the channel being
measured. However, in time interval measurements, it is the number of events of the input
signal of CHA.
Selecting the arming level
Select from the following choices.
TTL (1.4 V), TTL/10 (0.14 V), and 0 V
6-10
IM 704310-01E
6.5
Setting the Inhibit Function
≡For a functional description, see 1.5.≡
Procedure
1.
Press the SAMPLE key to display the Sample menu.
Selecting the polarity
2.
Press the [Inhibit] soft key to select the polarity.
6
Setting the Acquisition Conditions of the Measurement Input Signal
ESC
Selecting the inhibit level
3.
Press the INPUT key to display the Input menu.
4.
Press the [Setting] soft key to display the Input Setting menu.
ESC
5.
Press the [Inhibit] soft key.
ESC
6.
IM 704310-01E
Turn the rotary knob to select [TTL], [TTL/10], or [0V].
6-11
6.5 Setting the Inhibit Function
Explanation
Selecting the polarity
Select from the following choices. The inhibit input is ineffective if it is turned [OFF].
•
: Inhibits measurement while a positive signal is being applied to the inhibit input
terminal.
•
: Inhibits measurement while a negative signal is being applied to the inhibit input
terminal.
Note
The inhibit signal is valid only within the maximum sampling time after arming activation.
Signals outside this range are invalid.
When applying the inhibit signal
Apply a signal to the terminal marked [INHIBIT] on the front panel.
• Input impedance
: 1 MΩ(Typical value*)
• Input coupling
: DC
• Inhibit level
: Select TTL (1.4 V), TTL/10 (0.14 V), or 0 V
• Maximum input voltage
: 40 V(DC+ACpeak)
• Minimum input pulse width : 30 ns
• Setup time
: 50 ns (For the inhibit function to become effective, the
inhibit signal must arrive at least 50 ns earlier than the
measurement signal.)
* Typical values represent typical or average values. They are not strictly guaranteed.
Inhibit input circuit
+5V
INHIBIT
500 kΩ
(Inhibit input
terminal)
Buffer amplifier
500 kΩ
–5V
CAUTION
Applying a voltage exceeding the maximum input voltage to the inhibit input
terminals can damage the input section.
Selecting the inhibit level
Select from the following choices.
TTL (1.4 V), TTL/10 (0.14 V), and 0 V
6-12
IM 704310-01E
6.6
Setting the Input Coupling, Input Impedance,
and Trigger
≡For a functional description, see 1.5.≡
Procedure
1.
Press the INPUT key to display the Input menu.
Selecting the channel to set
2.
Press the [Setting] soft key to display the Input Setting menu.
6
Setting the Acquisition Conditions of the Measurement Input Signal
ESC
3.
Press the [ChA] or [ChB] soft key.
ESC
Selecting the input impedance
3.
Press the [Impedance] soft key to select [50
Ω ] or [1 M Ω ].
Selecting the input coupling
4.
Press the [Coupling] soft key to select [AC] or [DC].
Selecting the trigger mode
5.
Press the [Trigger] soft key.
Turn the rotary knob to select [Manual], [SingleAuto], or [RepeatAuto].
Setting the trigger level
6.
Press the [Level] soft key.
Use the rotary knob or the numerical keys to set the trigger level.
ESC
IM 704310-01E
6-13
6.6 Setting the Input Coupling, Input Impedance, and Trigger
Explanation
Selecting the channel to set
The input conditions of CHA and CHB are selected individually. In addition, if you
selected arming/gate or inhibit input, you can set the level.
Selecting the input impedance
Select either 50 Ω or 1 M Ω . If the input coupling is set to AC, the frequency
characteristics vary depending on the input impedance. For details, see section 15.1.
Selecting the input coupling
Select either AC or DC. The frequency characteristics vary depending on the input
coupling. For details, see section 15.1.
Selecting the trigger mode
Select from the following choices.
• Manual
: Trigger using the specified trigger level (voltage).
• SingleAuto : Determines the trigger level from the value (%) specified on the first
measurement after the measurement is started.
• RepeatAuto : Determines the trigger level from the value (%) specified for each
measurement.
Setting the trigger level
Selectable range (when the trigger mode is Manual)
: –5 V to +5 V (in 1
mV steps)
Selectable range (when the trigger mode is SingleAuto/RepeatAuto) : 0 to 100% (in 1%
steps)
However, if you selected Arming/Gate or Inhibit for the channel, you will select from TTL
(1.4 V), TTL/10 (0.14 V), and 0 V.
Note
The input impedance of EXT ARM/EXT GATE and INHIBIT is fixed to 1 MΩ .
6-14
IM 704310-01E
6.7
Inputting/Outputting the Reference Signal
≡For a functional description, see 1.5.≡
Procedure
Selecting the reference clock
1.
Press the SAMPLE key to display the Sample menu.
2.
Press the [Ref.Clock] soft key to select [Int] or [Ext].
6
Setting the Acquisition Conditions of the Measurement Input Signal
ESC
Explanation
Connecting a BNC cable
Connect a BNC cable to the reference input/output terminal on the rear panel of the
instrument.
IN
REFERENCE
OUT
(Reference input
terminal)
10 MHz 1 Vp-p
Reference input circuit
100 pF 1.5 kΩ
(Reference output
terminal)
10 MHz 1V p-p
Reference output circuit
50 Ω
470 pF
22 kΩ
Inputting an external reference clock signal
Apply an external reference clock signal to the reference input terminal.
• Input frequency range : 10 MHz ±10 Hz
• Input impedance
: 1 kΩ or more
• Input coupling
: AC
• Input level
: 1 Vp-p or more
• Maximum input voltage : ±10 V
IM 704310-01E
6-15
6.7 Inputting/Outputting the Reference Signal
CAUTION
Applying a voltage exceeding the maximum input voltage to the reference input
terminal can damage the instrument.
Outputting the reference clock signal
Outputs the reference clock signal from the reference output terminal. The selected
reference clock described in the earlier section “Selecting the reference” is constantly
output from this terminal.
• Output frequency
: 10 MHz(Typical value*)
• Output impedance : 50Ω(Typical value*)
• Output coupling
: AC
• Output level
: 1 Vp-p or greater, except this level applies to the case when the
input impedance of the receiving side is 50 Ω .
* Typical values represent typical or average values. They are not strictly guaranteed.
CAUTION
Do not apply an external voltage to the reference output terminal. It can damage
the instrument.
Selecting the reference
Select from the following choices.
• Int : Operate using the internal reference clock signal.
• Ext : Operate using the external reference clock signal.
6-16
IM 704310-01E
Chapter 7 Displaying the Measured/Calculated Results in the Time Stamp Mode
7.1
Displaying the Histogram
≡For a functional description, see 1.7.≡
Procedure
1.
Press the DISPLAY key to display the Display menu.
Displaying a histogram
2.
Press the [Item] soft key to display the Display Item menu.
7
ESC
Displaying the Measured/Calculated Results in the Time Stamp Mode
3.
Press the [Histogram] soft key.
ESC
Set the display size of the histogram
4.
Press the [Style] soft key to display the Display Style menu.
ESC
5.
Press the [Graph Size] soft key to select [Half] or [Full].
Set the display format
5.
Press the [Statistics], [Marker], or [Overlap] soft key to select [ON] or [OFF] for
each.
ESC
IM 704310-01E
7-1
7.1 Displaying the Histogram
Explanation
Display size of the histogram (Graph Size)
Select from the following two choices.
Half : Displays the histogram on the left half of the screen. The right half displays the
statistics.
Full : Displays the histogram on the entire screen.
Setting the display format (Style)
In addition to the histogram, you can select whether or not to display the following items.
• Statistics : Displays the statistics in the main window. The statistical parameters to be
displayed are set in a dialog box that appears when the [Calc/Stat] soft
key is pressed. For details, see section 7.6.
• Marker : Displays the read-out value of the X marker. The marker is set using a
menu that is displayed when the MARKER key is pressed.
• Overlap
The ON/OFF setting becomes effective only for the following cases:
• Time interval measurement with the slope set to A B or A B .
• Pulse width measurement with the polarity set to
.
ON : Superimposes the histogram of the slope/polarity that is selected with the
Calculation Slope/Calculation Polarity item (displayed in orange) and the
histogram of both slopes/polarities (displayed in blue).
OFF : Displays the histogram of the slope/polarity that is selected with the Calculation
Slope/Calculation Polarity item (displayed in orange) and the histogram of both
slopes/polarities (displayed in blue) in separate windows.
The following combinations of slopes and polarities can be selected.
• Time interval measurement : A B , A B , A B
A B ,A B ,A B
• Pulse width measurement :
,
,
For the procedures related to setting the Calculation Slope/Calculation Polarity item in
the Calculation/Statistics Setting menu, see section 7.6.
7-2
IM 704310-01E
7.2
Displaying the List
≡For a functional description, see 1.7.≡
Procedure
1.
Press the DISPLAY key to display the Display menu.
Displaying the list
2.
Press the [Item] soft key to display the Display Item menu.
Marks the position
corresponding to
the number that is
highlighted in the
list.
7
ESC
Displaying the Measured/Calculated Results in the Time Stamp Mode
3.
Press the [List] soft key.
ESC
Setting the data to be displayed
4.
Use the rotary knob or the numerical keys to set the number of the desired data.
The specified data is highlighted and the position of the specified number is
marked on the time variation display.
Displaying the top data
4.
Press the [Top] soft key. The top data (first data) are highlighted.
Displaying the bottom data
4.
Press the [Bottom] soft key. The bottom data (last data) are highlighted.
ESC
Specifying the block number (only for block sampling)
4.
Press the [Block Num] soft key.
Turn the rotary knob to set the block number that you wish to list.
ESC
IM 704310-01E
7-3
7.2 Displaying the List
Explanation
Displaying the list
Displays twenty data points at a time. Taking the first measurement data to be number
one, the time stamps and measured data are displayed.
The list is displayed on the left side of the screen and the time variation is displayed
vertically on the right side.
The dotted line and mark on the time variation screen indicate the data that are
highlighted on the list.
Setting the data to list
You can set the data to be displayed.
The following methods are available to select the data.
• Specify the data number and display
• Display top data (top of the list) or bottom data (bottom of the list)
Specifying the block number
Block number is specified only when block sampling is used. The data of the specified
block number are listed. The first data of each block become the top data of the list.
Note
If the
7-4
or
mark is displayed on the time variation screen, redo the scaling.
IM 704310-01E
7.3
Displaying the Time Variation
≡For a functional description, see 1.7.≡
Procedure
1.
Press the DISPLAY key to display the Display menu.
Displaying the time variation
2.
Press the [Item] soft key to display the Display Item menu.
7
ESC
Displaying the Measured/Calculated Results in the Time Stamp Mode
3.
Press the [TimeVar.] soft key.
ESC
Set the display size of the time variation
4.
Press the [Style] soft key to display the Display Style menu.
5.
Press the [Graph Size] soft key to select [Half] or [Full].
Selecting the display format
5.
Press the [Panorama], [Statistics], or [Marker] soft key to select [ON] or [OFF] for
each.
ESC
Setting the graticule
2.
Press the [Graph Param] soft key to display the Graph Parameter menu.
Press the [Grid], [Connect], or [Dot Type] soft key to set them appropriately.
ESC
Specifying the block number (only for block sampling in which the statistical
calculation area is set to [Block])
2.
Press the [Block Num] soft key.
Turn the rotary knob to set the number of the block for which you wish to display
the statistics.
IM 704310-01E
7-5
7.3 Displaying the Time Variation
Explanation
The size of the time variation display (Graph Size)
Select from the following two choices.
Half : Displays the time variation on the left half of the screen. The right half displays the
statistics.
Full : Displays the time variation on the entire screen.
Selecting the display format (Style)
In addition to the time variation, you can display the following items.
• Panorama : Displays a panorama display. For setting the panorama display, see
section 7.5.
• Statistics : Displays statistics. The statistical parameters to be displayed are set in a
dialog box that appears when the [Calc/Stat] soft key is pressed. For
details, see section 7.6.
• Marker
: Displays the read-out values of the X and Y markers. The markers are
set using a menu that is displayed when the MARKER key is pressed.
Setting the graph (Graph Parameter)
The following items can be set.
• Grid
: Turn ON/OFF the grid.
• Connect : Set whether to linearly interpolate between data points.
• Dot Type : Set the dot to [Pixel] or [Mark].
Connect OFF
Connect ON
Dot Type:Pixel
Dot Type:Mark
Specifying the block number
The block number can only be specified during block sampling when the statistical
calculation area is set to [Block]. The statistics of the specified block are displayed.
Displays the statistics of the
specified block
Specify the block to display the
statistics
7-6
IM 704310-01E
7.4
Displaying the Statistics
≡For a functional description, see 1.7.≡
Procedure
1.
Press the DISPLAY key to display the Display menu.
Displaying the statistics
2.
Press the [Item] soft key to display the Display Item menu.
ESC
Press the [Statistics] soft key.
Displaying the Measured/Calculated Results in the Time Stamp Mode
3.
7
ESC
Selecting the items for which to calculate the statistics
4.
Press the [Stat Item] soft key to select [Hist] or [T.V.].
ESC
Setting the display format (only during block sampling when the statistical
calculation area is set to [Block] and [T.V] was selected in step 4)
5.
Press the [Style] soft key to select [All] or [Block].
• When [All] is selected
6.
Press the [
] soft key.
Turn the rotary knob to scroll through the block numbers.
7.
Press the [
] soft key.
Turn the rotary knob to scroll through the statistical parameters.
ESC
• When [Block] is selected
6.
Press the [Block Num] soft key.
Turn the rotary knob to specify the number of the block you wish to display.
ESC
IM 704310-01E
7-7
7.4 Displaying the Statistics
Explanation
Selecting the items for which to calculate the statistics (Stat Item)
Select from the following choices.
• Hist : Set the range over which to calculate the statistics with the measured values
and frequencies.
• T.V. : Set the range over which to calculate the statistics with the time stamps and
measured values.
Setting the display format (Style)
For data that were block sampled, if the statistical calculation area is [Block] and the item
for which to calculate the statistics is set to time variation (T.V.), then the display format
of the statistics can be selected from the following choices.
• All
: Lists the statistics of all blocks. Up to four statistical parameters and up to 20
blocks can be displayed at once. Rotary knobs can be used on the [
] and
[
] keys to scroll through the blocks and statistical parameters.
• Block : Displays the statistics for each block. All statistical parameters can be
displayed at once.
Statistical parameters that are calculated
The following statistical parameters are calculated.
The items inside parentheses are displayed when [T.V.] is selected.
• Average (T.Average)
• E.L.Error (None)
• Maximum (T.Maximum)
• MELE (None)
• Minimum (T.Minimum)
• Median (None)
• Peak-Peak (T.Peak-Peak)
• Mode (None)
• σ (T.σ)
• – (T.(P-P/Average))
• σ/Average (T.(σ/Average))
• – (T.RF)
• σ/T (None)
• Number (T.Num)
Asterisks (*) are displayed for the statistics of the parameters that are not turned ON in
the dialog box that appears by pressing the [Calc/Stat] soft key (see section 7.5)
When the statistic item is [T.V.].
When the statistic item is [Hist].
When the statistic item and format When the statistic item and format are [T.V.] and
are [T.V.] and [Block], respectively. [All], respectively.
Note
[-----] is displayed when the measured data are invalid, or measured the data do not exist.
7-8
IM 704310-01E
7.5
Displaying the Panorama Display
≡For a functional description, see 1.7.≡
Procedure
1.
2.
Press the DISPLAY key to display the Display menu.
Press the [Item] soft key to display the Display Item menu.
ESC
3.
Press the [TimeVar.] soft key.
ESC
Displaying the panorama
4.
Press the [Style] soft key to display the Display Style menu and press the
[Panorama] soft key to select [ON].
7
ESC
Displaying the Measured/Calculated Results in the Time Stamp Mode
Setting the range to display in the panorama display
5.
Press the SCALE key to display the Scale menu.
6.
Press the [Panorama] soft key to display the Panorama menu.
Zoom box
ESC
IM 704310-01E
7-9
7.5 Displaying the Panorama Display
7.
Press the [Area] soft key.
Turn the rotary knob to set the range to display in the panorama display.
Setting the range to zoom display
8.
Press the [ZoomSpan] soft key.
Turn the rotary knob to set the range of the zoom display (size of the zoom box).
Moving the zoom position
9.
Press the [Position] soft key.
Turn the rotary knob to move the position of the zoom box.
Setting the speed of movement for the zoom box
10. Pressing the [Movement] soft key and selecting decreases the speed of
movement of the zoom box. Selecting
increases the speed of movement.
Moving the zoom box to the left end
11. Pressing the [Adjust] soft key moves the zoom box to the left end of the panorama
window.
ESC
Explanation
Panorama display
The data can be displayed in the panorama window at the top section of the time
variation display.
In the panorama display, a maximum of 6000 s of time variation can be listed and the
waveform in the zoom box can be displayed zoomed in the main window. The panorama
function is used when you wish to look at the entire set of acquired data.
Setting the panorama display area
You can set the range of the panorama display. The following ranges are available.
0-60/120/300/600 µs, 1.2/3/6/12/30/60/120/300/600 ms, 1.2/3/6/12/30/60/120/300/600/
1200/3000/6000 s
Setting the range of the zoom display
You can set the range of the zoom display (size of the zoom box). The following ranges
are available.
6/12/30/60/120/300/600 µs, 1.2/3/6/12/30/60/120/300/600 ms, 1.2/3/6/12/30/60/120/300/
600/1200/3000/6000 s
Moving the zoom position
You can set which section (zoom position) of the data in the panorama display on which
to zoom.
7-10
IM 704310-01E
7.5 Displaying the Panorama Display
Adjustment function
This function is used to move the zoom box to the left end of the panorama window,
which is useful such as when the zoom box is outside of the panorama window.
When the zoom box is outside the panorama window, the following marker is displayed
in the panorama window.
: A section of the zoom box extends beyond the right end of the panorama display
: The zoom box is beyond the right end of the panorama display.
Selecting the speed of movement
: Moves one dot at a time in the window.
: Moves five dots at a time in the window.
Note
Changing the size or position of the zoom window also changes the [X Span] and [X
Minimum] values of the SCALE key.
7
Displaying the Measured/Calculated Results in the Time Stamp Mode
IM 704310-01E
7-11
7.6
Setting the Statistical Calculation Parameters
(Calc/Stat)
≡For a functional description, see 1.6.≡
Procedure
1.
2.
Press the DISPLAY key to display the Display menu.
Press the [Calc/Stat] soft key to display the Calculation / Statistics Setting menu.
For histogram display
Setting the statistical calculation area
3.
Turn the rotary knob to select the [Calculation Area] item.
4.
Press the SELECT key to select [Window] or [Marker].
Setting the constant T
5.
Turn the rotary knob to select the [T Value] item.
6.
Press the SELECT key to display the numerical input box and enter the value using
the numerical keys.
Selecting the statistical parameters to calculate
7.
Use the rotary knob to select the buttons under [Statistics] and press the SELECT
key to check them.
Selecting [All Clear] and pressing the SELECT key removes all the checks.
ESC
Selecting the calculation polarity (only for A B , A B and
)
8.
Turn the rotary knob to select the [Calculation Slope]/[Calculation Polarity] item.
9.
Press the SELECT key to select one.
7-12
IM 704310-01E
7.6 Setting the Statistical Calculation Parameters (Calc/Stat)
For time variation display
Setting the statistical calculation area
3.
Turn the rotary knob to select the [Calculation Area] item.
4.
Press the SELECT key to select [Window], [Marker], or [Block].
Selecting the statistical parameters to calculate
5.
Use the rotary knob to select the buttons under [Statistics] and press the SELECT
key to check them.
Selecting [All Clear] and pressing the SELECT key removes all the checks.
Calculate
Do not calculate
Explanation
Statistical parameters to be calculated
Select from the following choices. The calculated parameters and the area for
calculation are different for the histogram and time variation displays.
Histogram display
Time variation display
• Average
• T.Average
• Maximum
• T.Maximum
• Minimum
• T.Minimum
• Peak-Peak
• T.Peak-Peak
• σ
• T.σ
• σ/Average
• T.(σ/Average)
• σ/T
• T.(P-P/Average)
• E.L.Error
• T.RF
• MELE
• Median
• Mode
Constant T (T Value)
Set this value only for histogram displays.
Selectable range : 1 ns to 250 ns (in 25 ps steps)
IM 704310-01E
7-13
7
Displaying the Measured/Calculated Results in the Time Stamp Mode
Setting the statistical calculation area
You can set the area over which to calculate statistics.
• Window : The entire displayed window.
• Marker : The area enclosed by the X1, X2, Y1, and Y2 markers.
• Block
: When block sampling, the specified block (selectable only during time
variation display).
When block sampling is OFF, the entire data set is used to calculate the
statistics.
7.6 Setting the Statistical Calculation Parameters (Calc/Stat)
Selecting the calculation polarity (Calculation Slope/Calculation Polarity)
Statistics can be calculated on data having the specified slope or polarity. The histogram
corresponding to the specified slope or polarity is displayed in orange; the histogram of
both slopes or polarities is displayed in blue.
You can select the slope or polarity only for the following cases:
When the measurement function is set to time interval and the slope is set to
A B or A B
• A B : Calculates the statistics on the data from the rising edge of A to the rising
edge of B.
• A B : Calculates the statistics on the data from the falling edge of A to the rising
edge of B.
• A B : Calculates the statistics on the data from rising or falling edge of A to the
rising edge of B.
• A B : Calculates the statistics on the data from rising edge of A to the falling edge
of B.
• A B : Calculates the statistics on the data from falling edge of A to the falling edge
of B.
• A B : Calculates the statistics on the data from rising or falling edge of A to the
falling edge of B.
When the measurement function is set to pulse width and the polarity is set to
•
•
•
: Calculates the statistics only on the positive side of the waveform.
: Calculates the statistics only on the negative side of the waveform.
: Calculates the statistics on both the positive and negative sides of the
waveform.
Time interval measurement
7-14
Pulse width measurement
IM 704310-01E
7.7
Changing the Scale Value
≡For a functional description, see 1.7.≡
Procedure
Executing auto scaling
1.
Pressing the AUTO SCALE key executes auto scaling.
Executing manual scaling
1.
Press the SCALE key to display the Scale menu.
For histogram display
• Setting the center value of the X-axis
2.
Press the [X Center] soft key.
Use the rotary knob or the numerical keys to set the value.
• Selecting the X-axis span
3.
Press the [X Span] soft key.
Turn the rotary knob to select the value.
• Selecting the maximum value of the Y-axis
4.
Press the [Y High] soft key.
Turn the rotary knob to select the value.
7
Displaying the Measured/Calculated Results in the Time Stamp Mode
• Selecting the scale type of Y-axis
5.
Press the [Y Axis] soft key to select [Lin] or [Log].
ESC
For time variation display
• Setting the minimum value of the X-axis
2.
Press the [X Minimum] soft key.
Use the rotary knob or the numerical keys to set the value.
• Selecting the X-axis span
3.
Press the [X Span] soft key.
Turn the rotary knob to select the value.
• Setting the center value of the Y-axis
4.
Press the [Y Center] soft key.
Use the rotary knob or the numerical keys to set the value.
IM 704310-01E
7-15
7.7 Changing the Scale Value
• Selecting the Y-axis span
5.
Press the [Y Span] soft key.
Turn the rotary knob to select the value.
ESC
Explanation
The instrument provides both auto scaling and manual scaling functions.
Auto scaling
Sets the X- and Y-axes automatically according to the measured data.
Manual scaling
You can also manually set the X- and Y-axes. The setting parameters are different for
the histogram display and time variation display as follows:
For histogram display
Range of center values of the X-axis
Selections for the X-axis span
Selections for the maximum value of the Y-axis
Selections for the scale type of the Y-axis
For time variation display
Range of minimum values of the X-axis
Selections for the X-axis span
Range of center values of the Y-axis
Selections for the Y-axis span
7-16
: –50.000 ns to 20.000000000 ms (in 25
ps steps)
: Select from 1.5/3/7.5/15/30/60/150/
300/600 ns, 1.5/3/6/15/30/60/150/300/
600 µ s, 1.5/3/6/15/30 ms
: 10/20/40/100/200/400/1000/2000/4000/
10000/20000/40000/100000/200000/
400000/1e6/1e7/1e8/1e9(Lin)
1e1/1e2/1e3/1e4/1e5/1e6/1e7/1e8/
1e9(Log)
: Select Lin (linear scale) or
Log(logarithmic scale)
: 0 to 3200.0000000 s(in 100 ns steps)
: Select from 6/12/30/60/120/300/600
µ s, 1.2/3/6/12/30/60/120/300/600 ms,
1.2/3/6/12/30/60/120/300/600/1200/
3000/6000 s
: –50 ns to 20 ms(in 25 ps steps)
: Select from 500 ps, 1/2.5/5/10/20/50/
100/200/500 ns, 1/2/5/10/20/50/100/
200/500 µ s, 1/2/5/10/20 ms
IM 704310-01E
7.8
Reading the Data
≡For a functional description, see 1.6.≡
Procedure
Turning ON/OFF the marker
1.
Press the MARKER key to display the Marker menu.
2.
Press the [Marker] soft key to select [ON] or [OFF].
For histogram display
Moving the X marker
3.
Press the [X Marker] soft key to select [X1] or [X2].
Turn the rotary knob to move the marker.
The measured value and frequency at the position of the marker are displayed in
the bottom section of the main window.
Moving the X1 and X2 markers simultaneously
4.
Press the [X1&X2] soft key.
Turning the rotary knob causes the X1 and X2 markers to move together.
Setting the statistical calculation area (when the calculation area is set to Marker)
5.
Press the [Y Marker] soft key
Use the rotary knob or the numerical keys to set the value
Displaying the Measured/Calculated Results in the Time Stamp Mode
Selecting the speed of movement of the marker
6.
Pressing the [Movement] soft key and selecting decreases the speed of
movement of the zoom box. Selecting
increases the speed of movement.
ESC
IM 704310-01E
7
7-17
7.8 Reading the Data
For time variation display
Moving the X marker
3.
Press the [X Marker] soft key to select [X1] or [X2].
Turn the rotary knob to move the marker
The time stamp and measured value at the position of the marker are displayed in
the bottom section of the main window.
Moving the X1 and X2 markers simultaneously
4.
Press the [X1&X2] soft key.
Turning the rotary knob causes the X1 and X2 markers to move together.
Moving the Y marker
5.
Press the [Y Marker] to select [Y1] or [Y2].
Turn the rotary knob to move the marker.
The measured value at the marker is displayed.
Moving the Y1 and Y2 markers simultaneously
6.
Press the [Y1&Y2] soft key.
Turning the rotary knob causes the Y1 and Y2 markers to move together.
Selecting the speed of movement of the marker
7.
Pressing the [Movement] soft key and selecting decreases the speed of
movement of the zoom box. Selecting
increases the speed of movement.
ESC
7-18
IM 704310-01E
7.8 Reading the Data
Explanation
Turn ON/OFF the marker
You can read out the data in the histogram or time variation display using the marker.
The read-out value is displayed in the bottom section of the main window. You can also
use Display key’s [Style] to turn ON/OFF the marker and read-out values.
Marker types
The marker type is different for the histogram and time variation displays.
During histogram display
X Marker(X1, X2) : Displays the value of the x coordinate (measured value) and the
frequency of the X1 and X2 markers.
Y Marker
: This marker is used to set the statistical calculation area. This
marker becomes effective when the calculation area is set to Marker.
During time variation display
X Marker(X1, X2) : Displays the value of the x coordinate (time stamp) and the
measured value of the X1 and X2 markers.
Y Marker(Y1, Y2) : Displays the value of the y coordinate (measured value).
7
Displaying the Measured/Calculated Results in the Time Stamp Mode
Displays which block the X marker is reading the value
when block sampling.
Range of movement of the X1 marker
You can move the marker to the same position as or to the left of the X2 marker.
Range of movement of the X2 marker
You can move the marker to the same position as or to the right of the X1 marker.
Selecting the speed of movement of the marker
: Moves one dot at a time in the window.
: Moves five dots at a time in the window.
Y marker range (during histogram display)
0 to 512, 000
Range of movement of the Y1 marker (during time variation display)
You can move the marker to the same position as or below the Y2 marker.
Range of movement of the Y2 marker (during time variation display)
You can move the marker to the same position as or above the Y1 marker.
Note
•
•
•
IM 704310-01E
If there are multiple data points at the marker position, the average of those values is
displayed.
If there is no data at the marker position, an asterisk (*) is displayed.
In the histogram display, if the value of the Y marker is larger than the maximum value of the
Y-axis (Y High), the Y marker is not displayed.
7-19
Chapter 8 Displaying the Measured/Calculated Results in the Hardware Histogram Mode
8.1
Displaying the Histogram
≡For a functional description, see 1.7.≡
Procedure
1.
Press the DISPLAY key to display the Display menu.
Displaying the histogram
2.
Press the [Item] soft key to display the Display Item menu.
ESC
3.
Press the [Histogram] soft key.
8
Setting the display size of the histogram
4.
Press the [Style] soft key to display the Display Style menu.
ESC
5.
Press the [Graph Size] soft key to display [Half] or [Full].
Setting the display format
5.
Press the [Panorama], [Statistics], [Marker], or [Overlap] soft key to select [ON] or
[OFF] for each item.
ESC
Selecting the window to display (only during multi-window or auto window)
7.
Press the [WindowNum] soft key.
Turn the rotary knob to select the window.
ESC
IM 704310-01E
8-1
Displaying the Measured/Calculated Results in the Hardware Histogram Mode
ESC
8.1 Displaying the Histogram
Explanation
Display size of the histogram (Graph Size)
Select from the following two choices.
Half : Displays the histogram on the left side of the screen. The right side displays the
statistics.
Full : Displays the histogram on the entire screen.
Setting the display format (Style)
In addition to the histogram, you can select whether or not to display the following items.
• Panorama : Displays a panorama display. For setting the panorama display, see
section 8.4.
• Statistics : Displays statistics in the main window. The statistical parameters to be
displayed are set in a dialog box that appears when the [Calc/Stat] soft
key is pressed. For details, see section 8.7.
• Marker
: Displays the read-out values of the X marker. The marker is set using
the menu that is displayed when the MARKER key is pressed.
• Overlap
The ON/OFF setting becomes effective only for the following cases:
• Time interval measurement with the slope set to A B or A B .
• Pulse width measurement with the polarity set to
.
ON : Overlaps the histogram of the slope/polarity that is selected with the
Calculation Slope/Calculation Polarity item (displayed in orange) and the
histogram of both slopes/polarities (displayed in blue).
OFF : Displays the histogram of the slope/polarity that is selected with the
Calculation Slope/Calculation Polarity item (displayed in orange) and the
histogram of both slopes/polarities (displayed in blue) in separate windows.
The following combinations of slopes and polarities can be selected.
• Time interval measurement : A B , A B , A B
A B ,A B ,A B
• Pulse width measurement :
,
,
For the procedures related to setting the Calculation Slope/Calculation Polarity item in
the Calculation/Statistics Setting menu, see section 8.7.
Selecting the window to display
You can select the window only when using the multi-window or auto window function.
Displays the histogram of the selected window. The following windows can be selected.
• Window specified in the Window Parameter Setting menu. (3T, 4T, etc.)
• All (All windows)
• Summation
8-2
IM 704310-01E
8.2
Displaying the List
≡For a functional description, see 1.7.≡
Procedure
1.
Press the DISPLAY key to display the Display menu.
Displaying the list
2.
Press the [Item] soft key to display the Display Item menu.
Marks the position
corresponding to
the number that is
highlighted in the
list
ESC
3.
Press the [List] soft key.
8
Displaying the Measured/Calculated Results in the Hardware Histogram Mode
ESC
Setting the data to be displayed
4.
Use the rotary knob or the numerical keys to set the number of the desired data.
The specified data is highlighted and the position of the specified number is
marked on the time variation display.
Displaying the top data
4.
Press the [Top] soft key. The top data (first data) are highlighted.
Displaying the bottom data
4.
Press the [Bottom] soft key. The bottom data (last data) are highlighted.
Displaying the center data
4.
Press the [Center] soft key. The center data are highlighted.
Selecting the window to display (only during multi-window)
4.
Press the [WindowNum] soft key.
Turn the rotary knob to select the window for which you wish to display the list.
ESC
IM 704310-01E
8-3
8.2 Displaying the List
Explanation
Displaying the list
Displays twenty data points at a time. Taking the left most data in the window to be
number one, the measured values and frequencies are displayed.
The list is displayed on the left side of the screen and the histogram is displayed
vertically on the right side.
The dotted line and mark on the histogram display indicate the data that are
highlighted on the list.
Setting the data to list
You can set the data to be displayed.
The following methods are available to select the data.
• Specify the data number and display
• Display the top data (top of the list), the bottom data (bottom of the list), or the center
data (center of the list)
Selecting the window to display
You can select the window only when using the multi-window or auto window function.
Displays the list and histogram of the selected window. The following windows can be
selected.
• Window specified in the Window Parameter Setting menu. (3T, 4T, etc.)
• All (All windows)
• Summation (Displays only the histogram)
Note
When displaying the list, the [Window] soft key of the DISPLAY key is not displayed even
when using the multi-window or auto window function. To display the [Window] soft key,
change to the histogram display.
8-4
IM 704310-01E
8.3
Displaying the Statistics
≡For a functional description, see 1.7.≡
Procedure
1.
Press the DISPLAY key to display the Display menu.
Displaying the statistics
2.
Press the [Item] soft key to display the Display Item menu.
ESC
3.
Press the [Statistics] soft key.
8
Displaying the Measured/Calculated Results in the Hardware Histogram Mode
ESC
Setting the display format (only when using the multi-window or auto window
function)
4.
Press the [Style] soft key to select [All] or [Window].
• When [All] is selected
5.
Turn the rotary knob to change the statistical parameters to be displayed.
ESC
• When [Window] is selected
5.
Turn the rotary knob to select the number of the window for which to calculate the
statistics (WindowNum).
ESC
IM 704310-01E
8-5
8.3 Displaying the Statistics
Explanation
Setting the display format (Style)
When using the multi-window or auto window function, you can select the display format
of the statistical calculations from the following choices.
• All
: Lists the statistics of all windows. Only four statistical parameters can be
displayed at once, but you can scroll through the parameters using the
rotary knob.
Displays only the parameters that are checked in the dialog box that
appears when the [Calc/Stat] soft key is pressed.
• Window: Displays the statistics for each window. All statistical parameters are
displayed at once. You can select the following windows.
• Window specified in the Window Parameter Setting menu (3T, 4T, etc.)
• Summation (The sum of all windows. The statistics that are displayed
are Peak-Peak, σ, and σ/T)
• All (Displays [-----]for all parameters)
When the format is All
When the format is Window
Statistical parameters that are calculated
The following statistical parameters are calculated.
Asterisks (*) are displayed for the statistics of the parameters that are not turned ON in
the dialog box that appears by pressing the [Calc/Stat] soft key (see section 8.7).
• Average
• Measured T or Estimated T
• Maximum
(only during auto window)
• Minimum
• Number (The number of samples of the items of which the
• Peak-Peak
statistics are calculated)
• σ
• σ/T
• σ/Average
• E.L.Error
• MELE
• Median
• Mode
Note
•
•
8-6
[-----] is displayed when the measured data are invalid, or the measured data do not exist.
When displaying the statistics, the [Window] soft key of the DISPLAY key is not displayed
even when using the multi-window or auto window function. To display the [Window] soft key,
change to the histogram display.
IM 704310-01E
8.4
Displaying the Panorama Display
≡For a functional description, see 1.7.≡
Procedure
1.
2.
Press the DISPLAY key to display the Display menu.
Press the [Item] soft key to display the Display Item menu.
ESC
3.
Press the [Histogram] soft key.
ESC
Displaying the panorama
4.
Press the [Style] soft key to display the Display Style menu and press the
[Panorama] soft key to select [ON].
ESC
Setting the range to display in the panorama display
5.
Press the SCALE key to display the Scale menu.
6.
Press the [Panorama] soft key to display the Panorama menu.
8
Displaying the Measured/Calculated Results in the Hardware Histogram Mode
Zoom box
ESC
IM 704310-01E
8-7
8.4 Displaying the Panorama Display
7.
8.
Press the [Area Min] soft key.
Turn the rotary knob to set the value at the left end of the panorama display.
Press the [Area Max] soft key
Turn the rotary knob to set the value at the right end of the panorama display.
Setting the range to display zoomed
9.
Press the [ZoomSpan] soft key
Turn the rotary knob to set the range of the zoom display (size of the zoom box).
Moving the zoom position
10. Press the [Position] soft key
Turn the rotary knob to move the zoom box position.
Setting the speed of movement of the zoom box
11. Pressing the [Movement] soft key and selecting decreases the speed of
increases the speed of movement.
movement of the zoom box. Selecting
Moving the zoom position to the center
12. Pressing the [Adjust] soft key moves the zoom box to the center of the panorama
window.
ESC
Explanation
Panorama display
The data can be displayed in the panorama window at the top section of the histogram
display.
In the panorama display, a maximum of 3.6 µs of histogram can be listed and the
waveform in the zoom box can be displayed zoomed in the main window. The panorama
function is used when there are multiple histograms and you wish to look at the entire
data.
Setting the display area of the panorama display (Area Min/Area Max)
You can set the range of the panorama display. The following ranges are available.
Area Min : 0/300/600/900 ns, 1.2/1.5/1.8/2.1/2.4/2.7/3/3.3 µs
Area Max : 300/600/900 ns, 1.2/1.5/1.8/2.1/2.4/2.7/3/3.3/3.6 µs
Setting the range of the zoom display
You can set the range to zoom display (size of the zoom box). The following ranges are
available.
1.5/3/7.5/15/30/60/150/300/600 ns, 1.5/3/6 µs
Moving the zoom position
You can set which section (zoom position) of the data in the panorama display for which
to display zoomed.
8-8
IM 704310-01E
8.4 Displaying the Panorama Display
Adjustment function
This function is used to move the zoom box to the center of the panorama window such
as when the zoom box is outside the panorama window.
When the zoom box is outside the panorama window, the following marker is displayed
in the panorama window.
: A section of the zoom box extends beyond the right end of the panorama display.
: The zoom box is beyond the right end of the panorama display.
: A section of the zoom box extends beyond the left end of the panorama display.
: The zoom box is beyond the left end of the panorama display.
Note
Changing the size or position of the zoom window also changes the [X Center] and [X Span]
values of the SCALE key.
8
Displaying the Measured/Calculated Results in the Hardware Histogram Mode
IM 704310-01E
8-9
8.5
Using the Multi-Window Function
≡For a functional description, see 1.7.≡
Procedure
1.
Press the DISPLAY key to display the Display menu.
Press the [Window] soft key to display the Window Parameter Setting menu.
ESC
Setting the window mode to multi-window
2.
Turn the rotary knob to select [Mode]. Press the SELECT key to select [Multi].
Setting the window size
3.
Turn the rotary knob to select [Size].
Press the SELECT key to display the numerical entry area and enter the size with
the numerical keys.
Setting the constant T
4.
Turn the rotary knob to select [T Value].
Press the SELECT key to display the numerical entry area and enter the value with
numerical keys.
Updating the window
5.
Turn the rotary knob to highlight [Update to Window].
Pressing the SELECT key updates the center, span, and marker values.
Setting the various values of the window
6.
Turn the rotary knob to highlight [Label], [Center], [Left Marker] or [Right Marker] of
the appropriate window and enter the value with the numerical keys.
For [Span], pressing the SELECT key after highlighting it displays a selection
menu. Turn the rotary knob to select the desired value from the menu.
Selecting the window to display
7.
Press the [WindowNum] soft key of the DISPLAY menu.
Turn the rotary knob to select the window to display.
ESC
8-10
IM 704310-01E
8.5 Using the Multi-Window Function
Explanation
Window size
Select multi-window
Displays the histogram of 3T
Center value of window (scale value)
Set the scale and marker values of each window
Select the window to display in the main window
Window span value (scale value)
Setting the window size
Sets the number of windows.
Selectable range : 1 to 16
Constant T
Sets the interval between the center value of each window (T value).
Selectable range : 1 ns to 250 ns (in 25 ps steps)
Updating the window
Reflects the value of the constant T to the Center, Span, Left Marker, and Right Marker
values of each window.
The values are reflected in the following way.
Center
: T × [Label]
Span
: A window width closest to but larger than the value T
Left Marker : Center–(T/2)
Right Marker : Center+(T/2)
Example If T = 38 ns and the Label of Window1 is 3, then the X-axis settings are as
follows:
Center=38×3=114[ns]
Span=38(<60)=60[ns]
Left Marker=114–38/2=95[ns]
Right Marker=114+38/2=133[ns]
IM 704310-01E
8-11
8
Displaying the Measured/Calculated Results in the Hardware Histogram Mode
Selecting the window mode
The following three window modes are available.
• Single : Use this mode when analyzing the data on one window.
• Multi : You can set multiple windows of different sizes. Use this mode when there
are multiple histograms and the value of the constant T is known.
• Auto : Automatically determines the value of T according to the input data and sets
the window size. Use this mode when there are multiple histograms and the
value of the constant T is not fixed (CDs of CAV format, for example) or when
the constant T cannot be determined. For auto window, see section 8.6.
8.5 Using the Multi-Window Function
Setting the X-axis of the window
You can change the settings of the following parameters for each window.
• Label
: Window name (Selectable range is 1 to 16)
• Center
: Center value
• Span
: Window width
• Left Marker : X1 marker position
• Right Marker : X2 marker position
Calculates the statistics in the area enclosed by the Left Marker and Right Marker.
For the ranges of each parameter, see sections 8.8 and 8.9.
Selecting the window to display (WindowNum)
Selects which window to display.
You can select the window that was set in the Window Parameter Setting menu, All, or
Summation.
All
: Displays the histogram of all windows and lists the statistics of each
window.
Summation : Sums the histograms of all windows and displays the result.
When the window is set to ALL
Displays the first three
parameters that were
turned ON using the
[Calc/Stat] soft key.
Note
•
•
8-12
The value of Center and Span for each window can be set in the soft key menu that is
displayed by pressing the SCALE key.
The value of Left Marker and Right Marker can be set in the soft key menu that is displayed
by pressing MARKER key.
IM 704310-01E
8.6
Using the Auto Window Function
≡For a functional description, see 1.7.≡
Procedure
1.
Press the DISPLAY key to display the Display menu.
Press the [Window] soft key to display the Window Parameter Setting menu.
ESC
Setting the window mode to auto window
2.
Turn the rotary knob to select the [Mode] item. Press the SELECT to select [Auto].
Selecting the modulation method
3.
Turn the rotary knob to select the [Modulation] item.
Press the SELECT key to select [EFM], [EFM+], or [1-7].
Selecting the type of the constant T
4.
Turn the rotary knob to select [T Type].
Press the SELECT key to select [Measured T] or [Estimated T].
8
Displaying the Measured/Calculated Results in the Hardware Histogram Mode
ESC
IM 704310-01E
8-13
8.6 Using the Auto Window Function
Copying the auto window settings to the multi-window (only for period
measurement and pulse width measurement)
5.
Turn the rotary knob to select [Copy to Multi Window].
Pressing the SELECT key displays the Alert!! menu. Turning the rotary knob to
select [OK] and pressing the SELECT key copies the settings such as the center,
span, and marker values to the multi-window. Selecting [Cancel] and pressing the
SELECT key cancels the copying operation.
Copying the auto window settings to a single window (only for time interval
measurement)
5.
Turn the rotary knob to select [Copy to Single Window].
Pressing the SELECT key displays the Alert!! menu. Turning the rotary knob to
select [OK] and pressing the SELECT key copies the settings such as the center,
span, and marker values to the single window. Selecting [Cancel] and pressing the
SELECT key cancels the copying operation.
Selecting the window to display
2.
Press the [WindowNum] soft key
Turn the rotary knob to select the window to display.
Explanation
Selecting the window mode
For details, see section 8.5.
Selecting the modulation method
Select from the following choices.
• EFM : A modulation method used on CDs.
• EFM+ : A modulation method used on DVDs. Sometimes called (8-16) modulation.
• 1-7
: (1-7)RLL modulation method. Used on rewritable disks.
This instrument provides the following windows for each modulation method.
Modulation Method
Window
Window Size
EFM
EFM+
1-7
3T to 11T
3T to 11T, 14T
2T to 8T
9
10
7
Selecting the type of the constant T
Select from the following choices.
• Measured T : Automatically measures the value of the constant T from the clock
input signal of CHB.
• Estimated T : Estimates the value of the constant T from the input signal and the
modulation method.
8-14
IM 704310-01E
8.6 Using the Auto Window Function
Setting the X-axis of the window
Automatically sets the values of the following items from the modulation method and the
value of the constant T.
• For period measurement and pulse width measurement
Center (Center value) : T× [Label]
Span (Window width) : A window width closest to but larger than the value T
Left Marker
: Center–T/2
Right Marker
: Center+T/2
• For time interval measurement
Center (Center value) : T/2
Span (Window width) : A window width closest to but larger than the value T
Left Marker
: Center–T/2
Right Marker
: Center+T/2
Note
•
•
•
The following items in the dialog box cannot be set.
T Value, Label, Center, Span, Left Marker, Right Marker
For time interval measurements, you can only select [T/2] for [WindowNum]. You cannot
select [All] or [Summation].
When making period or pulse width measurements and the constant T is set to [Measured T],
set the measurement channel to CHA.
Copying the auto window settings to multi-window
Copies the X-axis setting that was automatically set based on the measured value of T to
the multi-window. Use this function when you wish to make measurements using the
value that was automatically measured.
This function is available for period measurement and pulse width measurement.
8
Displaying the Measured/Calculated Results in the Hardware Histogram Mode
Copying the auto window settings to a single window
Copies the X-axis setting that was automatically set based on the measured value of T to
the single window.
This function is available for time interval measurement.
Selecting the window to display
For details, see section 8.5.
IM 704310-01E
8-15
8.7
Setting the Statistical Calculation Parameters
(Calc/Stat)
≡For a functional description, see 1.7.≡
Procedure
1.
2.
Press the DISPLAY key to display the Display menu.
Press the [Calc/Stat] soft key to display the Calculation/Statistics Setting menu.
Setting the calculation area (only for single window)
3.
Turn the rotary knob to select the [Calculation Area] item.
4.
Press the SELECT key to select [Window] or [Marker].
Setting the constant T
5.
Turn the rotary knob to select the [T value] item.
6.
Press the SELECT key to display the numerical entry box and set the value using
the numerical keys.
Selecting the statistical parameters to calculate
7.
Use the rotary knob to select the buttons under [Statistics] and press the SELECT
key to check them.
Selecting [All Clear] and pressing the SELECT key removes all the checks.
ESC
Selecting the calculation polarity (only for A B , A B , and
)
8.
Turn the rotary knob to select the [Calculation Slope]/[Calculation Polarity] item.
9.
Press the SELECT key to select one.
8-16
IM 704310-01E
8.7 Setting the Statistical Calculation Parameters (Calc/Stat)
Explanation
Setting the statistical calculation area
When using a single window, you can set the area on which to calculate statistics.
• Window: The entire displayed window.
• Marker : The area enclosed by the X1, X2, and Y markers.
Statistical parameters to be calculated
Select from the following choices.
• Average
• σ/Average
• Maximum
• E.L.Error
• Minimum
• MELE
• Peak-Peak
• Median
• σ
• Mode
• σ/T
Constant T (T Value)
Selectable range : 1 ns to 250 ns (in 25 ps steps)
Selecting the calculation polarity (Calculation Slope/Calculation Polarity)
Statistics can be calculated on data having the specified slope or polarity. The histogram
corresponding to the specified slope or polarity is displayed in orange; the histogram of
both slopes or polarities is displayed in blue.
You can select the slope or polarity only for the following cases:
When the measurement function is set to time interval and the slope is set to
A B or A B
• A B
: Calculates the statistics on the data from the rising edge of A to the rising
8
edge of B.
: Calculates the statistics on the data from the falling edge of A to the rising
• A B
edge of B.
: Calculates the statistics on the data from rising or falling edge of A to the
rising edge of B.
• A B
: Calculates the statistics on the data from rising edge of A to the falling edge
of B.
• A B
: Calculates the statistics on the data from falling edge of A to the falling edge
• A B
of B.
: Calculates the statistics on the data from rising or falling edge of A to the
falling edge of B.
When the measurement function is set to pulse width and the polarity is set to
•
•
•
: Calculates the statistics only on the positive side of the waveform.
: Calculates the statistics only on the negative side of the waveform.
: Calculates the statistics on both the positive and negative sides of the
waveform.
Time interval measurement
Pulse width measurement
Note
•
•
IM 704310-01E
For multi-window and auto window, the statistical calculation area cannot be selected (set to
Marker). The [Calculation Area] item will not be displayed in the dialog box.
when using the auto window function, the value of the constant T cannot be set.
8-17
Displaying the Measured/Calculated Results in the Hardware Histogram Mode
• A B
8.8
Changing the Scale Value
≡For a functional description, see 1.7.≡
Procedure
Executing auto scaling (only for single window)
1.
Pressing the AUTO SCALE key executes auto scaling.
Executing manual scaling
1.
Press the SCALE key to display the Scale menu.
• Setting the center value of the X-axis
2.
Press the [X Center] soft key to set the rotary knob action to [X Center].
Use the rotary knob or numerical keys to set the center value.
• Selecting the X-axis span
3.
Press the [X Span] soft key to set the rotary knob action to [X Span].
Turn the rotary knob to select the value.
• Selecting the maximum value of the Y-axis
4.
Press the [Y High] soft key to set the rotary knob action to [Y High].
Turn the rotary knob to select the value.
• Selecting the scale type of Y-axis
5.
Press the [Y Axis] soft key to select [Lin] or [Log].
ESC
8-18
IM 704310-01E
8.8 Changing the Scale Value
Explanation
The instrument provides both auto scaling and manual scaling functions.
Auto scaling
Sets the X- and Y-axes automatically according to the measured data. This can only be
used during the single window mode.
Manual scaling
You can arbitrarily set the X- and Y-axis settings.
• Setting the X- and Y-axis
Range of center values of the X-axis
: –50.000ns to 3.200000000 µs (in 25
ps steps)
Selections for the X-axis span
: Select from 1.5/3/7.5/15/30/60/150/
300/600 ns, 1.5/3/6 µs
Selections for the maximum value of the Y-axis : 10/20/40/100/200/400/1000/2000/
4000/10000/20000/40000/100000/
200000/400000/1e6/1e7/1e8/
1e9(Lin)
1e1/1e2/1e3/1e4/1e5/1e6/1e7/1e8/
1e9(Log)
Selections for the scale type of the Y-axis
: Select Lin (linear scale) or Log
(logarithmic scale)
Note
You cannot auto scale when using the multi-window or auto window function.
8
Displaying the Measured/Calculated Results in the Hardware Histogram Mode
IM 704310-01E
8-19
8.9
Reading the Data
≡For a functional description, see 1.6.≡
Procedure
Turning ON/OFF the marker
1.
Press the MARKER key to display the Marker menu.
2.
Press the [Marker] soft key to select [ON] or [OFF].
Moving the X marker
3.
Press the [X Marker] soft key to select [X1] or [X2].
Turn the rotary knob to move the marker.
The measured value and frequency at the position of the marker are displayed in
the bottom section of the main window.
Moving the X1 and X2 markers simultaneously
4.
Press the [X1&X2] soft key.
Turning the rotary knob causes X1 and X2 markers to move together.
Setting the statistical calculation area (when the calculation area is set to Marker)
5.
Press the [Y Marker] soft key.
Use the rotary knob or the numerical keys to set the value.
Selecting the speed of movement of the marker
6.
Pressing the [Movement] soft key and selecting decreases the speed of
movement of the zoom box. Selecting
increases the speed of movement.
ESC
8-20
IM 704310-01E
8.9 Reading the Data
Explanation
Turn ON/OFF the marker
You can read out the data using the marker. The read-out value is displayed in the
bottom section of the main window. You can also use the Display key’s [Style] to turn
ON/OFF the marker and read-out values.
Marker types
X Marker(X1, X2) : Displays the value of the x coordinate (measured value) and the
frequency of the X1 and X2 markers.
Y Marker
: This marker is used to set the statistical calculation area. This
marker becomes effective when the calculation area is set to Marker.
Range of movement of the X1 marker
You can move the marker to the same position as or to the left of the X2 marker.
Range of movement of the X2 marker
You can move the marker to the same position as or to the right of the X1 marker.
Selecting the speed of movement of the marker
: Moves one dot at a time in the window.
: Moves five dots at a time in the window.
Range of movement of the Y marker
0 to 1,000,000,000
8
Displaying the Measured/Calculated Results in the Hardware Histogram Mode
IM 704310-01E
8-21
Chapter 9 Using the Inter-symbol Interference Analysis Function (Option)
9.1
Using the Inter-symbol Interference Analysis
Function
≡For a functional description, see 1.8.≡
Procedure
Using the inter-symbol interference analysis function.
1.
Press the MODE key to display the Measurement Mode Selection Menu.
2.
Press the [TimeStamp] soft key.
ESC
3.
Press the FUNCTION key to display the Function menu.
Set the [Function] to [Pulse Width] and the [Polarity] to
.
ESC
4.
5.
Press the DISPLAY key to display the Display menu.
Press the [Item] soft key to display the Display Item menu.
ESC
6.
Press the [Histogram] soft key.
ESC
Press the [ISI] soft key to display the inter-symbol interference analysis function
setting menu.
Using the Inter-symbol Interference Analysis Function (Option)
7.
9
ESC
8.
Press the [ISI ON/OFF] soft key to select [ON].
ESC
IM 704310-01E
9-1
9.1 Using the Inter-symbol Interference Analysis Function
9.
10.
When [ISI] is turned [ON], the [Window] soft key appears in the menu of step 4.
Press the [Window] soft key and set the value for constant T (T Value). Then,
press the [Update to Window] soft key to reflect the value of constant T to the multiwindow.
Press the START/STOP key to start the measurement.
Explanation
The inter-symbol interference analysis function can be used only in the time stamp mode
with the function set to pulse width measurement (polarity set to
) and the display
item set to histogram.
When the inter-symbol interference analysis function is turned ON, the window changes
to multi-window mode.
Performing the analysis
• The analysis is performed when [ISI] in the inter-symbol interference analysis function
menu is switched from OFF to ON.
• The analysis is performed again when the polarity, the trigger condition, the item being
analyzed, or other settings are changed.
Note
•
•
9-2
The auto window function cannot be used for inter-symbol interference analysis. However,
you can determine the scale value beforehand by using the auto window function in the
hardware histogram mode and then copy the scale to the multi-window. In this way, you can
perform the analysis using the appropriate scale value.
If the polarity is changed or the measurement function is set to some function other than
pulse width measurement while using the inter-symbol interference analysis function, the
inter-symbol interference analysis function turns OFF.
IM 704310-01E
9.2
Setting the Conditions for Data Extraction
≡For a functional description, see 1.8.≡
Procedure
Selecting the extraction mode
1.
Turn ON the inter-symbol interference analysis function and display the intersymbol interference analysis function setting menu according to steps 1 through 8
on page 9-1.
2.
Press the [Mode] soft key.
Turn the rotary knob to select [Single], [Combination], or [Between].
Selecting the polarity of mark and space
3.
Press the [Polarity] soft key to select whether spaces will be positive (
marks will be positive ( :+ ).
:+ ) or
ESC
9
or
Using the Inter-symbol Interference Analysis Function (Option)
When the extraction mode is set to Single
Selecting the trigger
4.
Press the [Trigger] soft key to select
.
Selecting the window that will activate the trigger
5.
Press the window setting soft key.
Turn the rotary knob to select the window that will activate the trigger.
Selecting the data to be extracted
6.
Press the [Target] soft key.
Turn the rotary knob to select [Prev…], [Next…], or [Both…].
ESC
IM 704310-01E
9-3
9.2 Setting the Conditions for Data Extraction
When the extraction mode is set to Combination
Selecting the trigger
4.
Press the [Trigger] soft key to select
or
.
Selecting the window to that will activate the trigger
5.
Press the window setting soft key.
Turn the rotary knob to select the window to that will activate the trigger.
Selecting the data to be extracted
6.
Press the [Target] soft key.
Turn the rotary knob to select [Prev...] or [Next...].
ESC
When the extraction mode is set to Between
Selecting the trigger
4.
Press the [Trigger] soft key to select
or
.
Selecting the window to that will activate the trigger
5.
Press the window setting soft key.
Turn the rotary knob to select the window to that will activate the trigger.
ESC
Selecting the parameters to list
7.
Press the [Calc/Stat] soft key to display the Calculation/Statistics Setting menu.
8.
Use the rotary knob and the SELECT key to check the statistical parameters to list.
9-4
IM 704310-01E
9.2 Setting the Conditions for Data Extraction
Explanation
Selecting the extraction mode
Select from the following choices.
• Single
: Uses either a space or a mark as the trigger and analyzes the data
around it.
• Combination : Uses the sequence of a space followed by a mark or a mark followed
by a space as the trigger and analyzes the data around it.
• Between
: When a mark or a space exists between two spaces or two marks it is
considered to be a trigger and the data between them are analyzed.
Selecting the polarity
Select whether spaces will be positive (+) or marks will be positive (+).
Selecting the trigger/Selecting the data to be extracted
You can select which mark or space will be used as the trigger. The types of trigger that
can be selected vary depending on the extraction mode.
The data around or between triggers can be extracted, but the data that can be extracted
vary depending on the extraction mode.
Mode Trigger
Target
Description
Single
Prev. /Next
Prev. /Next
/Both
/Both
Extract the data immediately before or
after the trigger or both
Combination
Prev. /Next
Prev. /Next
Extract the data immediately before or
after the trigger
Between
-
Extract the data between two spaces
Extract the data between two marks
indicates a space;
indicates a mark. On this instrument, you can select
which window will be marks and which will be spaces.
9
Displays the first two
parameters that were
checked.
Note during inter-symbol interference analysis
The color assignments on the histogram display are as follows:
Histogram of the extracted data : Orange
Histogram of all spaces or marks : Blue
By turning OFF the [Overlap] function in the [Style] setting of the DISPLAY key, the
histogram of the extracted data and that of all spaces or marks can be displayed
separately.
IM 704310-01E
9-5
Using the Inter-symbol Interference Analysis Function (Option)
Statistical parameters that are listed
The statistics of all marks (spaces) and extracted data and the number of samples are
listed.
Select the parameters to list in the following dialog box.
9.3
Analysis Example
When the trigger is set to Single (Space)
Analyze the Mark data immediately before the Space(3T)
Mark
Space
11T
3T
Mark
11T
Trigger
Space Mark Space
Mark
3T 3T 6T
14T
Trigger
Space Mark
3T
7T
Trigger
Analyzes the corresponding Mark data.
Histogram display of all
Mark data
Histogram display of the
extracted Mark data
Sets “the analysis of the
Mark data immediately
before the Space(3T)”
Statistics of the extracted Mark data
Statistics of all Mark data
When the trigger is set to Combination (Space/Mark)
Analyze the Mark date immediately before the Space(3T) and Mark(7T) sequence.
Mark
Space
11T
3T
Mark Space Mark Space
7T
3T 3T 6T
Mark
14T
Trigger
Space Mark
3T
7T
Trigger
Analyzes the corresponding Mark data.
Histogram display of all
Mark data
Histogram display of the
extracted Mark data
Sets “the analyze the Mark
date immediately before
the Space(3T) and Mark(7T)
sequence”
Statistics of the extracted Mark data
Statistics of all Mark data
9-6
IM 704310-01E
9.3 Analysis Example
When the trigger is set to Between(Space-Space)
Analyze the Mark data between two Spaces(3T)
Mark
Space
11T
3T
Mark
11T
Space Mark Space
Mark
3T 3T 6T
14T
Space Mark
3T
7T
Trigger
Analyzes the corresponding Mark data.
Histogram display of all Mark
data
Histogram display of the
extracted Mark data
Sets “the analyze the Mark
data between two Spaces(3T)”
Statistics of the extracted Mark data
Statistics of all Mark data
9
Using the Inter-symbol Interference Analysis Function (Option)
IM 704310-01E
9-7
Chapter 10 Storing/Recalling Setup Information from the Internal Memory
10.1 Storing the Setup Information to the Internal
Memory
≡For a functional description, see 1.8.≡
Procedure
1.
2.
Press the UTILITY key to display the Utility menu.
Press the [Memory] soft key to display the Memory menu.
ESC
Selecting the memory number
3.
Turn the rotary knob to select a memory number.
Storing
4.
Press the [Store] soft key to store the setup information.
ESC
Explanation
Selecting the memory number
Select from the following numbers. If there is setup information already stored in the
chosen memory number, it is overwritten (the previous information is lost).
0 to 9
Note
•
•
IM 704310-01E
Initializing the settings will not clear the stored setup information.
For parameters that are not stored, see page 13-3.
10-1
10
Storing/Recalling Setup Information from the Internal Memory
Stored information
The measurement conditions and display parameters set using the following keys are
stored.
MODE key, FUNCTION key, SAMPLE key, INPUT key, DISPLAY key, SCALE key,
MARKER key
10.2 Recalling Setup Information from the Internal
Memory
≡For a functional description, see 1.8.≡
Procedure
1.
2.
Press the UTILITY key to display the Utility menu.
Press the [Memory] soft key to display the Memory menu.
ESC
Selecting the memory number
3.
Turn the rotary knob to select a memory number.
Recalling
4.
Press the [Recall] soft key to recall the setup information.
ESC
Explanation
Recalled information
Information that was stored is recalled. The current setup information of the instrument
is changed to the recalled information.
Selecting the memory number
Select from the following ten memory locations.
0 to 9
10-2
IM 704310-01E
Chapter 11 Saving and Loading Data and Connecting to a PC
11.1 Floppy Disks
Floppy Disks that can be Used
The following types of 3.5-inch floppy disks can be used. The floppy disk can be
formatted using the instrument.
• 2HD : 1.2 MB or 1.44 MB (MS-DOS format)
• 2DD : 640 KB or 720 KB (MS-DOS format)
Inserting the Floppy Disk into the Drive
With the label side facing left, insert the floppy disk into the floppy disk drive. Insert the
disk until the eject button pops up.
Removing the Floppy Disk from the Drive
Check that the access indicator is OFF, then press the eject button.
Eject button
Access indicator
11
Removing the floppy disk while the access indicator is blinking can damage the
magnetic head of the drive and destroy the data on the floppy disk.
General Handling Precautions of the Floppy Disk
For the general handling precautions of the floppy disk, see the instructions that came
with the floppy disk.
IM 704310-01E
11-1
Saving and Loading Data and Connecting to a PC
CAUTION
11.2 Internal Hard Disk (Option)
CAUTION
When using the instrument in an environment with mechanical vibrations, turn OFF
the internal hard disk’s power switch.
Procedure
Turning ON/OFF the internal hard disk
1.
Press the UTILITY key to display the Utility menu.
2.
Press the [Config] soft key to display the Configuration menu.
ESC
3.
Press the [HDD Motor] soft key to select [ON] or [OFF].
ESC
Explanation
The internal hard disk can be turned ON/OFF on this instrument.
You can protect the internal hard disk from vibrations by turning it OFF.
11-2
IM 704310-01E
11.3 Connecting SCSI Devices
SCSI Specifications (Option)
Item
Specifications
Interface standard
Connector type
Electrical specifications
SCSI(Small Computer System Interface), ANSI X3.131-1986
50-pin half pitch (pin type)
Single-ended. See the chart below for pin assignments.
A terminator is built-in.
Pin No.
Signal Name
Pin No.
Signal Name
1 to 12
13
14 to 25
26
27
28
29
30
31
32
33
34
35 to 37
GND
NC
GND
-DB0
-DB1
-DB2
-DB3
-DB4
-DB5
-DB6
-DB7
-DBP
GND
38
39, 40
41
42
43
44
45
46
47
48
49
50
TEMPWR
GND
-ATN
GND
-BSY
-ACK
-RST
-MSG
-SEL
-C/D
-REQ
-I/O
25 24 23
3
2
1
50 49 48
28 27 26
Pin numbers
Necessities when connecting a SCSI device
SCSI cable
Use a commercially sold cable that is 3 m or less in length, that has a ferrite core on
each end of the cable, and that has a characteristic impedance between 90 and 132 Ω.
Connection Procedure
1. Connect the SCSI cable to the SCSI connector on the back of the instrument.
2. Turn ON the SCSI device and the TA520.
For formatting media, follow the steps given in “11.5 Formatting the Disk”.
11
Note
When connecting multiple SCSI devices in a chain, attach a SCSI terminator to the device at
the other end of the chain.
IM 704310-01E
11-3
Saving and Loading Data and Connecting to a PC
SCSI devices that can be connected
Most SCSI devices (MO disk drive, hard disk, and ZIP) can be connected to the
instrument, but there are some exceptions. For example, only hard disks that have a
capacity of 2 GB or less can be used.
11.4 Changing the SCSI ID Number
Procedure
Changing the ID number of the instrument or of the internal hard disk
1.
Press the UTILITY key to display the Utility menu.
2.
Press the [SCSI] soft key to display the SCSI Setting menu.
Icon
ESC
3.
4.
Press the [Own ID] or [HD ID] soft key.
Turn the rotary knob to set the ID number.
Press the [SCSI Init] soft key to execute the ID number change.
An icon blinks in the upper right corner of the screen while the ID is being changed.
The
icon disappears when the changes are complete.
ESC
Explanation
The SCSI ID number is used to distinguish between the various devices connected to
the SCSI chain.
Make sure not use duplicate ID numbers on any of the connected devices.
The default values are as follows:
Own ID (instrument)
: 6
HD ID (internal hard disk) : 5
* Internal hard disk and SCSI are options.
Range of SCSI ID numbers
0 to 7
Precautions on setting the SCSI ID number
• Own ID and HD ID must be different numbers.
• Assign numbers that are different from the ID number of the instrument (default value
6) for the internal hard disk and the external SCSI devices.
• When changing the SCSI ID number, make sure to press the [SCSI Init] soft key.
• The ID numbers of the external SCSI devices are automatically identified.
11-4
IM 704310-01E
11.5 Formatting the Disk
Procedure
1.
2.
Press the SHIFT+UTILITY(FILE) key to display the File menu.
Press the [Utility] soft key.
ESC
3.
Press the [Function] soft key to display the Function menu.
ESC
4.
Press the [Format] soft key.
Turn the rotary knob to highlight the medium you wish to format.
Use the rotary knob
to select the medium
ESC
Selecting the FD format (for floppy disks only)
5.
Press the [FD Format] soft key.
6.
Turn the rotary knob to select [2DD 640K], [2DD 720K], [2HD 1.2M], or [2HD
1.44M].
11
Saving and Loading Data and Connecting to a PC
ESC
Setting the format type and partition (for SCSI devices only)
5.
Press the [Format] soft key.
6.
Press the [Format Type] soft key to select [Normal] or [Quick].
7.
Turn the rotary knob to set the number of partitions
ESC
IM 704310-01E
11-5
11.5 Formatting the Disk
Executing the format operation
8.
Press the [Exec] soft key
ESC
9.
The Alert!! menu is displayed. Turning the rotary knob to select [OK] and pressing
the SELECT key executes the format operation.
Canceling the format operation
9.
The Alert!! menu is displayed. Turning the rotary knob to select [Cancel] and
pressing the SELECT key cancels the format operation.
Looking at the information about the medium
10. Pressing the [Media Info] soft key lists the information about the media that is
highlighted.
Explanation
CAUTION
• Never remove the disk or turn OFF the power while the format operation is in
progress (while the access indicator is blinking). It can damage the medium or
destroy the data on the medium.
• When the instrument cannot read a pre-formatted medium, reformat the medium
on the instrument. Make sure to back up important data before formatting the
medium. All data will be erased.
Displaying free disk space information
The free disk space of an MS-DOS formatted floppy disk is among the information
displayed by pressing the [Media Info] key.
Formatting a floppy disk
When using a new floppy disk, you must format it first.
FD format
Select the appropriate format for the floppy disk from the following choices.
• 2DD 640K : Formats the 2DD floppy disk to 640 KB/8 sectors.
• 2DD 720K : Formats the 2DD floppy disk to 720 KB/9 sectors.
• 2HD 1.2M : Formats the 2HD floppy disk to 1.2 MB/8 sectors.
• 2HD 1.44M : Formats the 2HD floppy disk to 1.44 MB/18 sectors.
Formatting a disk
The formats of media connected via SCSI are as follows.
MO/PD : Semi-IBM format. Handled as removable disk.
ZIP/JAZ : Hard disk format. Handled as fixed disk.
11-6
IM 704310-01E
11.5 Formatting the Disk
Hard disk format
The hard disk format is IBM compatible format.
Selecting the format mode
When formatting a medium in an external SCSI device, the following two format modes
are available.
Normal : Executes physical format and logical format.
Quick : Executes only the logical format.
The estimated time needed to format a medium is as follows.
For external HDDs, the time will vary depending on the specifications of the drive such
as the rotation speed.
Medium
Normal
Quick
MO (128 MB)
MO (230 MB)
External HDD (1 GB)
Approx. 10 min
Approx. 10 min
Approx. 10 min
Approx. 15 s
Approx. 15 s
Approx. 15 s
Internal HDD
Approx. 5 min
Approx. 15 s
The time varies depending on the
external hard disk.
Setting the partitions
You can set partitions on the external SCSI device and on the internal hard disk.
You can create between one and five partitions.
Listing the information about the medium
The following information is listed for the selected medium.
• Media Name : Name of the medium
• Media Size
: Total capacity
• Used Space : Used space
• Vacant Space : Free space
• Partition Size : Number of partitions
Precautions on formatting
• Formatting a medium containing data erases the data completely.
• The time it takes to format a floppy disk is approximately one and a half minutes.
• A floppy disk cannot be formatted if it is write protected.
• Never format when the instrument is connected to a PC via a SCSI cable.
11
Note
•
•
IM 704310-01E
Floppy disks having a format other than the ones listed above cannot be used.
If an error message appears after the format operation, the floppy disk may be damaged.
Disks formatted to MS-DOS format on a PC can also be used.
The logical (Quick) format only clears the directory entry and FAT information. If you need to
check for bad tracks, do a physical format (Normal).
When data are written to an external SCSI device that has bad tracks, an access error (604
Media failure) may occur in which case no more data can be written. When you are using a
medium for the first time or if the medium can no longer be read, do a [Normal] format. If you
want to format a disk that you have been using before, do a [Quick] format.
If you attempt to format a hard disk in a way such that any one partition is larger than 2 GB,
an error occurs.
Set the partitions so that they are all less than 2 GB.
11-7
Saving and Loading Data and Connecting to a PC
•
•
•
•
11.6 Saving and Loading Setup Information
Procedure
1.
2.
Press the SHIFT+UTILITY(FILE) key to display the File menu.
Press the [File Item] soft key to display the File Item menu.
ESC
3.
Press the [Setup] soft key.
ESC
Saving the setup information
Displaying the Save menu
4.
Press the [Save] soft key to display the Save menu.
ESC
Selecting the directory in which to save the information
5.
Press the [File List] soft key to display the File List.
ESC
6.
Turn the rotary knob to select the medium (displayed with []) and press the
SELECT key. Similarly, select the directory (displayed with <>).
Medium
Directory
ESC
The [Path=…..] displays the selected medium/directory name.
11-8
IM 704310-01E
11.6 Saving and Loading Setup Information
Setting the file name
7.
Press the [File Name] soft key to display the Save menu.
8.
Turn the rotary knob to select [AutoNaming]. Press the SELECT key to select [ON]
or [OFF].
9.
Turn the rotary knob to select [File Name] and press the SELECT key.
A keyboard is displayed on the screen. Use the rotary knob and the SELECT key
to enter the file name. For the procedure for entering the file name, see section
4.2.
10. Similarly, enter the [Comment].
Saving the file
11. After setting the file name, pressing the [Save Exec] key saves the setup
information to the specified directory (the [Save Exec] key changes to an [Abort]
key). Pressing the [Abort] soft key cancels the save operation.
ESC
Looking at the properties
12. Pressing the [Property] soft key in the Save menu displays the properties of the file
that is selected in the list.
11
Saving and Loading Data and Connecting to a PC
IM 704310-01E
11-9
11.6 Saving and Loading Setup Information
Loading setup information
Displaying the Load menu
4.
After step 3, press the [Load] soft key to display the File List.
ESC
Selecting the directory from which to load the information
5.
Turn the rotary knob to select the medium (displayed with []) and press the
SELECT key. Similarly, select the directory (displayed with <>). The [Path=…..]
displays the selected medium/directory name.
ESC
Specifying the file to list
6.
Press the [Filter] soft key to select [Item] or [All].
Selecting the file to load
7.
Turn the rotary knob to select the file to load.
Loading the file
8.
Pressing the [Load Exec] key loads the setup information from the selected file (the
[Save Exec] key changes to an [Abort] key). Pressing the [Abort] soft key cancels
the loading operation.
ESC
Looking at the properties
9.
Pressing the [Property] soft key in the Load menu displays the properties of the file
that is selected in the list.
11-10
IM 704310-01E
11.6 Saving and Loading Setup Information
Explanation
Setup information that are saved
The measurement conditions and display parameters set using the following keys are
stored.
MODE key, FUNCTION key, SAMPLE key, INPUT key, DISPLAY key, SCALE key,
MARKER key
Selecting the directory
The media that are available are displayed in the File List.
Examples
[FD0] : Floppy disk
[SC5] : SCSI device with an ID number of 5
[SC5-1] : The first partition of a SCSI device with an ID number of 5
File extension
The File extension .SET is appended to the file name.
Data size
The data size corresponding to one set of setup information is approximately 5 KB.
Entering the file name and comments
• The file name should have eight characters or less.
• You cannot save to an existing file (no overwriting).
• You must specify a file name. Comments can be omitted. For details, see section
4.2.
Auto naming function
When [Auto Naming] is turned ON, files with three digit numbers from 000 to 999 are
automatically created. Specify the common name (maximum of five characters, specify
at the Filename item) that is placed before the three digit number.
Specifying the type of files to list (Filter)
You can specify the type of files to display.
• Item : Displays only setup information files.
• All : Displays all files on the medium.
11
Note
•
•
•
You cannot save or load while the measurement is in progress (START/STOP indicator is
ON).
If you change the file extension on a PC, for a example, you will not be able to load that file.
A maximum of 35 characters can be displayed in [Path]. If the directory is changed when the
length of the [path] string exceeds 35 characters, an error (601) occurs and the directory
cannot be changed.
CAUTION
Removing the medium while the access indicator and
are blinking can damage
the magnetic head of the drive and destroy the data on the medium.
IM 704310-01E
11-11
Saving and Loading Data and Connecting to a PC
Properties
Lists the file size, the date it was saved, the attribute, and the comment.
11.7 Saving and Loading the Measurement Results
Procedure
1.
2.
Press the SHIFT+UTILITY(FILE) key to display the File menu.
Press the [File Item] soft key to display the File Item menu.
ESC
3.
Press the [Measure] soft key.
ESC
Selecting the data type
4.
Press the [Data Type] soft key to select [Ascii] or [Bin].
Saving the measurement results
Selecting the file in which to save the results
5.
Press the [Save] soft key to display the Save Menu.
ESC
6.
Press the [File List] soft key to display the File List.
ESC
7.
8.
11-12
Select the medium and directory according to the steps given in “Selecting the
directory in which to save the information” in 11.6.
Press the [File Name] soft key to display the Save menu.
Enter the file name according to the steps given in “Setting the file name” in 11.6.
IM 704310-01E
11.7 Saving and Loading the Measurement Results
Saving the file
9.
After setting the file name, pressing the [Save Exec] key saves the measured data
to the specified directory (the [Save Exec] key changes to an [Abort] key).
Pressing the [Abort] soft key cancels the save operation.
ESC
Loading the measurement results
Displaying the load menu
5.
After step 4 (only Bin files can be loaded), press the [Load] soft key to display the
File List.
ESC
Specifying the files to list
6.
Press the [Filter] soft key to select [Item] or [All].
Selecting the file to load
6.
Select the medium and directory according to the steps given in “Selecting the
directory from which to load the information” in 11.6.
7.
Select the file name according to the steps given in “Selecting the file to load” in
11.6.
11
Saving and Loading Data and Connecting to a PC
IM 704310-01E
11-13
11.7 Saving and Loading the Measurement Results
Loading the file
8.
Pressing the [Load Exec] key loads the measurement results (binary data) from the
selected file (the [Save Exec] key changes to an [Abort] key). Pressing the [Abort]
soft key cancels the loading operation.
ESC
Explanation
Selecting the data type
Select from the following choices.
Bin
Saves the measured data in binary format. You can load the data after saving them.
Ascii
• During hardware histogram mode:
Saves the values (class values) and frequencies within the window of the histogram
display in text format. The data cannot be re-loaded after they are saved.
• During time stamp mode:
Saves all of the data (time stamps and values) of the measurement block in text
format. The data cannot be re-loaded after they are saved.
File extension
The file extension is different for each data type. It is automatically appended to the file.
• Bin : The file extension is .WVF. A header file in ASCII format is also saved. The
header file contains important information that is needed when analyzing the
measured data.
• Ascii : The file extension is .ASD.
11-14
IM 704310-01E
11.7 Saving and Loading the Measurement Results
Specifying the files to list
You can specify the type of files to display.
• Item : Displays only measurement result files.
• All : Displays All files on the medium.
Data size
The data size varies depending of the number of samples (S) and the data type.
Bin
• Data measured in the hardware histogram mode:
Expressing the absolute value of the difference between the maximum value and the
minimum value of the measured data as P-P, the data sizes are as follows. The
values inside parentheses are the data sizes for time interval measurements (A B
or A B ) and fixed pulse width (
).
P-P≤800 ns
: Approx. 136 KB (395KB)
800 ns<P-P≤1.6 µs : Approx. 272 KB (790 KB)
1.6 µs<P-P≤2.4 µs : Approx. 408 KB (1185 KB)
2.4 µs<P-P
: Approx. 544 KB (1580 KB)
• Data measured in the time stamp mode: Approx. 8xS +5 KB
Ascii
The data size varies greatly depending on the sampling mode, sampling size, and
histogram settings. The maximum size is approximately 15 MB.
Properties
Lists the file size, the date it was saved, the attribute, and the comment.
Note
•
•
•
•
You cannot save or load while the measurement is in progress (START/STOP indicator is
ON).
The measured data saved in ASCII (text) format cannot be re-loaded.
When measurement data are loaded, the setup information of the instrument changes to the
setup information included with the measured data.
If you change the file extension on a PC, for a example, you will not be able to load that file.
11
CAUTION
IM 704310-01E
11-15
Saving and Loading Data and Connecting to a PC
Removing the medium while the access indicator and
are blinking can damage
the magnetic head of the drive and destroy the data on the medium.
11.8 Saving the Statistical Calculation Results
Procedure
1.
2.
Press the SHIFT+UTILITY(FILE) key to display the File menu.
Press the [File Item] soft key to display the File Item menu.
ESC
3.
Press the [Statistics] soft key.
ESC
Selecting the data type (during time stamp mode only)
4.
Press the [Stat Item] soft key to select [Hist] or [T.V.].
Selecting the file in which to save the results
5.
Press the [Save] soft key to display the File List and Save menu.
ESC
6.
7.
Select the medium and directory according to the steps given in “Selecting the
directory in which to save the information” in 11.6.
Press the [File Name] soft key to display the Save menu.
Enter the file name according to the steps given in “Setting the file name” in 11.6.
Saving the file
8.
After setting the file name, pressing the [Save Exec] key saves the measured data
to the specified directory (the [Save Exec] key changes to an [Abort] key).
Pressing the [Abort] soft key cancels the save operation.
ESC
11-16
IM 704310-01E
11.8 Saving the Statistical Calculation Results
Explanation
File extension
The File extension .csv is appended to the file name.
Data size
For time stamp mode
Histogram statistics
: 1 KB
Time variation statistics (No block sampling) : 1 KB
Time variation statistics (Block sampling)
: 8 KB maximum (when the number of
blocks is 100)
For hardware histogram mode
Single window
: 1 KB
Multi-window/auto window : 3 KB maximum (when window size is 16)
Entering the file name
See section 11.6.
Note
•
•
You cannot save while the measurement is in progress (START/STOP indicator is ON).
The statistical calculation results cannot be re-loaded.
Properties
Lists the file size, the date it was saved, the attribute, and the comment.
CAUTION
Removing the medium while the access indicator and
are blinking can damage
the magnetic head of the drive and destroy the data on the medium.
11
Saving and Loading Data and Connecting to a PC
IM 704310-01E
11-17
11.9 Deleting Files
Procedure
Displaying the Delete menu
1.
Press the SHIFT+UTILITY(FILE) key to display the File menu.
2.
Press the [File Item] soft key to display the File Item menu.
ESC
3.
Press the [Function] soft key to display the Function menu.
ESC
4.
Press the [Delete] soft key to display the File List and Delete menu.
ESC
Specifying the files to list
5.
Press the [Filter] soft key to select [Item] or [All].
Displaying the files
6.
Select the medium and directory according to the steps given in “Selecting the
directory in which to save the information” in 11.6.
Selecting the file to delete
7.
Turn the rotary knob to select the file you wish to delete and press the [Set/Reset]
soft key. The [*] mark appears in front of the file name. If you press the same key
again, the [*] mark disappears.
Selecting all files to be deleted
8.
Press the [All Set] soft key to place [*] marks in front of all file names (the name of
the soft key changes to [All Reset]). If you press the [All Reset] key, the [*] marks
disappear.
Deleting the files
9.
Pressing the [Del Exec] soft key deletes all files that have [*] marks.
11-18
IM 704310-01E
11.9 Deleting Files
Setting the file attributes
10. Turn the rotary knob to select the desired file and press the [Attr] soft key to select
[R] or [R/W].
Mark the files to delete
File attributes
ESC
Note
If the WVF file is deleted when [Filter] is set to [Item], the HDR file is also deleted.
11
Saving and Loading Data and Connecting to a PC
IM 704310-01E
11-19
11.9 Deleting Files
Explanation
Deletes the files that are saved on the floppy disk, internal hard disk, or external SCSI
device.
Selecting the files to list (Filter)
You can specify the type of files to list.
• Item : Displays only the files that are specified in the [File Item] menu (Setup,
Measure, or Statistics)
• All : Displays all files on the medium.
Setting the file attribute
You can set the attribute for each file. The following two attributes can be specified.
• R/W : Read and write possible
• R
: Read only
Changing the attribute to [R] prohibits the file from being deleted. For files you do not
wish to delete, set the attribute to [R].
Selecting the files to delete
Deletes all files that have [*] marks in front of them.
Properties
Lists the file size, the date it was saved, the attribute, and the comment.
Note
•
•
•
•
•
You cannot delete files while the measurement is in progress (START/STOP indicator is ON).
Files that are deleted cannot be recovered. Make sure not to delete files by mistake.
Directories can be deleted if they do not contain files.
If an error occurs while deleting multiple files, the files after the error are not deleted.
Directory attributes cannot be changed.
CAUTION
Removing the medium while the access indicator and
are blinking can damage
the magnetic head of the drive and destroy the data on the medium.
11-20
IM 704310-01E
11.10 Copying Files
Procedure
Displaying the copy menu
1.
Press the SHIFT+UTILITY(FILE) key to display the File menu.
2.
Press the [File Item] soft key to display the File Item menu.
ESC
3.
Press the [Function] soft key to display the Function menu.
ESC
4.
Press the [Copy] soft key to display the File List and Copy menu.
ESC
Specifying the files to list
5.
Press the [Filter] soft key to select [Item] or [All].
Displaying the files
6.
Select the medium and directory according to the steps given in “Selecting the
directory in which to save the information” in 11.6.
Selecting the file to copy
7.
Turn the rotary knob to highlight the file you wish to copy and press the [Set/Reset]
soft key. The [*] mark appears. If you press the same key again, the [*] mark
disappears.
IM 704310-01E
11-21
11
Saving and Loading Data and Connecting to a PC
Selecting all files to be copied
8.
Press the [All Set] soft key to place [*] marks in front of all file names (the name of
the soft key changes to [All Reset]). If you press the [All Reset] key, the [*] marks
disappear.
11.10 Copying Files
Selecting the destination medium and directory
9.
Press the [Dest Dir] soft key to display the File List and Copy menu.
Mark the files to be copied
File attributes
ESC
10.
Select the destination medium and directory according to the steps given in
“Selecting the directory in which to save the information” in 11.6.
Copying the files
11. Pressing the [Copy Exec] soft key copies the files.
ESC
Setting the file attributes
12. Turn the rotary knob to highlight the desired file and press the [Attr] soft key to
select [R] or [R/W].
11-22
IM 704310-01E
11.10 Copying Files
Explanation
Copies the files that are saved on the floppy disk, internal hard disk, or external SCSI
device to the specified medium.
Selecting the files/properties to list (Filter)
See section 11.9.
File attribute
You can set the attribute for each file. The following two attributes can be specified.
• R/W : Read and write possible
• R : Read only
Note
•
•
•
•
•
•
You cannot copy files while the measurement is in progress. Press the START/STOP key to
stop the measurement.
If an error occurs while copying multiple files, the files after the error are not copied.
Directory attributes cannot be changed.
If a file with the same name exists at the destination, copying is not allowed.
You cannot copy the same files to another directory immediately after copying those files.
You must again select the files you wish to copy.
If the WVF file is copied when [Filter] is set to [Item], the HDR file is also copied.
11
Saving and Loading Data and Connecting to a PC
IM 704310-01E
11-23
11.11 Changing the File Name and Creating
Directories
Procedure
Changing the file name
Display the Rename menu
1.
Press the SHIFT+UTILITY(FILE) key to display the File menu.
2.
Press the [File Item] soft key to display the File Item menu.
ESC
3.
Press the [Function] soft key to display the Function menu.
ESC
4.
Press the [Rename] soft key to display the File List and Rename menu.
Specifying the files to list
5.
Press the [Filter] soft key to select [Item] or [All].
Displaying the files
6.
Select the medium and directory according to the steps given in “Selecting the
directory in which to save the information” in 11.6.
Selecting the file to rename
7.
Turn the rotary knob to highlight the file you wish to rename.
Setting the new file name
8.
Press the [File Name] soft key to display the keyboard screen.
Enter the file name according to the steps given in 4.2.
Pressing the [Enter] key changes the file name.
ESC
11-24
IM 704310-01E
11.11 Changing the File Name and Creating Directories
Creating a directory
Display the Make dir menu
4.
After step 3, press the [Make Dir] soft key to display the File List and Make Dir
menu.
Selecting the directory
5.
Select the medium (directory) according to the steps given in “Selecting the
directory in which to save the information” in 11.6.
Setting the directory name
6.
Press the [Dir Name] soft key to display the keyboard screen.
Enter the file name according to the steps given in 4.2.
Pressing the [Enter] key changes the file name.
Create <SETUP2> directory in
the FD0/SETUP directory.
ESC
Explanation
Changing the file name
You can change the file name.
Creating directories
Creates a directory on the floppy disk, internal hard disk, or external SCSI device.
11
Note
•
•
•
IM 704310-01E
You cannot create directories while the measurement is in progress. Press the START/STOP
key to stop the measurement.
If a file with the same name exists in the directory, you cannot change to that file name.
If a directory with the same name exists in the directory, you cannot create it.
If the name of the WVF file is changed when [Filter] is set to [Item], the name of the HDR file
is also changed.
11-25
Saving and Loading Data and Connecting to a PC
•
11.12 Connecting the Instrument to a PC
A PC will be able to access the internal hard disk (option) of the instrument if a SCSI
cable is used to connect the PC to the SCSI (option) of the instrument.
Necessities for connection
SCSI cable (50-pin half pitch, pin type)
Use a commercially sold cable that is 3 m or less in length, that has a ferrite core on
each end of the cable, and that has a characteristic impedance between 90 and 132 Ω.
Connection procedure
Changing the ID number of the instrument or the internal hard disk
Before connecting to a PC, change the SCSI ID numbers of the instrument and the
internal hard disk so that they do not overlap with the ID numbers of other SCSI devices
and the PC.
1. Press the UTILITY key to display the Utility menu.
2. Press the [SCSI] soft key to display the SCSI Setting menu.
3. Press the [Own ID] or [HD ID] soft key.
Turn the rotary knob to set the ID number.
4. Press the [SCSI Init] soft key to change the ID number.
CAUTION
Make sure to follow the connection procedures given below (“Connecting the
instrument and PC”). Otherwise, the media of other SCSI devices connected to the
PC can be damaged.
Connecting the instrument and PC
1. Turn OFF the instrument and PC.
2. Connect the instrument and PC with the SCSI cable.
3. Turn ON the instrument first.
4. Check that the internal hard disk can be accessed. (Press the [Utility] soft key of the
FILE key and display the file list.)
5. Turn ON the PC.
11-26
IM 704310-01E
11.12 Connecting the Instrument to a PC
Precautions during connection
• Files that should not be deleted
When the internal hard disk is formatted with the instrument, the following files are
created in the root directory. Do not delete these files.
If you delete these files, reformat the disk with the instrument.
/AUTORUN.INF
/TA520.ICO
• Newly created files during connection
Sometimes when a new file is created with the instrument while the instrument and
PC are connected, the PC does not recognize the new file.
In such cases, reconnect the instrument and PC according to the steps given in
[Connecting the instrument and PC].
However, if you are running Windows 95, the following steps can be taken so that the
file is recognized.
1. On Windows 95, open the [Settings] tab of the drive’s properties and check the
removable* box.
2. Reboot Windows 95.
3. After creating a new file with the instrument, select [Refresh] from the Explorer’s
view menu.
* Select the connected drive in the drive list that appears by selecting [My Computer]
– [Control Panel] – [System] – [Device Manager] – [Disk drives]. Double-clicking
the drive and clicking the [Settings] tab displays the [Removable] check box. You
can also check the drive letter at the [Current drive letter assignment].
Note
The instrument can only be connected to the end of the SCSI chain. The internal hard disk of
the instrument has a built-in terminator.
IM 704310-01E
11-27
11
Saving and Loading Data and Connecting to a PC
• Drive letters
If multiple hard disks are connected to the PC or if one hard disk is partitioned into
multiple drives, connecting the instrument may change the drive letters (D:, E:, etc.) of
those drives. For details, see the instruction manual for the PC or of the drive.
You cannot change the drive letter of the instrument.
Example
• PC has one internal HDD
Before connecting the instrument
C : (HDD)
After connecting the instrument
C : (HDD)
D : (the instrument)
• PC has two internal HDDs
Before connecting the instrument
C : (HDD)
D : (HDD)
After connecting the instrument
C : (HDD)
D : (the instrument)
E : (HDD)
In actuality, the letter assignments vary depending on the way the hard disks are
partitioned, the interface types (IDE, SCSI, etc.), and the drive types.
Chapter 12 Outputting Screen Images
12.1 Attaching the Paper Roll for Printing
Paper Roll for Printing
The printer uses a dedicated roll of paper provided by YOKOGAWA. Do not use any
other type of paper roll. When using the printer for the first time, use the roll of paper
that is included in the package. Order extra rolls from your nearest YOKOGAWA dealer
as listed on the back cover of this manual.
Part No.
: B9850NX
Specifications
: Thermal-sensitive paper, 30 m
Sold in Packs of : 5 rolls
Handling the Roll of Paper
The paper is a thermal-sensitive paper that changes color with the application of heat.
Take note of the following points.
Storage precautions
The paper starts changing color at around 70°C. It is affected by heat, humidity, light,
and chemicals regardless of whether the paper has been used of not. Note the following
points.
• Store the paper in a cool, dry, and dark place.
• After opening the package, use it quickly.
• If the paper is left in contact for long periods of time with plastic film (such as a vinyl
chloride film or Scotch tape) containing plasticizers, the paper will lose some of its
ability to reproduce color. As a result, for example, if you are going to store the paper
in a folder, use a folder made of polypropylene.
• When using glue on the paper, do not use a glue containing organic solvents such as
alcohol or ether, as they will change the color of the paper.
• For prolonged storage, we suggest you copy the roll chart. Due to the characteristics
of the thermal-sensitive paper, the recording section may lose color over time.
Precautions on use
• Use only rolls of paper provided by YOKOGAWA.
• Touching the paper with sweaty hands can leave finger print marks or blur the printing.
• Rubbing the surface with a hard object can cause the paper to change color due to
the heat caused by friction.
• If chemicals, oil, or other liquids come in contact with the paper, the paper may
change color or the printing may fade.
12
Outputting Screen Images
IM 704310-01E
12-1
12.1 Attaching the Paper Roll for Printing
Installing the Paper Roll
While pressing the lock release lever
towards [OPEN], pull up on the handle on
the left side of the printer cover to open it.
Lock release lever
Printer cover
Handle
Move the release arm located near the
right front to the [MAN FEED] position.
Hold the roll of paper so that the inside of
the paper (not the glossy side) is facing
up. While pressing the movable holder on
the left side of the roll storage space to the
left, set the core in the right holder. Then,
release the movable holder.
Movable holder
Release arm
Insert the tip of the roll paper in the space
between the roller and the black guide and
turn the feed knob away from you until 10
cm of the roll paper is showing at the top
of the roller.
Release arm
MAN FEED
Turn the feed knob
Roll paper
Roller
12-2
Guide
IM 704310-01E
12.1 Attaching the Paper Roll for Printing
FREE
HOLD
Move the release arm to the [Free]
position and straighten the roll paper.
Then, move the release arm to the [HOLD]
position.
If the release arm is not in the [HOLD]
position, an error message will be
displayed at the time of printing. In this
case, you will not be able to print.
Move the printer cover from the back to
the front and close the cover. Make sure
that the tip of the roll sheet is showing
from the opening in the printer cover.
When closing the printer cover, press the
cover firmly until it clicks.
Note
After the paper roll is installed, follow the steps on the next page to check that the paper is
feeding properly. If it is not feeding evenly, continue to feed the paper for another 30 cm. The
paper will straighten out.
12
Outputting Screen Images
IM 704310-01E
12-3
12.2 Printing
Procedure
Selecting the printer
1.
Press the SHIFT+COPY(COPY MENU) key to display the Copy menu.
2.
Press the [Copy to] soft key to display the Copy Destination menu.
ESC
3.
Press the [Printer] soft key to set the output destination to the printer.
ESC
Feeding the chart
4.
Press the [Paper Feed] soft key to feed the chart.
Setting comments
5.
Press the [Comment] soft key to display the keyboard screen.
6.
Enter a comment according to the steps given in “Setting the file name” in 11.6.
ESC
Printing
7.
Display the screen that you wish to print.
8.
Press the START/STOP key to stop the data acquisition.
Data acquisition is in progress while the indicator on the key is blinking.
9.
Pressing the COPY key makes a hard copy of the screen.
To cancel the printing, press the [Abort] soft key in the Copy menu.
12-4
IM 704310-01E
12.2 Printing
Explanation
Comments
Comments (25 characters or less) are displayed in the top left section of the screen.
They can be printed along with the waveform.
Paper feed
You can feed the paper when checking to see whether the roll of paper is properly
installed or when you want to skip over a dirty section.
Note
•
•
•
You cannot print while the measurement is in progress (START/STOP indicator is ON).
You cannot feed the chart while the measurement is in progress.
When the waveforms are overlapped, the color of the waveform on the screen temporarily
changes during printing.
12
Outputting Screen Images
IM 704310-01E
12-5
12.3 Saving Screen Images to Floppy Disk, Internal
Hard Disk (Option), and External SCSI Device
Procedure
Selecting the medium
1.
Press the SHIFT+COPY(COPY MENU) key to display the Copy menu.
2.
Press the [Copy to] soft key to display the Copy Destination menu.
ESC
3.
Press the [Printer] soft key to set the output destination to media.
ESC
Selecting the destination directory
4.
Press the [File List] soft key to display the File List.
Select the directory according to the steps given in “Selecting the directory in which
to save the information” in 11.6.
Setting the file name and comment
5.
Press the [File Name] soft key to display the Save menu.
6.
Enter characters in [Auto Naming], [File Name], and [Comment] according to the
steps given in “Setting the file name” in 11.6.
Selecting the output data format
7.
Press the [Format] soft key.
Turn the rotary knob to select [TIFF], [BMP], or [PostScript].
ESC
12-6
IM 704310-01E
12.3 Saving Screen Images to Floppy Disk, Internal Hard Disk (Option), and External SCSI Device
Selecting half tone (only for TIFF and BMP)
8.
Press the [Half Tone] soft key.
Turn the rotary knob to select [ON(Gray)], [ON(Color)], [ON(ColorR)], or [OFF].
Compressing the data (only for TIFF and BMP)
9.
Press the [Compression] soft key to select [ON] or [OFF].
Saving
10. Set the screen to the screen you wish to save.
11. Press START/STOP to stop the measurement. The measurement is stopped when
the indicator on the key is turned OFF.
12. Pressing the COPY key saves the image to the specified medium. To cancel the
save operation, click the [Abort] soft key in the Copy menu.
ESC
12
Outputting Screen Images
IM 704310-01E
12-7
12.3 Saving Screen Images to Floppy Disk, Internal Hard Disk (Option), and External SCSI Device
Explanation
The screen image can be saved to the floppy disk, the internal hard disk (option), or to
an external SCSI device.
Selecting the output destination
For the procedure to select the medium and directory, see “Selecting the directory to
save the information” in section 11.6.
Output data format
The following formats are available for saving the image data to the medium. The file
extension that is automatically appended to the file and the file size (half tone OFF, no
compression) are indicated below.
Data format
Extension
File Size
TIFF
*.TIF
Approx. 38 KB (Approx. 302 KB)
BMP
*.BMP
Approx. 38 KB (Approx. 302 KB)
PostScript
*.PS
Approx. 78 KB
The file size inside parentheses is the size when half tone is turned ON.
Half tone (for TIFF and BMP)
On(Gray) gives 16 grades of shading. ON(Color) gives 256 colors. There is no gradation
if it is tuned OFF.
Comments
If a comment up to 25 characters in length is displayed beforehand in the upper left
section of the screen, it is saved along with the waveform image.
Data compression (for TIFF and BMP)
For TIFF and BMP formats the data can be compressed using LZW and RLE,
respectively.
However, compression is not possible when the half tone is OFF.
Auto naming function
When [Auto Naming] is turned ON, files with three digit numbers from 000 to 999 are
automatically created. Specify the common name (maximum of five characters, specify
at the File Name item) that is placed before the three digit number.
Note
•
•
12-8
You cannot save screen image data while the measurement is in progress (START/STOP
indicator is ON).
When saving the image data with the half tone set to OFF or saving to the Postscript format
and the waveforms are overlapped, the color of the waveform on the screen temporarily
changes during saving.
IM 704310-01E
Chapter 13 Using Other Functions
13.1 Initializing the Setup Information
≡For a functional description, see 1.8.≡
Procedure
1.
2.
Press the SHIFT+MARKER(INIT) key to display the Initialize menu.
Press the [Execute] soft key.
ESC
Initializing
3.
An Alert!! menu is displayed. Turning the rotary knob to select [OK] and pressing
the SELECT key executes the initialization.
Canceling the initialization
3.
An Alert!! menu is displayed. Turning the rotary knob to select [Cancel] and
pressing the SELECT key cancels the initialization.
13
Using Other Functions
IM 704310-01E
13-1
13.1 Initializing the Setup Information
Explanation
Initial settings
When the setup information is initialized, the parameters are reset to the following
settings.
Item
Setting
MODE key
FUNCTION key
Function
Channel/Slope
Hard Hist
Period
A↑ (Period)
A B (TI)
(Pulse Width)
SAMPLE key
Gate Mode
Event Num
Gate Time
Gate Polarity
Sample Interval
Arming
Ext Arm Slope
Arming Delay
Delay Event
Delay Time
Block
Block Size
Rest Mode
Rest Event
Rest Time
Inhibit
Ref.Clock
INPUT key
(CHA and CHB)
Impedance
Coupling
Trigger Mode
Manual Level
Auto Level
(EXT ARM/EXT GATE and INHIBIT)
Impedance
Coupling
Trigger Level
13-2
Event Gate
100
1µ s
Positive
0µ s
Auto
↑
OFF
1
1µ s
OFF
1
OFF
1
1µ s
OFF
Internal
1M
DC
Manual
0V
50%
1 M (fixed)
DC (fixed)
TTL
IM 704310-01E
13.1 Initializing the Setup Information
Items that cannot be initialized
The following items are not initialized. They are also not stored.
Item
Factory default settings
Setup information stored in the internal memory
Date/time
Beep sound
Click sound
HDD Motor
Brightness of the LCD monitor
Warning display
Store/recall Number
Initial settings on page 13-2
Date and time of shipment
ON
ON
ON
4
ON
0
SCSI device settings
Own ID
HD ID
6
5
GP-IB settings
Gpib Address
Endian
Start Data
End Data
Data Type
Data Select
1
LSBFirst
1
1
Ascii
Time Stamp
File
File Item
Data Type
Stat Item
Auto Naming
File Name
Comment
Setup
Ascii
Hist
OFF
“TA520”
“”
UTILITY key
Function
Filter
FD Format
Format Type
Partition Num
Delete
All
2HD 1.44 M
Quick
1
Copy
Copy to
Image
Image Format
Half Tone
Compression
Printer
Copy
TIFF
OFF (Black and white)
OFF
Calibration data
Values calibrated in standard operating
conditions.
Note
•
IM 704310-01E
13-3
13
Using Other Functions
•
When initialization is executed, operations in progress such as measurement and calculation
stop.
To reset all the settings (reset to factory default), turn ON the power while pressing the
RESET key. Note that when the power is turned ON while pressing the RESET key, the
setup information stored in the internal memory is also reset.
13.2 Calibrating the Instrument
≡For a functional description, see 1.8.≡
Procedure
1.
2.
3.
Press the UTILITY key to display the Utility menu.
Press the [Next] soft key to display the [Next 1/2] menu.
Press the [Calibration] soft key to display the Calibration menu.
ESC
4.
Press the [Exec] soft key.
The calibration results are listed.
ESC
Explanation
Calibrated items
Using the internal calibration signal, the offset voltage of the input amplifier (DC
Calibration), the conversion factor for the time/voltage converter (T/V Calibration), and
the measurement function (Function Calibration) are automatically calibrated.
Executing the calibration
Execute calibration when the operating environment (temperature, humidity) of the
instrument changes drastically.
When the power is turned OFF, the calibration data are reset to their factory default
values (see page 13-3).
Calibration results
If the calibration is successful, [PASS] is displayed. If it is not, [FAIL] is displayed. If
[FAIL] is displayed, do a self-test (see section 14.4) to inspect the instrument.
13-4
IM 704310-01E
13.3 Outputting Monitor Signals
≡For a functional description, see 1.8.≡
Connection Procedure
Connect BNC cables to the monitor output terminals (for CHA and CHB) on the rear
panel of the instrument.
Explanation
The signals corresponding to the input signal of CHA and CHB are output to the CHA
and CHB monitor output terminals, respectively. However, how the monitor signal is
output varies depending on the measurement function.
• Time interval measurement
: Outputs the signals input to both CHA and CHB.
• Period/pulse width measurement : Outputs only the signals input to the selected
channels.
• Output impedance
: 50Ω (Typical value*)
• Output level
: Approx. one fourth the amplitude of the input
signal (within +/- 5 V) when the monitor device
receives the signal with an input impedance of 50
Ω.
* Typical values represent typical or average values. They are not strictly guaranteed.
CAUTION
Do not externally apply voltage to the monitor output terminals. It can damage the
instrument.
13
Using Other Functions
IM 704310-01E
13-5
13.4 Checking the Setup Conditions of the
Instrument and the ROM Version
Procedure
1.
2.
Press the UTILITY key to display the Utility menu.
Press the [Next] soft key to display the [Next 2/2] menu.
ESC
Checking the setup conditions of the instrument
3.
Pressing the [Setup Info] soft key displays the Setup Information menu. You can
scroll the list by turning the rotary knob.
Use the rotary knob
to scroll through the
list
ESC
Checking the ROM version
3.
Pressing the [Version] soft key displays the Version Information menu.
Explanation
Setup Conditions that are displayed
The measurement conditions and display parameters set with the following keys can be
displayed.
MODE key, FUNCTION key, INPUT key, DISPLAY key, SCALE key, MARKER key,
UTILITY key
ROM version
The model name and suffix code of the instrument and the software version can be
displayed.
13-6
IM 704310-01E
13.5 Turning ON/OFF the Click Sound, Beep Sound,
and Warning Display, Setting the Brightness of
the LCD Monitor
Procedure
1.
2.
3.
Press the UTILITY key to display the Utility menu.
Press the [Next] soft key to display the [Next 1/2] menu.
Press the [Config] soft key to display the Configuration menu.
ESC
Turn ON/OFF the beep sound
4.
Press the [Beep] soft key to select [ON] or [OFF].
Turn ON/OFF the click sound
4.
Press the [Click Sound] soft key to select [ON] or [OFF].
Setting the brightness of the LCD monitor
4.
Press the [LCDBright] soft key.
Turn the rotary knob to set the brightness.
Turning ON/OFF the warning display
4.
Press the [Warning] soft key to select [ON] or [OFF].
ESC
13
Using Other Functions
IM 704310-01E
13-7
13.5 Turning ON/OFF the Click Sound, Beep Sound, and Warning Display, Setting the Brightness of the LCD Monitor
Explanation
Turning ON/OFF the beep sound
You can set whether or not to sound a beep when a warning message is displayed on
the screen. The default setting is ON.
Turning ON/OFF the click sound
You can select whether or not to sound clicks when turning the rotary knob. The default
setting is ON.
Setting the brightness of the LCD monitor
The brightness of the LCD monitor can be adjusted. The darkest setting is [0] and the
brightest setting is [7].
Turning ON/OFF the warning display
You can set whether or not to display warning messages. The default setting is ON.
Note
•
•
13-8
Even if the warning display is turned OFF, the warning message is recorded to the error log if
a warning occurs.
Regardless of its ON/OFF setting, clicks no longer sound, if the beep sound is turned OFF.
IM 704310-01E
Chapter 14 Troubleshooting and Maintenance
14.1 Troubleshooting
For corrective actions when a message appears on the screen, see section 14.2
“Messages.”
If servicing is required or if the instrument does not operate properly after taking the
following corrective actions, contact your nearest YOKOGAWA dealer.
Problem
The power does not turn
ON.
Possible Cause
The source voltage is outside of the
allowed range.
The fuse is blown.
Corrective Action
Use a proper voltage source.
Reference Sections
3.3
IM 704310-01E
Troubleshooting and Maintenance
Check for the cause, and if there
14.7
is no problem replace it with a new
fuse.
Nothing is displayed.
The screen brightness is set
Adjust the brightness of the LCD
13.5
extremely dark.
monitor.
The screen is extremely cold.
The ambient temperature should be –
5°C or higher.
The display is odd.
The system is not operating properly. Reboot the instrument.
–
Keys do not operate.
The instrument is in remote mode.
Set it to local mode.
*
Cannot make
Incorrect trigger level.
Set a proper trigger level.
6.6
measurements.
Measurement channel is not selected. Check the channel.
5.2 to 5.4
Exceeding measurement range.
Check the measurement range.
5.2 to 5.4
Incorrect arming setting.
Check the arming setting.
6.4
Incorrect inhibit setting.
Check the inhibit setting.
6.5
Incorrect reference signal.
Check the reference signal.
6.7
Cannot save to the
The medium is not formatted.
Format the medium.
11.5
specified medium
The medium is not properly inserted. Insert the medium properly.
11.1
The medium is write-protected.
Remove the write-protection.
–
Insufficient space on the medium.
Delete unneeded files or use
11.9
another medium.
Attempted to save while the
Save after the measurement
–
measurement is in progress.
completes or stop the measurement.
Cannot load from the
The medium is not properly inserted. Insert the medium properly.
11.1
specified medium
Attempted to load while the
Load after the measurement
11.6, 11.7, 11.8
measurement is in progress.
completes or stop the measurement.
is blinking in the top
The lithium battery is dead.
Do a self-test.
14.4
right corner of the screen. The system is not operating properly.
Cannot print to the built-in The paper roll is not installed.
Install the roll of paper.
12.1
printer.
The position of the release arm is not Move the release arm to the [HOLD] 12.1
correct.
position.
The printer head is damaged or has
Servicing is necessary.
–
worn out.
Attempted to print while the
Print after the measurement
12.2, 12.3
measurement is in progress.
completes or stop the measurement.
A medium cannot be
The cable is not connected.
Connect the cable.
11.3
recognized.
Incorrect SCSI ID number.
Set a correct ID number.
11.4
Incorrect format.
Format the medium.
11.5
Medium is damaged.
–
Cannot control via the
The GP-IB address is not correct.
Use the correct address.
*
GP-IB interface.
Using the interface in a way that does
not comply with the electrical and
mechanical specifications
(IEEE St’d 488-1978).
* See the GP-IB Interface User’s Manual (IM704310-12E)
14
14-1
14.2 Messages
The following three types of messages can appear in the center of the screen.
• Error messages
Displayed when an invalid operation is attempted or when the instrument is behaving
abnormally.
• Warning messages
Displayed when the instrument is in a state in which the user needs to be warned (for
example when the measurement data overflows).
• Alert messages
Displayed in cases such as before formatting a disk.
This section describes the meanings of the error messages (except for communication
related error messages) and warning messages.
For communication related error messages (100 to 299, 400 to 499, 912 to 915) see the
GP-IB Interface User’s Manual (IM704310-12E).
Execution Errors(600 to 799)
Code
601
602
603
604
605
606
607
609
610
611, 612
613
614
615
616-620
621
622 to 641
642
646 to 654
656 to 663
657, 665
666
668
671
672
673
680
681
682
683
685
686
687
14-2
Message
Invalid path name or SCSI ID.
No floppy disk inserted.
No SCSI device.
Media failure.
File not found.
Media is protected.
Media was removed while
accessing.
File already exists.
Contains invalid characters.
Media full.
Directory is not empty.
File is protected.
Physical format error.
File system failure.
File is damaged.
File system failure.
No media exists in SCSI device.
Media failure.
File system failure.
Cannot load this file format.
File is now being accessed.
Wait a moment.
Cannot find .HDR file.
Stop measurement before
accessing file.
Data to be saved do not exist.
SCSI controller failure.
Illegal printer head position.
Paper empty.
Printer over heat.
Printer too cool.
Printer time out.
Printer circuit failure.
Printer aborted.
Description
The path name or the SCSI ID is not correct.
No floppy disk is inserted in the floppy disk drive.
The SCSI device could not be detected.
The medium is abnormal.
The specified file does not exist.
The medium is write-protected.
The medium was removed while it was being
accessed.
A file with the same name already exists.
Invalid characters are being used.
There is not enough free space on the medium.
The directory is not empty.
The file is set to read-only.
The medium could not be physically formatted.
The file system is abnormal.
The file is damaged
The file system is abnormal
There is no medium in the SCSI device
The medium is abnormal
The file system is abnormal
The file was saved on another device.
The file cannot be loaded.
The file is being accessed.
Wait until it finishes.
There is no .HDR file.
The file cannot be accessed while the measurement
is in progress.
There are no data to be saved.
The SCSI controller is abnormal.
Move the release arm to the [HOLD] position
The paper roll is empty
The printer has overheated
The printer temperature is abnormal.
The printer temperature is abnormal.
The printer circuit has malfunctioned
Printer operation has been aborted.
Page
11-4, 11-11
11-1
11-3
–
Chapter 11
–
–
–
4-3
11-11, 11-14, 11-17
11-20
11-20, 11-23
11-7
–
–
–
–
–
–
–
–
11-14
11-11, 11-15, 11-17
–
–
12-3
12-2
–
–
–
–
–
IM 704310-01E
14.2 Messages
Code
701
708
710
711
712
Message
Stop measurement before using
internal printer.
Cannot output data while
measuring.
Internal printer in use.
Wait a moment.
Image data failure.
Cannot compress this image.
Description
Obtaining a hard copy is not possible while the
measurement is in progress.
The data cannot be output while the measurement
is in progress.
A hard copy is in progress.
Wait until it finishes.
The image data are not correct.
This screen image cannot be compressed.
Page
12-5
12-8
–
–
–
Setting Errors (800 to 899)
Code
800
801
802
810
Message
Incorrect date-time.
Illegal file name.
Cannot use identical SCSI ID.
Cannot change window-mode
811
Setting incomplete to use ISI.
Set polarity to Both in Pulse Width
function.
Description
Page
The set date and time are not correct.
3-10
The file name is not correct
4-3
Found duplicate SCSI IDs
11-4
The window mode cannot be changed while
9-2
performing inter-symbolic interference analysis.
Inter-symbolic interference analysis cannot be used 9-2
with the current settings.
Set the polarity to Both in the pulse width measurement.
System Error (900 and higher)
Code
906
908
912
914
918
Message
Fan stopped. Turn OFF the power
immediately.
Inside temperature is too high.
Fatal error in Communicationdriver.
A communication time-out has
occurred.
Turn ON the internal hard disk
motor.
Description
The cooling fan has stopped. Turn OFF the power
immediately.
The temperature inside the instrument is too high.
Communication driver error.
Page
–
Communication time-out error.
–
Turn ON the internal hard disk motor.
11-2
–
–
Warming (0 to 99)
Message
Sample number overflow.
51
Time stamp data overflow.
52
Measurement data overflow.
53
54
55
Measured T failure.
Estimated T failure.
Rest time is too short.
Description
Page
The maximum number of samples that can be
15-1
measured has been exceeded.
The time stamp data have exceeded the longest
1-4, 15-1
sampling period.
The measured data have exceeded the measurement 15-2, 15-3
range.
Failed to measure the value of T for the auto window. 15-6
Failed to estimate the value of T for the auto
15-6
The pause time is too short.
6-6
Warning Mark
The following warning mark is displayed at the top of the screen when there is an error
message or warning message.
Warning mark
Troubleshooting and Maintenance
Code
50
14
When you see a warning mark, the error and warning messages can be listed by
pressing the [Error Log] soft key of the UTILITY key to display the error log. If there are
many messages that they do not fit in the window, the rotary knob can be turned to scroll
through the list. For details related to the procedures, see section 14.3.
IM 704310-01E
14-3
14.3 Using the Error Logging Function
Procedure
1.
2.
Press the UTILITY key to display the Utility menu.
Press the [Next] soft key to display the [Next2/2] menu.
ESC
Displaying the error log
3.
Press the [Error Log] soft key to display the error log.
If there are many messages and they do not fit in the window, the rotary knob can
be turned to scroll through the messages.
4.
Pressing the [Clear] soft key clears the messages and the mark disappears.
Error and the
command that
caused the error
ESC
Explanation
When an operation error, a communication error, or a warning occurs, the instrument
creates an error message list and displays a mark in the top right corner of the screen.
The details of the message can be checked by displaying the error log.
The mark remains on the screen until you press the [Clear] soft key in the [Error
Logging] menu to clear the message list.
Note
Warning messages cannot be cleared using the [Clear] key. The message will automatically
disappear when the problem is resolved such as by restarting the measurement.
14-4
IM 704310-01E
14.4 Performing a Self-test
Procedure
1.
2.
3.
Press the UTILITY key to display the Utility menu.
Press the [Next] soft key to display the [Next1/2] menu.
Press the [Selftest] soft key to display the Self-test menu.
ESC
Testing the panel
4.
Press the [Selftest] soft key to display the test item selection menu.
ESC
5.
6.
Press the [Panel] soft key.
Pressing the [Exec] soft key starts the panel test.
7.
8.
9.
Press each key and check that the corresponding key name is displayed on the
screen.
Turn the rotary knob to the left and right and check that the correct direction is
displayed on the screen.
Press the ESC key twice to return to the self-test menu.
Troubleshooting and Maintenance
ESC
14
IM 704310-01E
14-5
14.4 Performing a Self-test
Testing the display
4.
Press the [Selftest] soft key to display the test item selection menu.
ESC
5.
6.
Press the [Display] soft key.
Pressing the [Exec] soft key starts the display test.
ESC
7.
8.
9.
Use the arrow keys to alternately display the test item and test information and
check that there are no black spots or other abnormalities on the screen.
Turn the rotary knob to check that the brightness of the LCD monitor changes.
Press the ESC key to return to the self-test menu.
Testing the board
4.
Press the [Selftest] soft key to display the test item selection menu.
ESC
5.
6.
Press the [Board] soft key.
Pressing the [Exec] soft key starts the board test and the results are displayed.
If PASS is not displayed for each test item, the instrument is malfunctioning.
ESC
14-6
IM 704310-01E
14.4 Performing a Self-test
Explanation
Remove all cables that are connected to the terminals on the front and rear panels and
stop the measurement.
If abnormalities are found on a test item
The instrument probably has malfunctioned. Contact your nearest YOKOGAWA dealer.
Board test messages
The following messages may appear. If any of these messages appears, servicing is
necessary. Contact your nearest YOKOGAWA dealer.
• Low Battery
: The battery has died. It must be replaced.
• Calibration Data Lost
: The internal calibration values may have been lost. Recalibration is necessary.
• ROM Error/DRAM Error : Abnormality may have occurred in the internal memory.
/SRAM Error
Troubleshooting and Maintenance
14
IM 704310-01E
14-7
14.5 Adjusting the Time Base
CAUTION
• Do not apply a voltage exceeding the maximum input voltage to the input
terminals. It can damage the input section.
• Do not apply an external voltage to the output terminals. It can damage the
internal circuit.
Instruments required
Prepare the following instruments.
Standard frequency generator
• Frequency accuracy
: 0.25 ppm or better
• Recommended instrument: 5071A (by HP) or 9500/EN100
Frequency counter
• Frequency resolution
: 1 Hz or better
• Recommended instrument: TA1100 Time Interval Analyzer (by YOKOGAWA)
The procedures for adjusting the time base (reference clock) using the
recommended instruments are provided below.
Connecting the instruments
• Check that all the instruments are turned OFF, then connect the instruments.
• Connect the output of the standard frequency generator to the REFERENCE IN (rear
panel) terminal of the frequency counter (TA1100) and measure using the external
reference frequency.
• Connect the REFERENCE OUT (rear panel) terminal of the TA520 to the CHA
terminal of the frequency counter (TA1100).
TA520
REFERENCE OUT
Frequency counter
(TA1100)
REFERENCE IN
Standard frequency
generator (5071A)
TA520
OUTPUT
TA 11 0 0
CHA
14-8
IM 704310-01E
14.5 Adjusting the Time Base
Instrument settings
TA520 : None
TA1100 :
• Function : Frequency A
• Gate time : 1 ms
• Sampling size : 1
• Sampling mode : FREE
• Display : NUMERIC
• Input setting CHA : DC coupling, ATT=OFF, 50 W, trigger level = 0 V
• REFERENCE : EXTERNAL
5071A : None
Adjustment procedure
Adjust the TA520 after a warm-up time of 30 minutes.
Turn the REFERENCE ADJUST on the rear panel of the TA520, and adjust it so that the
read-out value of the frequency counter is within the following range.
9.999990 MHz to 10.000010 MHz (10 MHz±10 Hz, within ±1 ppm)
Troubleshooting and Maintenance
14
IM 704310-01E
14-9
14.6 Executing the Performance Test
CAUTION
• Do not apply a voltage exceeding the maximum input voltage to the input
terminals. It can damage the input section.
• Do not apply an external voltage to the output terminals. It can damage the
internal circuit.
Testing the Trigger Voltage Accuracy
Instruments required
Prepare the following instruments.
DC voltage generator
• Voltage accuracy
: 1 mV or better
• Recommended instrument : Programmable DC voltage/current source 7651(by
YOKOGAWA)
The procedures for testing the trigger voltage accuracy using the recommended
instruments are provided below.
Connecting the instruments
• Check that all the instruments are turned OFF, then connect the instruments.
• Connect the output of the DC voltage generator to the input terminal (CHA or CHB) of
the TA520.
TA520
DC voltage generator (7651)
TA520
7651
PROGRAMAB LE DC SOURCE
OUTPUT
CHA
CHB
Instrument settings
• TA520 : Input settings : DC coupling, 1 MΩ, trigger level = 0 V
• 7651: Output level : 4.000 V
: 2.000 V
: 0V
: -2.000 V
: -4.000 V
Note
If there is noise due to the environment, attach a 1 µF capacitor between the signal cable and
ground.
14-10
IM 704310-01E
14.6 Executing the Performance Test
Test method
• Test the TA520 after a warm-up time of 30 minutes.
• This test checks the error in the trigger levels by comparing the input DC voltage to
the trigger level set on the TA520.
• The input indicator of the TA520 is monitored to detect the actual trigger levels.
Test procedure
1.
Connect the output of the 7651 to CHA of the TA520.
2.
Set the output level of the 7651 to 4.000 V.
3.
Set the trigger level of the TA520 to 4.100 V.
4.
Start the measurement on the TA520.
5.
Decrease the trigger level of the TA520 by 5 mV steps. When the input indicator
lights up, record the trigger level as VL.
6.
Set the trigger level of the TA520 to 3.900 V.
7.
Increase the trigger level of the TA520 by 5 mV steps. When the input indicator
lights up, record the trigger level as VH.
8.
Calculate the mean value of VL and VH and check that the value is within the
allowable range.
VTRIG=(VL+VH)/2
9.
Set the output of the DC voltage generator to 2.000 V, 0 V, -2.000 V, and -4.000 V
and repeat the same test.
10. Repeat steps 1 through 9 for CHB.
Test results
CHA
Voltage of 7651
VL
VH
VTRIG
4.000 V
2.000 V
0.000 V
-2.000 V
-4.000 V
Allowable Range
3.950 V to 4.050 V
1.970 V to 2.030 V
-0.010 V to 0.010 V
-2.030 V to -1.970 V
-4.050 V to -3.950 V
CHB
4.000 V
2.000 V
0.000 V
-2.000 V
-4.000 V
VL
VH
VTRIG
Troubleshooting and Maintenance
Voltage of 7651
Allowable Range
3.950 V to 4.050 V
1.970 V to 2.030 V
-0.010 V to 0.010 V
-2.030 V to -1.970 V
-4.050 V to -3.950 V
14
IM 704310-01E
14-11
14.6 Executing the Performance Test
Testing the Input Sensitivity
Instruments required
Prepare the following instruments.
Synthesized signal generator
• Frequency range : 10 MHz to 50 MHz or higher
• Output level : 720 mVrms or higher
• Output level accuracy : ±0.1 dB or better
• Recommended instrument : 8657B synthesized signal generator (by HP)
The procedures for testing the input sensitivity using the recommended
instruments are provided below.
Connecting the instruments
• Check that all the instruments are turned OFF, then connect the instruments.
• Connect the output of the synthesized signal generator to the input terminal (CHA or
CHB) of the TA520.
TA520
Synthesized signal generator
(8657B)
REFERENCE IN
REFERENCE OUT
TA520
8657 B
OUTPUT
CHA
CHB
Instrument settings
TA520:
• Sampling mode : Hardware histogram mode
• Input settings : DC coupling, 50 Ω (both CHA and CHB), trigger level = 0 V
• Function : Period A, B
• Gate : Event, 1000000
• Reference : External
• X Center, X Span :
Input Frequency
X Center
X Span
10 MHz
20 MHz
40 MHz
100 ns
50 ns
25 ns
15 ns
15 ns
15 ns
• Y High : 106
8657B:
• Frequency :
:
:
• Level
:
14-12
10 MHz
20 MHz
40 MHz
35 mVrms
IM 704310-01E
14.6 Executing the Performance Test
Test method
• Test the TA520 after a warm-up time of 30 minutes.
• Set the frequency of the 8657B to the values given in the table below, and check that
the measured values (mean value and standard deviation) are within the allowable
range using the period measurement function on the TA520. Perform the same test
on both CHA and CHB.
Test results
CHA↑
Frequency (8657B) Mean Value
Measured Value
10 MHz
20 MHz
40 MHz
Standard Deviation
Allowable Range
Measured Value
99.7 ns to 100.3 ns
49.7 ns to 50.3 ns
24.7 ns to 25.3 ns
Allowable Range
280 ps or less
190 ps or less
140 ps or less
CHA↓
Frequency (8657B) Mean Value
Measured Value
10 MHz
20 MHz
40 MHz
Standard Deviation
Allowable Range
Measured Value
99.7 ns to 100.3 ns
49.7 ns to 50.3 ns
24.7 ns to 25.3 ns
Allowable Range
280 ps or less
190 ps or less
140 ps or less
CHB↑
Frequency (8657B) Mean Value
Measured Value
10 MHz
20 MHz
40 MHz
Standard Deviation
Allowable Range
Measured Value
99.7 ns to 100.3 ns
49.7 ns to 50.3 ns
24.7 ns to 25.3 ns
Allowable Range
280 ps or less
190 ps or less
140 ps or less
CHB↓
Frequency (8657B) Mean Value
Measured Value
Allowable Range
99.7 ns to 100.3 ns
49.7 ns to 50.3 ns
24.7 ns to 25.3 ns
Measured Value
Allowable Range
280 ps or less
190 ps or less
140 ps or less
Troubleshooting and Maintenance
10 MHz
20 MHz
40 MHz
Standard Deviation
14
IM 704310-01E
14-13
14.6 Executing the Performance Test
Testing the Frequency Resolution and the Minimum Measured Value
Instruments required
Prepare the following instruments.
Synthesized signal generator
• Frequency range : 10 MHz to 50 MHz or higher
• Output level : 720 mVrms or higher
• Output level accuracy : ±0.1 dB or better
• Recommended instrument : 8657B synthesized signal generator (by HP)
The procedures for testing the frequency resolution and minimum measured value
using the recommended instruments are provided below.
Connecting the instruments
• Check that all the instruments are turned OFF, then connect the instruments.
• Connect the output of the synthesized signal generator to the input terminal (CHA or
CHB) of the TA520.
TA520
Synthesized signal generator
(8657B)
REFERENCE IN
REFERENCE OUT
TA520
8657 B
OUTPUT
CHA
CHB
Instrument settings
TA520:
• Sampling mode : Hardware histogram mode
• Input settings : DC coupling, 50 Ω (both CHA and CHB), trigger level = 0 V
• Function : Period A, B
• Gate : Event, 1000000
• Reference : External
• X Center, X Span :
Input Frequency
X Center
X Span
10 MHz
20 MHz
40 MHz
50 MHz
126 MHz
100 ns
50 ns
25 ns
20 ns
8 ns
15 ns
15 ns
15 ns
15 ns
15 ns
• Y High : 106
8657B:
• Frequency :
:
:
:
:
• Level
:
14-14
10 MHz
20 MHz
40 MHz
50 MHz
126 MHz
360 mVrms
IM 704310-01E
14.6 Executing the Performance Test
Test method
• Test the TA520 after a warm-up time of 30 minutes.
• Set the frequency of the 8657B to the values given in the table below, and check that
the measured values (mean value and standard deviation) are within the allowable
range using the period measurement function on the TA520. Perform the same test
on both CHA and CHB.
Test results
CHA↑
Frequency (8657B) Mean Value
Measured Value
10 MHz
20 MHz
40 MHz
50 MHz
126 MHz
Standard Deviation
Allowable Range
Measured Value
99.7 ns to 100.3 ns
49.7 ns to 50.3 ns
24.7 ns to 25.3 ns
19.7 ns to 20.3 ns
7.63 ns to 8.23 ns
Allowable Range
120 ps or less
110 ps or less
100 ps or less
100 ps or less
100 ps or less
CHA↓
Frequency (8657B) Mean Value
Measured Value
10 MHz
20 MHz
40 MHz
50 MHz
126 MHz
Standard Deviation
Allowable Range
Measured Value
99.7 ns to 100.3 ns
49.7 ns to 50.3 ns
24.7 ns to 25.3 ns
19.7 ns to 20.3 ns
7.63 ns to 8.23 ns
Allowable Range
120 ps or less
110 ps or less
100 ps or less
100 ps or less
100 ps or less
CHB↑
Frequency (8657B) Mean Value
Measured Value
10 MHz
20 MHz
40 MHz
50 MHz
126 MHz
Standard Deviation
Allowable Range
Measured Value
99.7 ns to 100.3 ns
49.7 ns to 50.3 ns
24.7 ns to 25.3 ns
19.7 ns to 20.3 ns
7.63 ns to 8.23 ns
Allowable Range
120 ps or less
110 ps or less
100 ps or less
100 ps or less
100 ps or less
Frequency (8657B) Mean Value
Measured Value
10 MHz
20 MHz
40 MHz
50 MHz
126 MHz
Standard Deviation
Allowable Range
99.7 ns to 100.3 ns
49.7 ns to 50.3 ns
24.7 ns to 25.3 ns
19.7 ns to 20.3 ns
7.63 ns to 8.23 ns
Measured Value
Allowable Range
120 ps or less
110 ps or less
100 ps or less
100 ps or less
100 ps or less
Troubleshooting and Maintenance
CHB↓
14
IM 704310-01E
14-15
14.6 Executing the Performance Test
Testing the Pulse Width Resolution
Instruments required
Prepare the following instruments.
Synthesized signal generator
• Frequency range : 10 MHz to 50 MHz or higher
• Output level : 720 mVrms or higher
• Output level accuracy : ±0.1 dB or better
• Recommended instrument : 8657B synthesized signal generator (by HP)
The procedures for testing the pulse width resolution using the recommended
instruments are provided below.
Connecting the instruments
• Check that all the instruments are turned OFF, then connect the instruments.
• Connect the output of the synthesized signal generator to the input terminal (CHA or
CHB) of the TA520.
TA520
Synthesized signal generator
(8657B)
REFERENCE IN
REFERENCE OUT
TA520
8657 B
OUTPUT
CHA
CHB
Instrument settings
TA520:
• Sampling mode : Hardware histogram mode
• Input settings : DC coupling, 50 Ω (both CHA and CHB), trigger level = 0 V
• Function : Pulse width A, B
• Gate : Event, 1000000
• Reference : External
• X Center, X Span :
Input Frequency
X Center
X Span
10 MHz
20 MHz
50 ns
25 ns
15 ns
15 ns
• Y High : 106
8657B:
• Frequency : 10 MHz
: 20 MHz
• Level
: 360 mVrms
14-16
IM 704310-01E
14.6 Executing the Performance Test
Test method
• Test the TA520 after a warm-up time of 30 minutes.
• Set the frequency of the 8657B to the values given in the table below, and check that
the measured values (mean value and standard deviation) are within the allowable
range using the pulse width measurement function on the TA520. Perform the same
test on both CHA and CHB.
Test results
CHA
Frequency (8657B) Mean Value
Measured Value
10 MHz
20 MHz
Standard Deviation
Allowable Range
Measured Value
48.4 ns to 51.6 ns
23.7 ns to 26.3 ns
Allowable Range
120 ps or less
110 ps or less
CHA
Frequency (8657B) Mean Value
Measured Value
10 MHz
20 MHz
Standard Deviation
Allowable Range
Measured Value
48.4 ns to 51.6 ns
23.7 ns to 26.3 ns
Allowable Range
120 ps or less
110 ps or less
CHB
Frequency (8657B) Mean Value
Measured Value
10 MHz
20 MHz
Standard Deviation
Allowable Range
Measured Value
48.4 ns to 51.6 ns
23.7 ns to 26.3 ns
Allowable Range
120 ps or less
110 ps or less
CHB
Frequency (8657B) Mean Value
Measured Value
10 MHz
20 MHz
Standard Deviation
Allowable Range
48.4 ns to 51.6 ns
23.7 ns to 26.3 ns
Measured Value
Allowable Range
120 ps or less
110 ps or less
Troubleshooting and Maintenance
14
IM 704310-01E
14-17
14.6 Executing the Performance Test
Testing the A-to-B Interval Resolution
Instruments required
Prepare the following instruments.
Synthesized signal generator
• Frequency range : 10 MHz to 50 MHz or higher
• Output level : 720 mVrms or higher
• Output level accuracy : ±0.1 dB or better
• Recommended instrument : 8657B synthesized signal generator (by HP)
Power divider
• Characteristic impedance : 50 Ω
• Recommended instrument : 700966 Power divider (by YOKOGAWA)
The procedures for testing the A-to-B interval resolution using the recommended
instruments are provided below.
Connecting the instruments
• Check that all the instruments are turned OFF, then connect the instruments.
• Connect the output of the synthesized signal generator to the input terminal (CHA or
CHB) of the TA520 via the power divider.
• Use coaxial cables having identical lengths for the connection from the power divider
to the two input terminals (CHA and CHB) of the TA520.
Synthesized signal generator
(8657B)
TA520
REFERENCE IN
REFERENCE OUT
TA520
8657 B
OUTPUT
CHA
CHB
Power divider
Instrument settings
TA520:
• Sampling mode : Hardware histogram mode
• Input settings : DC coupling, 50 Ω (both CHA and CHB), trigger level = 0 V
• Function : A to B interval
• Gate : Event, 1000000
• Reference : External
• X Center, X Span :
• When A B or A B
Input Frequency
X Center
X Span
10 MHz
20 MHz
0 ns
0 ns
15 ns
15 ns
• When A B or A B
Input Frequency
X Center
X Span
10 MHz
20 MHz
50 ns
25 ns
15 ns
15 ns
• Y High : 106
8657B:
• Frequency : 10 MHz
: 20 MHz
• Level
: 720 mVrms
14-18
IM 704310-01E
14.6 Executing the Performance Test
Test method
• Test the TA520 after a warm-up time of 30 minutes.
• Set the frequency of the 8657B to the values given in the table below, and check that
the measured values (mean value and standard deviation) are within the allowable
range using the time interval measurement function on the TA520. Perform the same
test on both CHA and CHB.
Test results
A B
Frequency (8657B) Mean Value
Measured Value
10 MHz
20 MHz
Standard Deviation
Allowable Range
Measured Value
-1 ns to 1.6 ns
-1 ns to 1.3 ns
Allowable Range
120 ps or less
110 ps or less
A B
Frequency (8657B) Mean Value
Measured Value
10 MHz
20 MHz
Standard Deviation
Allowable Range
Measured Value
-1 ns to 1.6 ns
-1 ns to 1.3 ns
Allowable Range
120 ps or less
110 ps or less
A B
Frequency (8657B) Mean Value
Measured Value
10 MHz
20 MHz
Standard Deviation
Allowable Range
Measured Value
48.4 ns to 51.6 ns
23.7 ns to 26.3 ns
Allowable Range
120 ps or less
110 ps or less
A B
Frequency (8657B) Mean Value
Measured Value
10 MHz
20 MHz
Standard Deviation
Allowable Range
48.4 ns to 51.6 ns
23.7 ns to 26.3 ns
Measured Value
Allowable Range
120 ps or less
110 ps or less
Troubleshooting and Maintenance
14
IM 704310-01E
14-19
14.7 Replacing the Power Fuse
WARNING
• To avoid fire, use only a fuse having the specified rating (voltage, current, and
type)
Make sure to turn OFF the instrument and unplug the power cord before
replacing the fuse.
• Never short the fuse holder.
Specified Rating
The power fuse used on this instrument is specified as follows.
Maximum rated voltage : 250 V
Maximum rated current : 3 A
Type
: Time lag
Standard
: UL/CSA certified
Part number
: A1436EF
Replacement Procedures
Follow the procedures below to replace the power fuse.
1. Turn OFF the power switch.
2. Unplug the power cord from the power outlet.
3. Place the tip of a Philips screwdriver in the dented section of the fuse holder on the
power connector side and move the driver in the direction of the arrow to remove the
fuse holder.
4. Take out the shortened fuse that is attached to the tip of the fuse holder.
5. Attach a new fuse to the holder and then place the fuse holder back in its original
position.
Note
The user cannot replace the fuse that is located inside the case. If you believe the fuse inside
the case is blown, contact your nearest YOKOGAWA dealer as listed on the back cover of
this manual.
The ratings of the fuse that is used inside the case are shown below.
14-20
Location
Maximum Rated
Voltage
Maximum Rated
Current
Type
Standard
Inlet
CPU board
250 V
250 V
3A
800 mA
Time lag
Time lag
UL/CSA certified
VDE/SEMKO certified
IM 704310-01E
14.8 Recommended Replacement Parts
The one-year warranty applies only to the main unit of the instrument (starting from the
day of delivery) and does not cover any other items nor expendable items (items which
wear out). The replacement period for expendable items varies depending on the
conditions of use. Refer to the table below as a general guideline. Contact your nearest
YOKOGAWA dealer for replacement parts.
Part Name
Recommended Replacement Period
Built-in printer
LCD backlight
Internal hard disk
Under normal usage, 120 rolls of paper
3 years
One year after purchase (data on the disk are not
covered)
3 years
3 years
3 years
Cooling fan (front)
Cooling fan (rear)
Backup battery (Lithium battery)
Troubleshooting and Maintenance
14
IM 704310-01E
14-21
Chapter 15 Specifications
15.1 Measurement Input and Trigger
Item
Number of input channels
Input coupling
Input connector
Input impedance
Frequency characteristics
(-3 dB point)
Specifications
Specification
2 (CHA, CHB)
DC/AC
BNC connector
50 Ω/1 MΩ, 20 pF (Typical value*1)
• When the input coupling is DC: DC to 200 MHz (Typical value*1)
• When the input coupling is AC and
• the input impedance is 50 Ω: 680 kHz to 200 MHz (Typical value*1)
• the input impedance is 1 MΩ: 35 Hz to 200 MHz (Typical value*1)
Internal jitter
100 ps rms
Minimum input pulse width 3 ns
Operating voltage range -5 V to 5 V
Maximum input voltage
• When the input impedance is 50 Ω: 5 Vrms
• When the input impedance is 1 MΩ and
• DC≤input frequency≤100 kHz: 40 V (DC+ACpeak)
• 100kHz<input frequency≤100 MHz: {3.5/f+5}V(DC+ACpeak), where f is frequency in units
of MHz
• Over voltage category:I and II
Input sensitivity*2
100 mVp-p
Input amplifier noise
400 µVrms (Typical value*1)
Trigger
• Trigger mode: Select from single auto trigger, repeat auto trigger, and manual trigger
• Trigger level (during manual trigger)
• Range: -5 V to 5 V(Selectable using panel operation during manual trigger)
• Accuracy*2: ±(10 mV+1% of specified value)
• Resolution: 1 mV
• Trigger level (during single auto trigger and repeat auto trigger)
• Range: 0% to 100%
• Resolution: 1%
• Input signal conditions during single auto trigger and repeat auto trigger: Continuous signal
between 1 kHz and 50 MHz
• Time to set the single auto trigger and repeat auto trigger: 0.7 s (Typical value*1)
Sampling
• Sampling mode: Select time stamp mode or hardware histogram mode
• Maximum sampling rate
43 MS/s continuous sampling (approx. 23 ns intervals)
• Maximum sampling size (Maximum number of data points)
• During time stamp mode: 512,000
• During hardware histogram mode: 109
• Sampling interval
0 µs, 1 µs to 1s (Resolution: 1 µs)
If 0 µs is selected, the sampling interval is set to the interval of the maximum sampling rate
(approx. 23 ns).
Select only during the time stamp mode.
• Longest sampling period
When the sampling interval is set to 0 µs:
320 s (Time after arming)
When the sampling interval is other than 0 µs or when the mode is set to hardware histogram
mode:
3200 s (Time after arming)
*1: Typical values represent typical or average values. They are not strictly guaranteed.
*2: A value measured with the input coupling set to DC, input impedance set to 1 MΩ, under standard operating conditions as
described in “General Specifications,” and after the warm-up time has passed.
15
IM 704310-01E
15-1
15.2 Measurement Functions (Measurement Items)
Item
Measurement update
rate*1
Frequency
Time interval
• AtoB interval
Specification
400 ms (hardware histogram mode only)
Update rate when measuring the period of a 1-MHz sine wave with the sampling size (number of
events) set to 1000.
• Measurement range
• Time stamp mode: 8 ns to 20 ms
• Hardware histogram mode: 8 ns to 3.2 µs
• Display resolution
• Time stamp mode: 25ps
• Hardware histogram mode: Larger of the two values, 25 ps or (histogram X-axis span/600)
• Measurement resolution*1
• Time stamp mode: ±100 ps rms± 2 x trigger error*2
• Hardware histogram mode:
±(Larger of the two values, 100 ps rms or the display resolution)± 2 x trigger error*2
• Accuracy*1
± measurement resolution ±(time base frequency stability x measured value)±300 ps
systematic error
• Slope: Select ↑ or ↓
•
•
•
•
•
•
15-2
Measurement range
• Time stamp mode: 0 ns to 20 ms
• Hardware histogram mode: 0 ns to 3.2 µs
Display resolution
• Time stamp mode: 25 ps
• Hardware histogram mode: Larger of the two values, 25ps or (histogram X-axis span/600)
Measurement resolution*1
• Time stamp mode and
• the slope is A B / A B / A B / A B :
±100 ps rms±A input trigger error *2±B input trigger error*2
• the slope is A B / A B :
±100ps rms±A input trigger error*2±B input trigger error*2±trigger level timing error*3
• Hardware histogram mode and
• the slope is A B / A B / A B / A B :
±(larger of the two values, 100 ps rms or display resolution)±Ainput trigger error*2±B
input trigger error*2
• the slope is A B / A B :
±(larger of the two values, 100 ps rms or display resolution)±Ainput trigger error*2±B
input trigger error*2±trigger level timing error*3
Accuracy*1
±measurement resolution±(time base frequency stability x measured value)±1 ns
systematic error
Slope: Select from A B / A B / A B / A B / A B / A B
Continuous measurement condition*1: The time to the next edge of signal A after AtoB
measurement is 13 ns or more and the time from the
previous edge of signal A is 23 ns or more
IM 704310-01E
15.2 Measurement Functions (Measurement Items)
Item
Pulse width
*1:
*2:
*3:
±
Specification
• Measurement range
• Time stamp mode: 8 ns to 20 ms
• Hardware histogram mode: 8 ns to 3.2 µs
• Display resolution
• Time stamp mode: 25 ps
• Hardware histogram mode: Larger of the two values, 25 ps or (histogram X-axis span/600)
• Measurement resolution*1
• Time stamp mode and
• the polarity is
or
:
±100 ps rms±rising trigger error*2±falling trigger error*2
• the polarity is
:
±100 ps rms±rising trigger error*2±falling trigger error*2±trigger level timing error*3
• Hardware histogram mode and
or
:
• the polarity is
±(Larger of the two values, 100 ps rms or the display resolution)±rising trigger error*2
±falling trigger error*2
• the polarity is
:
±(Larger of the two values, 100 ps rms or the display resolution)±rising trigger error*2
±falling trigger error*2±trigger level timing error*3
• Accuracy*1
±Measurement resolution±(time base frequency stability x measured value)±1 ns
systematic error
• Polarity: Select from
/
/
A value measured under standard operating conditions as described in "General Specifications" after the warm-up time
has passed.
Trigger error, A input trigger error, B input trigger, rising trigger error, and falling trigger error are defined by the following
equation
X : Input amplifier noise
2
2
X +E n
En : Noise on the measured signal
S.R: Slew rate of the input signal (V/s)
S.R
The trigger level timing error is defined by the following equation.
8 mV
slew rate of the start signal
–
8 mV
slew rate of the stop signal
±
trigger level setting accuracy trigger level setting accuracy
±
slew rate of the start signa
slew rate of the stop signal
Specifications
15
IM 704310-01E
15-3
15.3 Gate, Arming, and Inhibit
Item
External arming input
(shared with the external
gate)
Specification
• Connenctor type: BNC
• Input coupling: DC
• Input impedance: 1 MΩ (Typical value*1)
• Trigger level: TTL (1.4 V), TTL/10 (0.14 V), 0 V
• Maximum input voltage: 40 V (DC+ACpeak)
• Minimum input pulse width: 30 ns
• Setup time: 50 ns (For the arming to become effective, the arming signal must arrive at least
50 ns earlier than the measurement signal.)
Inhibit input
• Connector type: BNC
• Input coupling: DC
• Input impedance: 1 MΩ (Typical value*1)
• Trigger level: TTL (1.4 V), TTL/10 (0.14 V), 0 V
• Maximum input voltage: 40 V (DC+ACpeak)
• Minimum input pulse width: 30 ns
• Setup time: 50 ns (For the inhibit to become effective, the arming signal must arrive at least 50
ns earlier than the measurement signal.)
Gate
• Type: Select from EVENT, TIME, and EXTERNAL
• Configurable number of events during event gate (except within the longest sampling time)
• Time stamp mode: 1 to 512,000
• Hardware histogram mode: 1 to 109, accuracty: ±1
• Configurable gate time range during time gate (except within the maximum number of events
of each sampling mode)
1 µs≤ gate time ≤10 s (Resolution: 100 ns)
• Allowable time during external gate
1 µs to 320 s (except within the maximum number of events of each sampling mode)
Polarity: Select
or
Arming
• Arming source: Select AUTO or EXT
• EXT settings
• Delay time range during time delay
1 µs≤ delay time ≤1 s (Resolution: 100 ns)
• Range during event delay
1 to 106
• Slope: Select ↑ or ↓
Inhibit
• Effective time: 1 µs to 320 s
(1 µs to 3,200 s when the sampling mode is set to other than 0 µs or the sampling mode is set
to Hardware histogram mode)
• Polarity: Select
or
*1: Typical values represent typical or average values. They are not strictly guaranteed.
15.4 Block Sampling
Item
Specification
Range of number of blocks Time stamp mode: 1 to 100
Hardware histogram mode: 1 to 1000
However, the number of samples that can be measured is determined by the maximum sampling
size for each mode.
Block pause mode
Select OFF, Time, or Event
Block pause time
RestTime: OFF, 1µs to 1 s (Resolution 100 ns)
RestEvent: OFF, 1 to 106 (Resolution 1, Except the pause time is 500 ns or more and the
frequency is 50 MHz or less)
Conditions on use
Cannot use this function together with the external gate or the inter-symbolic interference analysis
function. Event gate must be two or more.
15-4
IM 704310-01E
15.5 Display
Item
Display
Specifications
Specification
• Size: 6.4 inch
• Resolution: 640 (H)x 480 (V) dots
• Defect: 0.01% or less with respect to the total number of pixels
Display format
• Time stamp mode: Select from histogram, list, time variation, and statistics
• Hardware histogram mode: Select from histogram, list, and statistics
Histogram display, during time stamp mode
• Scale: X- and Y-axis settings of the histogram
• X CENTER (center value of X-axis) range
-50 ns to 20.000000000 ms
• X Span
Select from 1.5, 3, 7.5, 15, 30, 60, 150, 300, 600 ns, 1.5, 3, 6, 15, 30, 60, 150, 300, 600 µs,
1.5, 3, 6, 15, and 30 ms
• Y Axis (Y-axis scale): Select Lin (linear) or Log (logarithmic)
• Y High (Maximum value of Y-axis)
• When the Y-axis scale is Lin: Select from10, 20, 40, 100, 200, 400, 1000, 2000, 4000,
10000, 20000, 40000, 100000, 200000, 400000, 1e6, 1e7, 1e8, and 1e9
• When the Y-axis scale is Log: Select from 101, 102, 103, 104, 105, 106, 107, 108, and 109
• Readout: Values can be read by placing the X marker over the waveform (Marker display can
be turned ON/OFF)
Y marker: Statistical calculation area can be specified by setting the frequency
(Marker display can be turned ON/OFF)
• Statistical display (Can be turned ON/OFF)
• Area: Select the area, Window or Marker, on which to calculate the statistics.
Select the polarity,
,
, or
when measuring
Select the slope, A B , A B , or A B when measuring A B
Select the slope, A B , A B , or A B when measuring A B
• T Value: Set the T value of the statistical calculation
Range: 1 ns to 250.000 ns
Histogram display, during hardware histogram mode
• Scale: X- and Y-axis settings of the histogram
• X CENTER (center value of X-axis) range: -50 ns to 3.2 µs
• X Span: Select from 1.5, 3, 7.5, 15, 30, 60, 150, 300, 600ns, 1.5, 3, and 6 µs
• Y Axis (Y-axis scale): Select Lin (linear) or Log (logarithmic)
• Y High (Maximum value of Y-axis)
• When the Y-axis scale is Lin: Select from 10, 20, 40, 100, 200, 400, 1000, 2000, 4000,
10000, 20000, 40000, 100000, 200000, 400000, 1e6, 1e7, 1e8, and 1e9
• When the Y-axis scale is Log: Select from 101, 102, 103, 104, 105, 106, 107, 108, and 109
• Readout: Values can be read by placing the X marker over the waveform (Marker display can
be turned ON/OFF)
Y marker: Statistical calculation area can be specified by setting the frequency
(Marker display can be turned ON/OFF)
• Statistical display (Can be turned ON/OFF)
• Area: Select the area, Window or Marker, on which to calculate the statistics.
Select the polarity,
,
, or
when measuring
Select the slope, A B , A B , or A B when measuring A B
Select the slope, A B , A B , or A B when measuring A B
• T Value: Set the T value of the statistical calculation
Range: 1 ns to 250.000 ns
• Multi-window: The data of multiple histograms can be analyzed.
Window size range: 1 to 16
• Auto window: The data of multiple histograms are analyzed automatically.
• Panorama display: Enables the user to observe an overall view of the histograms
• Panorama display can be turned ON/OFF
• Panorama area selection: The range of 0 to 3.2 µs can be divided into eight sections
• Histogram sum (for multi-window and auto window only)
The center values of the X-axis of the histogram of each window are aligned and the
frequencies of each bin are summed.
15
IM 704310-01E
15-5
15.5 Display/15.6 Auto Window Function
Item
Specification
Time variation display (during time stamp mode only)
• Scale: X- and Y-axis settings of time variation displays
• X Min (Minimum value of X-axis) range: 0 to 3200.0000000 s
• X Span (Maximum value of X-axis): Select from 6, 12, 30, 60, 120, 300, 600 µs, 1.2, 3, 6,
12, 30, 60, 120, 300, 600 ms, 1.2, 3, 6, 12, 30, 60, 120, 300, 600, 1200, 3000, 6000 s
• Y Center(Center value of Y-axis) range: -50 ns to 20.000000000 ms
• Y Span: Select from 500 ps, 1, 2.5, 5, 10, 20, 50, 100, 200, 500 ns, 1, 2, 5, 10, 20, 50, 100,
200, 500 µs, 1, 2, 5, 10, 20 ms
• Readout: Values can be read by placing the X and Y markers over the waveform
• Statistical display (Can be turned ON/OFF)
• Area: Select the area, Window, Marker, or Block, on which to calculate the statistics.
• Display parameter: Grid and interpolation display can be turned ON/OFF
Plot marks can be set to Pixel or Mark
• Time resolution of X-axis (time stamp): 100 ns (When the sampling interval is other than 0 µs,
it is 1 µs)
List display, during time stamp mode
Lists the time stamps and the measured values at those times
The list can be displayed for each block when block sampling is being used.
• The displayed data can be scrolled.
• Resolution of time stamps: 100 ns (When the sampling interval is other than 0 µs, it is 1 µs)
List display, during hardware histogram mode
Lists the measured values (histogram class values) and frequencies
The displayed data can be scrolled.
Statistics display, during time stamp mode
When calculating statistics on a histogram
Statistical parameters: Average, Maximum, Minimum, Peak-Peak, σ, σ/Average, σ/T, E.L.Error,
MELE, Median, Mode, and Number
When calculating statistics on time variation data
Statistical parameters: T.Average, T.Maximum, T.Minimum, T.Peak-Peak, T.σ, T.σ/Average, T.(PP/Average), T.RF, and T.Num
Statistics display, during hardware histogram mode
Statistical parameters: Average, Maximum, Minimum, Peak-Peak, σ, σ/Average, σ/T, E.L.Error,
MELE, Median, Mode, and Number
15.6 Auto Window Function
Item
Auto window function
Specification
A function in which the window size, scale, and area are automatically configured by measuring
the T value and considering the modulation method.
Modulation method
EFM modulation, EFM+modulation, and 1-7 modulation
T Value calculation method Measured T: Automatically measure the value of the constant T from the clock input signal of
CHB
Estimated T: Estimate the value of the constant T from the input signal and the modulation
method
Operating conditions Measured T: CHB input 1025 cycles or more
Estimated T: Data rate 43 MS/s or less, sampling rate 1.6 s or less
T measurement range
8 ns to 250 ns
T resolution
Measured T: 12.8ps
15-6
IM 704310-01E
15.7 Inter-symbol Interference Analysis Function
(Option)
Item
Function
Measurement conditions
Extraction mode
Trigger
Target
Specification
A function in which the data around the specified space or mark are extracted and the histogram
and statistics of the data are displayed.
In the time stamp mode measuring the pulse width with the polarity set to
Select from Single, Combination, and Between
Select mark or space
Select the data to be analyzed for the trigger from Prev., Next, and Both
15.8 Rear Panel Input/Output
Item
Reference input
Specification
• Connector type: BNC
• Input coupling: AC
• Input impedance: 1 kΩ or more
• Input frequency range: 10 MHz±10 Hz
• Input level: 1 Vp-p or greater
• Maximum input voltage: ±10 V
Reference output
• Connector type: BNC
• Output coupling: AC
• Output impedance: 50 Ω (Typical value*1)
• Output frequency: 10 MHz (Typical value*1)
• Output level*2: 1 Vp-p or greater
Monitor output (CHA/CHB) • Connector type: BNC
• Output impedance: 50 Ω (Typical value*1)
• Output level*2: Approx. one-fourth of the input signal (±5 V or less)
*1: Typical values represent typical or average values. They are not strictly guaranteed.
*2: The level when the input impedance of the receiving side is 50 Ω.
15.9 GP-IB Interface
Specification
GP-IB
Conforms to IEEE St’d 488-1978(JIS C 1901-1987)
SH1, AH1, T6, L4, SR1, RL1, PP0, DC1, DT1, C0
Conforms to IEEE St’d 488.2-1992
ISO (ASCII) code
Addressable mode
0 to 30
The remote mode can be cleared by pressing the LOCAL (SHIFT+AUTO SCALE) key (except
when Local Lockout is in effect)
Specifications
Item
Interface
Electrical and mechanical
specifications
Functional specifications
Protocol
Code
Mode
Address
Remote mode clear
15
IM 704310-01E
15-7
15.10 SCSI (Option)
Item
Specification
Standard
SCSI(Small Computer System Interface).ANSIX3.131-1986
Connector
50-pin half pitch (pin type)
Connector pin assignmentsUnbalanced (single-ended), built-in terminator
Compatible SCSI devices* HD drive: NEC MS-DOS ver3.3 or later or SCSI HD drives that can be formatted with EZ-SCSI
MO drive: 128, 230, and 640 MB drives, MO medium uses semi-IBM format.
ZIP drive
PD drive
*1 For details on which devices can be connected, ask your YOKOGAWA dealer.
15.11 Time Base
Item
Internal reference
frequency (clock)
Frequency stability
External adjustment
Specification
10-MHz temperature-compensated crystal oscillator
Aging rate: ±1.5 ppm/year
Temperature characteristics: ±2.5 ppm in the range from 5 to 40°C with 25°C as the reference
Possible
15.12 Internal Memory Function
Store and recall 10 sets of setup information in the nonvolatile memory.
15-8
IM 704310-01E
15.13 Built-in Printer
Item
Printing format
Dot density
Paper width
Recording width
Specification
Thermal line dot method
8 dots/mm
112 mm
104 mm
15.14 Built-in Floppy Disk Drive
Item
Drive type
Number of drives
Format type
Specification
3.5-inch floppy disk
1
640 KB, 720 KB, 1.2 MB, 1.44 MB (MS-DOS compatible)
15.15 Internal Hard Disk Drive (Option)
Item
Specification
Number of drives
1
Capacity
3.2 GB (IBM format)
*
The hard disk can be mounted on a PC (Windows 95 compatible)
Specifications
15
IM 704310-01E
15-9
15.16 General Specifications
Item
Safety standard
Standard operating
conditions
Operating altitude
Warm-up time
Storage conditions
Operating conditions
Rated supply voltage
Specification
Complies with EN61010-1
• Overvoltage category I and II
• Pollution degree 1 and 2
• Ambient temperature: 23±2°C
• Ambient humidity: 50±10%RH
• Power voltage and frequency error: Less than 1% of the ratings
2000 m or less
Approx. 30 minutes
• Temperature: -20 to 60°C
• Humidity: 20 to 80%RH (no condensation)
• Temperature: 5 to 40°C
• Humidity: 20 to 80%RH (no condensation)
100 to 120 V AC (suffix code -1)
200 to 240 V AC (suffix code -5)
90 to 132 V AC (suffix code -1)
180 to 264 V AC (suffix code -5)
50/60 Hz
Permitted supply voltage
range
Rated supply voltage
frequency
Permitted supply voltage 48 to 63 Hz
frequency range
Maximum power
200 VA
consumption
Withstand voltage
1.5 kV AC for one minute
(between power supply and case)
Insulation resistance
10 MΩ or more at 500 V DC
(between power supply and case)
Signal ground
All input/output connectors must be grounded to the case
External dimensions
Approx. 213 (W)x266 (H)x350 (D) mm, excluding projections
Weight
Approx. 10 kg (main unit only)
Cooling method
Forced air cooling
Installation position
Horizontal (no stacking of instruments)
Battery backup
Setup and clock information are backed up by internal lithium batteries.
Fuse*1
Location Maximum Rated Voltage Maximum Rated Current Type
Inlet
250 V
3A
Time lag
CPU board 250 V
800 mA
Time lag
Standard accessories
Safety standard*2
Emission*2
15-10
Standard
UL, CSA certified
VDE/SEMKO
certified
• Power cord 1 piece
• Rubber feet: 2 pieces
• 1 roll of printer paper
• User’s Manual 1 piece (this manual)
• GP-IB Interface User’s Manual 1 piece
Complying standard
EN61010-1
Overvoltage Category (Installation Category)II*3
Pollution degree 2*4
Complying standard
EN55011-Group1 Class A
This is a Class A product(for industrial environment). In a domestic
environment this product may cause radio interference in which case
the user may be required to take adequate measures.
IM 704310-01E
15.16 General Specifications
Item
Immunity*2
Specification
Complying standard
EN61326-1:1995
Cables condition
The applied BNC cable, GP-IB cable and SCSI cable must be shorter
than 3 meters.
The user cannot replace the fuse that is located inside the case. If you believe the fuse inside the case is blown, contact
your nearest YOKOGAWA dealer.
Applies to products manufactured after Aug. 1999 having the CE Mark. For all other products, please contact your
nearest YOKOGAWA representative.
Overvoltage Categories define transient overvoltage levels, including impulse withstand voltage levels.
Overvoltage Category I : Applies to equipment supplied with electricity from a circuit containing an overvoltage control
device.
Overvoltage Category II : Applies to equipment supplied with electricity from fixed installations like a distribution board.
Pollution Degree : Applies to the degree of adhesion of a solid, liquid, or gas which deteriorates withstand voltage or
surface resistivity.
Pollution Degree 1 : Applies to closed atmospheres (with no, or only dry, non-conductive pollution).
Pollution Degree 2 : Applies to normal indoor atmospheres (with only non-conductive pollution).
•
*1
*2
*3
*4
Specifications
15
IM 704310-01E
15-11
15.17 External Dimensions
Rear View
213
23
327
28
20
266
12
Unless specified otherwise, the tolerance is ±3%. However, in cases of less than 10 mm, the tolerance is ±0.3 mm.
15-12
IM 704310-01E
Index
Symbols
D
1-7 ..................................................................................... 8-14
Data compression ............................................................. 12-8
Data size .................................................. 11-11, 11-15, 11-17
A
Dot Type .............................................................................. 7-6
Adjustment function .................................................. 7-11, 8-9
date ................................................................................... 3-10
Alert messages ................................................................. 14-2
delete .................................................................. 11-18, 11-20
Area .................................................................................. 7-10
directory .............................................................. 11-11, 11-25
data type ......................................................................... 11-14
Area Max ............................................................................. 8-8
Area Min .............................................................................. 8-8
Arrow keys .......................................................................... 4-3
E
Ascii ................................................................................ 11-14
EFM .................................................................................. 8-14
Auto Window ..................................................................... 8-13
EFM+ ................................................................................ 8-14
Auto naming .................................................................... 11-11
ESC key .............................................................................. 4-4
Auto scaling ............................................................ 7-16, 8-19
Error Logging .......................................................... 1-26, 14-4
Auto window function ........................................................ 1-24
Error messages ................................................................. 14-2
arming ......................................................................... 1-9, 6-9
Estimated T ............................................................. 1-24, 8-14
attribute ........................................................................... 11-20
Event gate ........................................................................... 1-8
auto scaling ....................................................................... 1-24
External gate ....................................................................... 1-8
extension .................................................. 11-11, 11-14, 11-17
B
external arming input terminals ........................................... 6-9
Between .............................................................................. 9-5
extracted data ..................................................................... 9-5
Bin ................................................................................... 11-14
extraction ............................................................................ 9-5
external gate input terminals ............................................... 6-2
Block Diagram ..................................................................... 1-1
block number .............................................................. 7-4, 7-6
block sampling ............................................................ 1-7, 6-5
F
block size ............................................................................ 6-6
Filter .................................................................... 11-11, 11-20
brightness ......................................................................... 13-8
Floppy Disks ..................................................................... 11-1
Frequency distribution ....................................................... 1-18
C
Front Panel ......................................................................... 2-1
format ...................................................................... 11-6, 11-7
Calculation Polarity ................................. 7-2, 7-14, 8-2, 8-17
Calculation Slope .................................... 7-2, 7-14, 8-2, 8-17
Calibration ......................................................................... 1-26
G
Center value ........................................................................ 2-4
Graph Parameter ................................................................ 7-6
Changing the file name ................................................... 11-24
Graph Size .......................................................... 7-2, 7-6, 8-2
Combination ........................................................................ 9-5
Grid ..................................................................................... 7-6
Connect ............................................................................... 7-6
gate ............................................................................. 1-8, 6-2
Copies the X-axis setting .................................................. 8-15
Creates a directory .......................................................... 11-25
calculation area ....................................................... 7-13, 8-17
H
calculation polarity .................................................. 7-14, 8-17
HDD Motor ........................................................................ 11-2
calibration .......................................................................... 13-4
Half tone ............................................................................ 12-8
compression ...................................................................... 12-8
Hardware histogram mode .......................................... 1-4, 5-1
connecting the power .......................................................... 3-5
Histogram .......................................................... 1-18, 7-1, 8-1
Index
copy ................................................................................ 11-21
I
ID number ......................................................................... 11-4
IM 704310-01E
Index-1
Index
Index
ISI .............................................................................. 1-26, 9-2
Overlap ....................................................................... 7-2, 8-2
Initial settings .................................................................... 13-2
optional accessories ............................................................. iii
Inter-symbol Interference Analysis Function ............. 1-26, 9-1
Internal Memory ................................................................ 10-1
icon ..................................................................................... 2-3
P
inhibit ....................................................................... 1-10, 6-12
Panorama display ........................................... 1-22, 7-10, 8-8
inhibit input terminals ........................................................ 6-12
Paper feed ........................................................................ 12-5
input coupling .......................................................... 1-11, 6-14
Partition ............................................................................. 11-7
input impedance ...................................................... 1-11, 6-14
Period Measurement ................................................... 1-5, 5-2
Power Switch ...................................................................... 3-6
K
Printing .............................................................................. 12-4
keyboard ............................................................................. 4-2
Pulse Width Measurement .......................................... 1-5, 5-5
Properties ........................................................................ 11-11
panorama window ............................................................. 1-22
L
pause time .......................................................................... 6-6
LCD monitor ...................................................................... 13-8
position ...................................................................... 7-10, 8-8
List .................................................................... 1-19, 7-3, 8-3
printer cover ...................................................................... 12-3
polarity ...................................................................... 5-6, 6-12
lithium battery ...................................................................... 3-6
load ..................................................................... 11-10, 11-13
Q
M
Quick ................................................................................. 11-7
MODEL .................................................................................. ii
R
Manual scaling .............................................. 1-24, 7-16, 8-19
Manual trigger ................................................................... 1-12
RESET key .......................................................................... 4-4
Maximum sampling size .................................................... 15-1
ROM version ..................................................................... 13-6
Measured T ............................................................. 1-24, 8-14
Rack mount ......................................................................... 3-4
Measurement Functions ..................................................... 1-5
Readout Function .............................................................. 1-13
Measurement channel ................................................ 5-2, 5-6
Rear Panel .......................................................................... 2-2
Measurement range ............................................ 5-2, 5-3, 5-6
Recalled ............................................................................ 10-2
Monitor output ......................................................... 1-25, 13-5
Reference Signal .............................................................. 6-15
Multi-window function ........................................................ 1-23
Reference input ....................................................... 1-12, 1-25
main window ..................................................................... 1-22
Reference output .................................................... 1-12, 1-25
mark .................................................................................... 9-5
Repeat auto trigger ........................................................... 1-12
marker ........................................................... 1-13, 7-19, 8-21
RestEvent ........................................................................... 6-6
measurement block ............................................................. 1-6
RestTime ............................................................................. 6-6
measurement results ...................................................... 11-12
read out ................................................................... 7-19, 8-21
memory number ................................................................ 10-1
reference input terminal .................................................... 6-15
messages .......................................................................... 14-2
release arm ....................................................................... 12-2
modulation ........................................................................ 8-14
roll paper ................................................................. 12-1, 12-2
movable holder ................................................................. 12-2
rotary knob .................................................................. 4-2, 4-4
multi-window ........................................................... 1-23, 8-10
S
N
SCSI .................................................................................. 11-3
Normal .............................................................................. 11-7
SCSI ID number ................................................................ 11-4
Num .................................................................................. 1-13
SCSI devices .................................................................... 11-3
Number ............................................................................... 8-6
Scale Value ............................................................. 7-15, 8-18
numerical keys .................................................................... 4-2
Selecting the directory .......................................... 11-8, 11-11
Self-test ................................................................... 1-26, 14-5
O
Setup Condition ................................................................ 13-6
Output data format ............................................................ 12-8
Single auto trigger ............................................................. 1-12
Index-2
Single .................................................................................. 9-5
IM 704310-01E
Index
Soft key menu ..................................................................... 2-4
Stat Item .............................................................................. 7-8
Statistical calculation parameters ..................................... 1-14
Statistical parameter ............................... 7-8, 7-13, 8-6, 8-17
Statistics ............................................................ 1-21, 7-7, 8-5
Stored ............................................................................... 10-1
Style .................................................... 7-2, 7-6, 7-8, 8-2, 8-6
Summation ........................................................................ 8-12
Summation display ............................................................ 1-23
sampling interval ......................................................... 1-8, 6-4
sampling mode ............................................................ 1-4, 5-1
save .......................................................... 11-8, 11-12, 11-16
screen image .................................................................... 12-8
setup information .............................................................. 11-8
slope ........................................................................... 5-2, 5-3
soft key menu ...................................................................... 4-4
space .................................................................................. 9-5
standard accessories ............................................................ iii
start the measurement ........................................................ 4-1
statistical calculation ......................................................... 1-14
statistical calculation area ....................................... 7-13, 8-17
stop the measurement ........................................................ 4-1
T
T.Num ................................................................................ 1-13
Time Interval Measurement ........................................ 1-5, 5-3
Time Variation ........................................................... 1-20, 7-5
Time gate ............................................................................ 1-8
Time stamp mode ....................................................... 1-4, 5-1
Trigger Mode ..................................................................... 1-12
time ................................................................................... 3-10
trigger level ............................................................. 1-12, 6-14
U
Updating the window ......................................................... 8-11
W
Warning messages ........................................................... 14-2
WindowNum ...................................................................... 8-12
warning display ................................................................. 13-8
window mode .................................................................... 8-11
window size ....................................................................... 8-11
Z
zoom box .......................................................... 1-22, 2-4, 8-8
zoom span ................................................................ 7-10, 8-8
Index
Index
IM 704310-01E
Index-3