1
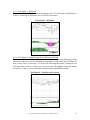
The KaseCD is a sensitive, second derivative study, calculated in the same way as the
MACD histogram is calculated from a moving average oscillator. Namely, the KaseCD is
the difference between the PeakOscillator and its average, just as the MACD is the
difference between an exponential moving average oscillator and its average. Because the
KaseCD automatically adapts to changing market conditions, it can be seen to generate
cleaner crossover signals and more reliable divergences than the MACD.
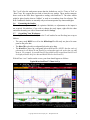
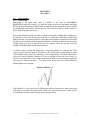
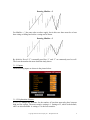
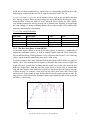
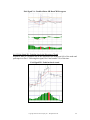
Automated Divergence Function - The Kase PeakOscillator and KaseCD include an
algorithm that automatically draws bullish and bearish divergences between both price
and momentum peaks. Divergences for the Kase PeakOscillator are defaulted to plot as
green lines and for the KaseCD as red lines.
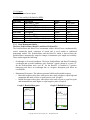
3.2.3.1 Inputs:
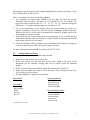
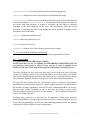
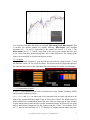
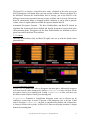
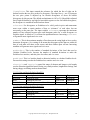
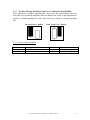
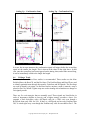
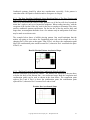
The Kase PeakOscillator (left) and KaseCD (right) come set up with the default values
pictured below:
3.2.3.2 Explanation of Inputs:
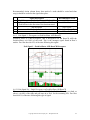
ShowAllDivs: Many times, after a divergence has taken place, additional divergences
will form from the same starting peak. Setting ShowAllDivs to true will show all the
divergences from a given starting peak. Setting ShowAllDivs to false will show only
the most recent divergence from a given starting peak
slopeFilter: Rounded or insignificant histogram peaks can be filtered out by
requiring a certain slope, in terms of percent of the histogram value to be met. If that
slope is less than slopeFilter, the peak is considered too shallow and is filtered out.
A setting of 0 filters out no peaks. A filter of 0.01 filters out all peaks less than 1% higher
than the surrounding data.
Copyright 2010 Kase and Company, Inc. All Rights Reserved.
11