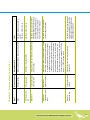
1
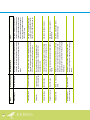
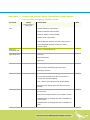
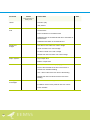
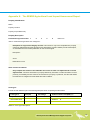
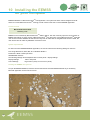
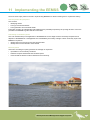
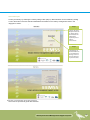
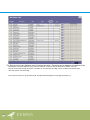
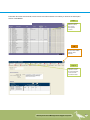
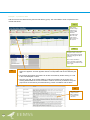
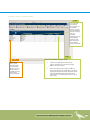
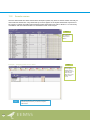
Estuary Entrance Management Support System
85
Conservation status
of plants
Conservation status
of fish and birds
Birds & fish
Rare and
threatened flora
Fish species lists
Fish & economic
fish
Map of EVCs
adjacent to estuary
Bird species lists
Birds
Ecological
Vegetation Classes
(EVC)
Information required
Asset
Advisory list of rare and threatened plants in
Victoria 2005
Department of Primary Industries website - Victoria
Resources Online. A Biodiversity Interactive Map
on the website allows users to display a number
of vegetation themes for any area of Victoria
- including Ecological Vegetation Classes (EVCs),
1750 EVCs, broad EVC Groups and Bioregional
Conservation Status of EVCs. The scale at which
data is represented varies across the state and
further surveys may be required on some estuaries.
If further detail is required, mapping of EVCs at a
scale of 1:10 000 is recommended
Advisory list of rare and threatened vertebrate fauna
in Victoria 2003
DSE Atlas of Victorian Wildlife
Birds Australia or the DSE Atlas of Victorian Wildlife
Information details
Appendix I. Sources of asset information
http://www.dse.vic.gov.au/dse/nrenpa.
nsf/LinkView/996B0477753A4204CA
256DD4007F1CA528E305DE442CA
C684A256DEA0024ACF6
http://www.dpi.vic.gov.au/dpi/vro/
vrosite.nsf/pages/vegetation
http://www.dpi.vic.gov.au/CA256F31
0024B628/0/58D93F149297811DCA
25710D0024AADE/$File/Advisory+
List+of+Threatened+Vertebrate+
Fauna+in+Victoria+-+2003.pdf
http://www.viridans.com.au
http://www.birdata.com.au/home_
top.html:
http://www.viridans.com.au
Links
86
EEMSS
Property boundaries
Location and size
of stormwater pipes
Important sites
Important sites
Minimum freshwater
inflow
Important dates
Stormwater
Cultural heritage
Indigenous culture
Freshwater flow
Identify dates of
major social events
Road classification
Roads/bridges
Agricultural land
Information required
Asset
Identify any dates that will potentially affect the
threat score assigned for opening or not opening the
estuary
Minimum river discharge required for an effective
artificial river mouth opening can be determined
using historical data. Victorian river discharge data
is available at the Victorian Water Resources Data
Warehouse.
Contact details are available at Aboriginal Affairs
Victoria
Victorian Heritage Register & Victorian Heritage
Inventory. Also contact local municipal councils
The internal diameter of stormwater pipes that
discharge to estuaries is available from local
municipal councils
See ‘Agricultural Land Impact Assessment Report’.
Cadastral property maps are available through the
DSE Corporate Geospatial Database Library
For arterial roads see ‘maps of declared roads’ at
Vic Roads. Local road classifications are available
from the local municipal council’s Register of Public
Roads
Information details
http://www.vicwaterdata.net/vic
waterdata/home.aspx
http://www.dvc.vic.gov.au/AAV/
INDEX.HTM
http://www.heritage.vic.gov.au
http://www.nre.vic.gov.au/land/lcnlc
2.nsf/FID/-9A2C348B40DC89BC4A
256CB700181D8B?OpenDocument
http://www.vicroads.vic.gov.au/vrne/
vrne5nav.nsf/childdocs/-2BBDC9EF
1E56C40ACA256FD300241C3B-DC
01E44F4F8C5427CA256FD300241
C40-A1FA773045A99B72CA256FE
10042AAEE?open
Links
Appendix J. Assets and critical levels (Australian height datum)
required for assigning threat scores
Asset title
EVC
Details
Insert information to
identify asset
Critical AHD
AHD
Coastal saltmarsh: Lowest AHD
Estuarine wetland: mid point AHD
Estuarine reedbed: mid point AHD
Swamp scrub: Lowest AHD
Littoral rainforest: AHD 30 cm below surface of EVC
Warm temperate rainforest: AHD 30 cm below
surface of EVC
Rare and
threatened flora
Refer to corresponding EVC
Agricultural land
Low land
Intermediate land
High land
Boat ramps
Access affected by inundation
Some problems associated with use of ramp
Boat ramp unusable
Built infrastructure
More than 50 mm above property grounds
Level of the underside of the floor of the house or
commercial / industrial building
100 – 300mm above the floor level of the building
More than than 300mm above the floor level of the
building
Camping
Some loss of camping sites due to inundation of
access tracks
Some loss of camping sites due to inundation of sites
Substantial loss of camping sites due to inundation of
access tracks
Substantial loss of camping sites due to inundation of
sites
Estuary Entrance Management Support System
87
Asset title
Details
Insert information to
identify asset
Jetties
Critical AHD
Access to jetty
Jetty surface
Recreational
land
Some loss of recreational land due to inundation of
access tracks
Some inundation of recreational land
Substantial loss of recreational land due to inundation of
access tracks
Substantial inundation of recreational land
Roads and
bridges
Less than 10 mm water over road or bridge
10-50 mm water over road or bridge
51-300 mm water over road or bridge
Greater than 300 mm water over road or bridge
Septic Systems
Top of septic tank
Bottom of septic tank
Stormwater
Greater than 50 mm above property grounds
Level of the underside of the floor of the house or
commercial / industrial building
100 – 300 mm above the floor level of the building
Greater than 300 mm above the floor level of the
building
Walking tracks
and bridges
Access to track affected by inundation
Inundation causes some problems with use of track
Track unusable
88
EEMSS
AHD
Appendix K. The EEMSS Agricultural Land Impact Assessment Report
Property Identification
Name:
Property Location:
Property ID (Cadastral No):
Property Description
Predominant Agricultural Use 1
2
3
4
5
Select one
refer to ‘Predominant Agricultural Use Categories’
Exceptions to single asset category land use. This section is only to be completed if the property
cannot be categorised using the agricultural use descriptions provided. Please provide a description,
an estimated score and a brief justification for the score assigned.
Description:
Score:
Rationale for score:
Other relevant land details
Only complete this section if the landholder has access to other non-adjoined land or leased
adjoined land – Describe association to property affected by inundation. Include information such as
proximity, accessibility and how land use is relevant to the property, in particular, how the land assists
the landowner to mitigate loss associated with land inundation.
Land Types
Include all land utilised as part of the farming enterprise when completing the table below
Land type #
Area(ha)
Percentage
Estuarine water level (EWL)(m)
High land >
Intermediate land Between
Low land <
&
#Refer to ‘Land Type Descriptions’
Estuary Entrance Management Support System
89
Monthly
threat assessment
Monthly
Threat Assessment
Refer to
‘Threat
Attributes
and Scores’*.
Refer
to ‘Threat
Attributes
and Scores’*. The total threat score is the maximum of the
The total
threat
score
is
the
individual
individual threat scoresmaximum
assigned of
to the
each
attribute threat scores assigned to each attribute
Threat Attributes –
EWL
metres
1. % of low &
intermediate
land
inundated
2.Capability
to mitigate
loss
December
November
October
September
August
July
June
May
April
March
February
January
Month
90
EEMSS
Comments
3. Degree
of
restoration
required
4. Loss of
access to
higher land
Total
threat
score*
Predominant agricultural use categories
Category 1 – Non-agricultural land
Category 2 – Dryland grazing/non irrigated pasture/forestry
These enterprises have low level use of the affected asset areas for agricultural production. The land is part of a
larger extensive grazing or forestry enterprise. If stock are grazed on the land it is for short periods of time during
the year. The impact of inundation is minimal as the farm is run at a low stocking rate with significant alternative
grazing options.
In general this asset will be in lower rainfall areas where pasture production is less than 4 tonnes of dry matter per
hectare per annum. Paddocks used on the affected areas are large (greater than 20 ha).
Category 3 – High rainfall farming/lifestyle farming
These areas are subject to more intensive productive processes. This is achieved through the greater capacity to
produce pasture (4-6 tonnes dry matter per hectare per annum) due to higher rainfall. As a result there is greater
stocking pressure and less alternative grazing options. The enterprise would still be considered to be extensive
grazing. Paddock sizes would be smaller (less than 20ha).
Lifestyle blocks may still be used for income generation but are not considered the primary source of income for
the owners. They are also of smaller area (less than 10 ha). Generally use is for small numbers of production
animals, horses or bush areas. Alternative grazing area may not exist and the use of hand feeding may be
required during periods of inundation.
Category 4 – Mixed grazing – possibly some irrigation
These areas have significant income generation usage. Irrigated land in this category would be land that has
occasional irrigation or is part of a larger area of irrigation that is not threatened with inundation. Mixed grazing
areas would run at reasonably high stocking rates and a significant (greater than 10%) area of the farming
enterprise is threatened by inundation. This area would be a higher rainfall area as in Category 3 above.
Category 5 – Dairy, orchard, vineyard, intensive agriculture or urban residential
– possibly significant irrigation used
These areas are used for intensive agricultural pursuits. The areas affected will usually be greater than 10% of
the total enterprise area. Grazing of dairy cows is at a high stocking rate (greater than 1.5 cows per hectare of
the entire milking area). Orchard and vineyard use is part of a viable enterprise that is a significant part of the
farm business. These enterprises have significant areas of effected land that is capable of being used for this
enterprise. eg. dairy land that is capable of growing 6 tonnes of dry matter of pasture per hectare per year or
potato farming capable of producing yields similar to that of unaffected areas in the same enterprise.
Estuary Entrance Management Support System
91
Land type descriptions
A percentage figure will be used for the loss of utilisation of the assets compared to not having any inundation for
the period in question. This requires an assessment of the potential production from that area of land. Potential
production will be greater on some areas of land than others. For the use in the threat value assessment land
areas will be assigned one of three classifications:
1.
2.
3.
HIGH LAND – Land that is not affected by inundation at all. This classification will be assigned to give an
assessment of the proportion of the farming enterprise affected by inundation.
INTERMEDIATE LAND – Land that is only inundated for short periods of time. These are the higher areas that
are the last areas inundated and the first to have the water recede. These areas will normally have a
capability for production of pasture or crops. These areas of land will be the most affected by decisions in
estuary management.
LOW LAND – These land areas will have minimal productivity due to constant inundation. These are areas that
normally have minimal productive output and are only seen as opportunistic use areas. Plant species that
survive in these areas are of minimal productive use.
Threat attributes and scores
92
Threat score
Threat level
2
Minor
1.
2.
3.
4.
Less than 50% of low land inundated
Loss can be mitigated with minimal extra inputs – eg stock can be moved to other land and no extra bought in feed is required
a) No renovation or extra input required to revert land to previous
productivity following inundation. b) No damage to fences
No loss of access to other high land
3
Moderate
1.
2.
3.
4.
All low land is inundated and less than 20% of marginal land is inundated
Mitigation of losses requires minimal extra inputs – eg stock can be
moved to other land and less than 10% of feed requirements need to
be bought in
a) Minimal input required to return land to previous productivity
– eg weeds sprayed with no extra seed required. b) Debris to be removed
to maintain fence integrity
Access is restricted to less than 5% of the rest of the farming land
4
Major
1.
2.
3.
4.
All low land is inundated and 20-50% of intermediate land is inundated
Stock can be moved to non inundated land but feeding out is difficult
10-50% of feed requirements need to be brought in
a) Pasture renovation is achieved through drilling of appropriate seed
b) Some fence rewiring required
Access to 5-10% of the rest of the enterprise is affected
5
Severe
1.
2.
3.
4.
All low land inundated and greater then 50% of intermediate land
inundated
No suitable land is available for hand feeding and greater than 50%
of stock requirements need to be brought in
a) All land needs to be fully renovated with cultivation and lime or gypsum treatment to address soil quality issues. b) fences need to be replaced
Access is lost to greater than 20% of the farm area
Threat attributes
EEMSS
Threat modifiers
Duration of inundation (DI)
The effect of duration of inundation on the use of a specific agricultural asset is related to the processes of
waterlogging and salinity. The assessment assumes an inundation period of less than 21 days. For periods greater
than 14 days, threat attribute scores will be increased by one.
If a period of other than 14 days is recommended please complete the table below.
Critical duration of inundation (days)
Drought (DR)
Threat modifierrationale
The extent of drought conditions will affect the productive capability of an asset. EEMSS will change the threat
scores to reflect the increased level of threat associated with each level of drought
1.
2.
3.
Local drought (100 km) – Causes a reduction in the productive capability of the entire farming enterprise.
This will result in reduced capability to mitigate losses through decreased production of pasture from high unaffected land. Consequently increased amounts of brought in feed will be required. This will increase
the threat value as assigned by one point.
Regional drought (1000 km) – A reduction in the supply of brought in feeds due to drought in the areas where these feeds are sourced will result in increased prices of these feeds. This will increase the threat value as assigned by 2 points
Continental drought (5000km) - Feed prices will be more severely affected by continental drought.
The effect of a regional drought would be increased costs of transportation of feed from distant areas
Continental drought would result in feed prices being related to the cost of importation of feed from overseas. A continental drought will increase the assigned threat value by 3 points.
The EEMSS will add the threat modifier scores to the total threat score and will not have the capacity to add
the modifier to the individual attribute scores. Therefore, if both modifiers are applicable, that is the property is
experiencing drought and some land has been inundated for greater than the given period, both modifiers will be
added to the threat score.
Estuary Entrance Management Support System
93
94
User Manual
10 Installing the EEMSS
on your computer
EEMSS Database is a Microsoft AccessTM built application. The system has been custom designed and built.
Users do not need Microsoft AccessTM training, but will need to know how to use the EEMSS application.
Current version
Microsoft AccessTM 2000
EEMSS_8.mdb
EEMSS can be accessed by Microsoft AccessTM 2000 or higher. The user must only open the correct version of
EEMSS, depending on which version of Microsoft AccessTM they are using. If using Microsoft AccessTM 2003 the
user must convert the database to that version if they wish to make edits. If using Microsoft AccessTM 2000, the
user will not have to make any database conversions at all.
System requirements
For best use of the EEMSS Database Application, the user should have the following settings on their PC.
PCs using Windows 98, 2000, Me, XP or Windows NT® 4.0
Pentium® 11 MHz or faster processor
256 MB RAM minimum
The following settings can be adjusted via the control panel > display settings.
Display Settings
1024 x 768 pixels
Colour Settings
High Colour (16 bit) or True Colour (32 bit)
Loading the EEMSS onto your PC
To open the EEMSS database, insert the CD and then double click the EEMSS.mdb file as you would any
Microsoft application such as Word or Excel.
96
EEMSS
11 Implementing the EEMSS
There are three major phases involved in implementing EEMSS as a decision making tool for a particular estuary:
Data acquisition & input phase
This involves:
• Identifying assets
• scoring environmental assets
• scoring threats to environmental assets
Information needs to be collected about all assets that are potentially impacted by the opening decision. Forms are
provided in the EEMSS to guide collection of this data.
Community consultation phase
This is an essential step in the application of the EEMSS as it is the stage at which community acceptance and
adoption of the EEMSS as a management tool is facilitated by the estuary manager. Direct community input to the
EEMSS is required to:
• identify and score socio/economic and cultural assets
• identify and score the threats to those assets.
Decision phase
At the time of making an opening decision the manager is required to:
• input data on current estuary conditions
• assess the impact assessment and checklist reports
• communicate the decision and its rationale to the community.
Estuary Entrance Management Support System
97
11.1 Asset descriptions
Data acquisition
The following is a step by step guide to loading your estuary’s asset information into EEMSS. This is done prior to
community consultation. The more complete and up to date the data set entered into EEMSS the better the impact
assessment report will reflect the true impact of the decision.
1. Identify assets on the estuary
The ‘Data requirements’ sheet in the EEMSS includes three forms.
Use these as a guide when collecting data for inclusion in the database.
(see STEP 1).
Use the ‘Information sources’ form (Appendix I ) to compile a complete
list of socioeconomic, cultural and environmental assets for inclusion in the
description section of the EEMSS.
98
2. Identify AHDs at which assets are impacted by raised water
levels
Complete ‘Critical AHDs’ form (Appendix J). If all relevant AHDs are
known, this will ensure that assigning threat scores is a simple procedure
to complete in the workshop. If all relevant AHDs are not known, then
further work may be required to collect any missing data.
3. Investigate solutions, other than
artificially opening the estuary,
to protect inundated assets
This is an essential step. Inclusion of some assets in EEMSS may be
required in the short term while options are investigated. Other solutions
could include: floating jetties & boardwalks; realigning or raising road
levels; moving septics or installation of sewerage systems; raising
stormwater drain outlets or reticulating stormwater; and return of wetlands
on flood affected land.
4. Undertake flood impact
assessments of agricultural land
Assessment of the impact of flooding on agricultural land needs to be
undertaken in consultation with the affected landholder. Landholders
only need to participate if they want their property included on the Impact
Assessment report (and therefore factored into the final decision to open
or not open the estuary mouth). Use of an independent agronomist to
do these assessments is recommended. An ‘Agricultural land impact
assessment proforma’ (Appendix K) is provided by the system for this
purpose. Asset and threat scores are assigned to each property affected
by inundation. Property IDs are used to identify each property in the
EEMSS. The consultant will need to be provided with aerial maps showing
property boundaries and if possible contours indicting the extent of
inundation at various EWLs. The scores assigned are strictly confidential.
A fictitious property should be included for demonstration purposes in the
workshop. See section 6.11
5. Contact Cultural Heritage Officer
The options for including Indigenous cultural values in the EEMSS should
be presented to the Cultural Heritage Officer See section 5.1.
EEMSS
Asset data input
Asset data input
Locate
your
estuary
bybyselecting
estuaries can
canbe
beincluded by adding
Locate
your
estuary
selectingthe
the‘estuary
‘estuarylisting’
listing’button
button (Step
(Step 2).
2). New
New estuaries
included
bythe
adding
a row
to list.
the Relevant
bottom ofCMA
the list.
Relevant
CMAondetails
are added
on the ‘estuary
a row to
bottom
of the
details
are added
the ‘estuary
management’
sheet in the
management’
in the ‘description’ section.
‘description’ sheet
section.
.
Step 1
Click on the Data
Requirements tab
to display forms
that indicate the
information
required prior to
impact
assessments
Step 2
Click Estuary on
the Main Menu to
go to the Estuary
Listing Screen to
view all estuaries
in your database.
Three
filesfiles
are are
provided
to guide
data
collection.
Three
provided
to guide
data
collection.
4
Estuary Entrance Management Support System
99
The Estuary List screen displays many Victorian estuaries. Estuaries can be added to the bottom of the list.
The Estuary List screen displays many Victorian estuaries. Estuaries can be added to the bottom of the list.
The list can be sorted using any field. For example, to sort estuaries by CMA, click on a CMA in the list then
The list can be sorted using any field. For example, to sort estuaries by CMA, click on a CMA in the list then right
right click and choose ‘sort ascending’.
click and choose ‘sort ascending’.
The most recent entry of mouth status, EWL and date is also displayed on this page (see Step 15).
The most recent entry of mouth status, EWL and date is also displayed on this page (see Step 15).
100
EEMSS
Information about the environmental, socioeconomic and cultural assets of an estuary is stored in the ‘description’
section of the EEMSS.
Step 3
Click Descriptions
Button to select
the estuary
descriptions
section.
TIP
Click on the ‘folder’
icon to close
section.
Step 4
Click tabs to enter
separate screens
for environmental,
socioeconomic
and cultural data.
Estuary Entrance Management Support System
101
Example 1. Input of EVC data
list of
was determined by the technical advisory group. The critical EWL to enter is
Example THE
1. Input
of EVCs
EVC data
explained in the ‘Critical AHD sheet
THE list of EVCs was determined by the technical advisory group. The critical EWL to enter is explained in the
‘Critical AHD sheet
Step55
Step
Click
Clickdown
down
arrow
arrowonondrop
drop
down
box
down
boxtoto
select
selectan
anEVC
EVC
from
the
from
the
predefined
predefinedlist.
list.
User
Usercan
canadd
add
newrecords
records
new
wherethey
theysee
see
where
theasterix.
asterix.
the
Step77
Step
Criticalestuarine
estuarinewater
water level
Critical
heightsmust
mustbe
beentered
enteredin
in
heights
thissection.
section.Refer
Refer to ‘Critical
‘Critical
this
AHD’form
form(Appendix
(AppendixG)
G) for
AHD’
guidance
guidance
Userselects
selects the
the EVC
EVC asas
User
aboveand
andthen
thenenters
enters EWL
EWL
above
metresininthe
thefield
fielddirectly
directly
inin
metres
theright.
right.
toto
the
TIPS
TIPS
x v User can view further information in the “Lookups” by clicking the magnifying glass
wherever it appears. A screen appears with the “Lookup table” that can be viewed by the
user.
x v On the EVC page further information can be also be viewed by double clicking on a cell
in the ‘Full Description’ column
x v The user may add to the Lookup table by scrolling to the bottom of the screen and
entering data besides the new record asterix. However, this list is pre-determined by the
project team and should only be edited following careful consultation with the team.
TIP
TIP
EVClookup
lookuptable
table
EVC
displaysall
allthe
the
displays
EVC’s available
available
EVC’s
selectininthe
the
toto
select
database.
database.
7
102
EEMSS
Example 2. Input of recreational assets
Step 8
Select relevant
recreational
assets. There can
be multiple
entries. e.g more
than one walking
track or camping
area. It is
therefore
important to enter
an identifying
name for each.
This will appear
on the impact
assessment report
Step 9
TIP
To delete an
entry : Select
asset then right
click on mouse.
Choose ‘cut’. You
will be asked to
confirm you want
to delete the
record, select OK
Refer to ‘Critical AHD’ form (Appendix G).
v
For the assets ‘Agricultural land’ ,’Roads’,
‘Septics’ and ‘EVCs’, it is critical that a single
EWLs is entered in metres.
v
Not all recreational assets require an EWL. For
those assets that do, this information is used only
to guide the threat assessment. Therefore, all the
relevant information from Appendix B can be
entered here or a summary, such as the range of
water levels.
Estuary Entrance Management Support System
103
11.2 Assets scores
Once the data assets have been entered at the description phase, they are then scored. Please note that you
cannot add new assets here. Only assets that you want to appear on the impact assessment report have to
be scored. For further information about assigning asset and threat scores refer to Section 11.4 ‘Community
consultation’ and also relevant sections on each asset in Part 2 of the report.
.
Step 8
Go to the Estuary
List. Click on
‘Asset Scores’
Button.
Example 1. Assigning asset score to EVCs
Step 9
Asset Scores
screen appears.
Simply click on
each tab to go to
desired asset.
Then go to score
field to enter
scores
Note
104
Some scores like those for EVCs, birds, fish & roads are
automatically entered for you and are set by the
administrator.
EEMSS