1
ChemDraw 15.0 User Guide
ChemDraw 15.0
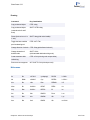
Table of Contents
Recent Additions
Chapter 1: Introduction
About this Guide
Chapter 2: Getting Started
vi
1
1
4
About ChemDraw Tutorials
4
ChemDraw User Interface
4
Toolbars
5
Documents
6
Chapter 3: Page Layout
9
The Drawing Area
9
The Document Type
9
Printing
11
Saving Page Setup Settings
12
35mm Slide Boundary Guides
12
Viewing Drawings
13
Tables
15
Chapter 4: Preferences and Settings
19
Setting Preferences
19
Customizing Toolbars
22
Document and Object Settings
22
Customizing Hotkeys
32
Working with Color
34
Document Settings
38
Chapter 5: Shortcuts and Hotkeys
44
Atom Keys
44
Bond Hotkeys
45
Function Hotkeys
46
© Copyright 1998-2015 PerkinElmer Informatics, Inc. All Rights Reserved.
i
ChemDraw 15.0
Shortcuts
47
Nicknames
50
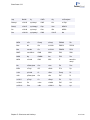
Chapter 6: Basic Drawings
52
Bonds
52
Atoms
57
Captions
58
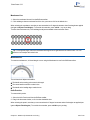
Drawing Rings
67
Chains
69
Objects
71
Clean Up Structure
88
Checking Structures
89
Chemical Warnings
89
Chapter 7: BioDraw (Professional Level only)
92
BioDraw Templates
92
Customizable Objects
95
Chapter 8: Drawing Biopolymers
101
Biopolymer Editor
102
Protecting Groups
103
Pasting Sequences
104
Expanding Sequences
106
Contracting Labels
106
Modifying Sequence Residues
107
Merging Sidechains with Residue
107
Hybrid Biopolymers
110
IUPAC Codes
111
Disulfide Bridges
115
Lactam Bridges
116
Chapter 9: Advanced Drawing Techniques
Coloring Objects
© Copyright 1998-2015 PerkinElmer Informatics, Inc. All Rights Reserved.
118
118
ii
ChemDraw 15.0
Labels
119
Attachment Points
122
Atom Numbering
124
Structure Perspective
125
Mass Fragmentation
126
Drawing Reactions
127
Stoichiometry Grid
133
Templates
136
Defining Nicknames
138
ChemScript
141
Chapter 10: Struct=Name (Professional Level)
143
Struct>Name
143
Name>Struct
147
Chapter 11: Chemistry Features
149
Structure Analysis
149
ChemFinder hotlink
150
Stereochemistry
151
Chemical Annotations
154
Chemical Properties
158
3D Viewing
165
TLC
168
ChemNMR (Professional Level)
173
Chapter 12: ChemDraw/Excel and CombiChem
180
Setting Up ChemDraw/Excel
180
Importing tables
180
Importing hit lists
181
Exporting tables
181
Synchronizing Tables
182
Adding structures
183
© Copyright 1998-2015 PerkinElmer Informatics, Inc. All Rights Reserved.
iii
ChemDraw 15.0
Searching
184
R-Group analysis
185
Working with Structures
186
ChemDraw/Excel Functions
188
Chemical Properties
202
General Preferences
210
CombiChem
212
Chapter 13: ChemScript
220
Why use ChemScript?
220
How ChemScript works
221
Getting Started
221
Editing Scripts
222
Introducing the ChemScript API
223
Tutorials
224
Useful References
227
Chapter 14: Query Structures
228
Search Limitations
228
Generic Labels
228
Atom Properties
231
Bond Properties
239
Element Lists
242
Polymers
243
Link Nodes
247
Alternative Groups
248
Anonymous Alternative Groups
254
Expand Generic Structures
255
Atom-to-Atom Mapping
257
Stereochemical Symbols
260
3D Properties
261
© Copyright 1998-2015 PerkinElmer Informatics, Inc. All Rights Reserved.
iv
ChemDraw 15.0
Export Compatibility
Chapter 15: Sharing Information
262
267
The Clipboard
267
Transferring Objects
270
Embedding Objects
271
Exporting
271
Importing
272
Transferring Across Platforms
276
Chapter 16: Chemical Interpretation
Database Conventions
277
277
Chapter 17: Property Calculations
290
Chapter 18: ChemDraw Web Resources
293
Registering Online
293
User’s Guide
293
Technical Support
293
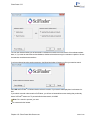
Querying SciFinder® with ChemDraw (Professional Level)
295
Chapter 19: Tutorials
298
Tutorial 1: Drawing a Structure
298
Tutorial 2: Drawing rings
299
Tutorial 3: Fischer projections
301
Tutorial 4: Perspective Drawings
304
Tutorial 5: Newman projections
308
Tutorial 6: Stereochemistry
311
Tutorial 7: Templates
314
© Copyright 1998-2015 PerkinElmer Informatics, Inc. All Rights Reserved.
v
ChemDraw 15.0
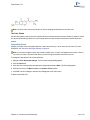
Recent Additions
Windows 8.1, Microsoft Office 2013, Mac OS X 10.9.x and Mac OS X 10.10.x.
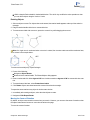
ChemDraw strives to be a vital and preferred tool for illustrating chemical and biological concepts. Compatibility with
the latest operating systems and tools is an essential part of that. Having the ChemDraw Active-X control functional
with the latest browsers on both Windows and Mac platforms is part of this process, as well.
ChemDraw to SciFinder Interface.
Send ChemDraw structure and reaction queries directly to SciFinder to find useful information relevant to your compound/reaction. For more information, see "Querying SciFinder® with ChemDraw (Professional Level)" on page 295.
Biopolymer Builder Enhancements.
Single and multi letter amino acids - Lets you create single letter amino acids and nucleotides either by entering the
corresponding IUPAC code, or by using the Biopolymer toolbar. The Biopolymer Editor lets you create three letter,
or non-standard amino acids, by entering the residue name.
Toggle Amino Acid Style AA1<->AA3 command - Lets you change the amino acid representation from single to
multi-letter, and vice versa. For more information, see "Drawing Biopolymers" on page 101.
L- and D- amino acids - Lets you create standard L- or D-amino acids by entering the relevant IUPAC code.
Toggle L- and D-amino acids -The ‘Toggle Amino Acid Stereo L<->D’ command lets you change the stereochemistry of amino acids from L to D and vice versa.
Protecting groups - Lets you add protecting groups such as Trt and Fmoc to amino acids containing additional NH
2
or OH groups (Arg, Aad). You can also expand and contract the protected residues. For more information, see "Protecting Groups" on page 103.
© Copyright 1998-2015 PerkinElmer Informatics, Inc. All Rights Reserved.
vi
ChemDraw 15.0
Cyclic and branched peptides - Lets you create cyclic peptides by bonding together the terminal residues in a peptide sequence. A looped bond indicates that the peptide is cyclic. You can create branched peptides using the
sequence builder and bond tools. For more information, see "Cyclic, Crosslinked, and Branched Peptides" on page
113.
Lactam bridges - Lets you form lactam bridges between residues with available amino and carboxylic acid leaving
groups, such as Lys-Asp and Lys-Glu. For more information, see "Lactam Bridges " on page 116.
Merging sequences - Lets you merge multiple sequences into one sequence by bonding together their terminal
residues.
Hybrid biopolymers - Lets you create hybrid (also called 'chimeric') biopolymers containing peptide, nucleotide, and
linker residues, using the Biopolymer toolbar. For more information, see "Hybrid Biopolymers" on page 110.
Pasting sequences - Lets you paste sequences in the FASTA format. You can also copy a text string describing a
biopolymer as a series of single or multi letter residues, with valid separators (space, tab, dash), and paste it as a
sequence. The text string can be generated within or outside of ChemDraw. See "Pasting Sequences" on page
104.
Displaying expanded residues - Expanded residues can appear in either linear mode or zigzag mode.
Expanding and contracting labels - Lets you expand the entire sequence, or any part of it. The sequence is automatically cleaned following expansion.
When you contract a sequence, the Clean Up Biopolymer command cleans and re-arranges the sequence, so
that the residues are aligned and wrapped.
Numbering residues - Lets you display residue numbers above any residue. For more information, see "Numbering
Residues" on page 110.
Hide/Show termini and bonds - Lets you hide bonds and termini without affecting the underlying chemistry.
Nickname Enhancements.
In ChemDraw 15.0, many new residues, for example, non-standard amino acids, non-standard nucleotides, linkers
have been added to the nickname library. Defining nicknames is much easier and more flexible now.For more information on nicknames, see "Defining Nicknames" on page 138.
Struct>Name Enhancements.
Struct>Name in ChemDraw 15.0 is enhanced to support many homopolymers, copolymers, and alternating polymers,
and stoichiometry specified as bracket properties, including fractional stoichiometry. For more information, see
"Struct>Name " on page 143.
Electron Pushing.
ChemDraw 15.0 introduces the Electron Pushing tool for illustrating electron transfer. For more information, see "Electron and Radical Pushing" on page 132.
© Copyright 1998-2015 PerkinElmer Informatics, Inc. All Rights Reserved.
vii
ChemDraw 15.0
Gel Electrophoresis Tool.
Gel electrophoresis separates molecules using an electric field applied to a gel matrix. The gel electrophoresis tool in
ChemDraw 15.0 works much like the TLC tool and lets you easily draw and mark bands based on weight or distance.
For more information, see "TLC" on page 168.
TLC Plate Enhancements.
Lets you copy and drag spots between lanes. For more information, see "TLC" on page 168.
Polymer Bead Enhancements.
Lets you re-size polymer beads. For more information on polymer beads and other attachment points, see "Attachment Points" on page 122.
New Toolbars.
ChemDraw 15.0 introduces several new toolbars, including, Structure, Curves, Windows, and Biopolymer toolbars.
You access these toolbars from the View menu.
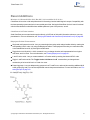
Color by Element.
Lets you color atom labels using colors associated with their atomic symbols, as shown in the example below.
For more information, see "Color by Element" on page 35.
New Property Predictions.
Incorporates new calculations from Molecular Networks for predicting pKa, LogS and LogP. See "Property Predictions in ChemDraw" on page 158.
JPEG/ JPG file export.
Lets you export files of type JPEG.
Copy As/Paste Special CDXML, MOL and MOL V3000 files as text.
Lets you save CDXML, MOL, and MOL V3000 files to the clipboard as text and then paste in other applications as
text. See "Creating CDXML, MOL or MOL V3000 Text" on page 269.
© Copyright 1998-2015 PerkinElmer Informatics, Inc. All Rights Reserved.
viii
ChemDraw 15.0
Copy Structure to MS Word from ChemDraw/Excel.
Lets you copy structures from ChemDraw/Excel worksheets to Microsoft Word through a setting in the General Preferences dialog. See " General Preferences" on page 210.
© Copyright 1998-2015 PerkinElmer Informatics, Inc. All Rights Reserved.
ix
ChemDraw 15.0
Introduction
Designed for scientists, students, and scientific authors, ChemDraw is a powerful, yet easy-to use, tool for producing
chemical and biological drawings. You can create your own drawings or use those provided in the library of available
templates.
Technical Support
The online menu link Technical Support opens the Technical Support Web page. Here you can find desktop support
resources, including the PerkinElmer Informatics Knowledge Base, product downloads, FAQ, and documentation.
To reach the PerkinElmer Informatics Technical Support Web page:
1. Navigate to Online>Browse PerkinElmer Technical Support. The Technical Support Web page opens.
2. Click Desktop Support.
About this Guide
This guide describes the features in ChemDraw. Some tasks described in this guide must be performed in conjunction
with other software. For example, instructions for ChemDraw/Excel describe tasks that require Microsoft Excel. For
assistance, consult the Microsoft Excel online help or user’s guide.
Conventions used in this Guide
This guide uses several basic conventions to help you quickly learn ChemDraw.
Instructions
Instructions are designed to help you navigate through menus and screens. Menu items appear in bold. For example,
to open a new drawing template:
1. Go to File>Open Templates>Amino Acids.
This step asks you to select the File menu, select Open Templates (in the File menu), and then select Amino Acids
(in the Open Templates sub menu).
Notes, Tips, and Cautions
The guide uses particular icons for various types of information:
Note: Notes highlight important information.
Tip: Tips supply useful, specific, “nice to know”, information, supplemental to the main text.
Caution: Cautions indicate important information that, if ignored, may lead to data loss ,or other serious problems.
Additional Information
These resources are available to help you get started with ChemDraw:
Online Help
In ChemDraw, press <F1> or navigate to Help>Contents.
Chapter 1: Introduction
1 of 315
ChemDraw 15.0
Tool Tips
This is the name or a short description of a tool. To view a tool tip, point to a tool. A longer description of the tool tip is
available in the status bar.
Status Bar
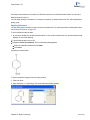
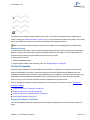
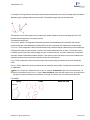
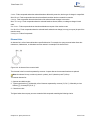
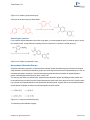
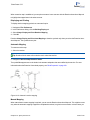
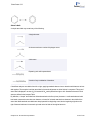
See the lower left corner of the ChemDraw window for useful information, as shown below.
Figure 1.1: Status bar displaying information about solid bond.
Serial Number and Technical Support
For more information on obtaining serial numbers and registration codes, see the online Services Web site.
Technical support is available to registered users through the Internet and our Technical Support department.When
contacting Technical Support, always provide the serial number of your ChemOffice application. Our Technical
Support Web pages contain answers to frequently asked questions (FAQs) and other information.
To access our Technical Support in ChemDraw, navigate to Online>Browse PerkinElmerTechnical Support.
If you are unable to find a solution on the Web site, follow these steps before you contact Technical Support:
1. Check the system requirements for the software.
2. Read and follow suggestions outlined in "Troubleshooting" on page 3 .
3. If your attempts to resolve a problem fail, contact Technical support.
Before you call:
Try to reproduce the problem before contacting us. If you can reproduce the problem, please record the exact
steps.
Record the exact wording of any error messages that appear.
Record your attempts to correct the problem.
Additional sources of ChemOffice information are:
ChemDraw online Help
The PerkinElmer Informatics Web site.
PerkinElmer Informatics Services.
Chapter 1: Introduction
2 of 315
ChemDraw 15.0
Troubleshooting
This section describes steps you can take that affect the overall performance of CS Desktop Applications, as well as
steps to follow if your computer crashes when using a CS software product.
Performance
Below are some ways you can optimize the performance of ChemOffice Desktop Applications:
From the Performance tab in the System control panel, allocate more processor time to the application.
Install more physical RAM. The more you have, the less ChemOffice desktop applications will have to access your
hard disk to use Virtual Memory.
Increase the Virtual Memory (VM). Virtual memory extends RAM by allowing space on your hard disk to be used as
RAM. However, the time for swapping between the application and the hard disk is slower than swapping with physical RAM.
Applications and Drivers
As with most complex software applications, there may be unusual circumstances in which ChemDraw may become
unresponsive. Below are some recommended steps for you to follow to try to resolve software and driver issues.
1. Restart Windows and try to reproduce the problem. If the problem recurs, continue with the following steps.
2. The most common conflicts concern video drivers, printer drivers, screen savers, and virus protection. If you
do need to contact us, be sure to determine what type and version of drivers you are using.
Video Driver-related issues: If you experience problems displaying any ChemOffice Desktop Application, first try
switching to the VGA video driver in the display Control Panel or System Setup, and then retest the issues. If using
a different driver helps, your original driver may need to be updated–contact the maker of the driver and obtain the
most up-to-date driver. If you still encounter problems, contact us with the relevant details about the original driver
and the resulting problem.
Printer Driver-related issues: Try using a different printer driver. If using a different driver helps, your original
driver may need to be updated–contact the maker of the driver and obtain the most up-to-date driver. If you still
encounter problems, contact us with the relevant details about the original driver and the resulting problem.
3. Reinstall the software. Before you reinstall, uninstall the software, and disable all background applications,
including screen savers, and virus protection. Read complete uninstall instructions on the Technical Support
web page.
4. If the problem still persists, use our online contact form to provide details to Technical Support.
Chapter 1: Introduction
3 of 315
ChemDraw 15.0
Getting Started
This topics covered in this chapter will help you become familiar with the user interface:
About ChemDraw Tutorials
There are seven tutorials available in the Tutorials chapter:
l
l
l
l
l
l
l
Tutorial
Tutorial
Tutorial
Tutorial
Tutorial
Tutorial
Tutorial
1: Drawing a Structure
2: Using Rings
3: Fischer Projections
4: Perspective Drawings
5: Newman Projections
6: Stereochemistry
7: Templates
These tutorials provide step-by-step instructions to help you work with the ChemDraw tools.
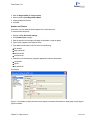
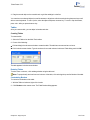
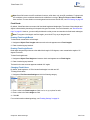
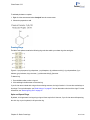
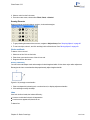
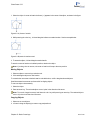
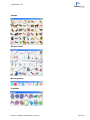
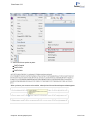
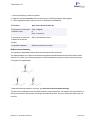
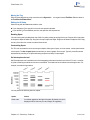
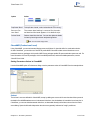
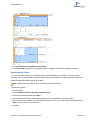
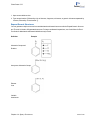
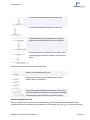
ChemDraw User Interface
By default, the user interface displays commonly-used toolbars, the main menu, and document status bar. The user
interface appears below:
ChemDraw Profesional windows user interface
Chapter 2: Getting Started
4 of 315
ChemDraw 15.0
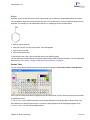
Toolbars
In ChemDraw, several new toolbars are introduced, such as Structure, Curves, Windows, and Biopolymer toolbars.
To display or hide a toolbar, select it in the View menu. A check mark appears next to the toolbar name when it is visible. You can also hide the toolbar by clicking on the 'X' icon on the upper-right corner of the toolbar.
The Main Toolbar
The main toolbar includes the tools most commonly used for drawing structures. These include all selection and bond
tools. You can open other toolbars from the main toolbar. Navigate to View>Show Main Toolbar.
Tearing off Toolbars
Some tools on the main toolbar have other toolbars associated with them. These are indicated by a small black triangle in the lower right corner. For example:
You can “tear off” these smaller toolbars and place them anywhere on your screen.
To tear off a toolbar:
1. Click the arrow on the lower right of a tool in the main toolbar.
2. While holding the mouse button down, point to the title bar, and release the button.
Note: If the toolbar does not open, it is likely already open, either docked, or floating on the screen.
Docking and Floating
You can dock or float any standard toolbar. When you dock a toolbar, it becomes attached to the drawing window.
The floating toolbars appear in front of the document window and you can move them around in the drawing window.
Double-clicking the toolbar restores it to the last, or default, or docked position.
To dock a toolbar, do one of the following:
Click and drag the toolbar to any edge outside the drawing window.
Right-click the toolbar and select Dock Toolbar.
To float a toolbar, do one of the following:
Double-click the docked toolbar.
Click and drag the docked toolbar into the drawing window.
Right-click the toolbar and select Float Toolbar.
Chapter 2: Getting Started
5 of 315
ChemDraw 15.0
BioDraw Toolbar
The BioDraw toolbar contains drawing tools for adding biological and biochemical elements to your drawings. See
"BioDraw (Professional Level only)" on page 92 for more information.
Documents
A document is a workspace where you create and edit structures. A document may contain multiple pages, or a single
page.
Creating Documents
You can create a new document using either the default settings, or a Style Sheet with customized settings. To create
a document, navigate to File>New Document.
Using Styles
To create a new document using a different style sheet, or stationery pad:
1. Navigate to File>Open Style Sheets.
2. Choose a Style Sheet from the list.
ChemDraw provides pre-defined style sheets in the ChemDraw Items folder. For example, the ACS Document 1996
is configured to create documents set with the bond lengths, bond width, spacing, and fonts used in the 2-column
format of ACS journals.
For a list of the settings in these documents, see "Document Settings" on page 38.
Opening Documents
To open a document, do one of the following:
Navigate to File>Open. From the Open dialog, select the file name and location of the file and click Open.
From the File menu, choose the document from the list at the bottom.
Selecting an Open Document
The Window menu lists all open documents and templates. The document you choose from the list becomes the active window.
Annotating Documents
Annotations are useful for adding text information to help you identify documents in a database search. Annotations
are categorized using keywords and an associated data value. There are several default keywords: Name, Description, Type, and Other Info. You can also add your own keywords.
To annotate a document:
1. Navigate to File>Document Annotations. The Annotate dialog opens.
2. Select a keyword from the keyword list, or add your own keyword.
3. To add a keyword:
Chapter 2: Getting Started
6 of 315
ChemDraw 15.0
a. Select Add New Annotation from the keyword list. The Add New Annotation dialog appears.
b. Enter a keyword in the New Keyword text field.
c. In the New Content text field, enter the notes to apply to the document and click Add.
4. Click OK.
Deleting a Keyword
When you delete a keyword, the annotation for that keyword is also deleted.
1. In the Annotate dialog box, select the keyword from the Keyword list.
2. Click Delete Keyword. Click Yes when prompted for confirmation.
3. Click OK.
Discarding Changes
To retrieve the last-saved version of a file, navigate to File>Revert.
Undo, Redo, and Repeat
ChemDraw tracks your actions. To undo, redo, or repeat your last action, select the appropriate option in the Edit
menu. The number of actions tracked is limited by the amount of memory (RAM and virtual memory) available.
Note: ChemDraw tracks only those actions you have performed since you last saved the document.
Saving Documents
1. Navigate to File>Save.
2. Choose a folder in which to store the file.
3. Type a file name in the Save As text field.
4. Select a file format.
5. Click Save.
Note: ChemDraw uses the CDX file format by default. Some other formats store a picture of your drawing but
may not store the chemical data associated with a structure in its entirety. For example, if you save a ChemDraw
drawing in the .eps file format, you will store only a picture of the structure without storing the chemical significance of the connections between atoms and bonds.
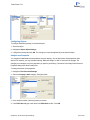
ChemDraw lets you add comments, or descriptions, to the document you save.
To enable/disable document comments:
1. Navigate to File>Preferences. The Preferences dialog appears.
2. Click the Open/Save tab.
3. Check the Prompt for Comment check box.
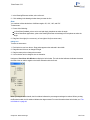
To add document comments:
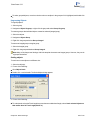
1. Click Save. The Set Document Comment dialog appears:
Chapter 2: Getting Started
7 of 315
ChemDraw 15.0
2. Enter the description and click OK.
Autosave
You can configure ChemDraw to periodically save an open document.
1. Navigate to File>Preferences. The Preferences dialog appears.
2. Click the Open/Save tab.
3. Check the Autosave Every check box and enter a time frame (in minutes), for example 5 minutes.
The time starts after you make your first change to the document.
Default File Format
1. Navigate to File>Preferences. The Preferences dialog appears.
2. Click the Open/Save tab.
3. Check the Use Default File Format check box in the Saving Files section and choose a format from the list.
Chapter 2: Getting Started
8 of 315
ChemDraw 15.0
Page Layout
Object alignment, page size, orientation, and other factors affect the presentation quality of your document.
The Drawing Area
The document window may not be the same size as the drawing area of the page. A document window, may cover
only a part of the drawing area.
These options let you set the drawing area on your screen:
Document Settings and Page Setup let you modify the page, margins, headers, footers, document type, and size.
View menu options: Actual Size, Show Document, Magnify, and Reduce.
Magnification Controls: enlarge and reduce
Dragging to enlarge the drawing area.
The Document Type
You can set up a document as either a page or a poster:
Pages. A single document containing one or more sheets, each of which is printed on a single piece of paper.
Posters. A single large document, comprising as many sheets of paper as necessary.
Paged Document Setup
To create a document with one or more pages:
1. Navigate to File>Document Settings. The Document Settings dialog appears.
2. On the Layout tab, select Pages.
3. Specify the number of pages in the Document Size section. The Page Setup settings determines the size of the
pages. For more information, see "Page Setup" on page 11.
4. Type the Margin settings. You set the units of the margins in the Preferences dialog. The paper size minus the margins determines the drawing area.
5. Create Headers and Footers as described in "Headers and Footers" on page 10.
6. Click OK. A new document opens, using your settings.
Poster Documents Setup
You can create a poster by creating a single large drawing area, which will be printed on as many separate pages as
necessary. When you set the document size and how much each page overlaps, ChemDraw calculates the number
of pages needed and the margin sizes. You can set registration marks, which mark the overlap setting on each page,
to use as a guide when assembling the poster from the separate pages.
To create a poster:
1. Navigate to File>Document Settings.
2. On the Layout tab, click Poster.
Chapter 3: Page Layout
9 of 315
ChemDraw 15.0
3. Enter the Height, Width, and Page Overlap.
4. Select whether to Print Registration Marks.
5. Create Headers and Footers.
6. Click OK.
Headers and Footers
For posters, only one header and footer appear for the entire document.
To create a header and footer:
1. Navigate to File>Document Settings.
2. Click Header/Footer category.
3. Enter the position from the edge of the page for the header or footer to appear.
4. Type the text to appear in the header or footer.
5. Type additional information in the Text box from the following:
file name &f
page number &p
date printed &d
time printed &t
6. Position the text horizontally by typing the appropriate characters listed below:
centered &c
right &r
left (default) &l
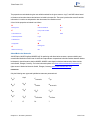
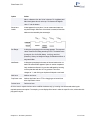
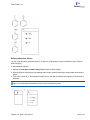
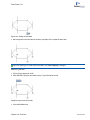
For example:
Figure 3.1: A)Variables to display file name center aligned in the header; B)Variables to display page number aligned
right in the header.
Chapter 3: Page Layout
10 of 315
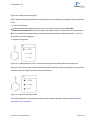
ChemDraw 15.0
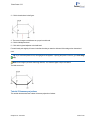
Figure 3.2: A) The filename is displayed center aligned in the header; B)The page number is displayed aligned right in
the footer.
Page Setup
To setup the page, navigate to File>Page Setup. Page setup options are:
Paper. Choose the size of the paper on which to print the document and the printer tray.
Orientation. Select either Portrait or Landscape.
Margins. By default, margins are set to 0.5 inches.
Printer. Click to select a printer and set preferences. You can also choose the printer in the Print Options dialog.
Printing
ChemDraw uses the standard system commands to print documents. Available options depend on the printer you
use. Refer to your printer’s documentation for more information.
In general, to print a document:
1. Navigate to File>Page Setup.
2. Make all appropriate selections for your printer and click OK.
3. Navigate to File>Print.
4. Make your selections in the Print dialog and click OK.
To print a document from Explorer:
Chapter 3: Page Layout
11 of 315
ChemDraw 15.0
1. Select the document to print.
2. Navigate to File>Print. ChemDraw opens and the Print dialog appears.
3. Make your selections in the Print dialog and click OK.
Print Options
Select Printer. This window lists all printers connected to your computer. You can use the default printer or select
another printer.
Print to File. The document is saved as a .prn file and includes your printer preferences. The document can then be
sent later to a printer.
Find Printer. Click to map to a printer not listed in the Select Printer window.
Page Range. Select the pages to print. To print parts of your document, select the parts and choose Selection in the
Print Options dialog.
Number of copies. By default, only one copy is printed.
Scaling
With some printers, you can reduce or enlarge your drawings by a variable percentage (25-400%). This option scales
all objects and text in the document window. The size changes relative to the paper size, margins, and orientation.
The enlarge or reduce option is useful for changing the size of the drawing area, while keeping the image size. If your
document fills the page on one printer and you use another printer that requires larger margins, the drawing may disappear off the edge of the document window. You can reduce the drawing size with the reduce option to fit in the document window.
Saving Page Setup Settings
You can save page setup settings in a style sheet. The settings are saved with the text settings, drawing settings,
and the color palette.
35mm Slide Boundary Guides
If you create 35mm slides from a hard copy of a document or from a screen shot, you can display boundary lines that
appear on your screen positioned at 7 inches and 10.5 inches to match the 2:3 ratio for the 35 mm slide format. These
guides are not printed. The drawing area of the page must be at least 7 x 10.5 inches for these boundary lines to be visible.
To display the 35mm slide boundary lines:
1. Navigate to File>Preferences.
2. Select the Building/Display tab.
3. Select the Show 35mm Slide Boundary Guides check box.
4. Click OK.
Chapter 3: Page Layout
12 of 315
ChemDraw 15.0
Two 35mm Slide Boundary Guides appear in the orientation chosen in the Page Setup dialog. These guides appear in
every document.
Viewing Drawings
Magnification
Magnification changes how large or small your drawing appears without changing its dimensions. You can either
select a value in the magnification drop down list or enter your own value between 1% and 999%.
Magnify
1. Select an object to keep in view as you magnify the drawing.
Note: If you do not select an object, the last object drawn is the center point of the magnification.
2. Select an option below:
To increase the magnification, navigate to View>Magnify.
To reduce the magnification, navigate to View>Reduce.
To return the document to its actual size, navigate to View>Actual.
To display the whole document, navigate to View>Show Document.
To set the magnification to a specific value, select or enter a percentage (enter Other between 1-999%) in the
General toolbar.
Rulers
Use the rulers to position objects a measured distance from a reference point or create objects of an approximate
size. To set the ruler units, go to File>Preferences and select the General tab.
Displaying Rulers
To toggle rulers on and off, navigate to View>Show Rulers.
As you move the pointer, guides appear on each ruler, indicating the position of the pointer.
Chapter 3: Page Layout
13 of 315
ChemDraw 15.0
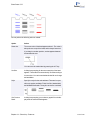
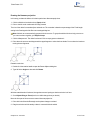
Figure 3.1: How rulers indicate position. A) The cursor; B) Ruler guides indicating vertical and horizontal location of
the cursor.
When you select an object, two guides appear in each ruler. The four guides together show the height and width of the
selected object.
Note: The rulers adopt the same units that were selected for the document settings.
The Crosshairs
The crosshairs are helpful for positioning objects.
To toggle the crosshairs on and off, navigate to View>Show Crosshair.
To assist you in aligning objects, the crosshairs include grid lines that extend from the major division marks on each
axis.
You can also show the rulers with the crosshairs to view the unit measurement associated with each division on the
crosshair axes.
Moving the Crosshair
1. Position the cursor where the Crosshair axes intersect.
The cursor changes to an arrow near the center of the crosshair.
2. Click and drag the crosshair.
To constrain crosshair to move in the X- or Y-direction, <shift>+drag the crosshair.
Positioning Objects
To align two or more objects using the crosshairs, do the following:
1. Move the Crosshair axes and align it with the object.
2. Select an object and drag it until it is aligned with either axis of the crosshair or a grid line.
3. Select a second object.
Chapter 3: Page Layout
14 of 315
ChemDraw 15.0
4. Drag the second object to the crosshair axis or grid line and align it to the first.
You can also move selected objects in small increments to align them with the crosshair using the arrow keys available on some keyboards: To move 1 point, select the objects and press an arrow key. To move in 10pt increments,
press <alt> while you press the arrow key.
Tables
After you create a table, you can adjust its borders and color.
Creating Tables
To create a table:
1. Select the Table tool on the Main Tools toolbar.
2. Do one of the following:
Click and drag in the document window to create the table. The table has two rows and two columns.
Click in the document window. Type the numbers of rows and columns in the Insert Table dialog, and click OK.
The table appears in the document window.
Resizing Tables
To resize rows or columns, click and drag a border using the table tool.
Note: To proportionally resize all rows and columns in the table, click and drag the top and left border of the table.
Customizing Borders
To customize the borders of the table:
1. With the Table tool selected, right-click a border.
2. Click Borders on the context menu. The Table Borders dialog appears.
Chapter 3: Page Layout
15 of 315
ChemDraw 15.0
3. Under Setting, select a border setting.
4. Under Style, select the style, color and width of the border to apply.
5. For a custom border, select the desired borders in the table diagram.
6. Click OK.
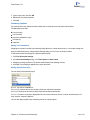
The table tool includes commands to align cell contents; fit, add or delete cells, and clear cells. In general, to change
the table, work with the right or bottom borders. To change a row or column, work with the left or top borders.
To resize a cell to fit its contents:
1. Point to a border and right-click.
2. Choose Size To Fit Contents. The cells resize to fit around the contents.
To add or delete rows or columns in the table:
1. Point to the top or left border where you want to add or delete the row or column. A border appears as shown below.
2. Right-click the border and select the appropriate option from the context menu.
To align all of the objects in a column or row, point to a top or left border using the Table tool, right-click, point to the
Align command on the context menu, and choose the alignment you want.
The cell contents shift and stay in a fixed position relative to the cell. The default alignment is unaligned.
Chapter 3: Page Layout
16 of 315
ChemDraw 15.0
To align all objects in a table, point to a bottom or right border, right-click, point to Align, and choose the alignment you
want.
Using the Text Tool
ChemDraw lets you create tables of text using the <tab> key with the Text tool.
To create the first row and establish the columns of a table:
1. Using the Text tool, click in a document window where you want the table to start.
2. Type a caption.
3. Press <tab>. A second caption box appears.
4. Type a second caption. The second column appears 20 points to the right.
5. Press <tab> again to create a third column, and so on.
Note: The style, font, and size that you set in each column are maintained in all the rows that follow.
To change the spacing between columns one point at a time while editing a caption:
1. Select the caption.
2. Move the caption with the arrow keys.
For more information on moving objects, see "Moving Objects" on page 83.
3. To create another column with this same spacing as the previous, select the Text tool and press <tab>. A third caption text box appears.
Creating New Rows
To start a new row that is aligned with the first, press <tab> twice at the end of a row.
A caption text box appears under the first caption positioned exactly 20 points below the first caption in the first row.
To change the spacing between rows as you create the table:
1. Select all the captions in a row.
2. Move the captions using the arrow keys.
For more information on moving objects, see "Moving Objects" on page 83.
Adjusting Row or Column Spacing
1. Select all the captions in the row or column with a selection tool.
Chapter 3: Page Layout
17 of 315
ChemDraw 15.0
2. <Shift> and drag the captions.
The movement is constrained to the X-axis or Y-axis so that you can maintain the row or column alignment.
Inserting New Rows
To insert a row:
1. Select a selection tool and select a row of captions.
2. <Shift>+drag the selected row.
3. <Shift> constrains the movement to the Y-axis to maintain the column alignment.
4. Select the first caption in the row above or below the space you created.
5. <Control>+<shift>+drag to create a copy of the caption and position it in the empty space you created.
6. The placement of this copied caption sets the position of the inserted row.
To fill in the inserted row with caption text:
1. Click the Text tool and select the first caption in the inserted row.
2. Type new text.
3. Press <tab> to move to the second caption in the inserted row, and so on.
Chapter 3: Page Layout
18 of 315
ChemDraw 15.0
Preferences and Settings
You can customize ChemDraw by configuring Preferences and Document Settings to match the way you work.
Preferences allow you to change the default behavior of certain options that apply to every open document. The
changes you specify in the document settings are applicable only within the document and is not applicable throughout the application. The changes you specify in the object settings are specific to the selected object.
For more information, see the topics found in this chapter:
l
l
l
l
l
Setting Preferences
Customizing Toolbars
Document Objects and Settings
Customizing Hotkeys
Working with Color
Setting Preferences
Preferences affect how ChemDraw works, regardless of the document with which you are working.
1. To open the Preferences dialog box, navigate to File>Preferences.
2. To restore the default settings, click Use Defaults.
Theme Options
The theme defines the appearance of the ChemDraw GUI but does not affect functions. By default, ChemDraw displays the ChemDraw theme. The theme ChemDraw Large has larger versions of the icons, which are more readable
but will require larger screen real estate.
To change themes:
1. Navigate to File>Preferences and select the General tab.
2. Select a theme in the Theme drop-down list.
3. Click OK.
Chapter 4: Preferences and Settings
19 of 315
ChemDraw 15.0
Default Document Location
You can set the default file directory for each time you open a file.
To set the default file directory:
1. Navigate to File>Preferences. The Preferences dialog appears.
2. Click the Directories tab.
3. Click the Use Documents Location check box and type in or browse to the location to use.
Default Open File Format
To set the default file format in the Open dialog box:
1. Navigate to File>Preferences. The Preferences dialog appears.
2. Click the Open/Save tab.
3. Click Use Default File Format in the Opening Files section, and choose the file format.
Setting the Default Tool
You can choose which tool is selected when you open documents.
1. Navigate to File>Preferences. The Preferences dialog appears.
2. Click the Open/Save tab.
3. Under Opening Files, select a tool.
New Lines and Closing Text Boxes
To create a new line in a caption text box press either <Enter> or <Return>. To create a new line in an atom label
press <Alt>+<Enter>. To close the text box, click outside the text box or select another tool.
To change the default:
1. Navigate to File>Preferences.
2. Choose the appropriate option on the Building/Display tab, to change the default for:
Atom Label Text- Require <Alt>+<Enter> to create new line in Atom labels.
Caption Text- Require <Alt>+<Enter> to create new line in Captions.
3. Click OK.
Highlight Box Tolerance
Tolerance determines the size of the highlight box and how close you move the cursor to an object to activate it. The
default setting for the Tolerance is 5 pixels. At this setting, the highlight box appears on bonds if the pointer is located
5 pixels or less from any point on the bond.
To set the tolerance:
1. Navigate to File>Preferences.
2. On the General tab, select or type the tolerance. This change affects all documents.
Chapter 4: Preferences and Settings
20 of 315
ChemDraw 15.0
The ChemDraw Items Folder
The folder contains the preferences, hotkeys, nicknames, and isotopes files; scripts, and the generic nicknames file.
It also contains template documents and template Stationery Pads. You can have multiple ChemDraw Items folders.
This is useful in corporate installations for maintaining personal files such as nicknames and standard templates.
The location of the ChemDraw Items folder is based on your operating system. If you are using ChemOffice 2015, the
folder is at:
C:\ProgramData\CambridgeSoft\ChemOffice2015\ChemDraw\ChemDraw Items
To add a path to a ChemDraw Items folder:
1. Navigate to File>Preferences. The Preferences dialog appears.
2. Click the Directories tab.
3. Click Add New, browse to a location, and click OK. A new path is added to the list.
4. To rearrange the search order, click Move Up and Move Down.
5. To delete a path, click Remove. To delete all added paths, click Default Paths.
Default Styles
ChemDraw saves default styles as a style sheet . When you launch ChemDraw, the last style sheet you use opens
as the default. If you choose different one, that file becomes the default.
You can set a default that is not changed:
1. Navigate to File>Preferences.
2. On the Open/Save tab, browse to the default style sheet.
3. Deselect Opening Any Style Sheet Changes Default.
4. Click OK.
To view the default style, click the File menu. The New menu item displays the name of the Style Sheet.
Saving Customized Styles
Every new document you create uses a style sheet file for its document settings. These files can also contain predefined objects. When you create a new document, you actually create an untitled copy of the style sheet. Changes
you make to the copy do not affect the file.
You can create a style sheet with your own customized setting by saving it as a CDS file. If you store the CDS file in
the ChemDraw Items folder, it appears in the Open Templates menu (under the File menu).
To save a document’s setting as a style sheet:
1. Navigate to File>Save As. The Save As dialog appears.
2. Name the file and change the type (in OS X: format) to CD Style Sheet (cds)
3. To save the file in the ChemDraw items folder, click Go To ChemDraw Items.
4. Click Save.
Chapter 4: Preferences and Settings
21 of 315
ChemDraw 15.0
Customizing Toolbars
The look and arrangement of toolbars are defined by a set of XML files. If you are familiar with editing XML files, your
can modify the toolbar for the way you work. You can remove, rename, and resize buttons; change button icons, or
move them from one toolbar to another. You can also create or delete toolbars.
The Toolbar Schema
The Toolbars.xsd file contains the schema definitions for all the toolbars. These include definitions (but not the content) for the toolbars, the pop-up text, and the status bar text.
The Toolbar XML Files
The Toolbars directory at C:\Programdata\CambridgeSoft\ChemOffice2015\ChemDraw\GUI\Common\XML\Toolbars, contains the subdirectory where the toolbars xml files are stored. The files are stored according to the skins in which they are used.
These are the files you will most commonly edit to customize the toolbars. The XML file when launched, validates
itself against the Toolbars.xsd file stored online.
Editing the XML Files
You can edit the files using any xml or text editor. After you save the files, exit and restart ChemDraw. Your changes
will take effect.
Create a backup of all XML files you intend to edit.
Note: All images files you use as icons must be in .png format.
Document and Object Settings
You can apply document and object settings to the current document. The changes you specify in the document settings are applicable only within the document and are not applicable throughout the application. The changes you specify in the object settings are specific to the selected object.
Settings include:
Drawing settings. Set drawing options such as the fixed length used to draw bonds.
Caption and label text settings. Set text options such as the font used for atom labels and captions.
Color settings. Set available colors for objects and the document background.
Print/Page Setup. Set options such as the page size used and text displayed in footers.
You can apply document settings in the following ways:
Customize settings for the entire document using the Document Settings dialog.
Apply settings to the entire current document from an existing document.
Apply settings to selected objects in the current document from an existing document.
Chapter 4: Preferences and Settings
22 of 315
ChemDraw 15.0
Drawing Settings
Drawing settings affect how bonds and other objects are drawn. You can configure the drawing settings for an entire
document or for a particular object as follows:
For the entire document, navigate to File>Document Settings and select the Drawing category.
For an object, use the Object Settings dialog box.
Changes you make to the drawing settings affect the active document window only. You can save drawing settings in
style sheets.
To apply settings from other documents to your document, navigate to File>Apply Document Settings.
The various options available under Drawing category includes:
Fixed Length. Constrain the bonds drawn to the length you specify. This also adjusts the preferred bond length when
you use the Clean Up Structure command. See "Drawing Fixed Length Bonds" on page 56 and "Attachment Points"
on page 122.
Bond Spacing. Set the distance between the lines in double or triple bonds. The distance is set either as:
The percent of the length of the bond (between 1 and 100). This allows for proportional spacing if different bond
lengths are used.
An absolute value you choose in the units specified for your document.
Chapter 4: Preferences and Settings
23 of 315
ChemDraw 15.0
Bold Width. Set the width of the line used when bold and wedge bonds are drawn. The Bold Width setting must be
greater than the Line Width setting. The end of a wedge is 1.5 times the bold width.
Line Width. Set the width of all bonds, lines, and arrowheads in the drawing.
Margin Width. Change the amount of space surrounding all atom labels that will erase portions of the bonds to which
they are attached. The margin width also determines the amount of white space surrounding the front bonds in a bond
crossing. See "Bond Crossing" on page 55.
Hash Spacing. Set the spacing between the hashed lines used when wedged hashed bonds, hashed bonds, dashed
bonds, dashed arrows, or dashed curves are drawn.
Chain Angle. Set the angle (from 1 to 179 degrees) between bonds created by the Acyclic chain tool or modified by
the Clean Up Structure command. See "Chains" on page 69 and "Attachment Points" on page 122.
Units. Set the units used in the Object Settings dialog box to centimeters, inches, points, or picas.
Atom and Bond Indicators. Set which indicators to display. See "Atom Numbering" on page 124.
Configuring Documents
1. Navigate to File>Document Settings.
2. Click the Drawing category and configure the settings.
3. Click OK.
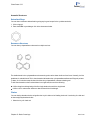
Terminal Carbon Labels
By default, ChemDraw does not display terminal carbons.
To display terminal carbon labels:
1. Navigate to File>Document Settings.
2. Select the Atom Labels category.
3. Select Show Labels On Terminal Carbons.See figure below:
Chapter 4: Preferences and Settings
24 of 315
ChemDraw 15.0
Configuring Objects
To configure the drawing settings for a selected object:
1. Select the object.
2. Navigate to Object>Object Settings.
3. Configure the settings and click OK. The settings you chose are applied only to the selected object.
Analysis and Properties
You can paste fundamental structure properties into your drawing. You can also rename these properties when
desired. For instance, you may consider renaming “Molecular Weight” to “MW” to save room on the page. The
changes you make apply only to the properties you paste in your drawing. The names in the Analysis and Chemical
Properties dialog boxes remain unaffected.
To change the names of the properties:
1. Navigate to File>Document Settings.
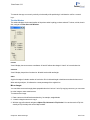
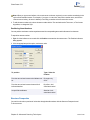
2. Select the Property Labels category. See figure below:
3. In the Analysis window, select the property to rename.
4. Click Edit Label and type a new name in the Edit Label text box. Click OK.
Chapter 4: Preferences and Settings
25 of 315
ChemDraw 15.0
5. Type the new name, and click OK.
6. Repeat step 4 for other properties.
7. Click OK.
Formatting Captions
Text settings affect how captions and atom labels for the current document are drawn and formatted.
Formatting options include:
Font (font type)
Size (font size)
Style (font and baseline style)
Line spacing
Alignment
Setting Font Parameters
Changing text formats in the Document Settings dialog affects the current document only. You can also change settings for individual objects by using the Object Settings dialog, the Text menu, or the Style toolbar.
To edit the document text settings for captions and atom labels:
1. Click File>Document Settings.
2. In the Document Settings dialog, click Text Captions or Atom Labels.
3. Change the settings as desired. The options are described in the following sections.
4. Click OK. The formatting is applied to the current document.
Setting the Baseline Style
You can specify these baseline styles:
Normal. Use this for standard text.
Superscript. Reduces the text size by about 25 percent and raises its baseline.
Subscript. Reduces the text size by about 25 percent and lowers the baseline.
Formula. Formats in a way that is appropriate for most chemical formulas, that is, numbers are subscripted. You
must, however, manually capitalize.
You can also apply multiple styles to different portions of a single caption.
Chapter 4: Preferences and Settings
26 of 315
ChemDraw 15.0
Style Indicators
Select any text in the document window and navigate to Text>Style to view the styles that have been applied. A
check indicates the style applies to all the selected text. A hyphen indicates the style applies to some of the selected
text.
Specifying Line Spacing
You can specify these types of line spacing:
Automatic. Consistently spaced lines of text based on the height of the tallest character in the caption. This is the
default line spacing.
Variable. Lines of text with different spacing based on the tallest character and the lowest descender in each line.
Fixed. Consistently spaced lines using a spacing that you specify.
Aligning Text
You can align captions and atom labels to justify text to suit your needs. The options available depend on whether you
are aligning captions or atom labels. Apply settings in the Object Settings dialog.
To open the object settings dialog:
1. Select a caption or atom label.
2. Navigate to Object>Object Settings. The Object Settings dialog appears.
Captions
You specify the caption justification and line spacing on the Text Captions tab of the Object Settings dialog. All text in
a single caption must have the same justification and line Spacing.
There are four available justifications:
Flush Left. Creates left-justified caption text.
Centered. Creates centered caption text.
Flush Right. Creates right-justified caption text.
Justified. Creates right-left justified caption text.
Atom Labels
Use the Centered, Flush Left, Flush Right, Stacked Above, or Automatic justifications to create labels that
identify atoms and functional groups in your chemical structure without obscuring bonds or other atom labels.
Chapter 4: Preferences and Settings
27 of 315
ChemDraw 15.0
Note: When using Stacked Above justification, enter the tokens from top to bottom using <alt>+<enter> to go to a
new line. If you change the justification after the label is entered, a warning may appear.
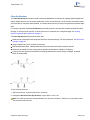
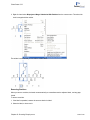
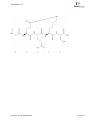
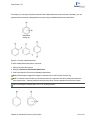
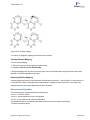
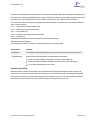
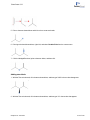
Examples of the atom label justifications are shown below.
Figure 4.1: Atom label justification. A) stacked above; B) centered; C) flush left; D) flush right.
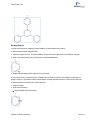
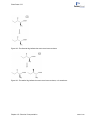
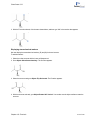
Automatic Alignment
When you justify atom labels automatically, ChemDraw breaks the label into tokens. A token consists of an uppercase letter followed by any numbers or lowercase letters. The first token is attached to the atom and the rest of the
label appears without obscuring other parts of the chemical structure.
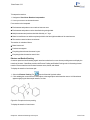
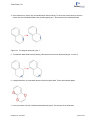
For example, to create N-methylpiperidine, label an atom in cyclohexane as NCH3. This label has three tokens, N, C
and H3. If you label C3, the tokens are placed from left to right because there are bonds to the left of the atom.
If you label C5, the tokens appear from right to left because there are bonds to the right of the atom:
You can force an entire multi-atom label to be a token by defining it as a nickname. This prevents the label from flipping when applied to the left side of a structure.
For example, if you define the nickname CH3, and label C5 with the combined label and nickname NCH3, the final orientation is CH3N instead of H3CN. In this case, the nickname, CH3, is a token.
Chapter 4: Preferences and Settings
28 of 315
ChemDraw 15.0
If you label C1, the second and third tokens are placed above the first token since there are bonds below the atom.
If you label C4, the second and third tokens are placed below the first token.
Changing Default Formats
Each new caption or atom label uses default document settings for the font, font-size, and style of captions and atom
labels.
You can change the format by:
Changing the document settings for subsequent drawings in the current document.
Choosing a new format for an individual caption or label from the Text menu or toolbar before you type.
Selecting text and applying a new format to an individual label after you type.
Settings for New Text
To specify the text settings for new captions and atom labels in the current document:
1. Navigate to File>Document Settings.
2. Click Text Captions or Atom Labels in the Document Settings dialog.
3. Select the appropriate options.
4. Click OK.
These settings affect all new captions or atom labels in the current document. To use these settings in new documents, save them in a style sheet . For more information, see "Document and Object Settings" on page 22.
Formatting a Caption or Label
You can set the text format for an individual caption or atom label before you type. The format change is applied only
to the current text.
To set the text format before you type:
1. Select the Text tool and click in the document window. A text box appears.
2. To set the text format do one of the following:
Chapter 4: Preferences and Settings
29 of 315
ChemDraw 15.0
Navigate to Text> Font, Style or Size.
Set the format options on the Style toolbar.
3. Type the text in the text box.
The format is applied to the typed text. Subsequent text you type uses the default document settings.
Changing Text Setting
You can change the text settings for a selected caption or atom label. You can choose to have the settings applied to
the selected text and to all subsequent text you type.
To change the text settings for a selected caption or atom label:
1. Select the text to change with a selection tool.
2. Set the appropriate options on the Text menu.
To change part of a caption, select the part you want to change using the Text tool.
To specify a font and size for selected text, do one of the following:
Choose the font and size from the Text menu.
Right-click and choose the font and size from the context menu.
Select the font and font-size from the drop-down list on the Style Toolbar.
Biopolymer settings
You can specify how the sequences and residues appear in either the entire document or for a specific sequence, as
follows:
For the entire document, go to File>Document Settings and select the Biopolymer Display tab.
For an object, use the Object Settings dialog box.
In the biopolymer Display tab, select from these options:
Residues per line. specify the number of residues to be displayed in each line of the sequence.
Residue per block. specify the number of residues to be displayed in each block of the sequence.
Amino-acid Termini. Set either NH2/COOH or H/OH as the termini in the sequence.
Note: When the termini are displayed using the NH2/COOH style, the underlying atoms are actually H and OH.
The labels are intended to convey whether the N or C terminus is present. Since this can be confusing or ambiguous, this display is not recommended, and is provided only for compatibility with other products.
Specifying the margin width
You can adjust the white space surrounding the atom label so that some of the attached bond is hidden.
Chapter 4: Preferences and Settings
30 of 315
ChemDraw 15.0
To adjust the white space:
1. Go to File>Document Settings. The Document Settings dialog box appears.
2. Click the Drawing tab.
3. Type a new Margin Width value.
4. Click OK.
The margin width is applied to all subsequent drawings in the current document.
Settings from other documents
To apply document settings to the active window that are contained in a different document, go to File>Apply Document Settings from and choose the document from which to apply the settings.
The settings in the active document window change to those found in the style sheet that you choose.
Note: Applied settings are for the current document only. To make them the default settings for all documents you
open, go to File> Open Style Sheets .
To apply the document settings from a document or style sheet not listed in the menu:
1. Go to File>Apply Document Settings from>Other. The select document dialog box appears.
2. Open the appropriate folder and select a document or Style Sheet.
3. Click Open.
Applying object settings
You can apply settings from another document to selected objects in the current document. You can apply the chosen
settings to the selected objects, or to all new objects drawn in the current document.
To apply object settings:
1. Select the object.
2. Go to Object>Apply Object Settings from and choose the document from which to apply the settings. A dialog
box appears.
3. Do one of the following:
To selected object only, click No.
To selected object and any new objects you draw, click Yes.
Chapter 4: Preferences and Settings
31 of 315
ChemDraw 15.0
Customizing Hotkeys
If you are familiar with XML, you can edit the ChemDraw Hotkeys, or create your own.
To customize Hotkeys, open the Hotkeys.xml file in a text editor. There are two paths--depending on whether this is a
default installation or a custom installation. The preferred method is to edit this file from a custom installation location.
l
If a Default Installation, the path is:
Go > Applications > Right-click on ChemDraw > Choose Show Package Contents > Contents > Resources > SpecialPurpose > ChemDraw Items > Hotkeys.xml
l
If a Custom Installation, the path is:
Custom location folder > ChemDraw Items > Hotkeys.xml
Note: It is safest to edit the Hotkeys.xml file from a custom installation location, rather than from the default installation location. Since when editing the Hotkeys.xml from the default installation location, this can affect the whole
ChemDraw package content.
The Hotkeys within the file are organized by object type:
“Atom”: Hotkeys that modify atoms.
“Bond”: Hotkeys that modify bonds.
"AA1": Hotkeys that sets the label for the single letter amino acids.
"DNA": Hotkeys that sets the label for the DNA sequence.
"RNA": Hotkeys that sets the label for the RNA sequence.
“Generic”: Hotkeys that select tools and open dialog boxes.
Each Hotkey is encoded in this format:
<Hotkey key="{key}" command=" {command}" value="{value}" description=" {description}”/>
Key
Key is the keyboard key that invokes the command. You can assign the same key to different functions as long as the
functions are defined for different object types. For example, ‘b’ changes an atom to Boron in the Atom object type, a
bond to bold in the Bond object type, and could be assigned to the Benzene tool in the Generic object type. You can
use any key except the hard-coded keys: function keys, ENTER, SPACE, BACKSPACE, and arrow keys.
Note: Hotkeys are case sensitve. For example, you can define the hotkeys "S" and "s" to different functions
within an object type.
If a key appears more than once in the file for the same object type, the one closest to the end of the file takes precedence.
Chapter 4: Preferences and Settings
32 of 315
ChemDraw 15.0
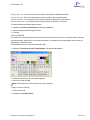
Command
Command is any one of the predefined command names. All available commands are described in the hotkeys.xml
file. The command ID's are defined based on the object types as follows:
Object Type
Atom
Command ID
Description
LABELTEXT
Sets the label for the atoms text
SPROUT
Addition of bonds to an atom
CHARGE
Changes the charge of an atom
FREE_SITE
Increment/decrement free sites of an atom
UPTO_SITE
Increment/decrement the UpTo number of substituents of an atom
EXACT_SITE
Increment/decrement the number of substituents of an atom
ATOMNUMBER
Show/hide the atom numbers
ATTACHMENTPOINT
Sets the value of the attachment point
BONDORDER
Sets the bond order
BONDDISPLAY
Sets the bond display
BONDPOSITION
Sets the position of bonds
BONDDOUBLEPOSITION
Sets the alignment for double bonds
FUSERING
Fuses a ring to a bond
DIALOG
Display a dialog
TOOLMODE
Changes the current tool
AA1
AA1
Sets the label for the single letter amino acids
DNA
DNA
Sets the label for the DNA sequence
RNA
RNA
Sets the label for the RNA sequence
Bond
Generic
Note: You cannot add to the command list.
Value
This is the parameter value associated with the command. For example, if the command is LABELTEXT, the value is
the label that appears. If the command is BONDDISPLAY, the value corresponds to the bond display type.
To create a hotkey that switches to a particular tool, choose TOOLMODE for a command and use any of these command names for a value:
LASSO
TLCPLATE
MARQUEE
BENZENE
3DTRACKBALL
CYCLOPENTADIENE
MASSFRAG
CYCLOHEXANECHAIR2
ERASER
CYCLOHEXANECHAIR1
TEXT
CYCLOOCTANE
Chapter 4: Preferences and Settings
33 of 315
ChemDraw 15.0
SOLIDBOND
CYCLOHEPTANE
MULTIBOND
CYCLOHEXANE
DASHEDBOND
CYCLOPENTANE
PEN
CYCLOBUTANE
HASHEDBOND
CYCLOPROPANE
ARROW
TEMPLATE
HASHEDWEDGEDBOND
SNAKINGCHAIN
ORBITAL
ACYCLICCHAIN
BOLDBOND
QUERY
DRAWINGELEMENTS
TABLE
WEDGEDBOND
ARC
BRACKET
WAVYBOND
HOLLOWWEDGEDBOND
CHEMICALSYMBOLS
Note: The features that are available depends on the level of ChemDraw you have.
Description
The tool description explains what each hotkey does.
Editing the Hotkeys.xml file
Note: Ensure that "Smart Quotes" are disabled while editing hotkeys.
To edit ChemDraw hotkeys:
1. Open the hotkeys.xml file in a text editor.
2. Navigate to the appropriate hotkey list in the hotkeys.xml file.
3. Either add a new hotkey entry using the appropriate format and values or edit an existing hotkey in the list.
4. Save the hotkeys.xml file.
5. Exit and restart ChemDraw.
Caution: Exercise caution when editing hotkeys.xml file, since if the formatting is incorrect, it will not be read, and
some functions of ChemDraw may cease to work correctly. Make a back up the original copy of the file prior to
making any changes.
Working with Color
You can create full color presentations of your chemical drawings to appear on your monitor, print on a color printer, or
create 35mm slides using a film printer.
Most computers can display up to 16 million colors, but the number of colors may be limited by your monitor and display card.
What You Can Color
In ChemDraw , you can change the color of the background, foreground, or individual objects and elements:
Chapter 4: Preferences and Settings
34 of 315
ChemDraw 15.0
Background color. The color of the document window. By default, the background is white.
Foreground color. The color of objects that you draw. By default, the foreground is black.
Individual objects. You can assign colors to objects to help then stand out from other objects.
Individual elements. You can assign colors to specific atoms or elements in a structure.
To change the background and foreground colors:
1. Navigate to File>Document Settings and select the Colors tab.
2. Select the background and foreground colors.
3. Click OK.
Color by Element
You can now color atom labels using colors associated with their atomic symbols.You can assign colors to elements
in the periodic table. Whenever you use a particular element in your drawing, the element appears in same color you
assigned to it in the periodic table.
To assign different colors to elements in a periodic table:
1. Navigate to View>Show Periodic Table Window. The periodic table appears.
2. Double-click an element. The color palette appears.
3. Select a color and click OK.
Note: The modified colors are saved when you exit ChemDraw.
To apply a color to a structure:
1. Select the structure.
2. Navigate to Color>By Element.
Chapter 4: Preferences and Settings
35 of 315
ChemDraw 15.0
Note: The atom colors are not dynamically set, hence changing the label does not reset the color.
The Color Palette
Use the color palette to specify the color of objects and text in the document in the active window. A palette is stored
in every document and style sheet.You can use style sheets to create a series of documents with the same color
scheme.
Customizing Colors
Changes you make to the color palette affect the current document only. You can save up to 20 colors. For more
information, see "Document and Object Settings" on page 22.
Note: If you select an object or group that contains multiple colors, a check mark appears next to each of the colors in the Color menu. The check mark alerts you that a change would affect more than one color.
To change the color palette in the current document:
1. Navigate to File>Document Settings. The Document Settings dialog appears.
2. Click the Colors tab.
3. Click the color to change (either background or foreground) and select Other. The Color dialog opens.
4. Click the new color in the Basic Colors or the Custom Colors section.
5. Click OK. The color changes to the new color and appears on the Color menu.
To add a customized color:
Chapter 4: Preferences and Settings
36 of 315
ChemDraw 15.0
Figure 4.2: Setting custom colors. A) Color refiner box; B) Luminosity box.
6. Click a color in the Color Refiner box to set the hue and saturation.
The pointer turns into a cross hair when you click. You can drag to a different region to change the hue and saturation.
7. Click in the Luminosity box to set the color brightness.
8. If necessary, change the hue, saturation, luminosity, and RGB components by typing the values in the text boxes.
9. Click Add to Custom Colors.
10.Click OK.
Templates and Color
The background and foreground colors in a template from the template pop-up palette are not used when the template
is drawn in a document window. However, other colors in the template are added to the color palette of the document
if they are not already present. For more information, see "Autoscaling" on page 270.
Saving Color Palette Settings
You can save the color palette in a style sheet. The color palette is saved with other document settings such as page
setup settings, text settings, and drawing settings.
Printing Background Color
To change whether the background color is printed:
1. Navigate to File>Preferences.
2. Select or de-select Print Background Color on the General tab.
3. Click OK.
Chapter 4: Preferences and Settings
37 of 315
ChemDraw 15.0
Document Settings
ChemDraw includes a library of document settings based on those found in many well-known scientific publications.
For example, some journals may require submitted articles be formatted with specific margins, fonts, page size, and
so on. If you plan to submit your document to a specific journal, open in ChemDraw the style sheet for that journal.
You can also create style sheets of your own.
Note: The changes you make to the document settings is reflected only in the current document and is not available throughout the application.
To create your own style sheet:
1. Create a new document.
2. Enter the settings in the Page Setup, Drawing, Text Settings, and Color palette dialog boxes.
3. Navigate to File>Save As.
4. In the Save As dialog box:
a. Select the ChemDraw style sheets file format.
b. Type a name for the document.
c. Save the template in the ChemDraw Items folder.
5. Click OK.
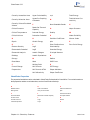
ACS Document 1996
Fixed Length: 14.4 pt
Bold Width: 2 pt
Line Width: 0.6 pt
Margin Width: 1.6 pt
Hash Spacing: 2.5 pt
Chain Angle (degrees): 120
Bond Spacing (% of length): 18
Atom Label Font :
Atom Label Size: 10 pt
Caption Font :
Caption Size: 10 pt
Drawing Area (Width x Height): 540 pt x 720 pt
Page Size: US Letter
Reduction (%): 100
Adv. Synth Catal.
Chapter 4: Preferences and Settings
38 of 315
ChemDraw 15.0
Fixed Length: 17 pt
Bold Width: 2 pt
Line Width: 1 pt
Margin Width: 1.6 pt
Hash Spacing: 2.5 pt
Chain Angle (degrees): 120
Bond Spacing (% of length): 18
Atom Label Font :
Atom Label Size: 10 pt
Caption Font :
Caption Size: 12 pt
Drawing Area (Width x Height): 540 pt x 720 pt
Page Size: US Letter
Reduction (%): 100
J.Chin. Chem. Soc.
Fixed Length: 18 pt
Bold Width: 2.5 pt
Line Width: 1 pt
Margin Width: 2 pt
Hash Spacing: 2.5 pt
Chain Angle (degrees): 120
Bond Spacing (% of length): 20
Atom Label Font :
Atom Label Size: 12 pt
Caption Font :
Caption Size: 12 pt
Drawing Area (Width x Height): 693 pt x 918 pt
Page Size: US Letter
Reduction (%): 80
J. Mol. Mod. (1 column)
Fixed Length: 14.4 pt
Bold Width: 2 pt
Line Width: 0.6 pt
Margin Width: 1.6 pt
Hash Spacing: 2.5 pt
Chain Angle (degrees): 120
Bond Spacing (% of length): 18
Chapter 4: Preferences and Settings
39 of 315
ChemDraw 15.0
Atom Label Font: Times New Roman
Atom Label Size: 10 pt
Caption Font: Times New Roman
Caption Size: 10 pt
Drawing Area (Width x Height): 8.5 cm x 25.4 cm (1
column); 17 cm x 25.4 cm (2 column)
Page Size: US Letter
Reduction (%): 100
New Document
Fixed Length: 30 pt
Bold Width: 2 pt
Line Width: 1 pt
Margin Width: 2 pt
Hash Spacing: 2.7 pt
Chain Angle (degrees): 120
Bond Spacing (% of length): 12
Atom Label Font :
Atom Label Size: 10 pt
Caption Font :
Caption Size: 12 pt
Drawing Area (Width x Height): 7.5 in x 10 in
Page Size: US Letter or A4 (as selected)
Reduction (%): 100
New Slide
Fixed Length: 30 pt
Bold Width: 4 pt
Line Width: 1.6 pt
Margin Width: 2 pt
Hash Spacing: 2.7 pt
Chain Angle (degrees): 120
Bond Spacing (% of length): 15
Atom Label Font :
Atom Label Size: 12 pt
Caption Font :
Caption Size: 16 pt
Drawing Area (Width x Height): 7.5 in x 10 in
Page Size: US Letter
Reduction (%): 100
Chapter 4: Preferences and Settings
40 of 315
ChemDraw 15.0
Phytomedicine
Fixed Length: 20 pt
Bold Width: 1.33 pt
Line Width: 1pt
Margin Width: 1.25 pt
Hash Spacing: 3 pt
Chain Angle (degrees): 120
Bond Spacing (% of length): 8
Atom Label Font :
Atom Label Size: 12 pt
Caption Font :
Caption Size: 12 pt
Drawing Area (Width x Height): 540 pt x 720 pt
Page Size: US Letter
Reduction (%): 100
RSC
Fixed Length: 0.43 cm
Bold Width: 0.056 cm
Line Width: 0.016 cm
Margin Width: 0.044 cm
Hash Spacing: 0.062 cm
Chain Angle (degrees): 120
Bond Spacing (% of length): 20
Atom Label Font :
Atom Label Size: 9 pt
Caption Font :
Caption Size: 9 pt
Drawing Area (Width x Height): 8.9 cm x 25.4 cm (1
column); 19 cm x 27.7 cm
Page Size: US Letter
Reduction (%): 100
Science of Synthesis
Fixed Length: 17 pt
Bold Width: 2 pt
Line Width: 0.8 pt
Margin Width: 2.25 pt
Hash Spacing: 2.5 pt
Chapter 4: Preferences and Settings
41 of 315
ChemDraw 15.0
Chain Angle (degrees): 120
Bond Spacing (% of length): 18
Atom Label Font :
Atom Label Size: 10 pt
Caption Font :
Caption Size: 10 pt
Drawing Area (Width x Height): 19.79 cm x 27.15 cm
Page Size: A4
Reduction (%): 100
Synthesis, Synlett
Fixed Length: 17 pt
Bold Width: 2 pt
Line Width: 0.8 pt
Margin Width: 1.3 pt
Hash Spacing: 2.5 pt
Chain Angle (degrees): 120
Bond Spacing (% of length): 18
Atom Label Font :
Atom Label Size: 10 pt
Caption Font :
Caption Size: 10 pt
Drawing Area (Width x Height): 12 cm x 26.7 cm
Page Size: A4
Reduction (%): 100
Verlag Helvetica Chimica Acta
Fixed Length: 17 pt
Bold Width: 2.9 pt
Line Width: 0.54 pt
Margin Width: 2 pt
Hash Spacing: 2 pt
Chain Angle (degrees): 120
Bond Spacing (% of length):14
Atom Label Font :
Atom Label Size: 10 pt
Caption Font :
Caption Size: 12 pt
Drawing Area (Width x Height): 368 x 720 pts
Chapter 4: Preferences and Settings
42 of 315
ChemDraw 15.0
Page Size: US Letter
Reduction (%): 100
Wiley Document
Fixed Length: 17 pt
Bold Width:2.6 pt
Line Width:0.75 pt
Margin Width: 2 pt
Hash Spacing: 2.6 pt
Chain Angle (degrees): 120
Bond Spacing (% of length):18
Atom Label Font :
Atom Label Size: 12 pt
Caption Font :
Caption Size: 12 pt
Drawing Area (Width x Height): 19.79 x 27.15 cm
Page Size: A4
Reduction (%): 100
Chapter 4: Preferences and Settings
43 of 315
ChemDraw 15.0
Shortcuts and Hotkeys
Hotkeys are organized into atom labels, bond types, and functions (such as adding a charge or displaying a bond).
Shortcuts are organized by the menu on which the command is found.
Note: You can modify hotkeys and nicknames. The tables in this section refer to the default values.
Atom Keys
Use atom keys to insert atoms in a drawing using your keyboard. For example, place your mouse over an atom and
press <3> to add a tert-butyl group.
Atom Label
Key
A
a
F
f
Ph
P or 4
Ac
A or 5
H
h
Q*
q
Br
b
I
i
R
r
n-Bu
1
K
k
S
s
s-Bu
2
Me
m
Si
S
t-Bu
3
N
n
TMS
t
Chapter 5: Shortcuts and Hotkeys
44 of 315
ChemDraw 15.0
Atom Label
Key
C
c
Na
N
X
x
Cl
C or l
O
o
COOCH3
E
D
d
OTs
T
CH2OH
6
Et
e
P
p
B
B
Bond Hotkeys
To modify a bond, place your mouse over the bond and select a key listed below.
Function
Key
Change to single bond
1
Change to dashed bond
d
Change to double bond
2
Change to wavy bond
y
Change to triple bond
3
Position a double bond to the left
l
Change to quadruple bond
4
Center a double bond
c
Change to bold bond
b
Chapter 5: Shortcuts and Hotkeys
45 of 315
ChemDraw 15.0
Function
Key
Position a double bond to the right
r
Change to wedged bond
w
Bring bond to front
f
Change to hashed bond
H
Open a bond properties text box
/ (slash) or ?
Change to hashed-wedged bond
h
Fuse 5 membered ring
5
Fuse 6 membered ring
6
Fuse 7 membered ring
7
Fuse 8 membered ring
8
Create chair form of cyclohexane with two different ori-
9 or 0
entations
Function Hotkeys
Function
Key
Add an attachment point
. (period)
Add an atom number
‘ (single quote)
Add a negative charge
-
Add a positive charge
+
Sprout one bond
0
Sprout two bonds
9
Sprout three bonds
8
Display the Atom Properties dia-
/ (slash) or ?
log box
Display the Choose Nickname dia- = (equals)
log box
Chapter 5: Shortcuts and Hotkeys
46 of 315
ChemDraw 15.0
Function
Key
Open an atom label text box
<Enter>
Remove an atom label
<Backspace>, <Delete> or
<space>
Shortcuts
Below is a list of key combinations for common tasks.
File
Command
Key Combination
Create a new doc-
CTRL+N
ument
Open a document
CTRL+O
Save a document
CTRL+S
Save a document as
SHIFT+CTRL+S
Print a document
CTRL+P
Page setup
SHIFT+CTRL+P
Close a document
CTRL+W
Exit ChemDraw
ALT+F4
Edit
Command
Key Combination
Cut
CTRL+X
Copy
CTRL+C
Paste
CTRL+V
Select all
CTRL+A
Undo
CTRL+Z
Redo
SHIFT+CTRL+Z
Repeat last command CTRL+Y
Chapter 5: Shortcuts and Hotkeys
47 of 315
ChemDraw 15.0
Command
Key Combination
Clear
Delete
View
Command
Key Combination
Actual size
F5
Reduce
F8
Magnify
F7
Fit to window
F6
Toggle ruler
F11
Toggle crosshair
CTRL
Object
Command
Key Combination
Toggle fixed length
CTRL+L
Toggle fixed angles
CTRL+E
Select multiple objects
SHIFT+Click (with Lasso, Marquee, or
Structure Perspective tools
Group selected objects
CTRL+G
Ungroup objects
SHIFT+CTRL+G
Join selected objects
CTRL+J
Bring to front
F2
Send to back
F3
Flip horizontal
SHIFT+CTRL+H
Flip vertical
SHIFT+CTRL+V
Rotate 180° horizontal
ALT+SHIFT+CTRL+H
Rotate 180° vertical
ALT+SHIFT+CTRL+V
Chapter 5: Shortcuts and Hotkeys
48 of 315
ChemDraw 15.0
Command
Key Combination
Rotate... (opens Rotate Objects
CTRL+R
dialog)
Scale...(opens Scale Objects dia- CTRL+K
log)
Structure
Command
Key Combination
Clean up structure
SHIFT+CTRL+K
Convert name to structure
SHIFT+CTRL+N
Convert structure to name
ALT+CTRL+N
Text
Command
Key Combination
Flush left
SHIFT+CTRL+L
Center
SHIFT+CTRL+C
Flush right
SHIFT+CTRL+R
Justified
SHIFT+CTRL+J
Automatic justification
SHIFT+CTRL+M
Plain
CTRL+T
Bold
CTRL+B
Italic
CTRL+I
Underline
CTRL+U
Formula
CTRL+F
Subscript selected character, or
F9 (in a label)
next character typed
Superscript selected character, or
F10 (in a label)
next character typed
Adds a degree sign (°)
ALT+248 (in a label)
Chapter 5: Shortcuts and Hotkeys
49 of 315
ChemDraw 15.0
Drawing
Command
Key Combination
Copy a selected object
CTRL+drag
Copy a selected object
SHIFT+CTRL+drag
(constrained to X and Y
axes)
Distort (limit resize to X or
SHIFT+drag (with resize handle)
Y axis)
Toggle the Lasso and the
CTRL+ALT+Tab
previous drawing tool
Change direction of a chain CTRL+Drag (with alkane chain tool)
Change orientation of
SHIFT+Click
double bonds
(with saturated double-bond ring tools)
Create resonance delo-
CTRL+Click (with ring tools except chairs)
calized ring
Remove a curve segment
ALT+SHIFT+Click (with the pen tool)
Nicknames
Ac
Bz
c-C7H13
cyclopropyl
DPIPS
i-C4H9
Ad
BOM
c-C8H15
Cys
DPTBS
i-C5H11
Ala
Bs
c-Hx
Dan
DTBMS
i-Pr
Alloc
Bt
C10H20
DEAE
DTBS
Ile
Allyl
Btm
C10H21
DEIPS
Et
Im
Am
Bu
Cbz
DMIPS
Fmoc
Leu
Arg
Bzh
cHx
DMPM
Gln
Lys
Asn
Bzl
CoA
DMPS
Glu
m-C6H4
Chapter 5: Shortcuts and Hotkeys
50 of 315
ChemDraw 15.0
Asp
BzOM
Cy
DMTr
Gly
m-Phenylene
Benzoyl
c-C3H5
cyclobutyl
DNP
His
m-Tolyl
Benzyl
c-C4H7
cycloheptyl
Dnp
i-Am
MDIPS
Bn
c-C5H9
cyclooctyl
Dns
i-Bu
MDPS
Boc
c-C6H11
cyclopentyl
DNS
i-C3H7
Me
MEM
n-Pr
Phenyl
s-Butyl
TBDMS
Thr
Mes
N3
Pht
s-C4H9
TBDPS
TIPDS
Met
neo-Am
Piv
s-C5H11
TBMPS
TIPS
MMTr
neo-C5H11
PMB
SEM
TBS
TMS
MOM
Np
PMBM
Ser
TDS
Tos
MPM
o-C6H4
PNB
SES
Tf
trans-Cinnamyl
Ms
o-Phenylene
Poc
t-Am
Tfa
Troc
MTM
o-Tolyl
PPi
t-BOC
TFA
Trp
n-Am
p-C6H4
Pr
t-Boc
Thexyl
Trt
n-Bu
p-Phenylene
Pro
t-Bu
THF
Ts
n-C3H7
p-Tolyl
Pv
t-Butyl
Thf
Tyr
n-C4H9
Ph
s-Am
t-C4H9
THP
Val
n-C5H11
Phe
s-Bu
t-C5H11
Thp
Xyl
Chapter 5: Shortcuts and Hotkeys
51 of 315
ChemDraw 15.0
Basic Drawings
ChemDraw provides a variety of tools for drawing everything from simple chemical structures to complex reactions.
In this section, we introduce basic techniques to help you create your first structures. We also explain how to add features, such as arrows and shapes, to enhance structures and reactions. For more drawing features, see "BioDraw
(Professional Level only)" on page 92 and "Advanced Drawing Techniques" on page 118.
Bonds
The Main toolbar and Multiple Bonds toolbar offer numerous options for drawing bonds. Some tools are for drawing
specific types of bonds, while others are for drawing structures for database queries. For additional information on various bond types, see "Bond Conventions" on page 278.
Drawing Bonds
To draw the first bond of your structure, select the solid bond tool in the Main toolbar and click in the document window. The bond appears in the drawing window. To draw another bond attached to the first, click either end of the first
bond. The second bond appears in the drawing window, as shown below.
Figure 6.1: Adding a bond to an atom
You can draw a bond in any direction. Using a bond tool, click and drag from an existing atom or an empty area in the
document window. The bond is drawn in the direction you drag the cursor.
Figure 6.2: Adding a bond by dragging
Double Bonds
There are four ways to draw a double bond:
Draw a bond using the Double bond tool.
Draw a single bond over an existing single bond.
Using any bond or selection tool, point to an existing bond and type ‘2’. See "Shortcuts and Hotkeys" on page 44.
Right-click any bond and select Double>Plain in the context menu.
Chapter 6: Basic Drawings
52 of 315
ChemDraw 15.0
Double Either Bonds
Double either bonds, or crossed double bonds, indicate unspecified double bond configuration, or a mixture of configurations. To draw a double either bond, use the double either bond tool
from the Multiple Bonds toolbar, or:
1. Draw a bond using the Wavy Bond tool.
2. Click the center of the bond to create a double bond.
3. Click again to create a double either bond.
Triple Bonds
There are three ways to draw a triple bond:
Draw a bond using the Triple Bond tool.
Using the Solid, Dashed, or Bold Bond tool, drag from one end of an existing double bond to the other end.
Using any bond, or selection tool, point to an existing bond and type ‘3’ on your keyboard.
Quadruple Bonds
There are three ways to draw a quadruple bond:
Draw a bond using the Quadruple Bond tool.
Using the Solid, Dashed, or Bold Bond tool, drag from one end of an existing triple bond to the other end.
Using any bond or selection tool, point to an existing bond and type ‘4’ on your keyboard.
To change a quadruple bond into a single bond:
1. Select any bond tool.
2. Drag from one end of an existing quadruple bond to the other.
You can also draw multiple bonds by right-clicking a bond and selecting the bond type from the shortcut menu, using
the bond properties dialog, or using Hotkeys. See "Bond Properties" on page 239.
Note: To reduce the bond order, select the Eraser tool and click the bond.
Dative Bonds
Dative bonds are a specific type of covalent bond in which the pair of electrons shared by the atoms in the formation
of a bond is contributed by one of the atoms only. The atom contributing the pair of electrons is known as "donor"
while the atom which does not contribute, but shares the pair of electrons, is referred to as "acceptor".
To draw a dative bond:
1. Select the Dative Bond tool.
2. Drag from the positive to the negative end (arrow head) of the dative bond.
Dative bonds are drawn with a fixed orientation in a document window.
To change the orientation of a dative bond:
Click the bond using the dative bond tool.
Chapter 6: Basic Drawings
53 of 315
ChemDraw 15.0
Wedged Bonds
To draw a wedged bond:
1. Click one of the wedged bond tools.
2. Drag from the narrow end of the wedged bond to the wide end of the wedged bond.
Wedged bonds are drawn with a fixed orientation in a document window.
To change the orientation of the wedged bond:
Click the bond using the wedged bond tool.
Note: ChemDraw treats hashed wedged bonds with the narrow end in the plane of the screen and the wide end
behind the plane.
Changing Bonds
You can change bonds by:
Changing bond types
Changing bond alignment and orientation
Moving atoms
Layering bonds
Changing Bond Types
Change a single bond from one type to another using one of the following methods:
Select a bond tool and click an existing bond
Right-click and select the new type from the context menu
With hotkeys. See "Shortcuts and Hotkeys" on page 44.
Changing Double Bonds
To change one type of double bond to another:
1. Select the Bold, Dashed, or Solid Bond tool.
2. Click a double bond.
The double bond changes to the new bond type. One of the bonds in the double bond is always a solid or dashed bond.
Note: If you click a tautomeric bond (solid/dashed) again with the dashed bond tool, you create an aromatic double
bond (dashed/dashed).
Aligning Double Bonds
Double bonds can have one of three alignments relative to other bonds— above, below, and centered.
Above
Below
Chapter 6: Basic Drawings
54 of 315
ChemDraw 15.0
Centered
1. Click the bond tool used to create the existing double bond.
2. To change the alignment, do one of the following:
Click the center of the double bond.
Right-click, point to Bond Position on the context menu, and choose the alignment.
Moving Atoms
To move an atom in a structure, click and drag it using a selection tool. To move two bonded atoms in a structure,
click and drag the bond between them.
To move individual atoms:
1. Click a selection tool.
2. Point to the atom you want to move. A highlight box appears over the atom.
3. <SHIFT>+drag the atom.
Note: You can also move atoms using a selection tool. See "Moving Objects" on page 83.
Reducing Ring Size
You can reduce the number of atoms in a ring. For example, you can convert cyclohexane to cyclopentane.
To reduce the ring size, do one of the following:
Using the selection tool, click and drag.
Using a bond tool, point to an atom and <SHIFT>+drag. Release when one atom is on top of the other. The bond
between the atoms disappears.
Bond Crossing
When one bond crosses another, you can indicate which bond is in front. The bond which is behind has a small section cut out, so you can clearly discern which bond is front-most.
To move an object to the front position:
1. Select the object to move to the front.
2. Go to Object>Bring to Front. The selected object now appears in front of all other objects.
Similarly, navigate to Object>Send to Back to position the bond behind other objects.
Chapter 6: Basic Drawings
55 of 315
ChemDraw 15.0
Note: Some file formats store 3D coordinates for atoms, while others only store 2D coordinates. For bonds with
3D coordinates, those coordinates determine the visible bond crossings. Bring To Front and Send To Back
have no effect. For more details on converting bonds and structures into 3D view, see "3D Viewing" on page 165
Fixed Bonds
By default, ChemDraw draws structures with fixed bond lengths and bond angles. The values of those lengths and
angles is determined by the settings for the particular type of document. For more information, see "Document Settings" on page 38. However, you can modify the behavior so that you are not constrained to fixed bonds and angles.
Note: To suppress fixed lengths and fixed angles, press the ALT key as you drag the bond.
Drawing Fixed Length Bonds
To draw bonds constrained to a fixed length:
1. Navigate to Object>Fixed Lengths and ensure a check mark appears next to Fixed Lengths.
2. Draw a bond using any bond tool.
Drawing Fixed Angle Bonds
Bond angles are generally either set to the default chain angle of 120 degrees, or are constrained to angles of 15
degree increments.
To draw fixed angle bonds:
1. Navigate to Object>Fixed Angles and ensure a check mark appears next to Fixed Angles.
2. Draw a bond using any bond tool.
The bonds in the new structure appear at standard 120° angles.
Changing Fixed Values
By default, bond lengths are .4176 inches and bond angles in a chain are 120°.
To change fixed values:
1. Navigate to File>Document Settings and click the Drawing category.
2. Enter a value in the Fixed Length text field. Use in, cm, pt, or picas for units.
3. Enter a value in the Chains Angle text field.
4. Click OK.
For more information on drawing settings, see "Drawing Settings" on page 23.
Chapter 6: Basic Drawings
56 of 315
ChemDraw 15.0
Atoms
By default, when you draw structures with the various bond, ring, or chain tools, simple hydrocarbons are created.
You can add atom labels to the atoms using the Text tool. You can also use the Text tool to add textual captions to a
document. For example, you can add the atom label “OH” to a drawing of toluene to create phenol:
1. Draw the toluene structure.
2. Using the Text tool, click the methyl carbon. A text field appears.
3. Type OH in the text field.
4. Click outside the text field.
To edit the atom label, click in the text field with the text tool and begin typing.
You can either enter the atom label in a text field or type the hotkey while hovering over an atom. For more information
about hotkeys, see "Hotkeys " on page 61 and "Shortcuts and Hotkeys" on page 44.
Periodic Table
You can use the periodic table to insert atoms into structures. Navigate to View>Show Periodic Table Window.
Click a symbol in the periodic table to highlight the atom and activate the Text tool. Move the mouse across the table
to highlight each atom.
To add an atom. Select the desired element in the periodic table and click an empty space in the document. The
atom appears in its chemically neutral form. For example, carbon appears as CH and hydrogen appears as H .
4
2
To label an atom. Click an existing unlabeled atom.
Chapter 6: Basic Drawings
57 of 315
ChemDraw 15.0
To change the oxidation state. Using the symbol for the atom, click the atom in the document window.
To change to a different atom. Select the new atom in the periodic table and click the atom in the drawing you want
to change.
To edit a label. You can edit an atom label using the Text tool. Highlight the text and click a symbol in the periodic
table. The highlighted text is replaced.
Repeating Atom Labels
You can repeat an atom label using the text, bond, or ring tools.
1. Click the Text tool.
2. Label a single atom.
3. Do one of the following:
Using the Text tool, double-click another atom.
Using a bond, ring, or acyclic chain tool, triple-click another atom.
Deleting Labels
To delete an atom label, do one of the following:
Select the Eraser tool and click the atom label.
With a selection, bond, or ring tool selected, point to the atom label and press the <spacebar>, <Backspace>, or
<Delete> key. Note that if an atom is labeled, pressing the <spacebar>, <Backspace>, or <Delete> key will delete
the label, but not the atom. To delete the atom as well, press the <Delete> key a second time to delete the
unlabeled atom.
Captions
You can add and edit captions to your structures using the Text tool. The following example adds the caption 'Phenol'
to a phenol structure.
To add the caption ‘Phenol’ to a phenol structure:
1. Draw the phenol structure.
2. Using the Text tool, click below the drawing and type “Phenol” in the text field.
3. Click outside the text field.
To edit the caption, click in the text field with the Text tool and begin typing. For more information, see "New Lines and
Closing Text Boxes" on page 20.
Chapter 6: Basic Drawings
58 of 315
ChemDraw 15.0
Formatting
Each new caption, or atom label, uses default document settings for font, size, and style of captions and atom labels.
You can change the format by:
Changing the document settings for subsequent drawings in the current document.
Choosing a new format for an individual caption or label from the Text menu or toolbar before you type.
Selecting text and applying a new format to an individual label after you type.
To specify the text settings for new captions and atom labels in the current document:
1. Navigate to File>Document Settings. The Document Settings dialog appears.
2. Select Text Captions or Atom Labels category.
3. Select the appropriate options.
4. Click OK. These settings affect all new captions, or atom labels, in the current document.
You can set the text format for an individual caption, or atom label, before you begin typing.
To set the text format before you type:
1. Click the Text tool and click in the document window. A text field appears.
2. Set the text format in one of the following ways:
From the Text menu, choose the format options.
From the Style toolbar, choose the format options.
3. Type the text in the text box.
Note: The format change is applied to the current text only. Any subsequent text you type is formatted according
to the default document settings for the current document.
To specify a font, style, and size for selected text, do one of the following:
Choose the font and size from the Text menu.
Right-click and choose the font and size from the context menu.
From the Style Toolbar, select the font and size from the drop-down menus.
Chapter 6: Basic Drawings
59 of 315
ChemDraw 15.0
Coloring Text
You can color captions and atom labels before or after you type them, and as a whole or in part.
To color a caption or atom label:
1. Select the Text tool.
2. Click inside the document where you want to place the text.
3. Choose a color from the Color menu.
4. Type the caption or atom label.
To color individual characters:
1. Select part of an existing caption, or atom label, using the Text tool.
2. From the Color menu, choose a color.
To color several captions or atom labels at once:
1. Select the captions or labels using a selection tool.
2. Choose a color from the Color menu.
Caption Width
To edit the width of a caption:
1. Select the caption using the Text tool. A resize handle appears on the right side of the caption.
2. Drag the resize handle to change the width of the caption.
About Fonts
ChemDraw uses the fonts installed on your computer. If a ChemDraw document contains fonts that are not available
on a particular computer, they are substituted with the available fonts.
Character Map
The floating character map window displays the 256 ASCII characters in any font. The default font is Symbol.
Chapter 6: Basic Drawings
60 of 315
ChemDraw 15.0
Use the character map to add symbols to your document in various font styles. To show or hide the map, navigate to
View>Show Character Map Window. The character map is shown below.
The character map is active only when a text field is open for editing. With a text box open, mouse over the character
map to view a larger version of the characters in the top right corner of the window. Click any character in the table to
enter it in the text field. The selected font (shown in the character map window) is applied to that character only. It
does not change the active font in the text field.
The eight most-recently used characters appear at the top of the window. A character may appear more than once in
this section if the versions use different fonts. Click the Back button to toggle among all the displayed characters.
Hotkeys
Hotkeys are keys on your keyboard that are linked to specific atom labels. Use ChemDraw hotkeys to quickly label
atoms and apply atom properties. The Hotkeys.xml file in the ChemDraw Items folder contains the hotkeys provided
with ChemDraw. You can add or change hotkeys by editing this file in a text editor.
Using Hotkeys
Using hotkeys, you can add functional groups to your structures with one keystroke. For example, to add tert-butyl to
the end of a hydrocarbon chain:
1. Draw the chain.
2. Hover the cursor where you want the functional group.
3. Press <3> (the hotkey for tert-butyl) on the keyboard. ‘t-Bu’ is added to the structure.
4. Select ‘t-Bu’ in the structure and navigate to Structure>Expand Label.
Chapter 6: Basic Drawings
61 of 315
ChemDraw 15.0
Using the hotkeys <n> (nitrogen), <O> (oxygen), and <I> (iodine), you can turn ethylbenzene into pyridin-2-yl hypoiodite.
You can also label several atoms at a time. For example, you can change neopentane (figure A below) into methanetetraamine (figure B):
1. Create the neopentane structure.
2. Use <SHIFT>+click to select all the terminal carbon atoms and press <n> on the keyboard.
Note: For a complete list of hotkeys, see "Shortcuts and Hotkeys" on page 44.
Nicknames
The simplest way to add an atomic symbol to a structure is to type the symbol into a text field. However, you are not
limited to entering atoms one-at-a-time. Using nicknames, you can add functional groups, chains, or any other structural feature without drawing each atom.
A nickname is an alphanumeric abbreviation that represents a substructure. Nicknames are useful for drawing large
structures or structures that repeatedly use similar features.
Note that you can assign a nickname to the structural feature. You can also assign hotKeys to nicknames that you
can later use as a quick way for adding the nickname to your drawing. For more information on defining nicknames,
see "Defining Nicknames" on page 138.
Using Nicknames
Using nicknames, you can add short names for functional groups to use as an atom label, or part of a label. When an
atom is labeled with a nickname, the chemical significance of the expanded structure is retained.
Chapter 6: Basic Drawings
62 of 315
ChemDraw 15.0
Commonly used nicknames, such as Me, Et, and Ph are stored in your ChemDraw Items folder. You can edit or
delete nicknames in this list.
You can assign hotkeys to nicknames. For example, the hotkey <4> labels an atom with “Ph”, which represents a
phenyl group.
Applying Nicknames
You can either type the nickname or select it from the nicknames list. For more information on defining nicknames,
see "Defining Nicknames" on page 138.
To use a nickname to label an atom:
1. In a structure, double-click an atom with a bond tool, or click an atom with the Text tool. An atom label text field
appears. Do one of the following:
Type a nickname label, such as “Et”.
Navigate to File>List nicknames. The List Nicknames dialog appears.
Select the required nickname and click Paste.
Click Done.
An example is shown below:
To select a nickname to apply to an atom using a hotkey:
1. Point to an atom.
2. Press the hotkey <=> (equal sign). The Choose Nickname dialog appears.
Chapter 6: Basic Drawings
63 of 315
ChemDraw 15.0
3. Select a nickname from the list.
Tip: You can move within the nickname list by typing the first letter of the nickname, rather than scrolling through
the list.
4. Click OK.
Note: Nicknames are tokens and do not flip orientation when applied to the left side of a structure when using Automatic Justification. For example, in the absence of a defined nickname, the label “OTHP” appears as “PHTO”.
However, since the nickname “THP” is defined, the label appears as “THPO”. For more information, see "Aligning
Text" on page 27.
Expanding Nicknames
If your structures contain defined nicknames, long atom labels, or contracted labels, ChemDraw can restore your
structures to the fully expanded form. While expanding a structure containing a defined nickname, the nickname will
be replaced by its expanded structure, as shown below:
For Biopolymers, when you expand the nickname, residue label appears below the expanded amino acid. For
example, assume you have a chain of three amino acids– glycine, isoleucine, and leucine:
To select the amino acid, double-click the nickname, as shown:
Chapter 6: Basic Drawings
64 of 315
ChemDraw 15.0
To expand atom nicknames,
1. Select the selection tool.
2. Select the label to expand, or double-click the structure to select all labels in the structure.
3. Navigate to Structure>Expand Label. Your structure is redrawn in its expanded form.
To contract expanded nicknames:
1. In the biopolymer structure, select the expanded part.
2. Navigate to Structure>Contract Label. Your structure is redrawn in its contracted form.
Note: This is applicable only to biopolymers.
Annotations
Annotation is a brief description of an object, or a comment, about properties of an object. Annotations are useful in
identifying features and categories of objects in searching and browsing. Annotations are categorized using
keywords. There are several default keywords: Name, Description, GUID (Globally Unique Identifier) Type, and
Other Info. You can also add your own keywords. Many of the objects in the template files have associated annotations to help you identify them in files.
To annotate an object:
1. Select the object.
2. Navigate to Object>Annotate. The Annotate dialog appears.
3. In the Keyword list, do one of the following:
Select a keyword.
Select Add New Keyword.
4. In the Content text field, enter the notes (annotation) to apply to the object or drawing.
5. Click OK.
Deleting a Keyword
When you delete a keyword, all notes (annotation) for that keyword are also deleted.
1. In the Annotate dialog, select the keyword from the Keyword list.
2. Click Delete Keyword.
3. Click OK.
Setting preferences
You can specify how the captions and labels appear each time you use ChemDraw. The changes you specify are
available throughout the application. Navigate to File>Preferences and click the Building/Display tab. Then,
choose from these options:
Automatic Atom Label Alignment. The alignment of atom labels adjusts according to the positions of any bonds
attached to the atom labels. For example, ‘CH ’at the left end of a horizontal bond changes to ‘H C’.
3
3
Chapter 6: Basic Drawings
65 of 315
ChemDraw 15.0
Automatically Rectify Hydrogens in Atom Labels. Adds or removes hydrogens from atom labels to preserve
standard valences when you change your drawing. For example, if you increase the bond order in ethane to make
ethylene, the ‘CH ’ changes to ‘CH ’.
3
2
Setting Default Atom Label Styles
To set the default character style for atom labels, navigate to File>Document Settings and click Atom Labels. You
can modify the font style, baseline style, and whether terminal carbons and implied hydrogens appear.
To set the default atom label style for a document:
1. Navigate to File>Documents and Settings.
2. From the Atoms Labels tab, check the Show Labels on Terminal Carbons check box.
3. Click OK.
To set the default atom label style for one or more structures:
1. Select and right-click the structure(s).
2. Click Object Settings in the context menu. The Object Settings dialog appears.
3. From the Atom Labels tab, check the Show Labels on Terminal Carbons check box.
To add or remove a terminal carbon label, right-click the atom and select or deselect Show Terminal Carbon
Labels.
Chemical Significance
By default, captions are considered to be chemically significant, if possible. If you create a label, for example,
"CH3OH”, you are able to attach bonds to it (and it is modified appropriately) even though you may have intended it to
be a label, not a molecule. Moreover, it’s values are included in the Analysis window. The labels with incorrect
valences are marked with a red box.
To remove the red box:
1. Select the label with the Selection tool.
2. Right-click and deselect Interpret Chemically in the context menu.
3. To activate chemical significance, right-click the label and select Interpret Chemically.
Analysis Data
You can add properties from the Analysis window to a caption and, if Auto-update is on, the values update as you
modify the structure. For more information about Auto-update, see "Auto Update" on page 147.
Chapter 6: Basic Drawings
66 of 315
ChemDraw 15.0
To add analysis data to a caption:
1. Right-click the structure and select Analysis from the context menu.
2. Choose the properties to add.
Drawing Rings
The Main Tools palette contains the following ring tools that enable you to draw ring sizes and types:
Figure 6.3: a)cyclopropane; b)cyclopentane; c)cycloheptane; d)cyclohexane chair(1); e)cyclopentadiene; f)cyclobutane; g)cyclohexane; h)cyclooctane; i) cyclohexane chair(2); j)benzene.
To draw a ring:
1. From the Main toolbar, select a ring tool.
2. Click and drag in the document to orient the ring.
If you click an atom or bond with a ring tool in an existing structure, the ring is fused to it. You can also use hotkeys to
fuse rings. For more information, see "Bond Hotkeys" on page 45. You can also reduce the size of the rings. For more
information, see "Reducing Ring Size" on page 55
Spiro and Sprout Rings
By default, clicking an atom in a ring using a ring tool forms a spiro link. However, if you click an atom while pressing
the <Alt> key on your keyboard, it will sprout the ring.
Chapter 6: Basic Drawings
67 of 315
ChemDraw 15.0
You can change this behavior so that a sprout bond appears instead of a spiro ring:
1. Navigate to File>Preferences.
2. From the Building/Display tab, check the Sprout Rings Instead of Spiro When Clicking check box.
Cyclohexane Chair Rings
You can draw cyclohexane chair rings in two orientations: horizontal and vertical. When you draw a cyclohexane chair
ring by clicking, the chair is drawn in a horizontal orientation.
To orient a cyclohexane chair ring to a vertical orientation:
1. Click one of the Cyclohexane Chair Ring tools.
2. Click+drag in the structure to the orientation you want.
Figure 6.4: a)Horizontal orientation; b)Vertical orientation.
Chapter 6: Basic Drawings
68 of 315
ChemDraw 15.0
Aromatic Structures
Delocalized Rings
You can draw a resonance delocalized ring using any ring tool except for the cyclohexane chairs.
1. Click a ring tool.
2. Press the CTRL key and drag or click in the document window.
Resonance Structures
You can draw cyclopentadiene or benzene in multiple versions:
The double bonds in the cyclopentadiene or benzene ring tools can be drawn in either of two forms. Normally, the first
bond drawn is a double bond. This is the orientation indicated on the cyclopentadiene and benzene Ring tool pointers.
To draw, click in the document window with either the cyclopentadiene or benzene drawing tool.
To shift the orientation so the first bond drawn is a single bond, do one of the following:
<Shift>+drag from the beginning of the first single bond to the end of the single bond.
<Shift>+click in a document window to draw the bond with a fixed length.
Chains
You can draw hydrocarbon chains using either the Acyclic chain tool or Snaking chain tool. Use the Acyclic chain tool
to draw straight hydrocarbon chains.
1. Select the Acyclic chain tool.
Chapter 6: Basic Drawings
69 of 315
ChemDraw 15.0
2. Click and drag in the document window in the direction you want the chain to grow. The number at the end of the
chain indicates how many atoms you have drawn.
Changing Chain Direction
To change the direction as you draw, use the Snaking chain tool, or press the <Control> key with Acyclic tool selected, while drawing in the direction you want.
Note: Release the mouse button before you release the <Control> key.
Applying Fixed Lengths
Applying fixed lengths and fixed angles enables you to create structures with consistent bond lengths and angles. The
fixed length dimension is set in the Drawing Settings dialog. The fixed angle dimension increments angles by 15
degrees.
Fixed length is used to constrain the length of the bonds drawn to the length you specify when the Fixed Lengths
command in the Object menu is enabled (with a check mark). This also adjusts the preferred bond length for structures modified by the Clean Up Structure command.
When Fixed Lengths is enabled, the pointer on the Acyclic chain can be dragged to make any angle relative to the Xaxis. At a constant chain length, the positions of the first bond and all subsequent odd-numbered atoms depend on the
direction you drag. Before releasing the mouse button, change this position by dragging in the opposite direction.
If Fixed Lengths is disabled, hold down the <Control>+<ALT> keys to reverse chain direction. Fixed Angles must
be enabled to reverse direction.
Fixed Angles
When Fixed Angles is enabled, the angle the Acyclic chain makes relative to the X-axis is constrained to 15-degree
increments.
Adding Chains to Structures
To add an Acyclic chain to an existing structure, click an atom in the structure. Click and drag in the direction you
want to draw the chain.
Specifying Chain Length
To specify the exact length of a chain before you draw it:
1. Select the Acyclic chain tool.
2. Click an existing atom or an empty area in a document window. The Add Chain dialog appears.
3. Type the number of carbon atoms in the chain.
4. Click Add.
To add another chain of the same length anywhere in a document window, <ALT>+click where you want the chain to
begin.
Chapter 6: Basic Drawings
70 of 315
ChemDraw 15.0
Objects
Use the tools on the main toolbar to add shapes to your documents. You can tear off the palettes and place them
where you want within your drawing window. You can rotate an object using its rotation handle and scale or distort an
object by using the resize or distortion handles.
Arrows
You can use arrows to show the conversion of reactants to products and to indicate electron flow. You can customize
arrows not only for length and angle, but for arrowhead width and shape. You can also drag an arrow from its middle to
create an arc of any length. When you create an arc, the angle of the arrow is modified.
When you mouse-over an arrow with the Lasso, Marquee, or an Arrow tool selected, the adjustment handles appear,
for example:
Drag the adjustment handles to change the arrow length, angle, or shape. When changing the angle of an arrow, you
are restricted to multiples of 15° if Fixed Angles is enabled. Hold down the <Alt> key to drag to any angle. You can
also create an arrow by drawing an arbitrary spline using the pen tools, and adding an arrow head.
Arrow Heads
There are three arrow head shapes: solid, hollow, and angled. To change the shape, right-click an arrow and choose
the shape from the context menu.
Arrow heads shapes are: A) Solid arrow head; B) Hollow head; and C) Angled head.
Arrow Types
ChemDraw offers a variety of arc types and arrow types, such as, crossed (no-go) arrows, equilibrium arrows of
unequal lengths, and elliptical arcs.
Arc Arrows
There are two ways to create an arc arrow:
1. Click and drag the arc adjustment handle of a straight arrow.
Figure 6.5: A) Arc adjustment handle
2. Select an arc arrow from the Arrows palette.
You can customize arc arrows as easily as straight arrows. Some examples are:
Chapter 6: Basic Drawings
71 of 315
ChemDraw 15.0
a. To undo all changes made to an arrow except for the change in length, click the arrow with the same arrow tool.
b. Click an unmodified arrow, or one that has had only its length changed, to reverse its direction.
Hollow Arrows
You can rotate hollow arrows and change their length and width. You can also modify the angle and create hollow arc
arrows, just as with regular arrows.
You can modify arrows with a context menu command. Some of these commands are also found on the Curves
menu. Use the context menu to create arrows for which there are no tools, such as bold-dashed or dipole.
Chapter 6: Basic Drawings
72 of 315
ChemDraw 15.0
Connecting Arrows
You can connect a new arrow to an existing arrow at either end or at the midpoint.
Note: The terms “left” and “right” in the context menu are relative, and refer to the direction the arrowhead is pointing.
For example, to draw a new arrow starting at the midpoint of an existing arrow:
1. Select from the Arrows palette an arrow type for the new arrow.
2. Place your cursor over the midpoint of the existing arrow and hold down the <shift> key. The adjustment handle
changes to a small highlighted rectangle and the cursor changes to the '+' symbol.
3. While pressing the <shift> key, draw the new arrow starting from the existing arrow’s midpoint.
You can also drag existing arrows and connect them. Here are a few examples:
Chapter 6: Basic Drawings
73 of 315
ChemDraw 15.0
Finally, arrows can be rotated using the Structure Perspective tool, as well as the Lasso, or Marquee. For more information on using the Structure Perspective tool, see "Structure Perspective" on page 125. Combining these methods
lets you draw an unlimited number of arrows.
Equilibrium Arrows
With equilibrium arrows, changing the length changes both arrows proportionately; changing the shape of the arrowhead changes both arrowheads identically.
To change the length of one arrow, hold down the <Alt> key. Two new adjustment handles appear. When adjusting
one arrow of an equilibrium arrow, the arrow cannot be extended beyond its original length.
Curved Arrows
You can curve most arrows found on the Arrows toolbar. After you paste an arrow in your drawing, click and drag the
selection point in the middle of the arrow.
As you drag the selection point, the angle of the arc appears, measured in degrees.
Colored Arrows
To color an arrow:
1. In the drawing window, select the arrow to color.
2. Select a color from the Color menu.
Coloring Block Arrows
For block arrows (those that are not made of simple lines), you can apply colored effects using the filled, faded, and
shaded options.
To apply color effects on block arrows:
1. Select a block arrow from the Arrows palette and right-click the block arrow.
Chapter 6: Basic Drawings
74 of 315
ChemDraw 15.0
2. Select a color from the Color menu.
3. From the context menu, choose either Filled, Faded, or Shaded.
Drawing Elements
Drawing elements are simple shapes, such as, circles and rectangles.
1. To group drawing elements with a structure, navigate to Object>Group. See "Grouping Objects" on page 85.
2. To move an object, select it, and click and drag it with a Selection tool. See "Moving Objects" on page 83.
Circles and Ovals
To draw a circle or an oval:
1. Select one of the Circle or Oval tools.
2. Point where you want the center of the circle or oval.
3. Drag outward from the center.
Resizing and Rotating
You can resize and reshape ovals and rectangles for both length and width. Circles have only a radius adjustment.
Rectangles also have corner handles that proportionately adjust length and width.
Figure 6.6: A) rectangle corner handles
1. Point to a shape with its drawing tool, or a selection tool, to display adjustment handles.
2. Click and drag to modify the shape.
Lines
Lines look similar to bonds, but behave differently:
Lines are not included in chemical interpretation.
Lines that cross appear solid, bonds do not.
To draw a line:
Chapter 6: Basic Drawings
75 of 315
ChemDraw 15.0
1. In the Drawing Elements toolbar, select a line tool.
2. Click and drag in the drawing window where you want the line.
Arcs
You can draw solid or dashed arcs of different angles: 90°, 120°, 180°, and 270°.
To draw an arc:
1. Do one of the following:
In ChemDraw Standard, point to an Arc tool and drag in the palette to select the angle.
In other ChemDraw applications, point to the Drawing Elements tool and drag in the tool palette to select the
angle.
2. Drag from left to right (for a convex arc), or from right to left (for a concave arc).
Editing Arcs
To resize or rotate an arc:
1. Position the Arc tool over the arc. Drag points appear on the ends and in the middle.
2. Drag either end of the arc to change its length.
3. Drag the center point to change the curvature.
4. Use a selection tool to change its size or orientation.
Navigate to View>Show Info Window to display the info window. The Info window indicates the distance between
the ends of the arc and the angle the clockwise end makes with the X-axis.
When you drag the resize handle, the Info window indicates the percentage as enlarged or reduced. When you drag
the Rotation handle, the Info window indicates the degree rotated. For more information about Info window, see "The
Info Window" on page 84.
Chapter 6: Basic Drawings
76 of 315
ChemDraw 15.0
Brackets
Brackets includes braces { }, brackets [ ], and parentheses ( ). Brackets are commonly used to illustrate polymers. For
more information on polymers, see "Polymers" on page 243.
Single brackets
You can draw a single bracket in any orientation. Select a single bracket tool from the Brackets palette.
1. Point where you want the bracket to start.
2. Drag from one end of the bracket to the other end.
Paired Brackets
Paired brackets can be placed only in a vertical orientation. A rectangle or box defines their position.
To draw paired brackets:
1. Select a paired bracket tool from the Brackets palette.
2. Point where you want a corner of the bracket.
3. Drag diagonally from one corner of the box to the opposite corner.
Daggers
To draw a dagger:
1. Select a dagger tool from the Brackets palette.
2. Click in the drawing window.
Note: To resize a dagger, select the dagger and click and drag one of its resize handles.
Framing Objects
You can enclose your drawings or group structures with a rectangle, brackets, parentheses, or braces.
To enclose your object:
1. Select the drawing to enclose.
2. Navigate to Object>Add Frame and select a frame type.
Pen Tools
The pen tools are useful for drawing freehand curves and shapes.
To draw a curve, do one of the following:
Select the Draw Curve tool from the Pen Tools palette on the Main toolbar and click and drag your cursor across
the drawing window.
Navigate to View>Other Toolbars>Pen Tools. Select the Draw Curve tool, and click and drag your cursor
across the drawing window.
Editing Curves
You can edit a curve by selecting it and manipulating it with Edit Curve tool.
Chapter 6: Basic Drawings
77 of 315
ChemDraw 15.0
To select an existing curve for editing:
1. Select the Edit Curve tool from the Pen Tools palette on the Main toolbar.
2. Point at the curve. The cursor will change from a “+” to an arrow when you are positioned correctly.
3. Click to select the curve. The curve is selected and adjustment handles appear along the curve, as shown below:
The cursor appears as a hand with a “+” sign inside
. However, when the cursor is positioned exactly over the
points on the curve, the '+' symbol disappears and the cursor appears as a hand.
Changing the Shape of a Curve. Use the square handles at the end of the curve to increase or decrease the length
of the curve. Use the endpoints of the direction lines to change the direction of the curve.
To change the shape of a curve:
Drag the direction lines to create the shape you want.
Chapter 6: Basic Drawings
78 of 315
ChemDraw 15.0
Adding a Segment. You can add a segment to an existing curve by selecting the curve with Edit Curve tool, and
clicking in the document window with the Edit Curve tool selected. A segment is added to the end of the curve.
Freehand Shapes
To create a closed freehand shape, draw a curve and navigate to Curves>Closed. To add curve properties, select
Filled, Faded, or Shaded under the Curve menu or in the Curve toolbar. Curves can also have arrowheads, which
lets you create arbitrarily-shaped arrows. To add color, select a color in the Color menu.
Figure 6.7: A freehand curve with different properties; A) A simple curve; B) enclosed; C) filled; D) faded; and E)
shaded.
Selecting Objects
Use the Lasso for freehand selections and the Marquee to select rectangular regions.
When you select a structure or object, the selection displays with a colored frame around it. The frame includes
handles for rotating, distorting, and resizing your selection.
The Lasso Tool
Use the Lasso tool to make a freehand selection of irregular areas.
To select objects using the Lasso tool:
1. Select the Lasso tool.
2. Press the mouse button while the pointer is not over any object.
3. Drag around part of a structure or other object.
As you drag, a line appears that defines the selection area. Bonds, structures, or other objects are selected only if
they are entirely within this area.
Chapter 6: Basic Drawings
79 of 315
ChemDraw 15.0
The Marquee Tool
Use the Marquee tool to select objects and structures within a rectangular area.
1. Select the Marquee tool.
2. Click and drag diagonally over the structures or other object.
As you drag, a rectangle appears that defines the selection area. Objects are selected only if their center, or a major
portion of the object, or the object is entirely within selection rectangle.
To set one selection tool to behave like the other, click either one of the tools while pressing <Alt> .
To toggle a selection tool and the last drawing tool used, press <Control>+<Alt>+<Tab> .
Selecting Entire Structures
To select an entire chemical structure, double-click a bond or atom in the structure using a selection tool.
If the chemical structure or other object is part of a group, the group is selected.
Selecting Objects by Clicking
1. Select the Lasso or Marquee tool.
2. Point to an object in a document window.
A highlight box appears over the pointed object.
3. Click the object.
The selected objects appear within the selection rectangle and the cursor changes to a hand.
Note: You can also select the individual objects in a group. See "Grouping Objects" on page 85.
Selecting Multiple Objects
When you select multiple objects, each object displays a selection box.
To add more objects to the selection, press <shift> and select the other objects.
To select all objects, navigate to Edit>Select All.
Deselecting All Objects
To deselect all objects, do one of the following:
Click an empty area outside the selection rectangle.
Press <esc>.
Select a different tool.
Select another object without holding down the <shift> key.
Deselecting One Object
To deselect one of several selected objects, hold down the <shift> key and click the object with a selection tool.
Note: As shown in the figure below, objects may appear within the borders of the selection rectangle, but not be
selected. Note that the central ring in the example below is not selected.
Chapter 6: Basic Drawings
80 of 315
ChemDraw 15.0
Resizing Objects
You can resize objects by dragging the resize handle of a selected object or by scaling.
To resize a selected object proportionately:
1. Select the objects to resize. The resize handle is located in the lower right corner of the selection rectangle.
2. Point to the Resize handle. The cursor becomes a double-headed arrow.
3. Drag the resize handle until the object is the size you want.
In most cases, when you resize an object, the aspect ratio of the object (the ratio of the height to width) does not
change. However, it is possible to distort certain objects including chemical structures, circles, boxes, and ovals.
To distort an object in the horizontal or vertical direction:
1. Select the object
2. Do one of the following:
Drag the handle on the desired side
Chapter 6: Basic Drawings
81 of 315
ChemDraw 15.0
<Shift>+drag the Resize handle in the desired direction. The <shift> key modifies the resize operation so that
you can distort objects along the X-axis or Y-axis.
Rotating Objects
1. Select an object to rotate. For objects that can be rotated, the rotation handle appears at the top of the selection
rectangle.
2. Drag the rotation handle clockwise or counterclockwise.
3. To rotate an atom label with a structure, press the <control> key while dragging the structure.
Note: If a single atom is unselected when a structure is rotated, the structure rotates around the unselected atom,
as shown in the example below:
To rotate a selected object by a specified angle:
1. Do one of the following:
Navigate to Object>Rotate.
Double-click the rotation handle. The Rotate Objects dialog appears.
2. Enter a number and click either degrees CW for a clockwise rotation or degrees CCW for counterclockwise rotation.
3. To rotate the atom label text, select Rotate Atom Labels.
4. Click Rotate. Objects are rotated around the center of the selection rectangle.
To repeat the same rotation on any object in the document window:
1. Immediately after rotating an object, select the other objects to rotate.
2. Navigate to Edit>Repeat Rotate.
Moving the Center of Rotation
By default, an object turns around its center when you rotate it. However, you can move the center of rotation so that
the object rotates around an atom or some other location on the page.
To move the center of rotation:
Chapter 6: Basic Drawings
82 of 315
ChemDraw 15.0
1. Select the object. A center of rotation indicator (‘+’) appears in the center of the object, as shown in the figure:
Figure 6.8: A) Center of rotation
2. While pressing the <alt> key , click and drag the indicator to another location. See the example below:
Figure 6.9: B)center of rotation moved
3. To rotate the object, click and drag the rotation handle.
To reset the center of rotation to its default position, deselect the object.
Note: If you drag close to an atom, the center of rotation will snap to the atom position.
Moving Objects
1. Select an object to move using a selection tool.
2. Click and drag the object to a new location.
To constrain the movement to the horizontal or vertical direction, <shift>+drag the selected objects.
Small incremental movements are often useful for aligning objects.
To move an object a incrementally:
1. Select the object.
2. Press an arrow key. The selected object moves 1 point in the direction of the arrow.
Note: To move in a larger increment, hold down the <alt> key while pressing an arrow key. The selected objects
moves 10 points in the direction of the arrow.
Copying Objects
1. Select one or more objects.
2. <Control>+drag the object(s) to create a copy and position it.
Chapter 6: Basic Drawings
83 of 315
ChemDraw 15.0
To constrain the copy to move only vertically or horizontally while positioning it, hold down the <shift>+<control>
keys.
The Info Window
This window displays the size and position of the pointer and of anything you have selected. To show, or hide, the window, navigate to View>Show Info Window.
Pointer
X and Y display the current mouse coordinates. dX and dY indicate the change in X and Y of a moved selection.
Selection
X and Y display the position of a selection. W and H are the width and height.
Other
Angle is the angle of a bond or rotation of a selection. Dist is the bond length or the distance a selection has moved.
When resizing an object, % indicates the current percentage of the original size.
Mirror Images
You can reflect structures through planes perpendicular to the X-axis or Y-axis. By copying a structure, you can create
its mirror image to create stereoisomers.
To create a mirror image:
1. Draw a structure with defined stereochemistry, for example, wedged bonds.
2. <control>+drag the structure to copy it.
3. With the copy still selected, navigate to Object>Flip Horizontal or Flip Vertical. You can also use the Flip Horizontally or Flip Vertically tools on the Object toolbar.
Chapter 6: Basic Drawings
84 of 315
ChemDraw 15.0
Deleting Objects
To delete selected objects, do one of the following:
Press the <delete> key.
Navigate to Edit>Clear.
Use the Eraser tool.
Joining Structures
To join two structures so that they share a bond:
1. Select a bond in the first structure.
2. <Shift>+click to select the bond in the second structure.
3. Navigate to Object>Join.
To join two structures so that they share an atom:
1. Position the two chemical structures so that the atoms you want to fuse are near each other.
2. Select the two atoms to be joined.
3. Navigate to Object>Join.
Note: When you join two differently colored bonds or atom labels, the color of the front object becomes the color of
the resulting joined object. When you join two atoms that are labeled, the front atom label becomes the atom label
of the resulting atom. For more information about front to back ordering of objects, see "Page Layout" on page 9.
Grouping Objects
A group is a collection of objects that act as a single object. You can select all grouped objects by double-clicking on
any of the contained objects with a selection tool.
When you group objects so that the individual objects in the group cannot be selected, you create an integral group.
When you select any object in an integral group, the entire group is selected. Objects within a non-integral group can
be selected individually and manipulated while still remaining part of the group.
You can change the position or orientation of grouped objects. Individual objects within the group maintain their relative positions when the grouped objects are rotated, aligned, or distributed.
Atoms and bonds making up a single chemical structure are always grouped. If you group part of a structure with other
objects, the resulting group contains the entire structure. If you add atoms or bonds to a grouped structure, the new
atoms and bonds are part of the group.
To group objects:
1. Select the objects using a selection tool.
2. Navigate to Object>Group.
To select an individual object within a group, move the selection tool over the object until it is highlighted, and click
once.
Chapter 6: Basic Drawings
85 of 315
ChemDraw 15.0
To select grouped objects, move the selection tool over an object in the group until it is highlighted, and double-click
it.
Ungrouping Objects
To ungroup objects:
1. Select a group.
2. Navigate to Object>Ungroup, or right-click the group and select Group>Ungroup.
To create a group so that individual objects cannot be selected (integral group):
1. Select the objects.
2. Navigate to Object>Group.
3. Right-click the group and select Group>Integral.
To restore an integral group to a regular group:
1. Select the integral group.
2. Right-click the group and deselect Group>Integral.
Note: Many of the shapes and drawings within the template documents are integral groups. However, they can be
ungrouped and edited.
Scaling objects
To scale one or more objects to a different size:
1. Select the object(s).
2. Do one of the following:
Go to Object>Scale.
Double-click a resize handle. The Scale Objects dialog appears.
3. Do one of the following:
To scale bonds so that the Fixed Length becomes the new median bond length, select Scale selected objects so
that median bond is Fixed Length(0.4167 in).
Chapter 6: Basic Drawings
86 of 315
ChemDraw 15.0
To scale the bonds to a new fixed length that you specify, select Scale selected objects so that median bond
is, and type the new median bond length in the text field.
To scale the object to a percentage of the current size, select Scale by, and specify the percentage in the text
field. A value greater than 100% enlarges it; a value less than 100% reduces it.
4. Click Scale.
Centering Objects
To center an object (or group of objects) on the page:
1. Select the object.
2. Navigate to Object>Center on Page.
The selected object moves so that the center of the selection rectangle is at the center of the page.
Aligning Objects
You can align objects vertically and horizontally along their centers or edges.
Note: Objects are aligned with the selected object that appears highest on the page.
To align two or more objects:
1. Select the objects.
2. Navigate to Object>Align.
Note: If you select only part of a structure or group with a selection tool, only that part is used for the alignment,
but the entire structure or group moves.
Distributing Objects
Use the distribute command to distribute objects horizontally or vertically and at an equal distance apart.
To distribute three or more objects:
1. Select the objects to distribute.
2. Navigate to Object>Distribute, and choose Vertically or Horizontally.
Figure 6.10: Distributing objects
The space between the objects is equalized. The upper, lower, right, and left positions of objects in your selection
remain unchanged.
Chapter 6: Basic Drawings
87 of 315
ChemDraw 15.0
Clean Up Structure
The Clean Up Structure command is used to neaten the appearance of molecules by regularizing bond lengths and
angles. Graphic objects, such as arrows and aromatic circles, are not affected. You can use this command to redraw
structures that you may have drawn freehand, or to neaten structures that you may have imported from another application.
For certain compounds, the Clean Up Structure command produces a structure that extends beyond the bounds of
the page. To view the entire structure, scale the structure or increase the size of the printed page. See "Scaling
objects" on page 86 and "Page Setup" on page 11.
The Clean Up Structure feature follows these rules:
Bonds are set to the target Fixed Length specified in the document settings. For more information, see "Document
Settings" on page 38.
A ring is redrawn only if all of its bonds are selected.
Multi-attached atom labels, variable attachment points, and multi-center bonds cannot be cleaned.
Structures are rotated so that as many bonds as possible are directed at a multiple of 15 degrees.
Clean Up Structure preserves stereochemical meaning rather than the precise identity of wedged, or hashed
bonds, as shown below.
To use Clean Up Structure:
1. Select the structure, or part of the structure, to clean up.
2. Navigate to Structure>Clean Up Structure, or type <shift>+<ctrl>+<K> .
Note: The Clean Up Structure command redraws your structure in iterations. Therefore, you may need to select
the command more than once.
Chapter 6: Basic Drawings
88 of 315
ChemDraw 15.0
You can also clean up a reaction, or a biopolymer. For more information, see "Clean Up Reactions" on page 130 and
"Clean Up Biopolymers" on page 106
Checking Structures
You can check the chemistry of a selected structure, part of a structure, or caption (in Formula style) with the Check
Structure command. The structure is checked using normal valences and elements, and defined nicknames.
To check the valences of all selected atoms in a structure:
1. Select a structure, part of a structure, or caption.
2. Navigate to Structure>Check Structure.
If a structure is incorrect, a message window appears, for example:
3. To continue checking the structure, click Ignore.
4. To ignore all subsequent errors, click Ignore All.
5. To stop checking for errors, click Stop.
Checking Copied Structures
To automatically perform a check structure analysis each time you copy a structure from the clipboard:
1. Navigate to File>Preferences.
2. From the General tab, click Check Structure When Copying to Clipboard or Exporting.
This change affects all documents.
Chemical Warnings
ChemDraw checks chemical syntax as you draw. If it finds an error in your structure, a wavy red box appears around
the object. The box displays on the screen only and does not print.
Disabling Chemical Warnings
Warnings display by default. To disable chemical warnings, navigate to View>Show Chemical Warnings.
Chapter 6: Basic Drawings
89 of 315
ChemDraw 15.0
To disable error checking on a specific object, right-click the object and deselect Display Warnings on the context
menu.
When Display Warnings is disabled for an object:
A red box does not appear around the object.
Problems are reported by the Check Structure command (Navigate to Structure>Check Structure).
To view a description of the problem, perform one of the following:
Point at the warning with the mouse to display a tool tip that describes the error.
Right-click the warning and select Explain This Warning.
Select the structure and navigate to Structure>Check Structure.
Warning Preferences
To select which types of chemical warnings to display:
1. Navigate to File>Preferences.
2. Click the Warnings tab.
3. Select the types of warnings and click OK.
The types of warnings are listed below:
Warning
Description
An Object drawn has an improper valence or charge. For example, when positive and neg-
Valence and Charge
ative charges have been assigned to the same element, charges have been assigned in
Errors
more than one way, or a charge has been assigned to a nickname, generic nickname, or
alternative group name.
Unbalanced Parentheses
Parentheses are not matched into nested open-close pairs.
Generated for invalid isotopes. For example, this warning is generated for every label that
Invalid Isotopes
has a numeric superscript immediately preceding an atomic symbol, where the superscripted number does not correspond to a recognized isotope. For example, 24CH3.
Isolated Bonds
Atoms Near Other
Bonds
Unspecified StereoChemistry
Ambiguous Stereochemistry
An unlabeled single bond is not attached to other bonds.
An atom is close to a bond but not attached to it.
An asymmetric center is without attached wedged, hashed, dashed, or bold bonds.
A stereocenter where the absolute stereochemistry cannot be determined from the structure as drawn. For example, this warning would be generated for a carbon atom attached
by bold bonds to four different ligands.
Chapter 6: Basic Drawings
90 of 315
ChemDraw 15.0
Warning
Stereobond between
Chiral Atoms
Linear Atom
Description
A stereobond connects two stereocenters.
An unlabeled atom is attached to exactly two identical bonds that create a 180 degree
angle.
Chapter 6: Basic Drawings
91 of 315
ChemDraw 15.0
BioDraw (Professional Level only)
ChemDraw includes a variety of tools for drawing metabolic pathways, such as enzymes and receptors. To display
the BioDraw toolbars, navigate to View>Show BioDraw Toolbar.
You can also include standard shapes, such as, circles, ellipses, and arrows, using the Drawing Elements tool palette
or the Arrows tool palette. You can also create custom shapes using the Curve tool.
You can change the color of an object, change its line and fill properties, and rotate it.
To create a BioDraw object, either click or drag on the page where you want it to appear. Clicking gives you the default
size and shape, dragging lets you not only scale the object, but also distort it by dragging on the X and Y axes. Linear
objects elongate in the direction they are dragged. The membrane and protein tools (DNA and helix) add more subunits as they are dragged and display the subunit count. You can also ungroup an object and move, or remove,
unwanted parts and retain only those parts of the object that you require.
To ungroup an object:
1. From the context menu, navigate to Group>Integral.
2. Select Group>Ungroup. The object is ungrouped and you can move each object independently.
BioDraw Templates
ChemDraw Professional includes a variety of templates for illustrating biological systems in full color for publication.
1. To open a template:
2. Navigate to View>Templates.
Select the template toolbar you want. Some of the available BioDraw templates are shown below.
Chapter 7: BioDraw (Professional Level only)
92 of 315
ChemDraw 15.0
Advanced BioDraw
Anatomy Templates
Chapter 7: BioDraw (Professional Level only)
93 of 315
ChemDraw 15.0
Animals
Bio Instruments
Microorganisms
Organelles
Chapter 7: BioDraw (Professional Level only)
94 of 315
ChemDraw 15.0
For more information, see "Templates" on page 136.
Customizable Objects
The table below describes the BioDraw objects in the BioDraw toolbar, which can be customized. When customizing
a BioDraw object, you must use a selection tool, or the same tool used to create it.
Tool
Customization Options
Receptor
width
G-protein, gamma
shape
subunit
Helix Protein
height, width of the strands, width of the cylinders, spacing
DNA
height, width of the strands, offset of the
second strand, spacing
Membrane (line)
size of subunit
(The overall length remains constant, and the
number of subunits changes in inverse proportion to the size.)
Membrane (arc)
length, arc, size of subunit
Membrane
size of subunit
(ellipse)
Micelle
size of subunit
Plasmid map
add/adjust markers and regions
Ribosomes
resize, color
tRNA
resize, color
These tools in the BioDraw toolbar cannot be customized:
Ion channel
G-protein, alpha subunit
Ion channel
G-protein, beta subunit
Immunoglobulin
Golgi body
Endoplasmic
Mitochondrion
reticulum
Cloud
resize, color
Chapter 7: BioDraw (Professional Level only)
95 of 315
ChemDraw 15.0
Membrane Line
1. Select the membrane line tool from the BioDraw toolbar.
2. Click and drag to draw a membrane line of the size you want or click for the default size.
When orienting the membrane, note that you are constrained to 15 degree increments when fixed angles are applied
(navigate to Object>Fixed Angles). To override the constraint, press <shift> key as you drag.
To resize the membrane units, click and drag the adjustment handle at the membrane center.
Tip: To change the length, select the membrane and drag the left or right handle of the selection box. You can
deselect it and readjust the subunit size.
Membrane Arc
To create a membrane arc, click and drag in a curve using the Membrane Arc tool in the BioDraw toolbar.
The tool has three adjustment handles:
The handle at the starting point controls the length.
The center handle controls the subunit size.
The handle at the leading edge controls the arc.
Helix Proteins
To create a helix protein:
1. Select the Helix Protein tool from the BioDraw toolbar.
2. Drag in the document window, or click to draw the default size.
When orienting the protein, note that you are constrained to 15 degree increments when fixed angles are applied (navigate to Object>Fixed Angles). To override the constraint, press <shift>key as you drag.
Chapter 7: BioDraw (Professional Level only)
96 of 315
ChemDraw 15.0
The helix protein has four adjustment handles: height, width of the strands, width of the cylinders, and spacing.
Figure 7.1: Adjustment handles on a helix protein. A) height adjustment; B) width of strands; C) width of cylinder; and
D) spacing between cylinders.
DNA Molecules
To create a DNA molecule:
1. Select the DNA tool from the BioDraw toolbar.
2. Drag in the work space, or click to draw the default size.
When orienting the DNA, note that if the Fixed Angles option on the Object menu is selected, you are constrained to
15 degree increments. You can override the default by pressing <alt> key as you drag.
DNA has four adjustment handles: height, width of the strands, offset of the second strand, and spacing.
Coloring Residues
After you draw a protein or DNA strand, you can color each residue using any of the coloring tools-shading, fading, or
filled.
1. Using the Marquee or Lasso tool, select a residue to color.
2. Select the desired color from the Color menu.
3. On the Curves menu, select either Filled, Shaded, or Faded.
tRNA
To create a tRNA molecule:
1. Select the tRNA tool from the BioDraw toolbar.
2. Click and drag in the workspace until the tRNA object is the desired size.
Once you draw the tRNA molecule, you can modify it accordingly.
Chapter 7: BioDraw (Professional Level only)
97 of 315
ChemDraw 15.0
Ribosomes
To draw a Ribosome:
1. On either the Ribosome or BioDraw toolbar, select a Ribosome tool.
2. Click and drag in the workspace until the Ribosome object is the desired size.
Once you draw the object, you can modify its appearance.
Plasmid Maps
To draw a plasmid map, you first enter the number of base pairs you want your map to represent, and then add markers. A simple pBI plasmid map is shown below.
Creating a Plasmid Map
1. From the BioDraw Toolbar, select the Plasmid Map tool.
2. Click in the drawing window where you want the plasmid map. The Insert Plasmid Map dialog appears.
Chapter 7: BioDraw (Professional Level only)
98 of 315
ChemDraw 15.0
3. In the Insert Plasmid Map dialog, enter the number of base pairs in the map, and click OK. The plasmid map is
drawn.
Adding Regions
Regions represent the fragments in the plasmid. You can add as many regions you want to your map.
To add regions:
1. Right-click the plasmid map and select Regions in the context menu.
2. In the Regions dialog, enter the base pairs numbers for the start and end of the fragment into their respective fields.
For example, if a fragment includes all base pairs from 1 to 1000, type 1 and 1000 in the text fields.
3. For the Start and End base pair numbers for the fragment to appear in the drawing, select Add Markers At
Region Ends.
4. Click Add.
5. To add additional regions, repeat steps 2-4.
6. Click OK.
Adding Markers
Markers let you annotate base pairs in the plasmid map. For example, to label a base pair or fragment, add a marker to
it.
To add a marker:
1. Right-click the plasmid map and select Markers in the context menu.
2. In the Markers dialog box, enter the number of the base pair for which you want to add a marker in the Position
box.
3. In the Label text box, enter the text to identify the marker.
4. Click Add.
5. Click OK.
Moving Markers
To move a marker label, click and drag the label. You can also edit the value in the label.
Resizing Regions
You can resize region arrows to indicate different base pairs, or extend them outward to emphasize them.
1. Hover over the end of the region’s arrow using a selection tool. The arrow’s resize handles appear and the cursor
changes to a double-arrow (
).
2. Click and drag a resize handle to adjust the size of the arrow.
Chapter 7: BioDraw (Professional Level only)
99 of 315
ChemDraw 15.0
To extend an arrow, click and drag its center handle as indicated by the cursor (
) in the figure above.
Enhancing the Drawing
A plasmid map is like any other drawing. You can add color and add shade to it, change line widths, or modify its text.
Chapter 7: BioDraw (Professional Level only)
100 of 315
ChemDraw 15.0
Drawing Biopolymers
Biopolymers are complex molecular assemblies that adopt precise and defined shapes and structures. Their defined
shape and structure are in fact keys to their role. Biopolymers are chain-like molecules made up of repeating chemical
blocks and can be very long in length. Biopolymers are classified in three groups, depending on the nature of the
repeating unit they are made of:
Polysaccharides are made of sugars
Proteins of amino acids
Nucleic acids of nucleotides
ChemDraw provides a friendly interface allowing users to draw biopolymers and create sequences easily. Using the
Biopolymer editor, users can draw polypeptides and nucleotide sequences using pre-defined labels assigned to nucleic and amino acids. You can expand, contract, or remove labels to complete the drawing.
To display the Biopolymer toolbar, navigate to View>Show Biopolymer Toolbar. The Biopolymers toolbar appears:
The Biopolymers toolbar includes the following options:
Biopolymer Editor: Enables all the nucleic and amino acids
Single Letter Amino Acid: Enables all the amino acids
Beta Amino Acids, L-Amino Acids, D-amino Acids: Enables addition of Beta, L-, and D- amino acids
DNA Sequence: Enables the deoxyribonucleotides that can be used to create a DNA molecule
RNA Sequence: Enables the ribonucleotides that can be used to create a RNA molecule
To draw a sequence:
1. Select one of these tools from the Biopolymer toolbar:
AA1 tool (Single-letter amino acid tool). Create a polypeptide chain using a one-letter label to represent each
amino acid.
You can create the sequences by typing the IUPAC code for the standard amino acids, or by pressing the icons on the
toolbar. By default, L amino-acids are created. Single-letter sequences are drawn with a fixed separation, so that
residues align with residues in adjacent rows. You can create D-amino acids using the D amino acid stereochemistry
option.
Single-letter D-amino acids are displayed in lower case. Three-letter D amino acids have the prefix "D-".
Chapter 8: Drawing Biopolymers
101 of 315
ChemDraw 15.0
Note: The <SHIFT> key acts as a toggle. Hence, to enter D-amino acids, press <SHIFT> while entering a singleletter sequence while in L mode. Alternatively, to enter L-amino acids while in D mode, press <SHIFT> while entering a single-letter sequence.
Note: You can enter three-letter amino acids using the "Biopolymer Editor" on page 102, and you can use either
the keyboard or toolbar to enter residues.
DNA tool. Create a DNA chain using labels that represent each of the nucleic acids.
RNA tool. Create an RNA chain using nucleic acid labels.
2. Click where you want to start the sequence. A text box appears.
3. In the text box, enter the single-letter label for the residue.
Note: For a list of residue labels, see "IUPAC Codes" on page 111.
4. Repeat step 2 for each residue.
5. When your chain is complete, press <ENTER>, or <Esc>.
By default, when creating a sequence, new residues are inserted after the current active residue. The insertion point is
indicated by an orange chevron. You can overwrite or replace a sequence atom using the residue replacement button.
You can also replace a sequence atom by hovering over a residue and pressing a hotkey, when no active residue is
present.
Biopolymer Editor
The Biopolymers toolbar contains a tool called Biopolymer Editor.
Using the biopolymer editor, you can create a sequence by explicitly specifying the residue name instead of the
IUPAC code. When you enter a letter, the auto-completion feature suggests a match with a known residue in the library. For example, when you enter 'a', the residue 'Ala' is suggested. To accept the suggestion, press <SPACE> or
<ENTER> key. Press TAB to move the caret to the end of the selected label.
To enter b amino acids, type a nickname such as bAla. The ‘b’ is converted to the b symbol. You can also create b
amino acids using the b- amino acid button in the biopolymer editor. b- amino acids always display using three-letter
codes. Glycine does not have a beta carbon, and so there is no beta version.
To enter D-amino acids, specify "d-" before the residue name. Glycine is also achiral and so does not have a D version.
Note: Use the D- amino acid and b- amino acid buttons simultaneously to produce D-b amino acids.
Chapter 8: Drawing Biopolymers
102 of 315
ChemDraw 15.0
You can also overwrite and replace the sequence atoms using the residue replacement button in the biopolymer
editor. For more information, see "Replacing Residues" on page 109.
Toggle Amino Acids
Toggle Amino Acid Style AA1<->AA3 option lets you change the amino acid representation from single letter to
triple letter and vice versa. For example,
1. Select the sequence.
2. Right-click and select Toggle from Amino Acid Style AA1<->AA3.
You can also change the amino acid representation of expanded, substituted, and protected amino acids. For
example,
The Toggle Amino Acid Stereo L<->D option lets you change the stereochemistry of the amino acid from L to D
and vice versa.
To toggle amino acids:
1. Select the sequence.
2. Right-click and select Toggle Amino Acid Stereo L<->D.
Protecting Groups
You can add protecting groups such as Trt and Fmoc to amino acids containing additional NH or OH groups (Arg,
2
Aad). Protected groups are specified within brackets ’()’.
To add a protecting group:
1. In a sequence, enter ‘(‘ after a completed residue name as shown below:
2. Enter the name of the protecting group and enter ‘)’ at the end of the name.
The name of the protecting group determines if it will protect the NH or OH group. If prefixed by O, then it protects the
2
OH group.
You can expand and contract protected residues just like any other residue.
Chapter 8: Drawing Biopolymers
103 of 315
ChemDraw 15.0
If no leaving group is found, after you enter ’)’, a dialog prompts you to specify the attachment point.
You can expand and contract protected residues just as any other residues.
Pasting Sequences
You can paste sequences in FASTA format. Since only single-letter IUPAC codes are present in the FASTA format,
you must indicate whether this corresponds to a peptide, DNA, or RNA biopolymer sequence. You can paste ALL
IUPAC symbols for residues, with the exception of those characters indicating spaces or omissions.
To paste a sequence:
1. Right-click and navigate to the Paste Special sub menu.
Chapter 8: Drawing Biopolymers
104 of 315
ChemDraw 15.0
2. Select one of three options to paste:
FASTA Peptide
FASTA RNA
FASTA DNA
When you hover your mouse over the residue, a description of the residue and sequence data appears.
Chapter 8: Drawing Biopolymers
105 of 315
ChemDraw 15.0
Paste Text Strings
You can also paste text strings with valid separators. Space, tab, and dash are considered as valid separators. The
text string you copy can be generated within or outside of ChemDraw. The text strings must contain valid residue
names/nicknames, optionally including termini. If no termini are explicitly defined, then default termini is assigned.
To paste a text string:
1. Copy the text string (for example, “H-Ala-Gly-Pro-NH2”) and right-click in an empty space.
2. From the context menu, select Paste Special>Biopolymer. The text string is pasted as a sequence.
Note: The labels in the text string must correspond to explicit nicknames.
Expanding Sequences
After creating a sequence, you can expand the whole sequence, or just specific labels.
To expand a sequence:
1. Select one or more labels in the sequence using lasso tool or marque tool. (Hold down the <SHIFT> key to select
more than one.)
2. Navigate to Structure>Expand Label.
When you expand a residue into its structure, the label appears below the structure.
Note: Brackets are now supported within biopolymer sequences. Biopolymers with repeated units will be chemically interpreted. Expansion and contraction of biopolymers will also consider brackets. On expansion, the brackets (and chemistry) are preserved and the structure is not explicitly expanded.
Contracting Labels
To collapse the structure back to its label (in the sequence):
1. Double-click the label to select the structure.
2. Navigate to Structure>Contract Label.
If you edit the label prior to contracting the structure, the new label text is incorporated into the contracted structure.
For example,if you modify a residue, and change its name from Ala to Ala', on contraction, the sequence contains the
string Ala'.
Clean Up Biopolymers
After you contract the labels, you can use the Clean Up Biopolymer command to clean the sequence. This command re-arranges the sequence so that the residues are aligned, and wrapped. To specify the number of 'residues per
line' and the number of 'residues per block' in a biopolymer, select the biopolymer and navigate to Object > Object
Settings > Biopolymer Display tab.
Chapter 8: Drawing Biopolymers
106 of 315
ChemDraw 15.0
Modifying Sequence Residues
Note: When you modify a residue structure in your drawing, you must define a new nickname to ensure that the
contracted label includes your changes.
To modify a sequence residue.
1. If the residue in the sequence is contracted, right-click the residue and select Expand Label.
2. Modify the residue.
3. Using the Text tool, rename the residue label to reflect a new structure. In the example below, the "Ser" label has
been renamed as "hSer" (for homoserine).
Figure 8.1: Two expanded serine residues. The residue on the left has been modified to create homoserine.
To contract a label:
1. Using a selection tool, right-click the residue label and select Select Linked Objects, or double-click on the label
for the expanded residue, and the associated structure is selected.
2. Navigate to Structure>Contract Label.
Figure 8.2: The contracted label.
You must define a new nickname to ensure that the contracted label includes your changes. For example, you can
define a new nickname 'hSer', which includes the hydroxyl group in the residue definition itself.
Merging Sidechains with Residue
The Merge Sidechains With Residue feature lets you edit an expanded residue and then integrate those changes
into the residue definition.
To merge a side chain:
1. Double-click the residue label to select the residue.
Chapter 8: Drawing Biopolymers
107 of 315
ChemDraw 15.0
2. Right-click and select Biopolymer>Merge Sidechains With Residue from the context menu. The entire sidechain is merged with the residue.
The residue is selected and you can edit the residue label.
Removing Residues
When you remove a residue, the bonds are automatically re-created between the adjacent labels , and any gaps
closed.
To remove a residue:
1. If the label is expanded, contract the structure back to its label.
2. Select the label, or hover over it.
Chapter 8: Drawing Biopolymers
108 of 315
ChemDraw 15.0
3. Press the <DELETE> key.
Replacing Residues
The Biopolymer toolbar has two distinct modes of data entry: Insertion mode and Replacement mode. Insertion mode
is the default mode. In the Insertion mode, an orange chevron indicates the position in which the next residue will be
inserted. For example, the orange chevron in the sequence below indicates that the next residue will be inserted after
the 4th Gly residue.
You can replace a residue in a sequence using the Replace current residue button in the biopolymer toolbar. In the
replacement mode, an orange rectangle indicates which residue is replaced. For example, the orange rectangle in the
sequence shown below indicates that the 3rd 'G' residue will be replaced.
The method of replacing residues is demonstrated for tetraglycine sequence below:
1. Draw a tetraglycine sequence.
2. Select Bioploymer Editor in the Biopolymer toolbar.
3. In the tetraglycine sequence, click on the 4th "Gly" residue. An orange chevron indicates the position where the
next residue will be inserted:
4. Select "Replace current residue" mode in the biopolymer toolbar. The "Gly" text is selected.
5. Type "Ala" or click the "Ala" button to replace "Gly".
To change the form of a residue:
1. On the tetrapeptide sequence above, click on the 2nd Gly residue.
2. Click and select both the "L-amino acid" and the "Beta-amino acid".
3. Click "Cys" button to replace "Gly" with beta--Cys, as shown:
Adding Residues
You can add one or more residues to an existing sequence.
To add a residue:
Chapter 8: Drawing Biopolymers
109 of 315
ChemDraw 15.0
1. Choose the appropriate biopolymer tool.
2. Click a residue you want the new residue to be adjacent to. An orange chevron indicates the insertion point.
3. Type the new residue . The new label is added to the right of the existing residue .
Note: To prepend, or insert at the beginning of a sequence, select the terminus atom, select the amino group (protein sequence) or 3’ group (DNA/RNA sequence).
Numbering Residues
You can display the residue ID above any residue.
To display the residue ID:
1. Select the residue.
2. Right-click and select Show Residue ID from the context menu. The residue ID appears above the residue.
Nonlinear Sequences (Multi-line Sequences)
Every sequence has a defined line size and a block size. When a block size is reached, an additional space is added
to the sequence. When a line size is reached, subsequent residues are added on a new line.However, you can create
sequence with irregular lines by selecting and dragging. You can place a residue on a new line by selecting the residue
in a Sequence tool mode, and pressing <ALT>+<ENTER>. Subsequent residues are placed on a new line.
To add a new line as you are entering the sequence, press <ALT>+<ENTER> on your keyboard. Subsequent
residues are entered on a new line, and the line size is set for that particular sequence.
To create a multi-line sequence:
1. Draw the sequence.
2. Use the sequencing tool to select the residue you want at the end of the first line (such as ‘His’ in the example
above).
3. Press <ALT>+<ENTER> on your keyboard.
Hybrid Biopolymers
You can create mixed or hybrid biopolymers using the Biopolymer toolbar by combining the various Biopolymer tools.
Hence, you can insert nucleic acid into amino acid sequences and vice-versa, and RNA and DNA can be used
together.
Chapter 8: Drawing Biopolymers
110 of 315
ChemDraw 15.0
Branched Biopolymers
Residue labels typically have two attachment points. However, you can add attachment points so that the sequence
branches. For example:
When you add an attachment point, you specify the atom in the expanded label to which the bond will attach.
To bond from a sequence:
1. Draw a bond starting at the label from which to create a branch. The Modify Nickname dialog appears, displaying
the sequence structure you selected.
2. In the Modify Nickname dialog, double-click the atom in the structure on which you want to add the attachment
point. A new attachment point appears.
3. Click OK.
IUPAC Codes
Use these codes to enter nucleotides or amino acids in your sequence:
IUPAC Nucleotide Code
Base
IUPAC Amino Three
Acid Code
Letter Code
Amino Acid
A
Adenine
A
Alanine
Chapter 8: Drawing Biopolymers
Ala
111 of 315
ChemDraw 15.0
C
Cytosine
C
Cys
Cysteine
G
Guanine
D
Asp
Aspartic Acid
T (or U)
Thymine (or Uracil)
E
Glu
Glutamic Acid
R
A or G [Either
F
Phe
Phenylalanine
G
Gly
Glycine
H
His
Histidine
I
Ile
Isoleucine
K
Lys
Lysine
L
Leu
Leucine
M
Met
Methionine
puRine]
Y
C or T [Either
pYrimidine]
S
G or C [Three hydrogen bond (Strong)]
W
A or T [Two hydrogen bonds (Weak)]
K
G or T [Keto group in
base]
M
A or C [AMine group
in base]
B
C or G or T [Not A (B
is letter after A)]
D
A or G or T [Not C]
N
Asn
Asparagine
H
A or C or T [Not G]
P
Pro
Proline
V
A or C or G [Not U in
Q
Gln
Glutamine
R
Arg
Arginine
S
Ser
Serine
T
Thr
Threonine
V
Val
Valine
RNA context; not T
in DNA context]
N
any base [A/U/G/C
in RNA context;
A/T/G/C in DNA context]
Chapter 8: Drawing Biopolymers
112 of 315
ChemDraw 15.0
W
Trp
Tryptophan
Y
Tyr
Tyrosine
The tables below list the three letter codes for non-specific and non-proteinogenic amino acids.
IUPAC Amino
Acid Code
Three
Letter
Code
Non-specific Amino Acid
B
Asx
asparagine or aspartic acid
Z
Glx
glutamic acid or glutamine
J
Xle
leucine or isoleucine
X
Xaa
Any amino acid (no nickname)
IUPAC Amino
Acid Code
Three
Letter
Code
Non-proteinogenic Amino
Acid
O
Pyl
Pyrrolysine
U
Sec
Selenocysteine
Aib
α-Aminoisobutyric acid
Abz
2-Aminobenzoic acid
Nle
Norleucine
Cyclic, Crosslinked, and Branched Peptides
You can create cyclic peptides by bonding together the terminal residues in a peptide sequence. A looped bond indicates the peptide is cyclic. An example of cyclic peptide is shown below:
Chapter 8: Drawing Biopolymers
113 of 315
ChemDraw 15.0
You can create a crosslinked peptide such as insulin, using the biopolymer tool and bond tool.
Branched Peptides
A branched peptide is formed where a residue has multiple possible leaving groups. For example, Arg has two amino
groups and Asp has two carboxyl groups. A polymerization reaction could potentially take place at either of these
groups, or at both. Hence protecting groups are often employed during the polymerization reactions to selectively
allow polymerization at only a single site.
Consider the following example in which the peptide is branched at the Asp residue:
In the following example, the residue is branched at the Arg residue:
You can create a branched peptide using the solid bond tool to connect the branching residue in the first chain to the
branching residue in the second chain. If the residues have leaving groups that can be automatically found, then it
branches at those points. Otherwise, the Modify nickname dialog appears and you need to manually define the third
attachment point. Consider the following example for creating branched peptide:
1. Draw two biopolymer chains as shown below:
Chapter 8: Drawing Biopolymers
114 of 315
ChemDraw 15.0
2. Using the solid-bond tool, drag from the lower chain's Gly-3 to the upper chain's Arg-3. The terminal hydrogen on
the lower chain is removed and the branched peptide appears as:
If the residues does not have leaving groups that can be automatically found, the Modify nickname dialog appears and
you need to manually define the third attachment point. Consider the following example,
1. Draw two biopolymer chains as shown below:
2. Using the solid-bond tool, drag from the lower chain's Met-4 to the upper chain's Met-5. Since neither of these
residues have defined leaving groups, the Modify Nickname dialog appears twice, once for each residue.
3. Define new attachment points. The resulting structure is:
Disulfide Bridges
You can build disulfide bridges either between Cys residues within the same structure, or between residues in two different structures. For example, consider the endocrine hormone Insulin.
Chapter 8: Drawing Biopolymers
115 of 315
ChemDraw 15.0
Insulin consists of two chains, an A chain and a B chain, connected by disulfide bridges.
A Chain
GIVEQCCTSICSLYQLENYCN
B Chain
FVNQHLCGSHLVEALYLVCGERGFFYTPKT
You can build these chains either by copying and pasting the above text using the Paste Special>FASTA Peptide
command or by using the Biopolymer toolbar to build each chain.
To build intra-sequence disulfide bridge:
1. Select the single bond tool.
2. Draw a bond between the C(6) and C(11) residues in the A chain, as shown below:
To build inter-sequence disulfide bridges:
1. Select the bond tool and draw a bond between the C(7) in A chain and C(7) in B-chain.
2. Draw another bond between the C(20) in A chain and C(19) in B chain, as shown below:
Lactam Bridges
You can draw lactam bridges between Lys-Asp and Lys-Glu residues. The residues connect via amide bonds
between side chains. You can also mix disulfide and lactam bridges.
To draw a lactam bridge:
1. Draw a sequence that contains Lys and either Asp or Glu.
2. Using solid bond tool, draw a bond from Lys to the other residue. An example is shown below:
Chapter 8: Drawing Biopolymers
116 of 315
ChemDraw 15.0
Chapter 8: Drawing Biopolymers
117 of 315
ChemDraw 15.0
Advanced Drawing Techniques
The advanced features help you save time or perform functions that cannot be accomplished using the basic tools.
For example, you can view your drawing as 3D models or create stereoisomers at the click of the mouse. Using other
features, you can:
Add bonds to characters in atom labels
Create bonds whose attachment is not explicitly defined
Add atom numbers
Contract and expand sections of structures
View structure perspective
Create mass fragmentation, retrosynthesis, and synthesis drawings
Draw with templates
Create and edit templates
Label functional groups with nicknames.
Coloring Objects
You can select and color objects, part or all of a chemical structure, boxes, curves, arrows, orbitals, and reaction
mechanism symbols.
To color an object:
1. Select the object.
2. Do one of the following:
Click the Color button on the Style toolbar, and select the color from the menu that appears.
Choose a color from the Color menu.
Right-click and select the color from the context menu.
Navigate to Object>Object Settings and select the color in the Drawing tab. Click OK when finished.
Coloring Groups
ChemDraw colors groups differently from integral groups. When you color an integral group, its objects acquire the
new color but retain the original shading. When you color a normal group, the new color is applied and the original shading is ignored.
Chapter 9: Advanced Drawing Techniques
118 of 315
ChemDraw 15.0
Figure 9.1: A) The mitochondrion structure in its default color; B) The structure colored blue as a group; C) The structure colored blue as an integral group.
The new color applies to all structures in the group, even if the original colors of the objects in the group are not the
same. See example below:
Figure 9.2: A)The structure colored pink as an integral group; B)The structure colored pink as a group.
Labels
In addition to representing atoms, labels can represent regions of a structure that you define. For example, you can
assign a label to an unimportant region of a molecule and then contract that region to reduce the size of your drawing.
You can then expand the label, to see the whole molecule.
Creating Labels
To create a contracted label:
1. Select the area of the structure to contract.
2. Navigate to Structure>Contract Label. The Contract Label dialog appears.
3. Type a label for the contracted structure.
Chapter 9: Advanced Drawing Techniques
119 of 315
ChemDraw 15.0
4. Click OK.
The label replaces the selected portion of the structure.
Note: If the area of the structure you contract contains errors, an error dialog appears. Click Ignore to view other
errors. Click Ignore All to ignore all errors or Stop to end the contract process.
Expanding Labels
If your structures contain defined nicknames, long atom labels, or contracted labels, ChemDraw can restore your
structures to the fully-expanded form.
To expand atom labels:
1. Select a selection tool.
2. Select the label to expand, or double-click the structure to select all labels in the structure.
3. Navigate to Structure>Expand Label. You can also use the Expand Label tool in the Structure toolbar. Your
structure is redrawn in its expanded form. Below is an example of expanding labels:
Contracted:
Expanded:
When you expand a label that contains a divalent nickname, for example H-Ala-OH, the attachment order depends on
the order in which the bonds are created.
Multiple Atoms
Labels can comprise a group of atoms. When you expand the label, it expands to create the structure.
Contracted:
Chapter 9: Advanced Drawing Techniques
120 of 315
ChemDraw 15.0
Expanded:
Adding a Label of Multiple Atoms
1. Using the text tool, click an atom in the structure where you need to place the label.
2. Type the formula (such as “CH2NHCH3”).
3. Using a selection tool, select the formula.
4. Right-click the formula and select Expand Label, or navigate to Structure>Expand Label. You can also use the
Expand Label tool in the Structure toolbar.
Figure 9.3: Adding bonds to a label
You can determine the orientation of the resulting bond by dragging. If you click to add a bond, there are several preferential orientations for the resulting bond as outlined below.
Adding from the end of an atom label creates bonds that are preferentially horizontal.
Adding from the middle of an atom label creates bonds that are preferentially vertical.
Chapter 9: Advanced Drawing Techniques
121 of 315
ChemDraw 15.0
Adding from the start of an atom label creates bonds that try to attain the chain angle setting in the Drawing Settings dialog. If that angle cannot be attained, the next best angle is used.
Attachment Points
You can draw polyhapto structures such as ferrocene ((Cp)2Fe), or abbreviated notations for different positional isomers of a compound, using attachment points. The procedure is similar, and in both cases, the structure retains chemical significance. You can generate all possible structures from an abbreviated combinatorial structure by using
Expand Generic Structure feature. For more information, see "Expand Generic Structures" on page 255.
Figure 9.4: Drawing a polyhapto structure
Multi-Center Attachments
To add a multi-center attachment point to a structure:
1. Select all or part of the structure.
2. Navigate to Structure>Add Multi-Center Attachment. An asterisk indicates a multi-center node.
To draw a bond to a multi-center attachment point:
1. Click the bond tool.
2. Point to the asterisk and either click or drag to create a bond.
The asterisk is not visible once a bond is drawn to it. However, you can view the attachment point using a bond or
selection tool.
Tip: If fixed lengths is enabled, press <ALT> as you drag the bond.
Variable Attachment Points
You can use the Add Variable Attachment command to draw different positional isomers of a compound using an
abbreviated notation that retains chemical significance.
Chapter 9: Advanced Drawing Techniques
122 of 315
ChemDraw 15.0
For example, you can explicitly draw the three isomers of dibromobenzene, as shown below. Alternately, you can
express all three isomers as a single parent structure by using a variable attachment as shown below.
Abbreviated
notation for:
Figure 9.5: Isomers of dibromobenzene
To add a variable attachment point to a structure:
1. Select all or part of the structure.
2. Navigate to Structure>Add Variable Attachment.
3. Point to the asterisk in the structure and drag to draw a bond.
Note: Either disable or toggle Fixed Lengths to draw the bond so that it extends from the ring.
Note: To draw the structure below you should only select the 5 rings atom that do not already have a bromine
atom bound to them. Selecting the entire molecule would cause a valence problem with the topmost carbon.
Tip: If fixed lengths is enabled, press <ALT> as you drag the bond.
Chapter 9: Advanced Drawing Techniques
123 of 315
ChemDraw 15.0
Note: After you draw a bond from an attachment point, the asterisk disappears. To view an attachment point, position the cursor over it with either a bond tool or a selection tool.
Atom Numbering
You can add sequential numbers or letters to the atoms in your structure. You can add:
Numbers (1, 2, 3, and so on)
Text ending with a number (atom1)
Greek letters for alpha, beta, and so on
Letters (a, b, c, and so on)
The default indicator is numbers.
Tip: To use text instead of numbers, number an atom, and then edit the number. See "Formatting Atom Numbers"
below.
Showing Atom Numbers
1. Select one or more atoms to number.
2. While pointing to the selected atoms or structure, do one of the following:
Right-click and select Atom>Show Atom number in the context menu.
Type the hotkey ‘ (single quote).
To hide atom numbers:
1. Select the atoms or structure.
2. Right-click, point to Atom, and deselect Show Atom Number.
Note: To remove an atom number indicator, click the indicator with the Eraser tool.
Formatting Atom Numbers
To edit the atom number text and style:
1. Select the Text tool.
2. Select the atom number and type the new text.
Chapter 9: Advanced Drawing Techniques
124 of 315
ChemDraw 15.0
Note: When you type a new indicator, the counter resets to the new style and you can continue numbering in that
style with the standard means. For example, if you type α in a text box, then point to another atom, and use the
context menu or hotkey, the atom is labeled β. Switching to another structure resets the counter.
3. To edit the atom number style, select the atom number with the Text tool and use the Text menu, or Text formatting toolbar, to change the style.
Positioning Atom Numbers
You can position each atom number anywhere around its corresponding atom and its distance from the atom.
To reposition an atom number:
1. Right-click the indicator to move and click the Position command on the context menu. The Position Indicators
dialog appears.
2. Click the appropriate position option, and enter a value.
To position
Type a Value for
Position
From the atom or bond center to the indicator cen- By angle or by
ter
clock
From the atom or bond center to bottom left of
By offset—hori-
indicator baseline
zontal and vertical
At specified coordinates
Absolute—horizontal and vertical
Structure Perspective
You can tilt molecules or portions of molecules through three dimensions with the Structure Perspective tool.
To tilt a structure:
Chapter 9: Advanced Drawing Techniques
125 of 315
ChemDraw 15.0
1. Select the structure with either a selection tool or the Structure Perspective tool.
2. With the Structure Perspective tool, click and drag the selected structure. Place the cursor inside the marked rectangle and drag in any direction.
Tip: Use <SHIFT>+drag to limit the rotation to the X or Y axes only.
You can also select part of a complex molecule and rotate it around a particular bond.
Note: You cannot apply structure perspective to orbitals.
To remove the Structure Perspective Tool effect:
1. Select the structure with the Marquee or Lasso Tool.
2. Navigate to Object>Flatten.
Note: Flattening the structure removes its z-coordinate information but does not change its appearance.
Mass Fragmentation
Mass fragmentation mimics the molecular fragmentation in a mass spectrometer. When you apply the mass fragmentation tool to a structure, you cut through the structure, severing its bonds, and creating fragments from the original structure.This is not a predictive tool, you must specify what bonds are to be broken.
To fragment a structure, use the Mass Fragmentation Tool to drag the cursor across one or more bonds. When you
release the mouse button, bonds that you cross are broken.
By default, the line you draw disappears when you release the mouse button.
Note: To draw a curved line, or to keep the line visible, hold down the <ALT> key while drawing.
When the line crosses a bond, the formula and exact mass for the fragments on either side of the bond appear as if the
bond were homolytically broken. That is, a single bond turns into a monoradical on each fragment; a double bond turns
into a pair of diradicals. If more than one bond is crossed, all fragments on each side of the line are considered
together. If the only bond crossed is a ring bond, a single formula/mass pair displays.
Chapter 9: Advanced Drawing Techniques
126 of 315
ChemDraw 15.0
You can reposition the formula and mass displays, or delete them.
Synthesis and Retrosynthesis
ChemDraw includes two tools to help you draw synthesis reactions. The Synthesis tool draws a synthesis reaction
based on a product structure that you specify. Alternatively, the Retrosynthesis tool draws the reaction with the
product on the left and an arrow pointing to the reactants. These tools are in the fragmentation tools palette of the main
tools palette.
To demonstrate these features, we use the Beyer Method for quinolines, starting with the structure below.
You can create either type of reaction using the appropriate tool and dragging through bonds indicated by the dotted
line. For example, use the Retrosynthesis tool to create this reaction:
Figure 9.6: Quinoline Retrosynthesis
Quinline synthesis
Drawing Reactions
To demonstrate how to draw reactions, we will use this example:
Chapter 9: Advanced Drawing Techniques
127 of 315
ChemDraw 15.0
Drawing an Arrow
Starting with 2-propanone (see "Tutorial 1: Drawing a Structure" on page 298), draw the reaction arrow:
1. On the Arrows toolbar, click the third arrow from the left in the top row, as shown below:
2. In the document window, click and drag the mouse horizontally to the right of the 2-propanone structure. The arrow
appears.
3. Select the Text tool.
4. Click above the arrow. A text box appears.
5. Type OH and press <ESC>. Re-align the text box as necessary using a selection tool.
Note: If Show Chemical Warnings is turned on (the default), a red box will appear around the OH label when you
change tools or open another text box indicating an error. Ignore this for now.
Add a charge symbol using the Chemical Symbols tool palette:
1. In the Main Tool toolbar, click the Chemical Symbol tool.
2. Holding the mouse button down, select the circled Circle Minus symbol.
3. Point to the center of the OH label. Move the cursor slightly right or left to select the O.
4. With the oxygen atom selected, drag the charge symbol around the atom to the desired position.
Objects that you add from the Chemical Symbols palette are associated chemically with the structure they are near.
Note that the red valence error warning disappears when you add the minus charge.
Drawing the Product
We now create 4-hydroxy-4-methyl-2-pentanone using a copy of the 2-propanone structure. You can create the
product from scratch, or you can copy an existing structure.
Chapter 9: Advanced Drawing Techniques
128 of 315
ChemDraw 15.0
To copy a structure:
1. Select the 2-propanone structure and its caption.
2. Press and hold the <CTRL> key.
The hand pointer with a plus sign indicates that you are in the duplication mode of a selection tool.
3. Drag the selection rectangle to the right and release the mouse button.
Note: To keep the copy aligned with the original, press the <SHIFT> key while dragging.
Modify the duplicate structure:
1. Select the Solid Bond tool.
2. Click the far right bond of the copied structure (Figure below).
3. Point to a terminal carbon.
4. Click the carbon atom until three bonds appear, allowing a pause between each click.
Note: If you click too fast, the click is interpreted either as a double-click, which opens a text box or a triple-click,
which duplicates your last atom label.
5. Point to a terminal carbon atom.
6. Type OH.
Chapter 9: Advanced Drawing Techniques
129 of 315
ChemDraw 15.0
Replace the product caption:
1. Select the caption with the Text tool and type 4-hydroxy-4-methyl-2-pentanone, press the <ENTER> key and type
1 mole.
2. Using the Text tool, add 2 Mole to the caption for the reactant.
Clean Up Reactions
After you draw a reaction, you can clean the reaction using the Clean Up Reaction command under the Structure
menu. When you apply the Clean Up Reaction command, the spacing between the reaction components is modified, the components are evenly distributed, plus signs are inserted wherever necessary, and the length of the arrow
is adjusted.
To clean up a reaction:
1. Select the reaction.
2. Navigate to Structure>Clean Up Reaction.
If the reaction is too wide for the document, the reaction is wrapped to fill multiple lines, as shown in the example
below:
Figure 9.7: The reaction before applying the Clean Up Reaction command
Chapter 9: Advanced Drawing Techniques
130 of 315
ChemDraw 15.0
Figure 9.8: The reaction after applying the Clean Up Reaction command
Note: The Clean Up Reaction is available only for single-step reactions.
Note: The Clean Up Reaction command is available only for reactions with straight arrows. In case of arrows
with curvatures the Clean Up Reaction command is disabled.
The Reaction Interpreter
The Reaction Interpreter parses reactions as drawn, and breaks the reaction into the following distinct components:
Reaction Scheme
Reaction Step
Reactants
Products
Conditions
You can save the interpretation to disk by saving the file as CDXML. This stored data is often important if reactions
are to be stored in databases.
The reaction interpreter color-codes the reactants, products, catalysts, and annotations in a reaction when you hover
over them with Show Reaction Interpretation selected. This helps in determining whether the reaction is being correctly perceived, and lets you adjust the reaction to correct the interpretation.
Chapter 9: Advanced Drawing Techniques
131 of 315
ChemDraw 15.0
To interpret the reaction:
1. Navigate to View>Show Reaction Interpretation.
2. Hover your cursor over the reaction arrow.
For a reaction to be interpreted:
Each reactant and product must contain at least one atom.
Each reactant and product must be described using a single label.
Multiple reactants and products should be linked by a “+” sign.
Reaction conditions must reside completely within the left and right boundaries of the reaction arrow.
The reaction cannot include a curved arrow.
The reaction is colored as follows:
Reactions are red.
Products are magenta.
Everything above the reaction arrow is cyan.
Everything below the reaction arrow is blue.
Electron and Radical Pushing
A common practice when illustrating organic reaction mechanisms is to use electron pushing arrows to display the
transfer of electrons. ChemDraw provides the Electron Pushing and Radical Pushing tools for illustrating electron
transfer. Electron transfers can be drawn between atoms, bonds, and orbitals.
To display the transfer of an electron pair:
1. Select the Electron Pushing Tool
from the Chemical Symbols toolbar.
2. Click and drag the mouse from the source object to the target object and release the mouse. A full-head arrow
appears signifying the electron pair transfer, such as:
Figure 9.9: Example of electron pushing
To display the transfer of one electron:
Chapter 9: Advanced Drawing Techniques
132 of 315
ChemDraw 15.0
1. Select the Radical Pushing Tool from the Chemical Symbols toolbar.
2. Click and drag the mouse from the source object to the target object and release the mouse. A half-head arrow signifying only one electron transfer appears, such as:
Figure 9.10: Example of radical pushing
You can delete the electron transfer arrow by either selecting or hovering over the arrow and pressing the <DELETE>
key. You can modify the electron transfer arrow shape by using either the Arrow tool, or the Electron Pushing Tool.
When you hover over the electron or radical pushing arrows, the associated objects are highlighted in addition to the
arrows.
Stoichiometry Grid
Use the Stoichiometry Grid to calculate stoichiometric data for a reaction. The grid fills in as you modify a reaction
drawing, and all calculations are done automatically.
To create a stoichiometry grid:
1. Draw a reaction, or open a file containing a reaction.
2. Navigate to View>Show Reaction Interpretation. Turning on Show Reaction Interpretation ensures the reaction is properly interpreted by ChemDraw. When you hover over the reaction, for example:
Reactants in red
Products in magenta
Anything above and below the reaction arrow in cyan and blue
3. Select the reaction and navigate to Structure>Analyze Stoichiometry. The grid, with several data fields filled
with default values, appears under the reaction.
Chapter 9: Advanced Drawing Techniques
133 of 315
ChemDraw 15.0
Note: If a catalyst or condition label is above the reaction arrow, right-click the label and deselect Interpret Chemically in the context menu before creating the grid.
To enter data in the grid:
1. Set the limiting compound. If the default setting is incorrect, right-click the word No in the limiting row, and select
Set Limiting from the context menu.
2. Select the Text tool, and click where to enter the data. Enter values for all reactants, as applicable. If you are using
units other than the defaults, type in the units along with the values (no space required).
Value
Comments
Limiting?
Indicates the limiting reactant. Only one reactant may be specified as limiting.
Sample Mass
Mass of reactant. Default units: g.
%Weight
Reactant purity. Defaults to 100%.
Volume
Default units: ml. Requires either a molarity or a density to be entered.
Chapter 9: Advanced Drawing Techniques
134 of 315
ChemDraw 15.0
Value
Comments
Molarity
Default units: M
Density
Default units: g/ml
After you enter the minimum amount of information the values are calculated.
The values are automatically recalculated when you enter a new value, edit input, or modify the reaction. To edit input,
click the input and enter the new value. For example, consider the following table:
If you edit the value in the Reactant Moles field for the reactant in the table to 30.00 mol, the rest of the table is
updated.
Note: Entered values are in bold-face; calculated values are in normal font.
You can show or hide rows or columns in the grid. To hide a row, right-click the row and select Hide Row from the
context menu.
Chapter 9: Advanced Drawing Techniques
135 of 315
ChemDraw 15.0
To hide a column, right -click the column and select Hide Column from the context menu.
To display hidden rows or columns, select Show All from the context menu. To change the color of the text, select
Color from the context menu.
Templates
ChemDraw includes a library of templates. You can use a template as a starting point for a new drawing or to add to
an existing drawing. A palette is a set of templates.
The templates you define are not limited to atoms and bonds. Templates can also contain captions, colors, boxes,
arcs, orbitals, arrows, reaction mechanism symbols, and curves. You can paste pictures from other applications into
a template pane. You can download templates from the PerkinElmer Informatics web site and use them. For more
information on available templates and user download-able templates, see ChemDraw template files, and BioDraw
templates.
To open a template, do one of the following:
Select a template toolbar from the Main toolbar.
Navigate to View>Templates and select a template toolbar from the list.
To add to a drawing using a template:
1. Select the required template from the template toolbar.
2. In the document window, click and drag the mouse until the template is oriented the way you need.
Tip: To modify the template size, press the <ALT> key while drawing it.
You can also use the templates to add structural features to existing drawings.
To add structural features to existing drawings:
1. Select the required template from the template toolbar.
2. Click an atom or bond in the existing drawing to add the template structure.
Chapter 9: Advanced Drawing Techniques
136 of 315
ChemDraw 15.0
Customizing Templates
You can modify a template palette to create your own palette. When you create a palette, a set of empty template
panes appear above the document window. After you save your palette, it contains the templates you have drawn.
You can then select your palette from the palette list in the Templates tool. You can also store templates as groups, or
even integral groups, so that they are treated as an individual entity within the documents into which they are dropped.
To create a template palette:
1. Navigate to File>Open Templates>New Templates.
2. Click a template pane.
3. In the document window, draw a new structure.
4. Click another template pane and draw another structure as desired.
5. After you draw all the templates you want, go to File>Save.
Note: Save your palette in the ChemDraw Items folder to ensure it appears in the Main toolbar.
6. In any drawing, select the Template tool on the Main toolbar to use you palette.
Modifying a Template
1. Navigate to File>Open Templates and choose a palette.
2. In the palette, click a template pane. The template appears in the document window.
3. In the document window, edit the template.
4. Save the template.
To add or delete a palette row or column in a palette:
1. In the palette, click a cell in the row or column.
2. Select the appropriate option in the Edit menu.
Adding a Template
To add a template, click in an empty template pane and draw the template in the document window. Navigate to
File>Save.
Annotating a Template
1. Navigate to File>Open Templates and choose a palette.
2. Right-click on an empty space in a template pane, and select Annotate. The Annotate dialog appears.
Chapter 9: Advanced Drawing Techniques
137 of 315
ChemDraw 15.0
3. Specify a new name for the template in the Content text box.
4. Click OK.
5. Click Save. The annotation appears as a tooltip, when you point to the annotated template.
Deleting a Template
1. Select the template pane for the template to delete.
2. In the document window, select the entire drawing.
3. Navigate to Edit>Clear.
4. Navigate to File>Save.
Orienting Templates
To make templates you create simple to use, orient the template structure so that you can modify the bonds you use
most often.
Resizing Template Panes
To resize the Template panes in the Template panel, drag the lower right corner of the Template panel. If necessary,
first click and drag the resize handle.
Defining Nicknames
A nickname is an alphanumeric abbreviation that represents a substructure1. Nicknames are useful for drawing large
structures, or structures that repeatedly use similar features. Contracted labels are similar to nicknames, but they are
for one-time use only, in the current document.
ChemDraw includes a library of nicknames of common functional groups and monomers. For example, if you typically
draw protein structures, you may consider using amino acid nicknames in your drawings rather than drawing each
amino acid.
The substructure that a nickname represents connects to the rest of the structure using one or more attachment
points. Attachment points must be single bonds. For substructures with two or more attachment points, the attachment point numbering sequence determines the order in which other parts of the structure are attached. For example,
1A substructure can be any part of a drawn structure.
Chapter 9: Advanced Drawing Techniques
138 of 315
ChemDraw 15.0
if you expand the structure H-Leu-OH, the hydrogen is bonded to the first attachment point in leucine and the hydroxyl
group to the second.
For more information, see "Using Nicknames" on page 62.
To define a new nickname:
(In the example below, a b-alanine structure is used.)
1. Draw the b-alanine structure.
2. Draw a bond to the NH2 group.
3. Delete the label on the OH group.
4. Using the Attachment Point tool, add an attachment to the N-terminus.
5. Add an attachment to the C-terminus.
6. Select the structure, and navigate to Structure>Define Nickname.
7. Type a short name for the nickname.
Tip: To avoid possible conflicts with elements, specify names with more than two characters.
8. Click OK.
Note: The attachment point order is determined by the order in which you add the attachment points to the structure.
You can also define nicknames from a structure containing a single radical. Attachment points are added at the site of
the radical.
Chapter 9: Advanced Drawing Techniques
139 of 315
ChemDraw 15.0
Nicknames can also be defined by carving a substructure out of a structure.
Nicknames and Atom Labels
If you use a nickname that is the same as an element name, a message indicates that the element is replaced with
the nickname. For example, using Ac for an acetyl group replaces the element Actinium. The Check Structure command recognizes the label as an acetyl group rather than Actinium.
The nicknames list provides these Nickname/Element conflicts:
Symbol
Nickname
Element
Ac
Acetyl
Actinium
Am
Amyl
Americium
Np
para-Nitrophenyl
Neptunium
Pr
Propyl
Praeseodymium
Note: If you use the Periodic Table dialog to insert atoms into structures, the elements will preferentially be deposited. Selecting Ac from the Periodic Table and clicking on an atom will place Actinium rather than Acetyl.
To remove the overriding nicknames, navigate to File>List Nicknames and delete the overriding nickname definition.
Deleting Nicknames
To delete a nickname from the nickname library:
1. Navigate to File>List Nicknames.
2. Select the nickname and click Delete.
Troubleshooting Nicknames
If the Define Nicknames command is disabled, check for the following:
A connection point that is not present
More than two connection points that are defined
A connection point that is not a single bond
In Figure a below, the entire functional group was selected. Because there is no atom that indicates a connection
point, you cannot define a nickname. When a sulfonamide group is attached to an unselected bond, you can define a
nickname.
In Figure b, there is more than one attachment point on a single atom in a nickname.
Chapter 9: Advanced Drawing Techniques
140 of 315
ChemDraw 15.0
Incorrect
Correct
a
b
ChemScript
ChemScript is the cheminformatics Software Development Kit (SDK). It contains the programming algorithms common throughout PerkinElmer Informatics products. With enough knowledge writing software code, you can apply
ChemScript to create your own scripts to use with ChemOffice applications.
ChemDraw Professional also includes a library of sample scripts for you to use. Navigate to File>ChemScripts and
select an option.
To run a script on the current drawing:
1. Navigate to File>Run ChemScript.
2. In the Open dialog , select the script and click Open.
3. (Optional) To run the script again, navigate to File>Re-run Previously Selected ChemScript.
ChemScript Integration
Note: ChemScript is an advanced feature intended for users with some programming experience.
ChemScript lets you add custom functions to ChemDraw. Custom scripts can be launched from the application, and
the results of the script are returned to a new ChemDraw document. Scripts must be written using either PYTHON or
.NET. You use custom scripts to:
Chapter 9: Advanced Drawing Techniques
141 of 315
ChemDraw 15.0
Apply custom drawing rules using ChemScript
Launch external applications from ChemDraw
Automate workflow from ChemDraw
The input data for the script consists of CDXML data from the currently active document in ChemDraw. If you select a
portion of the document, only the selected part of the document is used as input to the script.
You can apply scripts to chemical structures and reactions.
You can place scripts in the Scripts directory for easy usage. The Scripts directory is in the same directory as the
ChemDraw items directory.
To launch a script, do one of the following:
Navigate to File>ChemScripts, and select a script from the Scripts directory.
Navigate to File>Run ChemScript, and select a script from a directory other than the Scripts directory.
You can also use the sample scripts available in ChemDraw under File>ChemScripts. One example is given below:
1. Draw a minimum of three structures in the document window.
2. Navigate to File>ChemScripts>Layout Molecules in a Circle. A new document window appears with the structures arranged in a circle.
Chapter 9: Advanced Drawing Techniques
142 of 315
ChemDraw 15.0
Struct=Name (Professional Level)
ChemDraw includes two features for generating structures and chemical names—Name>Struct and Struct>Name.
Collectively, these features are called Struct=Name.
Struct>Name generates the names of chemical structures using the Cahn-Ingold-Prelog rules for stereochemistry.
Using this option, you can generate the name of structures you have drawn.
Name>Struct lets you convert chemical names into their corresponding chemical structures. It is designed to interpret
chemical names as they are used by chemists. In other words, it recognizes the shorthand and slang of everyday
usage, in addition to recognizing most of the official IUPAC, IUBMB, and CAS rules and recommendations.
Struct>Name
Struct>Name can interpret a variety of chemical structures. This means that you can draw a structure and
Struct>Name will provide its name. It also updates the name when you modify the structure.
Using Struct>Name
To generate the name of your structure:
1. Select the structure.
2. Navigate to Structure>Convert Structure to Name. The name appears under the structure.
Supported Structures
However, Struct>Name will interpret:
Stereochemistry
Principal Group in Rings and Chains
Carboxylic Acids
S, Se, and Te Acids
Peroxy acids
S, Se, and Te Esters
Amide derivatives of acids
S, Se, and Te Acid Halides
Carbonic acids
S, Se, and Te Amides
Nitric acids
Sulfides and chalcogen analogs
Acid Halides
Sulfoxides and chalcogen analogs
Carboxylic Esters
Heteroatomic acids (P, B, As)
Salts
Heteroatomic esters
Anhydrides
Heteroatomic acid halides
Hydrazides
Aldehydes and chalcogen analogs
Imides
Ketones and chalcogen analogs
Amides
Alcohols and chalcogen analogs
Hydrazines
Hydroperoxides
Nitriles
Peroxides
Amines and Imines
Chapter 10: Struct=Name (Professional Level)
143 of 315
ChemDraw 15.0
Non-Ringed Structures
Isolating and naming the functional groups
Identifying the base chain of the molecule
Identifying and building substituents
Nomenclature of groups cited only by prefixes
Heteroacyclic compounds
Naming of substituent groups
Locants
Name generation (alphabetization, punctuation, etc.)
Ringed Structures
Struct>Name supports the these types of ringed structures:
Carbomonocyclic structures
Heteromonocyclic structures
Fused polycyclic structures:
Fused polycyclic trivially-named structures
Ring fusions of multiple rings
Ring fusions of two multiple ring systems
Ring fusions of more than two ring systems
Bridged monocyclic structures
Spiro ring systems
Some of these ring structures are defined below.
Ring Assemblies
A ring assembly has two or more identical cyclic systems joined together by single or double bonds. All the cyclic systems are either a single ring, fused system, alicyclic von Baeyer system, spiro system, phane system, or fullerene.
Chapter 10: Struct=Name (Professional Level)
144 of 315
ChemDraw 15.0
Figure 10.1: An example of a ring assembly structure: 1,1':2',1''-terphenyl.
Fused Ring Systems
Struct>Name supports fused ring systems of two or more rings, such as the structure below.
Figure 10.2: cyclopenta[ij]pentaleno[2,1,6-cde]azulene is a fused ring system.
Bridged Fused Ring Systems
ChemDraw supports bipodal (both bivalent and polyvalent) simple acyclic (chained) homogeneous (atoms of only one
element) independent bridged fused ring systems. For example:
Figure 10.3: The bridged fused ring system 9,10-epidioxyanthracene.
Chapter 10: Struct=Name (Professional Level)
145 of 315
ChemDraw 15.0
Polymers
Polymer structures cannot be expressed by SMILES. However, Struct>Name supports many homopolymers, copolymers, and alternating polymers. For example:
Figure 10.4: polyaziridine compound with sulfamic acid (1:1)
Other Compounds
Phosphorous and Arsenic compounds
Si, Ge, Sn, and Pb compounds
Boron compounds
Organometallic compounds
Struct>Name generates names with proper CIP stereochemistry descriptors.
Struct>Name provides direct support for stoichoimetry specified as bracket properties, including fractional stoichiometry. Also, the manner in which the stoichiometry of 0.5 ("hemi") and 1.5 ("sesqui") is handled is improved. For
example:
Figure 10.5: 2-(aminooxy)acetic acid hemihydrochloride
Struct>Name follows IUPAC rules as closely as possible when generating chemical names. However, while handling
indicated hydrogens, it conforms to CAS nomenclature recommendations. For example, the carbon atom between
two oxygen atoms in 1,3-dioxole can never form double bonds as its two neighbors (oxygen atoms) have no free
valences. While preferred IUPAC (PIN) name for that structure is 2H-1,3-dioxole, Struct>Name generates the name
1,3-dioxole. The name produced by Struct>Name conforms to CAS nomenclature recommendations in this regard.
Unsupported Structures
This feature has a few limitations for interpreting some structures such as:
Sulfones and chalcogen analogs
Chapter 10: Struct=Name (Professional Level)
146 of 315
ChemDraw 15.0
Isotopically modified compounds
Radicals, ions, and radical ions
Auto Update
You can include chemical properties, including the chemical name and analysis, in a caption, and the caption content
will update automatically when you modify the structure. For more information on adding chemical properties to captions, see "Analysis Data" on page 66.
To toggle the auto-update feature:
1. Point to the caption.
2. Right-click and select Auto-update. A check mark appears next to the command when it is selected. Successive
clicks toggle the command on and off.
When auto-update is on (default) the label updates each time you modify the structure.
Note: For large structures, the new label may not appear for a few seconds. You do not have to wait for the new
label to appear before continuing to modify your structure.
Name>Struct
You can type a chemical name and Name>Struct will draw the structure.
Although some trade names are supported, Name>Struct is not intended to interpret trade or common names. A chemical database, such as ChemBioFinder.com, is more appropriate for obtaining these structures.
Note: Use the words ‘alpha’ and ‘beta’ when entering forms of amino acids. For example, ‘alpha alanine’ and ‘beta
alanine’ are valid name>struct chemical names.
Note: Name>Struct can also interpret many German names.
Converting Names to Structures
To enter the name and convert it to its structure:
1. Navigate to Structure>Convert Name to Structure.
The Insert Structure dialog box appears.
2. Type the name (example: 2-bromobenzoic acid) or paste the copied name from the clipboard.
Tip: You can paste the name using keyboard commands: <CTRL>+<V> .
3. To place the name below the structure, select Paste name below structure.
4. Click OK.
Converting Clipboard Names
To paste a name on the clipboard as a structure:
Chapter 10: Struct=Name (Professional Level)
147 of 315
ChemDraw 15.0
1. Click in the document window.
2. Navigate to Edit>Paste Special>Name as Structure. The structure appears in your document.
Converting Captions
You can convert a caption to a structure.
1. Select the caption.
2. Navigate to Structure>Convert Name to Structure.
Supported Structures
Struct>Name can name compounds in classes of structures:
Principal Groups in Rings and Chains
Acid Halides
Alcohols and chalcogen analogs
Aldehydes and chalcogen analogs
Amides
Amines and Imines
Carboxylic Acids
Carboxylic Esters
Heteroatomic acid halides
Heteroatomic acids (P, B, As)
Heteroatomic esters
Hydrazides
Hydrazines
Hydroperoxides
Ketones and chalcogen analogs
Amide derivatives of acids
Anhydrides
Carbonic acids
Imides
Nitric acids
Peroxy acids
Salts
Sulfides and chalcogen analogs
Sulfoxides and chalcogen analogs
Peroxides
S, Se and Te Amides
S, Se, and Te Acid Halides
S, Se, and Te Acids
S, Se, and Te Esters
Nitriles
Ringed Structures
Bridged monocyclic structures
Carbomonocyclic structures
Fused polycyclic trivially-named structures
Other Compounds
Boron compounds
Organometallic compounds
Heteromonocyclic structures
Ring fusions of only two rings
Ring fusions of two multiple ring systems
Si, Ge, Sn, and Pb compounds
Phosphorous and Arsenic compounds
Name>Struct recognizes most organic and inorganic nomenclature. However, some types are not supported:
Coordination complexes
Polyboranes
Polymers
Some highly-bridged ring systems, including fullerenes and porphyrins/porphines
Some stereochemistry designators: +, -, +/-, +-, D, l, dl, endo, exo, syn, anti, r, t, c
Chapter 10: Struct=Name (Professional Level)
148 of 315
ChemDraw 15.0
Chemistry Features
Structure Analysis
You can display the chemical formula, exact mass, molecular weight, m/z, and elemental analysis for the entire document, a structure, or a part of a structure using the Analysis window.
Values for selected objects in the document window are shown. If no structure is selected in your document, values
for the entire document are shown.
You can have this window open as you draw in the document. It shows the current values as you draw, see example
below:
The Decimals setting applies to Exact Mass, Molecular Weight, and m/z only. The values displayed in the Analysis
window includes:
Formula. The molecular formula showing the exact number of atoms of each element in the molecule and charges,
radicals, and isotopes.
Exact Mass. The exact molecular mass of the structure, where atomic masses of each atom are based on the most
common isotope for the element.
Molecular Weight. The average molecular mass of the structure, where atomic masses are based on the natural
abundance of all isotopes of the element.
m/z. Mass/charge. The weights of the most common isotopes and a graphical representation of the isotopic abundance is shown.
The molecular weight accounts for the isotopes for each atom and their natural abundance. Where there is more than
one abundant isotope, this feature computes multiple molecular weights. Low abundance combinations (whether
because the isotope is in low abundance or because it includes many moderate-abundance contributions) are not
taken into account.
Elemental Analysis. The percent by weight of each element in the structure.
To open the analysis window:
1. Select the entire structure, or part of the structure. If nothing is selected, the analysis window displays value for the
entire structure.
Chapter 11: Chemistry Features
149 of 315
ChemDraw 15.0
2. Navigate to View>Show Analysis Window. The analysis windows displays values for the parts of the drawing
you select, or the entire drawing if nothing is selected.
3. (Optional) Select Paste to add the analysis information to your drawing. The information appears as a caption that
you can edit.
Figure 11.1: Structural analysis
The information updates as you edit the structure. You can show or hide the information:
1. Using any tool, right-click the caption.
2. Point to Analysis, and select or deselect the item to show/hide.
ChemFinder hotlink
PerkinElmer Informatics maintains a vast database of compounds and their properties. ChemDraw provides a live
Internet connection to a database, that includes:
Links to available data resources such as the PerkinElmer Informatics ChemIndex.
Links to ChemSpider database.
Names and synonyms.
Chemical identifiers such as CAS Registry Numbers and ChemACX IDs.
The HotLink information and the data itself are continually updated.
The HotLink displays information for the structure in the document window.
To open the ChemFinder HotLink:
1. Select a structure.
2. Go to View>Show ChemFinder HotLink Window.
Note: To access ChemSpider database, click on the value of either InchiKey or Std InchiKey in the Properties
table in the ChemFinder Hotlink window.
Chapter 11: Chemistry Features
150 of 315
ChemDraw 15.0
Stereochemistry
ChemDraw calculates the absolute stereochemistry according to the Cahn-Ingold-Prelog (CIP) priority rules. For
more information, see "Cahn-Ingold-Prelog" on page 284.
Only tetrahedral and double-bond stereochemistry are supported, and only non-racemic stereochemistry is interpreted. Stereochemical indicators for aromatic bonds are not displayed.
ChemDraw uses this notation:
(R), (S)
Standard tetrahedral stereochemistry
(r), (s)
Tetrahedral stereochemistry determined by other stereochemical centers. For example: cis-decalin and myo-inositol
(E), (Z)
Standard double-bond stereochemistry
Stereochemistry Indicators
ChemDraw updates stereochemistry indicators as you change your drawing.
To include stereochemistry indicators in your drawing:
1. Select the structure.
2. Right-click and select Object Settings from the context menu.
3. From the Drawing tab, under Atom Indicators and Bond Indicators, select Show Stereochemistry.
The stereo-centers are marked, as shown in this example:
Chapter 11: Chemistry Features
151 of 315
ChemDraw 15.0
Hiding Indicators
1. Select the indicator you want to hide.
2. Right-click and select Hide Indicator from the context menu.
Formatting Indicators
To change the font style:
1. Select the indicator you want to manipulate.
2. Right-click and select the Style from the context menu.
Applying Parenthesis
To apply parentheses to stereochemistry indicators:
1. Navigate to File>Preferences.
2. From the Preferences dialog, under the Building/Display tab, select Include Parentheses When Showing Stereochemistry.
Removing Indicators
To remove an indicator, click on it using the Eraser tool.
Positioning Indicators
You can position a query indicator by either dragging it or entering a numeric value for the new location.
To indicate an exact location:
Chapter 11: Chemistry Features
152 of 315
ChemDraw 15.0
1. Select the indicator you want to re-position.
2. Right-click and choose Position from the context menu. The Position Indicator dialog appears.
3. Click the appropriate option, and type a value, as described in the table below:
To Position
Type a Value for the Position by
From the atom or bond center
Angle, in degrees
to indicator center
or
Clock, in clock time
From the atom or bond center
Offset, horizontal, and vertical
to bottom left of indicator
baseline
At specified coordinates
Absolute, horizontal, and vertical
Relative stereochemistry
You can specify relationships between groups of stereocenters within a molecule.
This notation enables you to describe stereochemical properties and individual stereocenters rather than the entire
molecule. As a result, you can illustrate properties of several enantiomers using only a few (or just one) structures.
The notation is illustrated below:
To add stereochemical notation to a structure, go to Structure>Enhanced Stereochemistry.
The power of this notation becomes clear when you draw complex enantiomers. For example, beta-cypermethrin is a
mixture of four distinct stereoisomers consisting of two enantiomeric pairs. However, drawing this requires only one
structure:
Chapter 11: Chemistry Features
153 of 315
ChemDraw 15.0
Figure 11.2: beta-Cypermethrin
Two stereo-centers have the &1 designation because of their fixed relative configuration: when one is (R) the other
must be (S). As a result, they form a group. The third stereocenter varies independently and is designated &2. Group
numbers are incremented automatically. To see all the beta-cypermethrin stereoisomers, go to File>Open
Samples>b-Cypermethrin.
To indicate stereochemistry for a group:
1. Select all atoms in the group using SHIFT+click.
2. Go to Structure>Enhanced Stereochemistry and select a stereochemistry marker.
See "Relative stereochemistry" on page 153 for information on showing and hiding indicators.
You can save enhanced stereochemistry notation in any of these formats: CDX, CDXML, MOL V3000, RXN V3000,
SKC, TGF.
When saving to SKC or TGF format, the indicators are converted into corresponding Data SGroups. Whenever you
open SKC or TGF files containing such Data SGroups, they are converted into true Enhanced Stereochemistry values.
Chemical Annotations
ChemDraw provides the following tools and tool palettes that enable you to add chemical annotations to your documents:
Orbital tools palette. Draw orbitals
Chemical Symbol Tools palette. Draw charges, radicals, and other symbols
Orbitals
You draw orbitals so that the node appears first. Then you can change the background color, shading, and solid color
using the Color menu.
Chapter 11: Chemistry Features
154 of 315
ChemDraw 15.0
Display the Info window to view the orbital’s length and angle relative to the X-axis while you draw it. To constrain the
length and angle of an orbital, navigate to Object>Fixed Lengths or Fixed Angles.
Note: Orbitals are not normally a part of the structure they are drawn near and are not selected when you
double-click a bond, atom, or atom label with a selection tool. To group the orbitals with the structure, navigate to
Object>Group. See "Grouping Objects" on page 85.
S-orbitals
The s-orbital is shown below:
To draw an s orbital:
1. Hold down the mouse button over the Orbital tool and drag to select the s-orbital tool from the palette.
2. Click an atom in the drawing where the orbital will be centered.
Sigma Orbitals
The sigma-orbital is shown below:
To draw a σ-orbital:
1. Hold down the mouse button over the Orbital tool and drag to select the σ-orbital tool from the palette.
2. Click an atom in the drawing where the orbital will be centered.
Single Lobe Orbitals
To draw a single lobe orbital:
1. Hold down the mouse button over the Orbital tool and drag to select the single lobe orbital tool from the palette.
2. Click an atom where the narrow end of the orbital will be attached.
P-orbitals
The p-orbital is shown below:
To draw a p orbital:
1. Hold down the mouse button over the Orbital tool and drag to select the p-orbital tool from the palette.
2. Click an atom where the node of the orbital will be attached.
Hybrid Orbitals
The hybrid orbital is shown below:
To draw a hybrid orbital (‘sp3’):
1. Hold down the mouse button over the Orbital tool and drag to select the hybrid-orbital tool from the palette.
2. click an atom where the node of the orbital will be attached.
Chapter 11: Chemistry Features
155 of 315
ChemDraw 15.0
D-orbitals
The d-orbital is shown below:
To draw a d orbital(‘dxy’):
1. Hold down the mouse button over the Orbital tool and drag to select the d-orbital tool from the palette.
2. Click an atom where the node of the orbital will be attached.
To draw a dz orbital:
2-
1. Hold down the mouse button over the Orbital tool and drag to select the dz2-orbital tool from the palette.
2. Click an atom where the node of the orbital will be attached.
Chemical Symbols
You can move any attached chemical symbol (other than H-dot and H-dash) any distance from its related atom. The
available chemical symbols are:
Figure 11.3: Chemical Symbols: A) Circle Plus; B) Plus; C) Radical cation; D) Lone pair; E) Electron Pushing; F) Hdot; G) Attachment point; H) Polymer bead attachment point; I) Attachment point; J) Attachment point; K) H-dash; L)
Radical Pushing; M) Radical; N) Radical anion; O) Minus; P) Circle minus.
You can place unattached symbols anywhere within your document and resize them.
H–dot and H–dash
To represent a hydrogen atom that is coming out of the plane toward you along the Z axis, use the H–dot symbol.
To represent a hydrogen atom that is directed backwards into the plane away from you along the Z axis, use the H–
dash symbol. To insert H–dots and H–dashes, click an atom.
Lone Pair/Diradical
Use the lone pair symbol to indicate a lone pair of electrons common in Lewis structures.
To use the lone pair symbol:
1. Hold down the mouse button over the Chemical Symbols tool and drag to select the lone pair from the palette.
Chapter 11: Chemistry Features
156 of 315
ChemDraw 15.0
2. Click and drag the atom to where you want the lone pair. The lone pair is offset from the atom at a fixed position.
Note: With the lone pair tool selected, if you ALT + click on an atom, it will place a lone pair bar symbol instead of
a lone pair double dot symbol.
Electron and Radical Pushing
ChemDraw provides the Electron Pushing and Radical Pushing tools for illustrating electron transfer. Electron transfers can be drawn between atoms, bonds, and orbitals. For more information, see "Electron and Radical Pushing" on
page 132.
Radical
Use the radical symbol to indicate a single non-bonded electron.
To use the radical symbol:
1. Hold down the mouse button over the Chemical Symbols tool and drag to select the radical from the palette.
2. Click and drag the atom to where you want the radical symbol.
Note: The lone pair symbol is interpreted as a diradical when it is placed next to an unlabeled carbon atom.
Radical Cation and Radical Anion
Use the charge radical symbols to represent radicals that are charged.
To use the charge radical symbols:
1. Hold down the mouse button over the Chemical Symbols tool and drag to select the symbol from the palette.
2. Click and drag the atom to where you want the symbol.
3. Click an atom to add a radical cation or radical anion symbol in a horizontal orientation.
Charge Symbols
To draw a charge and associate it with a structure:
1. Hold down the mouse button over the Chemical Symbols tool and drag to select the charge symbol from the
palette.
2. Click and drag the atom to which you want the charge to correspond.
The number of hydrogen atoms increases or decreases as appropriate for the addition of the charge.
Attachment Points
Indicating an attachment point is useful in polymer-bound combinatorial synthesis, protein chemistry, and other situations. The Chemical Symbols toolbar includes attachment point drawing tools that indicate a point of attachment
while maintaining chemical meaning.
Chapter 11: Chemistry Features
157 of 315
ChemDraw 15.0
The bead tools are intended to indicate attachment to a resin. Any of these tools may be used for variable attachments in queries (see "Attachment Points" on page 122); but, only the diamond tool shows rank numbers. This means
that, as you add diamond symbols to a structure, the points will have sequential numbers.
Note: You can resize a polymer bead by selecting it with a marque tool, and dragging the resize drag handles.
Rotating a Symbol
You can rotate the radical anion, cation, and lone pair symbols around the same end from which they were originally
drawn. For example, the radical cation symbol is rotated and resized from the charge. The Info window shows the
angle that one of the ends of a symbol makes with the X–axis as you rotate.
To rotate a chemical symbol:
1. Select the chemical symbol.
2. Drag the rotation handle on the chemical symbol. See "Rotating Objects" on page 82.
Chemical Properties
Chemical Property Prediction is a feature supported by ChemOffice. It enables you to calculate values for a wide
range of methodologies; for example, topological descriptors such as the Weiner index and Balaban index, thermodynamic descriptors such as solubility, melting and boiling points, and partition coefficients such as CLogP, properties related to the three-dimensional shape and volume of a chemical such as the Connolly surface area and
volume. In total, you can calculate more than 100 chemical properties for a given structure.
For a list of properties available in a specific application, click the respective link below, or visit the PerkinElmer
Informatics website.
"Property Predictions in ChemDraw" on page 158
"Property Predictions in Chem3D" on page 163
"Property Predictions in ChemDraw/Excel" on page 162
"ChemFinder Properties" on page 164
Property Predictions in ChemDraw
You can enter predicted values for the physical and thermodynamic properties of a chemical structure of up to 100
atoms.
Chapter 11: Chemistry Features
158 of 315
ChemDraw 15.0
The properties are calculated using the most reliable methods for the given structure. Log P, and CMR values based
on literature values rather than a calculation are included in the report file. The report is produced as a text file and the
information in it can be cut and pasted to other documents like a word document.
A list of all the properties calculated is as follows:
B
H
P
Boiling Point
Heat of Formation
pKa
C
Henry’s Law Constant
T
Critical Pressure
L
tPSA
Critical Temperature
LogP
Critical Volume
LogS
CLogP/CMR
M
G
Melting point
Gibbs Free Energy
MR
About Molecular Networks
*MOSES.pKa, MOSES.logS and MOSES.logP for predicting acid dissociation constants, aqueous solubility and
octanol/water distribution coefficients of chemical compounds are computational calculator modules based on Molecular Networks' cheminformatics platform MOSES. MOSES is developed, maintained and owned by Molecular Networks GmbH, Erlangen, Germany. For further information please visit www.molecular-networks.com/moses. All
rights reserved. Molecular Networks GmbH, Erlangen, Germany (www.molecular-networks.com).
Limitations
Only the following atom types and hybridization states are parameterized:
C
C 3
sp
N
N
N
S
F
3
sp
2
sp
2
sp
O 3
sp
C
sp
N
N
amide
aromatic
O 2
sp
P 3
sp
S 2
sp
S
sulfoxide
S
sulfone
Cl
Br
I
sp
3
sp
C
aromatic
Chapter 11: Chemistry Features
159 of 315
ChemDraw 15.0
Boiling Point
The boiling point is reported in Kelvin.
A solution boils at a slightly higher temperature than the pure solvent. The change in boiling point is calculated using
the formula:
Where Kb is the molal boiling point constant, m is the concentration of the solute expressed as molality, and ∆Tb is
the change in temperature.
Critical Pressure
Reported in bars, this is the least applied pressure required at the critical temperature to liquefy a gas.
Critical Temperature
Reported in Kelvin, this is the temperature above which a gas cannot be liquefied, regardless of the pressure applied.
Critical Volume
Reported in cm3/mol, this is the volume occupied by one mole of a substance at the critical temperature and pressure.
CLogP/CMR
Use CLogP to calculate n-octanol/water partition coefficient (log Pow). LogP values based on literature rather than calculations are included in the report file.
Use CMR to calculate Molar Refractivity. MR values based on literature rather than calculations are included in the
report file.
Note: CLogP and CMR values appear only in ChemDraw Professional.
Gibbs Free Energy
Gibbs free energy is defined as:
Which is same as:
Chapter 11: Chemistry Features
160 of 315
ChemDraw 15.0
Where:
U is the internal energy (SI unit: Joule)
p is pressure (SI unit: Pascal)
V is volume (SI unit: m3)
T is the temperature (SI unit: Kelvin)
S is the entropy (SI unit: joule per Kelvin)
H is the enthalpy (SI unit: Joule)
Note: H and S are thermodynamic values found at standard temperature and pressure.
Heat of Formation
Reported in KJ/mole, the heat of formation is the increase in enthalpy resulting from the formation of one mole of a substance from its constituent elements at constant pressure.
Henry’s Law Constant
A unitless value, Henry's Law Constant can be expressed as:
Where ‘p’ is the partial pressure of the solute in the gas above the solution, ‘c’ is the concentration of the solute and
‘kH,pc’ is a constant with the dimensions of pressure divided by concentration. The constant, known as the Henry's
law constant, depends on the solute, solvent, and temperature.
LogP
The partition coefficient is a ratio of concentrations of un-ionized compound between two solutions. To measure the
partition coefficient of ionizable solutes, the pH of the aqueous phase is adjusted so that the predominant form of the
compound is un-ionized. The logarithm of the ratio of the concentrations of the un-ionized solute in the solvents is
called LogP.
Normally, one of the solvents chosen is water; the second is hydrophobic, such as octanol.
The formula to calculate LogP is:
LogS
LogS determines the solubility of a substance, measured in mol/liter.
The aqueous solubility of a compound is known to significantly affect absorption and distribution characteristics of
that compound.
Chapter 11: Chemistry Features
161 of 315
ChemDraw 15.0
Note: LogS calculations are available only in Microsoft Windows version of ChemDraw.
Melting point
Is the temperature at which a solid becomes a liquid at standard atmospheric pressure. At the melting point, the solid
and liquid phase exist in equilibrium. The formula to calculate melting point is:
Where ‘T’ is the temperature at the melting point, ‘∆S’ is the change in entropy of melting, and ‘∆H’ is the change in
enthalpy of melting.
MR
The Molar Refractivity is estimated by Crippen's fragmentation and Viswanadhan's fragmentation method. Additional
empirical LogP data appears for selected substances in the report file.
pKa
pKa is the negative log of the acid dissociation constant K . It describes the tendency of compounds or ions to disa
sociate in solution. It is calculated using the formula:
Empirical pKa data appears for selected substances in the report file.
Note: pKa calculations are available only in Microsoft Windows version of ChemDraw.
tPSA
Calculation of polar surface area based on fragment contributions.
Property Predictions in ChemDraw/Excel
The Properties feature in ChemDraw/Excel lets you view the values of different properties for a given structure. Each
property is calculated using the “best available” method. A list of properties available in ChemDraw/Excel is listed in
the table below. For more information on these properties, see ChemDraw/Excel online help, or visit the PerkinElmer
Informatics website .
The properties available include:
B
F
Melting Point
Shape Attribute
Balaban Index
Formal Charge
Molar Refractivity
Shape Coefficient
Boiling Point
Freezing Point
Molecular Formula
Sum Of Degrees
C
G
Molecular Weight
Sum of Valence
Chapter 11: Chemistry Features
162 of 315
ChemDraw 15.0
Degrees
Cluster Count
Gibbs Free Energy
N
T
Critical Pressure
H
Number of Rotatable
Bonds
Total Connectivity
Critical Temperature
Heat of Formation
O
Topological Diameter
Critical Volume
Henry's Law Constant
Ovality
Topological Index
Connolly Accessible Area
I
P
Total Valence Connectivity
Connolly Molecular Surface Ideal Gas Thermal
Area
Capacity
Principal Moments of
Inertia (X, Y, Z)
V
Connolly Solvent Accessible Surface Area
Polar Surface Area
Vapor Pressure
Connolly Solvent-Excluded
LogP
Volume
R
W
E
M
Radius
Water Solubility
Exact Mass
Mass
S
Wiener Index
L
Property Predictions in Chem3D
Chem3D lets you build, analyze, and compute properties very easily. In addition to analyzing structures to calculate
mass and formula, predicting numerous physical properties, you can also perform calculations for molecular topology.
A list of properties available in Chem3D is listed in the table below. For more information on these properties, see
Chem3D online help or visit the PerkinElmer Informatics website.
B
G
Mol Weight
Spin Density
Balaban Index
Gibbs Free Energy
Molecular Mass
Sum Of Degrees
Boiling Point
H
Molecular Surfaces
Sum of Valence
Degrees
C
Harmonic Zero Point
Energy
Molecular Topological
Index
T
C
P
Heat Capacity
Molecular Volume
Thermodynamic
Energy
C
v
Heat of Formation
Mulliken Charges
Topological Diameter
Cluster Count
Henry’s Law Constant
Mulliken Populations
Total Connectivity
Chapter 11: Chemistry Features
163 of 315
ChemDraw 15.0
Connolly Accessible Area
Hyper Polarizability
m/z
Total Energy
Connolly Molecular Area
Hyperfine Coupling
Constants
N
Total Valence Connectivity
Connolly Solvent Excluded
Volume
I
Num Rotatable Bonds
V
Critical Pressure
Ideal Gas Thermal
Capacity
O
Vapor Pressure
Critical Temperature
Internal Energy
Ovality
W
Critical Volume
Ionization Potential
P
Water Solubility
D
K
Partition Coefficient
Wiener Index
Dipole
Kinetic Energy
pKa
Z
E
L
Polar Surface Area
Zero-Point Energy
Electron Density
LogP
Polarizability
Electrostatic Potential
LogS
Potential Energy
Elemental Analysis
Lowdin Charges
Principal Moment
Enthalpy
Lowdin Populations
R
Entropy
M
Radius
Exact Mass
Mass
RMS Force
F
Melting Point
S
Formal Charge
Mol Formula
SCF Energy
Frequencies
Mol Formula HTML
Shape Attribute
Mol Refractivity
Shape Coefficient
ChemFinder Properties
The properties listed below can be calculated in ChemFinder Professional for ChemOffice. For more information on
these properties and how to calculate them, see the ChemFinder online help.
B
H
P
Balaban Index
Heat of Formation
Partition Coefficient
Boiling Point
Henry’s Law Constant
pKa
C
I
Polar Surface Area
Chemical Name
Ideal Gas Thermal Capacity
Principal Moment
Cluster Count
L
R
Critical Pressure
LogP
Radius
Critical Temperature
LogS
S
Chapter 11: Chemistry Features
164 of 315
ChemDraw 15.0
Critical Volume
M
Shape Attribute
Connolly Accessible Area
Mass
Shape Coefficient
Connolly Molecular Area
Melting Point
Sum of Degrees
Connolly Solvent Excluded Volume
Mol Formula
Sum of Valence Degrees
E
Mol Formula HTML
T
Elemental Analysis
Mol Refractivity
Topological Diameter
Exact Mass
Mol Weight
Total Connectivity
F
Molecular Topological Index
Total Valence Connectivity
Formal Charge
m/z
V
G
N
Vapor Pressure
Gibbs Free Energy
Num Rotatable Bonds
W
O
Water Solubility
Ovality
Wiener Index
Viewing Chemical Properties
To view chemical properties:
1. Select the structure whose properties you want to view.
2. Navigate to View>Show Chemical Properties Window. The Chemical Properties window appears.
3. To paste the basic properties into your document, click Paste.
4. To create a report and view results for other fragmentation methods, click Report.
3D Viewing
As you create your drawing, you can view it in three-dimensions. Two features in ChemDraw let you view structures
in three dimensions.
Note: Chem3D must be installed on your computer to preview structures in three dimensions.
3D Model
Use a 3D model to paste a 3D version of the structure into your drawing.
1. Select the structure.
2. Navigate to Edit>Get 3D Model. The 3D structure appears in the document window.
Chapter 11: Chemistry Features
165 of 315
ChemDraw 15.0
To view the model in Chem3D, double-click on it.
Note: 3D objects inserted in this way cannot be transferred between platforms. For more information, see "File
Formats" on page 273.
Note: You can copy a model using "Copy as CDX" from Chem3D and paste into ChemDraw. The result is a
ChemDraw structure with 3D coordinates, and it is possible to rotate this structure in 3D using the structure perspective tool.
Chem3D Preview Options
The preview window displays structures you select in 3D, and displays all structures if none are selected. Chem3D
Preview works only for chemical structures.
Note: The Chem3D Hotlink Window option is available only with ChemOffice 2015 SKU.
To view, navigate to View>Show Chem3D Hotlink Window. For example:
Chapter 11: Chemistry Features
166 of 315
ChemDraw 15.0
With the preview window open, you can change the structure’s appearance, in either the document window, or the preview window.
In the Document Window
With the preview window open, you can still change your drawing in the document window. The preview window
updates to reflect the changes.
In Chem3D Preview
The preview window offers several options to view structures.
Figure 11.4: A)Launch Chem3D; B)Display mode; C)Select; D)Translate; E)Rotate; F)Zoom; G)Spin; H)Rock.
Chapter 11: Chemistry Features
167 of 315
ChemDraw 15.0
Launch Chem 3D. The structure will appear in Chem3D as a model that you can edit.
Display Mode. Choose display options for the model: wire frame, stick, ball & stick, cylindrical bonds, and space
filling.
Select. Select the structure or parts of it.
Translate. Move the structure.
Rotate. Rotate the structure in three dimensions (the image rotates only in the Chem3D Preview).
Zoom. Enlarge or reduce the apparent size of the structure.
Spin. Rotate the structure horizontally in one direction.
Rock. Rotate the structure horizontally back and forth.
Returning to the Document Window
To exit the Chem3D Preview, close the preview window.
To edit the 3D model:
1. Double-click the 3D structure. Chem3D opens.
2. Edit the structure and close Chem3D.
The edited structure appears in the ChemDraw document window.
TLC
The TLC (Thin Layer Chromatography)Tool lets you depict thin layer chromatography plates. The tool creates a rectangular plate with an origin line, solvent front, and one or more lanes. The lanes can be populated with spots of different Rf, size, shape, or color.
To create a TLC plate:
1. Select the TLC tool from the Chromatography toolbar.
2. Drag in any direction from the point of origin. The width of the plate determines the number of lanes.
You can modify the plate as follows:
If you want to
Then
Change the height or width of the plate.
Drag a border or corner.
Move the origin or solvent front.
Click and drag the origin or solvent front line.
Show or hide the origin, solvent front, borders, or
Right-click in the plate and select the appropriate
side ticks.
action.
Use the Transparent option to overlay the TLC plate on
a scanned plate.
Change the order of lanes.
Drag the origin tick to the new location.
Add, delete, or duplicate a lane.
1. Position the cursor on the lane to delete or duplicate
Chapter 11: Chemistry Features
168 of 315
ChemDraw 15.0
If you want to
Then
(or between lanes to add).
2. Right-click in the plate.
3. Select the appropriate action.
4. (Optional) To delete a lane, click on it with the Eraser
tool.
Move a spot.
Drag the spot. The Rf displays as you drag.
Duplicate a spot.
<CTRL>+dragthe spot to a different lane.
Delete a spot.
Click the spot with the Eraser tool. If you erase all spots
in a lane, the lane is deleted.
Display or set the Rf for a spot; add a custom
1. Right-click
on a spot.
spot..
2. Point to TLC Spots, and take the appropriate action.
3. To display Rf for all spots, right-click in the plate
and select Show Rf from the TLC Spots submenu.
Change the style or color of a spot.
1. Right-click
a spot..
2. Choose the style or color.
Note: Keeping all styles unchecked creates a hollow
spot.
3. To change the style for all spots, right-click in the
plate and choose the style from the TLC Spots submenu.
Enlarge or “smear” a spot.
<Shift>+drag the spot. When you position the cursor
on a spot and press <Shift>, the cursor assumes one of
three shapes, depending on how it is positioned:
Cross arrows, used to enlarge a spot
Horizontal arrow, used to widen a spot
Vertical arrow, used to elongate a spot or create a
crescent
Rf Display
Right-click a spot and select Show Rf to indicate the spot’s retention value. By default, the value of Rf is set to two
decimal places.
Chapter 11: Chemistry Features
169 of 315
ChemDraw 15.0
Moving the Tag
Either click and drag the tag using a selection tool or Right-click
the tag and choose Position. Edit the values in
the Position Indicators box.
Editing the Rf Value
Select the tag with the Text tool and edit the value.
If you change the Rf the spot will move to the new position indicated.
If you edit the Rf to have different precision, that precision will be preserved.
Resizing Spots
You can resize spots by holding down the <Shift> key while pointing at an edge of the spot. Drag the left or right sides
of the spot to adjust the width only. Drag from the top to adjust the height. Drag from the bottom to adjust the tail. Drag
from any of the other four corners to scale all three values.
Customizing Spots
The TLC tool can create the most common spot shapes. Other types of spots, such as smears, can be reproduced as
custom spots. The Set Custom Spot command lets you insert a graphic file for a spot. Typically, these files would
be produced by scanning a TLC plate and saving the spots in a library of spot shapes.
Gel electrophoresis tool
Gel Electrophoresis tool is available in the Chromatography toolbar and functions much like the TLC tool. It consists
of a plate containing several lanes with one or more bands. The bands can be resized and moved along the lane. For
example, consider the figure below:
You can perform the following action on a plate:
Option
Action
Show scale.
A scale bar appears on the right of the plate. By default, the unit is
displayed in kDa. However you can change it to Log(Mass),
Chapter 11: Chemistry Features
170 of 315
ChemDraw 15.0
Option
Action
Mass, or distance from the “Units” submenu. For Log(Mass) and
Mass the highest value is on the top. For distance the highest
value '1' is at the bottom.
Show Lane
A label appears for every lane. You can rename and rotate it to
Labels.
any desired angle. When one of the labels is rotated, all the other
labels are also rotated by the same angle.
Set Range...
A dialog box prompting for the new range appears. The expected
values entered in this dialog are always “kDa”. The default value
for range is 10 to 10,00,000 (Mass), 1 to 6(Log), and 0 to 1
(Distance). When you change the range, the bands that fall out of
range are hidden.
Add Bands...
A dialog box prompting for the mass of the new bands to be created in the selected lane appears. Space is used as a separator.
Only numbers are allowed. You can also add bands by hovering
over the plate lane with the ALT key pressed. The cursor
changes to '+', and clicking on the plate will deposit a new band.
Add Lane
Adds a new lane.
Duplicate Lane
Adds a duplicate lane. CTRL+dragging a selected lane
also duplicates a lane.
Delete Lane
Deletes a lane.
All of the items in a particular lane can be modified simultaneously, by hovering over the lane and selecting the
required context menu option. For example, you can display all the items in a lane in a specific color, or have them display specific styles.
Chapter 11: Chemistry Features
171 of 315
ChemDraw 15.0
You can perform the following action on a band:
Option
Action
Show size.
The current value of the band appears above it. The value is
always shown on top of the band, and is always bound to it.
If you drag it to another position, a tether appears between
the band and the text.
You can move the marker label by pressing the ALT key.
Set Size.
A dialog box prompting for the new mass(size) of the band
appears. The band will be automatically moved according to
its new value. You can locate the bands that fall out of range
and are hidden.
Style
Specify the style for the selected band. There are four possible style options available- Filled, Not filled, dashed-bold,
and doubled-filled bands. The styles can also be combined.
Set Custom
Band
A dialog box prompting you to select a graphic file to be displayed as the selected band appears.
Chapter 11: Chemistry Features
172 of 315
ChemDraw 15.0
Option
Action
Duplicate Band
To duplicate a band, select a band and CTRL+drag .
Remove Custom Band
The custom band setting is removed for the selected band and the band appears in its default style.
Delete Band
Deletes a band from the lane. You can also delete the bands
in a lane by hovering over them and pressing Delete.
Note: You can have empty lanes.
ChemNMR (Professional Level)
Using ChemNMR, you can estimate and display proton and Carbon-13 chemical shifts for a selected molecule.
As with ChemDraw, you can also use Chem3D to predict NMR. Chem3D includes several interfaces to computational chemistry packages which predict NMR. Some packages predict IR spectra and other spectra as well. For
more information on Chem3D packages, which have NMR predictions, and their available parameters, see the
Chem3D User Guide.
Setting Parameters Values in ChemNMR
Use the ChemNMR option in Preferences dialog to set the parameter values in ChemNMR. See the example below:
Solvent
The solvent is not user-definable in ChemNMR, except by adding new custom shift correction data. Most spectra in
the default ChemNMR database are run in deuterated chloroform, but the database is intended to be solvent-free. In
ChemDraw, you can set either deuterated chloroform, or deuterated dimethyl sulfoxide as solvent from the Preferences dialog. Spectral shifts which depend on the solvent are generally indicated as "rough" predictions.
Chapter 11: Chemistry Features
173 of 315
ChemDraw 15.0
Spectrometer Frequency
ChemNMR's default for estimating proton NMR is a spectrometer frequency of 300 MHz. To change the default frequency, either set the new frequency using the Preferences dialog, or hold the <Alt> key while selecting Predict 1HNMR Shifts, and enter a frequency in MHz and run the spectrum. The new frequency will apply until you reset it,
including after closing ChemDraw. The spectrometer frequency parameter only applies to proton NMR.
For further information, see:
"NMR Shifts" on page 174 (How to run NMR predictions in ChemDraw)
"Assigning Structures to Spectra" on page 175 (Re-linking atoms to peaks)
"Viewing Spectral Assignments" on page 175 (Peaks associated with atoms)
"Removing Spectral Assignments" on page 175 (Dissociating peaks from atoms)
"Custom Shift Correction Data" on page 176 (Adding new spectrum information)
"ChemNMR Limitations" on page 179 (Elements and standard deviations)
"NMR References" on page 179 (Source citations)
NMR Shifts
ChemNMR estimates chemical shifts for all hydrogen or carbon atoms for which additivity rules are available. Following a hierarchical list, it first identifies key substructures of a molecule. A substructure provides the base value for
the estimated shift. For example, benzene would be the key substructure of trinitrotoluene.
When a substructure is a ring system not available in the data, ChemNMR approximates its base shift using embedded rings and, if necessary, will disassemble the ring into acyclic substructures.
ChemNMR views remaining parts of the molecule as substituents of a substructure. Each substituent adds to, or subtracts from, the base shift of the substructure to which it is attached. Additivity rules determine the increment of each
contribution. If an increment for a substituent cannot be determined, ChemNMR uses embedded substituents—smaller structural units with the same neighboring atoms. Or, it will use increments of identical, or embedded substituents,
of a corresponding substructure by assuming that the effects of the substituents are of the same magnitude.
ChemNMR provides a detailed protocol of the estimation process applied. It gives substructures as names, compound classes in most cases, substituents in the form of a linear code, respectively.
It also implements models for ethylenes (cis/trans) and cyclohexanes (equatorial/axial)
To view 1H or 13C NMR information:
1. Select a structure.
2. Navigate to Structure>Predict 1H-NMR Shifts or Predict 13C-NMR Shifts.
ChemNMR redraws the molecule with the estimated shifts and displays the information and line spectrum in a new
window.
Modifying NMR Frequency
You can change the default NMR frequency of 300 Mhz in ChemDraw Proton NMR predictions.
To change the frequency:
Chapter 11: Chemistry Features
174 of 315
ChemDraw 15.0
1. Navigate to File>Preferences. The Preferences dialog appears.
2. Select ChemNMR option.
3. Specify the new frequency in the Frequency text box.
4. Click OK.
5. Navigate to Structure>Predict 1H-NMR Shifts. . The predicted NMR spectrum appears.
Assigning Structures to Spectra
ChemDraw Professional lets you assign structures to spectra. You can then display the structure associated with a
specific peak by placing the pointer on that peak.
To assign structures to spectra:
1. Open a spectral file.
2. Draw the structure (or structures) to assign to the spectrum.
3. Select specific atoms and bonds in the structure.
4. <Shift>+click the peak, or peaks, to which you want the structure assigned.
The selection rectangle surrounds the selected objects.
5. Navigate to Structure>Make Spectrum-Structure Assignment.
The selected atoms and bonds in the structure are associated with the selected spectral peaks.
Viewing Spectral Assignments
To view spectral assignments:
1. Click the Lasso or Marquee tool.
2. Place the pointer over a peak. The assigned atoms or bonds are highlighted.
Removing Spectral Assignments
To remove spectrum to structure assignments:
Chapter 11: Chemistry Features
175 of 315
ChemDraw 15.0
1. Click the Lasso or Marquee tool.
2. Select the objects from which to remove the assignment.
3. Navigate to Structure>Clear Spectrum-Structure.
Custom Shift Correction Data
You can add your own shift correction data for proton prediction to supplement the existing data that the ChemNMR
algorithm uses. You provide your data in an SDfile and use the file to update the ChemDraw ChemNMR database.
Using a third-party tool, such as ACD Labs software or Mnova Lite, you can enhance your prediction results, thereby
supporting your analysis process. With Mnova Lite, you can assign your spectra in Mnova NMR and save those
assignments to an SD file. Add them to ChemNMR database. With enough added data, the prediction results
improve. (Consult your application’s User Guide for instructions).
NMR Data Format
The correction data that you add to your SDF file must be in this format:
> <SHIFT>
<atom_id>,<shift_value>,<ignored>
For example:
> <SHIFT1>
2,9.61,0.0
> <SHIFT2>
3,8.92,0.0
The correction data for each molecule must appear after the molecule’s structural data. For example, if your SDF file
includes benzene, the NMR data must immediately follow the benzene structural data.
Updating the ChemNMR Database
Once you have an SDF file that contains the supplementary, follow these steps to update the ChemNMR database:
1. Exit ChemDraw.
2. Locate the ChemDraw ChemNMR directory.
3. Open a DOS prompt:
In Windows 8, navigate to Start>Run and enter cmd in the Run window. Click OK.
In Windows 7, go to Start and enter cmd in the search field. Press the <Enter> key.
4. At the DOS prompt, navigate to the ChemNMR directory in step 2.
5. Enter the command:
MakeChemNMRUserDB.exe <input file> <resource directory> <output directory>
where
<input file> is the full path and filename of the SDF file that contains the correction data.
<resource directory> and <output directory> are the full path to the ChemNMR directory.
6. Restart ChemDraw.
Restoring Default NMR Data
To stop using your own data and restore ChemDraw to its original settings:
Chapter 11: Chemistry Features
176 of 315
ChemDraw 15.0
1. Exit ChemDraw.
2. Locate the ChemNMR directory.
3. Delete the files Ushiftdb5H1.txt and Usimilvecx.h1.
4. Restart ChemDraw.
Example Supplementary Data
The example below represents an SDF file that includes supplementary NMR data for two structures. The supplementary data follows the structure data and is shaded gray for clarity.
ACD/Labs07190711112D
14 14 0 0 0 0 0 0 0 0 15 V2000
5.7578 -1.9992 0.0000 C 0 0 0 0 0 0 0 0 0 0 0 0
5.7578 -3.3267 0.0000 C 0 0 0 0 0 0 0 0 0 0 0 0
4.6062 -1.3275 0.0000 C 0 0 0 0 0 0 0 0 0 0 0 0
4.6062 -3.9825 0.0000 N 0 0 0 0 0 0 0 0 0 0 0 0
3.4547 -1.9992 0.0000 C 0 0 0 0 0 0 0 0 0 0 0 0
3.4547 -3.3267 0.0000 C 0 0 0 0 0 0 0 0 0 0 0 0
6.9094 -1.3275 0.0000 N 0 3 0 0 0 0 0 0 0 0 0 0
8.0609 -1.9992 0.0000 O 0 5 0 0 0 0 0 0 0 0 0 0
6.9094 -0.0000 0.0000 O 0 0 0 0 0 0 0 0 0 0 0 0
2.3031 -1.3275 0.0000 C 0 0 0 0 0 0 0 0 0 0 0 0
2.3031 -0.0000 0.0000 C 0 0 0 0 0 0 0 0 0 0 0 0
1.1516 -1.9992 0.0000 C 0 0 0 0 0 0 0 0 0 0 0 0
1.1516 -3.3267 0.0000 O 0 0 0 0 0 0 0 0 0 0 0 0
0.0000 -1.3275 0.0000 O 0 0 0 0 0 0 0 0 0 0 0 0
1210000
1320000
1710000
2420000
3510000
4610000
5620000
5 10 1 0 0 0 0
7810000
7920000
10 11 1 0 0 0 0
Chapter 11: Chemistry Features
177 of 315
ChemDraw 15.0
10 12 1 0 0 0 0
12 13 2 0 0 0 0
12 14 1 0 0 0 0
M ZZC 1 5
M ZZC 2 6
M ZZC 3 4
M ZZC 4 1
M ZZC 5 3
M ZZC 6 2
M CHG 2 7 1 8 -1
M ZZC 7 9
M ZZC 8 13
M ZZC 9 10
M ZZC 10 7
M ZZC 11 8
M ZZC 12 11
M ZZC 13 12
M END
> <ID>
1
> <solvent>d6-DMSO> <SHIFT1>2,9.61,0.0> <SHIFT2>3,8.92,0.0>
<SHIFT3>6,9.01,0.0> <SHIFT4>10,3.11,0.0> <SHIFT5>11,1.16,0.0>
<SHIFTS>5$$$$ TH> <solvent>d6-DMSO> <SHIFT1>2,9.6,0.0>
<SHIFT2>3,8.91,0.0> <SHIFT3>6,9.11,0.0> <SHIFT4>10,2.75,0.0>
<SHIFT5>11,1.17,0.0> <SHIFT6>12,2.41,0.0> <SHIFTS>6$$$$
ACD/Labs07190711112D 15 15 0 0 0 0 0 0 0 0 16 V2000 7.1683 -1.9521 0.0000 C 0 0 0 0
0 0 0 0 0 0 0 0 7.1683 -3.2484 0.0000 C 0 0 0 0 0 0 0 0 0 0 0 0 6.0438 -1.2962 0.0000 C
0 0 0 0 0 0 0 0 0 0 0 0 6.0438 -3.8887 0.0000 N 0 0 0 0 0 0 0 0 0 0 0 0 4.9194 -1.9521
0.0000 C 0 0 0 0 0 0 0 0 0 0 0 0 4.9194 -3.2484 0.0000 C 0 0 0 0 0 0 0 0 0 0 0 0 8.2927 1.2962 0.0000 N 0 3 0 0 0 0 0 0 0 0 0 0 9.4171 -1.9521 0.0000 O 0 5 0 0 0 0 0 0 0 0 0 0
8.2927 -0.0000 0.0000 O 0 0 0 0 0 0 0 0 0 0 0 0 3.7950 -1.2962 0.0000 C 0 0 0 0 0 0 0 0
0 0 0 0 3.7950 -0.0000 0.0000 C 0 0 0 0 0 0 0 0 0 0 0 0 2.2489 -2.1708 0.0000 C 0 0 0 0
0 0 0 0 0 0 0 0 1.1401 -1.5149 0.0000 C 0 0 0 0 0 0 0 0 0 0 0 0 0.0000 -2.1552 0.0000 O
0 0 0 0 0 0 0 0 0 0 0 0 1.1401 -0.2186 0.0000 O 0 0 0 0 0 0 0 0 0 0 0 0 1 2 1 0 0 0 0 1 3 2
0 0 0 0 1 7 1 0 0 0 0 2 4 2 0 0 0 0 3 5 1 0 0 0 0 4 6 1 0 0 0 0 5 6 2 0 0 0 0 5 10 1 0 0 0 0 7
8 1 0 0 0 0 7 9 2 0 0 0 0 10 11 1 0 0 0 0 10 12 1 0 0 0 0 12 13 1 0 0 0 0 13 14 2 0 0 0 0 13
15 1 0 0 0 0M ZZC 1 5M ZZC 2 6M ZZC 3 4M ZZC 4 1M ZZC 5 3M ZZC 6 2M CHG 2 7 1 8 1M ZZC 7 9M ZZC 8 14M ZZC 9 10M ZZC 10 7M ZZC 11 8M ZZC 12 11M ZZC 13 12M ZZC
14 13M END> <ID>2
> <solvent>d6-DMSO> <SHIFT1>2,9.6,0.0> <SHIFT2>3,8.91,0.0>
Chapter 11: Chemistry Features
178 of 315
ChemDraw 15.0
<SHIFT3>6,9.11,0.0> <SHIFT4>10,2.75,0.0> <SHIFT5>11,1.17,0.0>
<SHIFT6>12,2.41,0.0> <SHIFTS>6$$$$
ChemNMR Limitations
The program handles the following elements and isotopes:
H, D, He, Li, Be, B, C, N, O, F, Ne, Na, Mg, Al, Si, P, S, Cl, Ar, K, Ca, Sc, Ti, V, Cr, Mn, Fe, Co, Ni, Cu, Zn, Ga,
Ge, As, Se, Br, Kr, Rb, Sr, Y, Zr, Nb, Mo, Tc, Ru, Rh, Pd, Ag, Cd, In, Sn, Sb, Te, I, Xe, Cs, Ba, La, Ce, Pr, Nd,
Pm, Sm, Eu, Gd, Tb, Dy, Ho, Er, Tm, Yb, Lu, Hf, Ta, W, Re, Os, Ir, Pt, Au, Hg, Tl, Pb, Bi, Po, At, Rn, Fr, Ra, Ac,
Th, Pa, U, Nep, Pu, Am, Cm, Bk, Cf, Es, Fm, Md, No, Lr.
Functional groups are expanded automatically.
In the case of 1H NMR, it estimates shifts of about 90% of all CHx-groups with a standard deviation of 0.2.-0.3
ppm. The use of polar solvents may strongly increase these deviations. It does not estimate shifts of hydrogen
atoms bonded to heteroatoms because they are significantly affected by solvents, concentration, impurities, and
steric effects.
In case of 13C NMR, it estimates over 95% of the shifts with a mean deviation of -0.29 ppm and standard deviation
of 2.8 ppm.
NMR References
Sources for ChemDraw NMR data include the following publications:
Fürst, A.; Pretsch, E. Anal. Chim. Acta 1990, 229, 17.
Pretsch, E.; Fürst, A.; Badertscher M.; Bürgin, R.; Munk, M. E. J. Chem. Inf. Comp. Sci. 1992, 32, 291-295.
Bürgin Schaller, R.; Pretsch, E. Anal. Chim. Acta 1994, 290, 295.
Bürgin Schaller, R.; Arnold, C.; Pretsch, E. Anal. Chim. Acta 1995, 312, 95-105.
Bürgin Schaller, R.; Munk, M. E.; Pretsch, E. J. Chem. Inf. Comput. Sci.1996, 36, 239-243.
Chapter 11: Chemistry Features
179 of 315
ChemDraw 15.0
ChemDraw/Excel and CombiChem
ChemDraw/Excel is an add-in for MicrosoftExcel for Windows. You can add chemical structures and other data from
ChemDraw or a ChemFinder database to an Excel worksheet. Afterward, you can calculate any of a vast array of
structural properties or examine search results from an SDfile. It has the same search features as ChemFinder.
When you install the add-in, a ChemOffice menu is added to the Excel menu and a toolbar appears.
Setting Up ChemDraw/Excel
When you install ChemDraw, ChemDraw/Excel is also installed. The ChemDraw/Excel add-in adds a new tab to
Excel 2007, Excel 2010, Excel 2013 ribbon interface.
If the ChemDraw/Excel add-in is disabled, to enable it:
1. Go to File>Options>Add-ins.
2. Select ChemDraw for Excel and click Go.
3. From Add-Ins window make sure ChemDraw for Excel and ChemDrawExcel 15 functions are checked.
4. Click OK.
ChemDraw/Excel add-in may also be disabled by some other third-party product by programmatically changing
registry values. In this case, you can enable it by resetting the value of "LoadBehavior" at: HKEY_LOCAL_
MACHINE\SOFTWARE\Microsoft\Office\Excel\Addins\ChemDrawExcelAddIn15.ExcelAddIn and HKEY_LOCAL_
MACHINE\SOFTWARE\Wow6432Node\Microsoft\Office\Excel\Addins\ChemDrawExcelAddIn15.ExcelAddIn ( for
64-bit system running 32-bit Microsoft Office). Reset the value of ‘LoadBehavior’ to 3 from 0 and re-launch Excel.
To use ChemDraw/Excel, open a ChemOffice worksheet. Go to ChemOffice15>New ChemOffice Worksheet.
When a worksheet is active, ChemDraw/Excel appears in the title bar.
To convert a normal Excel worksheet into a ChemDraw/Excel worksheet, go to ChemOffice15 >Convert Worksheet. “ChemDraw for Excel” appears in the Excel title bar.
Older ChemDraw/Excel workbooks may be incompatible with the latest add-in. Therefore, you may need to upgrade
them. To upgrade, go to ChemOffice15>Upgrade Workbook.
Importing tables
ChemDraw/Excel lets you import from:
MDL SDFiles. Imports all records in the file. By default, the name of the structure is its chemical formula. However,
you can change the name by using Name Molecule command. MDL SDFiles are supported only in ChemDraw Professional and ChemDraw Prime only.
ChemFinder Databases(CFW, CFX). Imports all fields stored in the main form.
Chapter 12: ChemDraw/Excel and CombiChem
180 of 315
ChemDraw 15.0
Note: To import CFW files into Excel, save them with the “allow CAL/OLE Automation access” security setting
checked. See “Setting Security Options” in the ChemFinder user guide for details.
Note: Structures saved as ChemFinder XML files can be imported into Excel using the add-in.
When you import a table, structure data are transformed into structure drawings in the first column, and all other fields
are imported in separate columns.
To import a table:
1. In Excel, select the cell where you want the import to start. The upper-left corner of the import is at this cell. Data is
filled down and to the right.
2. Go to ChemOffice15>Import/Export>Import Table. The Import Table dialog box appears.
3. Type or select the file name to import and click Open. All records are added to your worksheet.
Note: A progress dialog displays the import progress. You can cancel the import process at any time by clicking
Cancel. On clicking Cancel, you will be prompted either keep the records which were imported, or cancel the
import process or continue with importing.
Note: You can only import a table into a new ChemOffice worksheet.
Importing hit lists
You can search records in ChemFinder and import the hit list structures with data into Excel using the Import
ChemFinder List command.
To import a hit list:
1. Go to ChemOffice15>Import/Export>Import ChemFinder List.
2. If you are prompted to start ChemFinder, click Yes.
3. In the message box, click Yes to import the hit list. The records are imported into Excel.
Exporting tables
ChemDraw/Excel lets you export tables to MDL SDFiles format. The first column of the area you select to export
must have the word “Structure” in its top cell. Structures outside the first column are discarded.
To export data:
1. Select the cells to export, including the cell that contains the word “Structure”.
Note: You can export selected rows and columns from a structure table. Ensure that the cell selection is continuous.
See examples below.
Chapter 12: ChemDraw/Excel and CombiChem
181 of 315
ChemDraw 15.0
2. Go to ChemOffice15>Import/Export>Export Table.
3. In the Save Table To dialog box, type the file name and click Save. The status bar displays the progress.
Synchronizing Tables
You can synchronize a table in your worksheet with a ChemFinder database, for example, a .CFX file. On synchronizing a ChemDraw/table with a ChemFinder table, fields (and their data) in the ChemFinder table that are not in
the MS Excel table are added to the MS Excel table.
Note: Changes you make in MS Excel do not affect the table in ChemFinder.
To synchronize a table:
1. Select the table.
2. Go to ChemOffice15>Sync Table with ChemFinder DB.
3. Select the ChemFinder table and click Open.
4. Select the fields to be used for matching a worksheet row with the database record and click OK.
5. Select the fields to be updated. To select multiple fields, press <Ctrl> + click each field. Selecting fields marked
‘New’ will add a column to your worksheet.
6. Click OK.
Chapter 12: ChemDraw/Excel and CombiChem
182 of 315
ChemDraw 15.0
Adding structures
You can add chemical structures to a worksheet from any file format that ChemDraw supports. ChemDraw/Excel
assigns the chemical formula as structure name which can be changed by using the Name Molecule command.
The simplest way to insert a new structure in a cell is by double-clicking a cell.
1. Create a ChemOffice worksheet.
2. Double-click in a cell. ChemDraw/Excel displays a dialog asking you if you want to add a structure to the cell.
3. Click Yes. ChemDraw opens.
4. Draw a structure and go to File>Close or press <Ctrl>+<W> to return to ChemDraw/Excel. Structure appears on
the worksheet.
Note: Double-clicking a structure (or cell containing a structure) on a worksheet will start structure editing in
ChemDraw.
Adding a structure from a file
1. In Excel, select the cell into which you want to add the structure.
2. Go to ChemOffice15>Molecule>Load. The Choose Molecule To Load dialog box appears.
3. Type or select the file name of the structure and click Open.
The following formats are supported:
ChemDraw (*.cdx)
MDL Rxn (*.rxn)
ChemDraw XML (*.cdxml)
MDL Graphic (*.tgf)
ChemDraw 3.5 (*.chm)
Connection Table (*.ct)
Chem3D XML (*.c3xml)
MSI Molfile (*.msm)
MDL Molfile (*.mol)
SMD 4.2 (*.smd)
MDL Sketch (*.skc)
SMILES strings
You can insert SMILES strings into cells and convert them to structures.
1. Type or paste the SMILES strings into one or more cells.
2. Select the cells to convert.
3. Go to ChemOffice15>Convert>SMILES to Molecule. Alternatively, you can use the context menu command to
convert SMILES to molecule. If the cell does not contain a valid SMILES string, a warning indicating that the number of SMILES strings that cannot be converted appears.
Inchi strings
You can insert Inchi strings into cells and convert them to structures.
1. Type or paste the Inchi strings into one or more cells.
2. Select the cells to convert.
Chapter 12: ChemDraw/Excel and CombiChem
183 of 315
ChemDraw 15.0
3. Go to ChemOffice15>Convert>Inchi to Molecule. If the cell does not contain a valid Inchi string, an error message appears.
Adding structures by name
You can type or paste chemical names into cells and convert the names to structures.
1. Enter the names into cells.
2. Select the cells to convert.
Tip: You can also convert names generated from Excel formulas.
3. Select ChemOffice15>Convert>Name To Molecule. If the cell contains a name that Name=Struct supports, the
structure appears with the given name as the name of the cell.
Saving structures
You can save a chemical structure to a separate file.
1. In the worksheet, select the cell containing the structure.
2. Go to ChemOffice15>Molecule>Save. The Save to File dialog box appears.
3. Select an existing file or enter a new file name and click Save.
The following formats are supported:
ChemDraw (*.cdx)
Connection Table (*.ct)
ChemDraw XML (*.cdxml)
MSI Molfile (*.msm)
ChemDraw 3.5 (*.chm)
SMD 4.2 (*.smd)
Chem3D XML (*.c3xml)
Metafile (*.wmf)
MDL Molfile (*.mol)
GIF (*.gif)
MDL Sketch (*.skc)
TIFF (*.tif)
MDL Rxn (*.rxn)
PNG (*.png)
MDL Graphic (*.tgf)
Bitmap (*.bmp)
PostScript (*.eps)
Searching
You can search for structures based on the criteria and search function you use. ChemDraw/Excel offers three basic
search functions:
Normal search
Similarity search
R-Group analysis
Opening a database
Before searching, you must open a structure database.
Chapter 12: ChemDraw/Excel and CombiChem
184 of 315
ChemDraw 15.0
1. In Excel, go to ChemOffice15>New ChemOffice Worksheet.
2. Go to ChemOffice15>Import/Export>Import Table or Import ChemFinder list and select the file to import.
Normal searches
Use a normal search to find full structures and substructures that match the one you define in the search dialog box.
1. Select a cell containing the label Structure.
2. Go to ChemOffice15>Search>Normal. The ChemDraw for Excel dialog box appears.
3. Select the Search Tab.
4. Click in the empty window and draw the structure for which you want to search.
5. Select the Normal tab at the bottom of the dialog box.
6. For Search Type, select either Full Structure or SubStructure.
7. For Filter Type, select to either include or exclude hits.
8. Enter a formula query.
9. Click Search. The hit list is displayed in a column named Match. Items matching the search criteria are labeled as
TRUE.
Similarity searches
Perform a similarity search to find structures with features corresponding to a structure of your choosing. For more
information about similarity searching, see the ChemFinder User’s Guide.
To search for similarity:
1. Select a cell containing the label Structure.
2. Go to ChemOffice15>Search>Similarity. The ChemDraw for Excel dialog box appears.
3. Select the Search Tab.
4. Click in the empty window and draw the structure for which you want to search.
5. Select the Similarity tab.
6. For Search Type, select either Full Structure or Sub Structure.
7. Select the Sort Results order.
8. Select the Similarity Percent value.
9. Click Search. The hit list is displayed in a column named Similarity. Items matching the search criteria are labeled
as TRUE.
R-Group analysis
An R-group analysis returns all molecules in the query database that include a template structure that you provide. For
example, assume you want to find all molecules that include toluene in its structure, such as p-cresol or o-xylene
(assuming your database includes these molecules). Simply draw toluene as your template and the analysis will
return all molecules that contain at least one toluene structure.
Chapter 12: ChemDraw/Excel and CombiChem
185 of 315
ChemDraw 15.0
To illustrate, assume that you have a small database comprising of four molecules: o-, m-, and p-cresol, and bromobenzene. Further assume you want to run an R-group analysis on this database to find all molecules that contain
toluene in its structure. You will find that the results include three main parts:
The list of molecules that contain the toluene template. In this example, the results include o-, m-, and p-cresol. Bromobenzene is not included because it does not contain the template.
The toluene template with all variations of R-group attachments that were found in the database. In this example,
the attachments are represented by functional groups. These are the locations of the R-groups found in the analysis
results; the hydroxyl groups for o-, m-, and p-cresol.
The functional group found at each Rn position for each search result. For a given returned molecule, look across
its row to view the functional group at each R-group position. In this example, the search results consist of a hydrogen and hydroxyl group for R1, R2, and R3.
Working with Structures
ChemDraw/Excel lets you rename structures and use the clipboard to cut, copy, and paste structures.
Renaming Structures
Excel recognizes certain characters as formulas. To prevent the system from interpreting a chemical structure name
as an Excel formula, you can rename the structure.
To rename a structure:
1. Select the structure.
2. Go to ChemOffice15>Molecule>Name. If multiple cells are selected, go to ChemOffice15>Molecule>Name All
Selected. The Name Molecule dialog box appears.
Chapter 12: ChemDraw/Excel and CombiChem
186 of 315
ChemDraw 15.0
Note: You can remove a structure name by clicking Clear. If you select Use Default , the name of the structure will be
replaced by the default name i.e. Chemical Formula.
3. Type the name and click OK.
Using the Clipboard
You can cut, copy, and paste structures using the clipboard. The Copy As command in ChemDraw/Excel lets you
copy a structure as InChI, InChIkey, or SMILES string.
To cut a structure from a cell:
1. Select the structure.
2. Go to ChemOffice15>Molecule>Cut. The structure is placed on the clipboard. When you select Paste, the structure will be removed from the cell and pasted in the specified cell.
To copy a structure from a cell:
1. Select the structure.
2. Go to ChemOffice15>Molecule>Copy.
The structure remains in the cell and a copy is placed on the clipboard.
To copy a structure as InChI, InChIkey, or SMILES:
1. Select the structure.
2. Go to ChemOffice15>Molecule>Copy As and select from these options:
InChI
InChIKey
SMILES
The structure remains in the cell and a copy in the desired string format is placed on the clipboard.
To paste a structure in a cell:
1. Select the cell where you want to paste the structure.
2. Go to ChemOffice15>Molecule>Paste. The structure is pasted from the clipboard.
Chapter 12: ChemDraw/Excel and CombiChem
187 of 315
ChemDraw 15.0
Displaying Structures
You can display or hide structures in your spreadsheet. You can also adjust the size of cells to display their entire contents.
To show or hide structures:
1. Select the structures.
2. Select ChemOffice15>Structure>Show or Hide.
Aligning Structures
A structure may be too big for its cell or be improperly positioned.
To align structures, select the cell that contains the structure and go to ChemOffice15>Structure>Align. The cells
adjust to display their contents.
Resizing Structures
1. Select the cell(s) whose structure(s) you want to resize.
2. Go to ChemOffice15>Structure>Resize. Resize handles appear on the selected structures.
3. Click-drag the resize handles to resize a structure. Any changes you make to a picture is proportionately reflected
in the other structures.
4. To end resizing, click a cell and the structures are deselected.
By default, the structure’s resize property is set to ‘Move and Resize with cells’ to avoid bunched up structures.
To change the resize property or to allow structure ovelapping(Excel 2007):
1. Select the cells whose structures you want to resize.
2. Go to ChemOffice15>Structure>Resize. Resize handles appear on the selected structures.
3. Right-click and select Size and Properties from the context menu.
4. Click on the Properties tab.
5. Select Don’t move or size with cells.
6. Click Close.
ChemDraw/Excel Functions
ChemDraw/Excel supplies a library of functions that return chemical properties of structures in a ChemDraw/Excel
worksheet.
To insert a ChemDraw/Excel function into your worksheet:
1. Select the target cell.
2. Go to ChemOffice15>ChemDraw Functions (Options>ChemDraw Functions in Excel 2010). The ChemDraw
for Excel dialog box appears.
3. Double-click the function you want to insert from the list available in the Functions tab. A Functions Argument dialog box appears.
4. Select the structure.
Chapter 12: ChemDraw/Excel and CombiChem
188 of 315
ChemDraw 15.0
5. Click OK.
Each property is calculated using the “best available” method. If the cell reference argument does not point to a valid
structure cell, #N/A appears in the cell.
All ChemDraw/Excel functions are described below.
Chemical name
Displays systematic names for chemical structures with support for the Cahn-Ingold-Prelog rules for stereochemistry.
Function
CFW_CHEMICAL_NAME(cell ref)
Example
In cell: =CFW_CHEMICAL_NAME(A2)
Result: 1-(2,3-dihydro-1H-inden-2-yl)propan-2-one
Note: Some PerkinElmer Informatics product packages and levels allow unlimited structure-to-name conversions, while others impose a daily limit.
Chemical composition
When this function is called with just a cell reference, it displays the elemental percent by weight for all elements in
the structure. When this function is called with a cell reference and an atomic symbol, it displays the fraction by
weight of the given element in the structure.
Functions
CHEM_COMPOSITION(cell ref)
CHEM_COMPOSITION(cell ref, atomic symbol)
Examples
In cell: =CHEM_COMPOSITION(A2)
Result: C,82.72;H,8.10;O,9.18
In cell: =CHEM_COMPOSITION(A2, "C")
Result: 0.827188133
Chemical formula
Displays the chemical formula for the structure(s) in the cell.
Functions
CHEM_FORMULA(cell ref)
CHEMPROPSTD_MOL_FORMULA(cell ref)
Examples
In cell: =CHEM_FORMULA(A2)
Result: C12H14O
In cell: =CHEMPROPSTD_MOL_FORMULA(A2)
Chapter 12: ChemDraw/Excel and CombiChem
189 of 315
ChemDraw 15.0
Result: C12H14O
Molecular weight
Displays the average molecular mass of the structure, where atomic masses are based on the weighted average of all
isotope masses for the element.
Units
atomic mass units
Functions
CHEM_MOLWEIGHT(cell ref)
CHEMPROPSTD_MOL_WEIGHT(cell ref)
CHEMPROPSTD_MASS(cell ref)
Examples
In cell: =CHEM_MOLWEIGHT(A2)
Result: 174.23896
In cell: =CHEMPROPSTD_MOL_WEIGHT(A2)
Result: 174.238960
In cell: =CHEMPROPSTD_MASS(A2)
Result: 174.238960
Exact mass
Displays the exact molecular mass of the molecule, where atomic masses of each atom are based on the most common isotope for the element.
Units
g/mole
Function
CHEMPROPSTD_EXACT_MASS(cell ref)
Example
In cell: =CHEMPROPSTD_EXACT_MASS(A2)
Result: 174.104465
Number of atoms
When this function is called with just a cell reference, it displays the total number of atoms in the structure. When this
function is called with a cell reference and an atomic symbol, it displays the number of atoms of the given element in
the structure.
Functions
CHEM_NUM_ATOMS(cell ref)
CHEM_NUM_ATOMS(cell ref, atomic symbol)
Chapter 12: ChemDraw/Excel and CombiChem
190 of 315
ChemDraw 15.0
Examples
In cell: =CHEM_NUM_ATOMS(A2)
Result: 27
In cell: =CHEM_NUM_ATOMS(A2, "C")
Result: 12
Number of hydrogen-bond acceptors
Displays the number of hydrogen-bond acceptors based on topology.
Function
CHEM_NUM_HBACCEPTORS(cell ref)
Example
In cell: =CHEM_NUM_HBACCEPTORS(A2)
Result: 1
Number of hydrogen-bond donors
Displays the number of hydrogen-bond donors based on topology.
Function
CHEM_NUM_HBDONORS(cell ref)
Example
In cell: =CHEM_NUM_HBDONORS(A2)
Result: 0
SMILES string
Displays the SMILES string for the structure.
Function
CHEM_SMILES(cell ref)
Example
In cell: =CHEM_SMILES(A2)
Result: O=C(C)CC(C1)Cc2c1cccc2
Formal charge
Displays the net charge on the molecule.
Function
CHEMPROPSTD_FORMAL_CHARGE(cell ref)
Example
In cell: =CHEMPROPSTD_FORMAL_CHARGE(A2
Result: -1
Chapter 12: ChemDraw/Excel and CombiChem
191 of 315
ChemDraw 15.0
Does cell have a structure drawing?
Returns TRUE if the cell has a ChemOffice/Excel structure drawing or reaction drawings, returns FALSE otherwise.
Function
ISSTRUCTURE(cell ref)
Example
In cell: =ISSTRUCTURE(A2)
Result: False
Does cell have reaction drawing?
Returns TRUE if the cell contains a drawing of a reaction.
Function
ISREACTION(cell ref)
Example
In cell: =ISREACTION(A2
Result: True
Boiling point
The boiling point for the molecule at 1 atm.
Units
Kelvin
Function
CHEMPROPPRO_BOILING_POINT(cell ref)
Example
In cell: =CHEMPROPPRO_BOILING_POINT(A2)
Result: 540.059
Melting/freezing point
The melting/freezing point for the structure at 1 atm.
Units
Kelvin
Function
CHEMPROPPRO_MELTING_POINT(cell ref)
Example
In cell: =CHEMPROPPRO_MELTING_POINT(A2)
Result: 331.31
Chapter 12: ChemDraw/Excel and CombiChem
192 of 315
ChemDraw 15.0
Vapor pressure
The vapor pressure for the structure at 25° C.
Units
Pa
Function
CHEMPROPPRO_VAPOR_PRESSURE(cell ref)
Example
In cell: =CHEMPROPPRO_VAPOR_PRESSURE(A2)
Result: 47.57999897
Critical pressure
The minimum pressure that must be applied to liquefy the structure at the critical temperature.
Units
bar
Function
CHEMPROPPRO_CRITICAL_PRESSURE(cell ref)
Example
In cell: =CHEMPROPPRO_CRITICAL_PRESSURE(A2)
Result: 49.804
Critical temperature
The temperature above which the gas form of the structure cannot be liquefied, no matter the applied pressure.
Units
Kelvin
Function
CHEMPROPPRO_CRITICAL_TEMPERATURE(cell ref)
Examples
In cell: =CHEMPROPPRO_CRITICAL_TEMPERATURE(A2)
Result: 615.351
Critical volume
The volume occupied at the compound's critical temperature and pressure.
Units
cm3/mole
Function
CHEMPROPPRO_CRITICAL_VOLUME(cell ref)
Chapter 12: ChemDraw/Excel and CombiChem
193 of 315
ChemDraw 15.0
Example
In cell: =CHEMPROPPRO_CRITICAL_VOLUME(A2)
Result: 562.5
Gibbs free energy
The Gibbs free energy for the structure at 298.15 K and 1 atm.
Units
kJ/mole
Function
CHEMPROPPRO_GIBBS_FREE_ENERGY(cell ref)
Example
In cell: =CHEMPROPPRO_GIBBS_FREE_ENERGY(A2)
Result: 84.77
Heat of formation
The heat of formation for the structure at 298.15 K and 1 atm.
Units
kcals/mole
Function
CHEMPROPPRO_HEAT_OF_FORMATION(cell ref)
Examples
In cell: =CHEMPROPPRO_HEAT_OF_FORMATION(A2)
Result: -105.73
Ideal gas thermal capacity
The constant pressure (1 atm) molar heat capacity at 298.15 K for an ideal gas compound.
Units
J/[mole K]
Function
CHEMPROPPRO_IDEAL_GAS_THERMAL_CAPACITY(cell ref)
Example
In cell: =CHEMPROPPRO_IDEAL_GAS_THERMAL_CAPACITY(A2)
Result: 201.036
LogP
The logarithm of the partition coefficient for n-octanol/water.
Chapter 12: ChemDraw/Excel and CombiChem
194 of 315
ChemDraw 15.0
Functions
CHEMPROPPRO_LOGP(cell ref)
CLOGP_DRIVER_PARTITION_COEFFICIENT(cell ref)
Examples
In cell: =CHEMPROPPRO_LOGP(A2)
Result: 2.233
In cell: =CLOGP_DRIVER_PARTITION_COEFFICIENT(A2)
Result: 2.243
Molar refractivity
The molar refraction index.
Units
cm3/mole
Functions
CHEMPROPPRO_MOL_REFRACTIVITY(cell ref)
CLOGP_DRIVER_MOL_REFRACTIVITY(cell ref)
Examples
In cell: =CHEMPROPPRO_MOL_REFRACTIVITY(A2)
Result: 53.305
In cell: =CLOGP_DRIVER_MOL_REFRACTIVITY(A2)
Result: 5.3297
Water solubility
Prediction of the water solubility of the structure at 25° C.
Units
mg/L
Function
CHEMPROPPRO_WATER_SOLUBILITY(cell ref)
Example
In cell: =CHEMPROPPRO_WATER_SOLUBILITY(A2)
Result: 0
Connolly solvent accessible surface area
The locus of the center of a spherical probe (representing the solvent) as it is rolled over the molecular model.
Units
Angstroms2
Chapter 12: ChemDraw/Excel and CombiChem
195 of 315
ChemDraw 15.0
Function
CHEMPROPSTD_CONNOLLY_ACCESSIBLE_AREA(cell ref)
Example
In cell: =CHEMPROPSTD_CONNOLLY_ACCESSIBLE_AREA(A2)
Result: 428.557
Note: The default probe radius used in the calculations is 1.4 angstroms.
Connolly molecular surface area
The contact surface created when a spherical probe (representing the solvent) is rolled over the molecular model.
Units
Angstroms2
Function
CHEMPROPSTD_CONNOLLY_MOLECULAR_AREA(cell ref)
Example
In cell: =CHEMPROPSTD_CONNOLLY_MOLECULAR_AREA(A2)
Result: 212.294
Note: The default probe radius used in the calculations is 1.4 angstroms.
Note: The surface area calculation is performed with Michael Connolly's program for computing molecular surface
areas and volume (M.L. Connolly. The Molecular Surface Package. J. Mol. Graphics 1993, 11).
Connolly solvent-excluded volume
The volume contained within the contact molecular surface.
Units
Angstroms3
Function
CHEMPROPSTD_CONNOLLY_SOLVENT_EXCLUDED_VOLUME(cell ref)
Example
In cell: =CHEMPROPSTD_CONNOLLY_SOLVENT_EXCLUDED_VOLUME(A2)
Result: 170.277
Note: The volume calculation is performed with Michael Connolly's program for computing molecular surface
areas and volume (M.L. Connolly. The Molecular Surface Package. J. Mol. Graphics 1993, 11).
Ovality
The ratio of the molecular surface area to the minimum surface area. The minimum surface area is the surface area of
a sphere having a value equal to the solvent-excluded volume of the molecule. Computed from the Connolly Molecular
Surface Area and Solvent-Excluded Volume properties.
Chapter 12: ChemDraw/Excel and CombiChem
196 of 315
ChemDraw 15.0
Function
CHEMPROPSTD_OVALITY(cell ref)
Example
In cell: =CHEMPROPSTD_OVALITY(A2)
Result: 1.428947
Principal moments of Inertia (X, Y, Z)
The moments of inertia when the Cartesian coordinate axes are the principal axes of the molecule.
Units
grams/mole angstroms2
Function
CHEMPROPSTD_PRINCIPAL_MOMENT(cell ref)
Example
In cell: =CHEMPROPSTD_PRINCIPAL_MOMENT(A2)
Result: 249.546 1409.279 1658.824
Balaban index
Function
MOLECULAR_TOPOLOGY_BALABAN_INDEX(cell ref)
Example
In cell: =MOLECULAR_TOPOLOGY_BALABAN_INDEX(A2)
Result: 29909
Cluster count
Function
MOLECULAR_TOPOLOGY_CLUSTER_COUNT(cell ref)
Example
In cell: =MOLECULAR_TOPOLOGY_CLUSTER_COUNT(A2)
Result: 13
Topological index
Function
MOLECULAR_TOPOLOGY_MOLECULAR_TOPOLOGICAL_INDEX(cell ref)
Example
In cell: =MOLECULAR_TOPOLOGY_MOLECULAR_TOPOLOGICAL_INDEX(A2)
Result: 1998
Chapter 12: ChemDraw/Excel and CombiChem
197 of 315
ChemDraw 15.0
Number of rotatable bonds
Function
MOLECULAR_TOPOLOGY_NUM_ROTATABLE_BONDS(cell ref)
Example
In cell: =MOLECULAR_TOPOLOGY_NUM_ROTATABLE_BONDS(A2)
Result: 2
Polar surface area
Function
MOLECULAR_TOPOLOGY_POLAR_SURFACE_AREA(cell ref)
Example
In cell: =MOLECULAR_TOPOLOGY_POLAR_SURFACE_AREA(A2)
Result: 17.07
Radius
Function
MOLECULAR_TOPOLOGY_RADIUS(cell ref)
Example
In cell: =MOLECULAR_TOPOLOGY_RADIUS(A2)
Result: 4
Shape attribute
Function
MOLECULAR_TOPOLOGY_SHAPE_ATTRIBUTE(cell ref)
Example
In cell: =MOLECULAR_TOPOLOGY_SHAPE_ATTRIBUTE(A2)
Result: 11.076923
Shape coefficient
Function
MOLECULAR_TOPOLOGY_SHAPE_COEFFICIENT(cell ref)
Example
In cell: =MOLECULAR_TOPOLOGY_SHAPE_COEFFICIENT(A2)
Result: 0
Chapter 12: ChemDraw/Excel and CombiChem
198 of 315
ChemDraw 15.0
Sum of degrees
Function
MOLECULAR_TOPOLOGY_SUM_OF_DEGREES(cell ref)
Example
In cell: =MOLECULAR_TOPOLOGY_SUM_OF_DEGREES(A2)
Result: 28
Sum of valence degrees
Function
MOLECULAR_TOPOLOGY_SUM_OF_VALENCE_DEGREES(cell ref)
Example
In cell: =MOLECULAR_TOPOLOGY_SUM_OF_VALENCE_DEGREES(A2)
Result: 40
Topological diameter
Function
MOLECULAR_TOPOLOGY_TOPOLOGICAL_DIAMETER(cell ref)
Example
In cell: =MOLECULAR_TOPOLOGY_TOPOLOGICAL_DIAMETER(A2)
Result: 7
Total connectivity
Function
MOLECULAR_TOPOLOGY_TOTAL_CONNECTIVITY(cell ref)
Example
In cell: =MOLECULAR_TOPOLOGY_TOTAL_CONNECTIVITY(A2)
Result: 0.009821
Total valence connectivity
Function
MOLECULAR_TOPOLOGY_TOTAL_VALENCE_CONNECTIVITY(cell ref)
Example
In cell: =MOLECULAR_TOPOLOGY_TOTAL_VALENCE_CONNECTIVITY(A2)
Result: 0.001157
Chapter 12: ChemDraw/Excel and CombiChem
199 of 315
ChemDraw 15.0
Wiener index
Function
MOLECULAR_TOPOLOGY_WIENER_INDEX(cell ref)
Example
In cell: =MOLECULAR_TOPOLOGY_WIENER_INDEX(A2)
Result: 249
MOLECULAR_NETWORKS_LOGP
The partition coefficient is a ratio of concentrations of un-ionized compound between two solutions. The logarithm of
the ratio of the concentrations of the un-ionized solute in the solvents is called LogP.
Function
MOLECULAR_NETWORKS_LOGP(cell ref)
Example
In cell: =MOLECULAR_NETWORKS_LOGP(A4)
Result: 3.019
MOLECULAR_NETWORKS_LOGS
MOLECULAR_NETWORKS_LogS determines the solubility of a substance, measured in mol/liter.
Function
MOLECULAR_NETWORKS_LOGS(cell ref)
Example
In cell: =MOLECULAR_NETWORKS_LOGS(A4)
Result:-2.029
MOLECULAR_NETWORKS_PKa
MOLECULAR_NETWORKS_PKa is the negative log of the acid dissociation constant Ka. It describes the tendency
of compounds or ions to dissociate in solution.
Function
MOLECULAR_NETWORKS_PKa(cell ref)
Example
In cell: =MOLECULAR_NETWORKS_PKa(A4)
Result: 14.834000
Predicting druglikeness
Using ChemDraw/Excel functions, you can create calculators to determine the druglikneness of a structure. You can
calculate values for: the Lipinski rule of five, Ghose, and Congreve rule of three:
Chapter 12: ChemDraw/Excel and CombiChem
200 of 315
ChemDraw 15.0
1. The Lipinski rule of five.
2. The Ghose modifications
3. The Congreve Rule-of-Three.
Lipinski rule of five
The Lipinski rule uses five criteria to determine whether a substance is druglike. The substance must have:
Five or fewer H-bond donors.
Ten or fewer H-bond acceptors.
A molecular weight under 500 daltons.
LogP lower than 5.
Fewer than two violations of the above four rules.
To determine whether the substance meets the Lipinski rule requirement:
1. Calculate the value of each of these functions:
CHEM.NUM.HBDONORS()
CHEM.NUM.HBACCEPTORS()
CHEM.MOLWEIGHT()
CHEMPROPPRO.LOGP()
2. Verify that the value returned by the functions meets the lipinski rule criteria. For example, if the
CHEM.MOLWEIGHT() returns a value <500, it satisfies lipinsky’s third criteria.
3. Calculate the number of criteria satisfied. If the number of violations is less than two, the Lipinsky rule is satisfied.
Ghose modifications
The Ghose modifications use these criterias:
Atom count between 20 and 70.
Molar refractivity between 40 and 130.
A molecular weight between 160 and 480 daltons.
LogP in the range -0.4 to +5.6.
Fewer than two violations of the above four rules.
To determine whether the substance meets the Ghose modification requirement:
1. Calculate the value of each of these functions:
CHEM.NUM.ATOMS()
CHEMPROPPRO.MOL.REFRACTIVITY()
CHEM.MOLWEIGHT()
CHEMPROPPRO.LOGP()
Chapter 12: ChemDraw/Excel and CombiChem
201 of 315
ChemDraw 15.0
2. Verify that the value returned by the functions meets the Ghose modification criteria. For example, if the value
returned by the function CHEMPROPPRO.LOGP() for that structure is within the range -0.4 to +5.6, it satisfies
Ghose modification’s fourth criteria.
3. Calculate the number of criteria satisfied. If the number of violations is less than two, then the Ghose modifications
requirement is satisfied.
Congreve rule of three
The "Congreve Rule of Three" uses these criterias:
Three or fewer H-bond donors.
Three or fewer H-bond acceptors.
A molecular weight under 300 daltons.
LogP lower than 3.
Fewer than two violations of the above four rules.
To determine if the substance meets the Congreve Rule-of-Three requirement:
1. Calculate the value of each of these functions:
CHEM.NUM.HBDONORS()
CHEM.NUM.HBACCEPTORS()
CHEM.MOLWEIGHT()
CHEMPROPPRO.LOGP()
2. Verify that the value returned by the functions meets the Congreve Rule-of-Three criteria. For example, if the if the
function CHEMPROPPRO.LOGP() returns a value for the structure that is <3, it satisfies Congreve Rule-ofThree’s fourth criteria.
3. Calculate the number of criteria satisfied. If the number of violations is less than two, then the Congreve Rule-ofThree is satisfied.
Chemical Properties
Chemical property prediction is an important feature that ChemOffice applications support. It enables you to calculate
values for a wide range of methodologies; for example, topological descriptors such as the Weiner index and Balaban
index, thermodynamic descriptors such as solubility, melting and boiling points, and partition coefficients such as
CLogP, properties related to the three-dimensional shape and volume of a chemical such as the Connolly surface area
and volume. In total you can calculate more than 100 chemical properties for a given structure.
For a list of properties available in any specific applications, click the respective link below. For more information on
the properties available in any specific applications, see the respective online help available or visit the PerkinElmer
Informatics Web site.
"Property predictions in ChemDraw/Excel" on page 203.
"Property Predictions in ChemDraw" on page 158.
"Property Predictions in Chem3D" on page 163.
Chapter 12: ChemDraw/Excel and CombiChem
202 of 315
ChemDraw 15.0
Property predictions in ChemDraw/Excel
ChemDraw/Excel includes a variety of functions for reporting properties for a given structure. Each property is calculated using the “best available” method.
To view the properties for a given structure:
1. Select the structure cell.
2. Right-click the cell and select Structure>Properties from the context-menu.The Properties dialog box displaying
various properties and its values appears.
The properties include:
MOLECULAR_NETWORKS_
B
F
Balaban index
Formal charge
Boiling point
Freezing point
MOLECULAR_NETWORKS_PKa
Shape coefficient
C
G
Molecular formula
Sum Of degrees
Cluster count
Gibbs free energy
Molecular weight
Sum of valence degrees
Connolly accessible area
H
N
T
Connolly molecular surface area
Heat of formation
Num rotatable bonds
Topological diameter
Henry’s Law constant
O
Total connectivity
Connolly solvent excluded volume
I
Ovality
Critical pressure
Ideal gas thermal capacity
P
V
Critical temperature
M
Polar surface area
Vapor pressure
Critical volume
Mass
Principal moment Of inertia
W
E
Melting point
R
Water solubility
Exact mass
Molar refractivity
Radius
Wiener index
Connolly solvent accessible surface area
LOGP
MOLECULAR_NETWORKS_
LOGS
S
Shape attribute
Total Valence Connectivity
About molecular networks
*MOSES.pKa, MOSES.logS and MOSES.logP for predicting acid dissociation constants, aqueoues solubility and
octanol/water distribution coefficients of chemical compounds are computational calculator modules based on
Molecular Networks' chemoinformatics platform MOSES. MOSES is developed, maintained and owned by Molecular
Networks GmbH, Erlangen, Germany. For further information please visit www.molecular-networks.com/moses. All
rights reserved. Molecular Networks GmbH, Erlangen, Germany (www.molecular-networks.com).
Balaban index
Chapter 12: ChemDraw/Excel and CombiChem
203 of 315
ChemDraw 15.0
Where:
q is the number of edges in the molecular graph.
= (q-n+1) is the cyclomatic number of molecular graph.
n is the number of atoms in the molecular graph.
Si is the sum of all entries in the ith row (or column) of the topological distance matrix of the molecule. The distance
matrix stores the shortest path between all pairs of atoms.
Boiling point
The boiling point is report in Kelvin.
A solution boils at a slightly higher temperature than the pure solvent. The change in boiling point is calculated using
the formula:
Where Kb is the molal boiling point constant, m is the concentration of the solute expressed as molality, and ∆Tb is the
change in temperature.
Cluster count
Is the number of paths of a given length in the distance matrix.
Connolly accessible area
This is the locus of the center of a spherical probe (representing the solvent) as it is rolled over the molecular model.
Connolly molecular surface area
The contact surface created when a spherical probe (representing the solvent) is rolled over the molecular model.
Units Angstroms2.
Connolly solvent accessible surface area
The locus of the center of a spherical probe (representing the solvent) as it is rolled over the molecular model. Units
Angstroms2.
Connolly solvent excluded volume
This is the volume of space bounded by the solvent accessible molecular surface.
Chapter 12: ChemDraw/Excel and CombiChem
204 of 315
ChemDraw 15.0
Critical pressure
Reported in bars, this is the least applied pressure required at the critical temperature to liquefy a gas.
Critical temperature
Reported in Kelvin, this is the temperature above which a gas cannot be liquefied, regardless of the pressure applied.
Critical volume
Reported in cm3/mol, this is the volume occupied by one mole of a substance at the critical temperature and pressure.
Exact mass
This is the sum of the masses of the individual isotopes in the molecule. For example, the exact mass of water containing two hydrogen-1 (1H) and one oxygen-16 (16O) is 1.0078 + 1.0078 + 15.9994 = 18.0106. The exact mass of
heavy water, containing two hydrogen-2 (deuterium or 2H) and one oxygen-16 (16O) is 2.014 + 2.014 + 15.9994 =
20.027.
Formal charge
This is the charge assigned to an atom in a molecule, assuming that electrons in a chemical bond are shared equally
between atoms, regardless of relative electronegativity.
The formal charge of any atom in a molecule can be calculated using the formula:
FC=V-N-B/2
Where ‘V’ is the number of valence electrons of the atom in isolation (atom in ground state); ‘N’ is the number of nonbonding electrons on this atom in the molecule; and ‘B’ is the total number of electrons shared in covalent bonds with
other atoms in the molecule.
Freezing point
The freezing point for the structure at 1 atm. Units Kelvin.
Gibbs free energy
Reported in KJ/mole, Gibbs free energy is defined as:
which is same as:
Chapter 12: ChemDraw/Excel and CombiChem
205 of 315
ChemDraw 15.0
Where:
U is the internal energy (SI unit: Joule)
p is pressure (SI unit: Pascal)
V is volume (SI unit: m3)
T is the temperature (SI unit: Kelvin)
S is the entropy (SI unit: joule per Kelvin)
H is the enthalpy (SI unit: Joule)
Note: H and S are thermodynamic values found at standard temperature and pressure..
Heat of formation
Reported in KJ/mole, the heat of formation is the increase in enthalpy resulting from the formation of one mole of a substance from its constituent elements at constant pressure.
Henry’s Law constant
A unitless value, Henry's Law Constant can be expressed as:
Where ‘p’ is the partial pressure of the solute in the gas above the solution, ‘c’ is the concentration of the solute and
‘kH,pc’ is a constant with the dimensions of pressure divided by concentration. The constant, known as the Henry's
law constant, depends on the solute, solvent, and temperature.
Ideal gas thermal capacity
The thermal capacity at constant volume of an ideal gas is:
Where:
cV is a constant dependent on temperature
U is the internal energy
T is the absolute temperature
V is the volume
n is the amount of substance of the gas
R is the gas constant (8.314 J·K−1mol-1 in SI units)
Chapter 12: ChemDraw/Excel and CombiChem
206 of 315
ChemDraw 15.0
N is the number of gas particles
k is the Boltzmann constant (1.381×10⁻²³J·K−1 in SI units)
B
The thermal capacity at constant pressure of an ideal gas is:
Where ‘H’ is the enthalpy of the gas, calculated as: H = U + pV.
MOLECULAR_NETWORKS_LOGP
The partition coefficient is a ratio of concentrations of un-ionized compound between two solutions. To measure the
partition coefficient of ionizable solutes, the pH of the aqueous phase is adjusted so that the predominant form of the
compound is un-ionized. The logarithm of the ratio of the concentrations of the un-ionized solute in the solvents is
called LogP.
Normally, one of the solvents chosen is water; the second is hydrophobic, such as octanol.
MOLECULAR_NETWORKS_LOGS
MOLECULAR_NETWORKS_LogS determines the solubility of a substance, measured in mol/liter. The aqueous solubility of a compound is known to significantly affect absorption and distribution characteristics of that compound.
MOLECULAR_NETWORKS_PKa
MOLECULAR_NETWORKS_PKa is the negative log of the acid dissociation constant Ka. It describes the tendency
of compounds or ions to dissociate in solution.
Mass
This is the mass of one molecule of a substance, relative to the unified atomic mass unit u (equal to 1/12 the mass of
one atom of 12C). Also called molecular mass.
Melting point
Is the temperature at which a solid becomes a liquid at standard atmospheric pressure. At the melting point, the solid
and liquid phase exist in equilibrium. The formula to calculate melting point is:
Where ‘T’ is the temperature at the melting point, ‘∆S’ is the change in entropy of melting, and ‘∆H’ is the change in
enthalpy of melting.
Chapter 12: ChemDraw/Excel and CombiChem
207 of 315
ChemDraw 15.0
Molar refractivity
Is a measure of the total polarizability of one mole of a substance. It is dependent on the temperature, index of refraction, and pressure.
The molar refractivity, ‘A’ is expressed as:
Where ‘NA’ is the Avogadro constant and α is the mean polarizability.
Molecular formula
This is the molecular formula of the compound.
Molecular weight
This is the sum of the atomic weights of all atoms in a molecule.
Num rotatable bonds
Is the number of rotatable bonds in a molecule. A rotatable bond is defined as an acyclic bond drawn as a single bond
(amide C-N bonds, O=C--N, are rotatable) where the atom on each end has at least one other non-hydrogen substituent. This topological parameter is a measure of molecular flexibility. Unsaturated bonds, and single bonds connected to hydrogens or terminal atoms, single bonds of amides, sulphonamides, and those connecting two hindered
aromatic rings (having at least three ortho substituents) are considered non-rotatable.
Ovality
This refers to a measure of how the shape of a molecule approaches a sphere (at one extreme) or a cigar shape (at the
other). Ovality is described by a ratio of volume to area:
Where ‘A’ is area, ‘V’ is Volume, and ‘O’ is Ovality.
The ovality of a helium atom is 1.0 and HC
H (12 triple bonds) is ~1.7 (equivalent to 1.7).
24
Polar surface area
The Polar Surface Area (PSA) is defined as the surface sum over all polar atoms
Principal moment Of inertia
This refers to the principal moments of inertia about the principal axes of a molecule. The moments of inertia are computed for a series of straight lines through the center of mass using the formula:
Chapter 12: ChemDraw/Excel and CombiChem
208 of 315
ChemDraw 15.0
Distances are established along each line proportional to the reciprocal of the square root of I on either side of the
center of mass. The locus of these distances forms an ellipsoidal surface. The principal moments are associated
with the principal axes of the ellipsoid.
If all three moments are equal, the molecule is considered to be a symmetrical top. If no moments are equal, the
molecule is considered to be an asymmetrical top.
Radius
The eccentricity of an atom is the largest value in its row (or column) of the distance matrix, and represents how far
away from the molecular center it resides.
The diameter (D) is the maximum such value for all atoms, and is held by the most outlying atom(s). Examples: Diameter of methane = 0; ethane = 1; propane = 2; n-butane = 3.
The radius R is the minimum such value, and is held by the most central atom(s). Examples: Radius of methane = 0;
ethane = 1; propane = 1; n-butane = 2.
Shape attribute
The shape attribute (kappa) measures the branching of a molecule, and is scaled so as to fall between the minimum
and maximum values possible for the given order. The first-order shape attribute counts the number of one-bond
paths. The second-order attribute counts the number of two-bond paths, and so on. The first three orders (1..3) are
available.
Shape coefficient
The shape coefficient, I is given by:
Where the diameter (D) is the maximum such value for all atoms, and is held by the most outlying atom(s). The radius
(R) is the minimum such value, and is held by the most central atom(s).
Examples values for D: methane = 0; ethane = 1; propane = 2; n-butane = 3.
Example values for R: Radius: methane = 0; ethane = 1; propane = 1; n-butane = 2.
Sum Of degrees
Is the sum of degrees of every atom. An atom’s degree is the number of nonhydrogen atoms to which it is bonded.
Sum of valence degrees
Is the sum of degrees of every atom. An atom’s valence degree is equal to the sum of its adjacent bonds' orders,
including hydrogens.
Chapter 12: ChemDraw/Excel and CombiChem
209 of 315
ChemDraw 15.0
Topological diameter
Is the longest dimension of a molecule.
Total connectivity
Is the connectivity considered over all the heteroatoms.
Total Valence Connectivity
Is the valence connectivity considered over all the heteroatoms.
Vapor pressure
Is the pressure exerted by a vapor in equilibrium with its solid or liquid phase. Vapor pressure measures the concentration of solvent molecules in the gas phase.
Vapor pressure can be calculated using Raoult’s law. The formula to calculate vapor pressure is:
Where ‘p’ is vapor pressure, ‘i’ is a component index, and ‘χ’ is a mole fraction.
Water solubility
Is the maximum amount of a substance that can be dissolved in water at equilibrium at a given temperature and pressure. Water solubility is measured in mg/L.
Wiener index
Provides measure of branching defined as:
Where Dij are the off-diagonal elements of the distance matrix.
General Preferences
From the General Preferences dialog, you can customize ChemDraw for Excel for your specific work needs.
To customize ChemDraw for Excel:
1. Navigate to ChemOffice > Options >Preference. The General Preferences dialog appears.
Chapter 12: ChemDraw/Excel and CombiChem
210 of 315
ChemDraw 15.0
2. Customize the options found in the General Preferences dialog based on your work needs. The options display under three categories: Molecules & Structures, Import/Export, and Misc:
Molecules & Structures:
l
l
l
l
Double Click To Add Molecule: Launches ChemDraw when you double-click a cell.
Ask Before Adding Molecule: Prompts a message when you double-click a cell to add a molecule.
Use Filename in Load Molecule: Displays file name instead of chemical formula below the molecule after
loading the molecule.
Align Structure: Specifies how the structure is aligned in a cell. You can choose to reduce the column width,
row height, or both.
Import/Export:
l
l
l
l
Import Table: Specifies whether to overwrite the table or to append records to the existing table.
Automatically generate structures while importing a table: Generates structure pictures for each record
while importing a table using the Import Table command. Disabling this option can speed up the import process. Only structure and table data are imported and no pictures are generated. Select the structure cells and
use Show Picture to display the pictures.
Ask If Record Import Count Exceeds: Prompts a message when the table being imported contains more
records than the count number specified.
SDF Export Version: Specifies the Structure Data File (SDF) version exported by ChemDraw for Excel. SDF
Files can either be V2000 or V3000. The default value is V2000, which limits the number of atoms and bonds in
a molecule: V2000 files allow up to 1000 of each. V3000 is a superset of V2000, and offers an enhanced stereochemistry specification. Unlike V2000, the V3000 format does not limit the number of atoms and bonds in a
molecule.
Chapter 12: ChemDraw/Excel and CombiChem
211 of 315
ChemDraw 15.0
Misc:
l
l
l
l
Ask Before Clearing Cells:Prompts a message when you attempt to delete the cell content in a ChemOffice
worksheet by either pressing <Delete> or <Backspace> keys.
Copy Structure to MS Word As: Lets you select the format that you want to use to copy your structure to an
MS Word document, for example, Bitmap or OLE Object.
Search Results: By default, the search result appears in the same worksheet on which the search is performed. The Display in a new worksheet option creates a new worksheet with the name "SearchResults X"
(where X is 1,2.3...) and displays the search results in this new worksheet, without changing anything in the original worksheet.
Default Style Sheet: Specifies the style sheet always applied to the structures when structures are added
using Import Table, Load Molecule, or by Add Molecule commands. To apply a style to particular molecules,
navigate to ChemOffice > Molecule > Style. The default style sheet is New Document.cds.
CombiChem
Using CombiChem, you can build virtual combinatorial libraries of structurally related molecules. You can then screen
your libraries for various properties to determine which compounds you want to synthesize.
CombiChem is a plugin for Microsoft Excel and is included with ChemDraw/Excel. If you are familiar with MS Excel,
you will find CombiChem simple to use. However, if you need assistance, see the Help documentation for MS Excel.
Getting Started
When you install ChemFinder or ChemOffice, the CombiChem add-in is also installed. CombiChem requires
Microsoft Excel 2010 or later.
Assistance with CombiChem
CombiChem provides Help in the Excel worksheets. Go to ChemOffice15>CombiChem>Help.
By default, each worksheet you create also includes brief instructions to help guide you. If you do not see the instructions:
1. Go to ChemOffice15>CombiChem>Preferences.
2. Select Add Instructions to Every Sheet.
3. Click OK.
The instructions appear on new worksheets that you create.
Creating combinatorial libraries
To create a combinatorial library, you first need a generic reaction. This reaction resembles the real reaction you will
use in the lab to synthesize compounds. The generic reaction contains one or more query structures that represent the
reactants and products in the real reaction. An example of a generic reaction is shown below:
Chapter 12: ChemDraw/Excel and CombiChem
212 of 315
ChemDraw 15.0
You use the generic reaction to search your chemical database for compounds that match the reactant query structures. Once all the matching compounds are found, CombiChem generates a list of reactions from the compounds
that were found in the query.
The generic reaction you create must meet these criteria:
All generic atoms in the reactant(s) must be represented by R-groups.
Solvents, catalysts, and other “real-world” elements must not be included in the generic reaction.
Multi-step generic reactions are supported.
Entering a generic reaction
To enter the generic reaction, you must first create a reaction worksheet:
Go to ChemOffice15>CombiChem>New Reaction. A new worksheet, named “Reactions” appears in your workbook.
You then add the generic reaction to the reaction worksheet by either importing it or drawing it in ChemDraw.
To import the reaction:
1. Place your cursor in the cell that contains the text “Reaction - Double-click to edit.”
2. Either click the Load Molecule icon on the ChemOffice toolbar or go to ChemOffice15>Molecule>Load.
3. Browse to the file that contains the generic reaction and click Open. The reaction appears in the Reactions worksheet.
To draw the reaction in ChemDraw:
1. Double-click the cell that contains the text “Reaction - Double-click to edit.”.
2. When asked whether to add a new molecule, click Yes. ChemDraw launches.
Chapter 12: ChemDraw/Excel and CombiChem
213 of 315
ChemDraw 15.0
3. In ChemDraw, draw the generic reaction.
4. In ChemDraw, go to File>Exit. You will be returned to Excel and the reaction will appear in the worksheet.
Tip: To display or hide the reaction, click the Show Picture or Hide Picture icon.
Note: Do not add more than one reaction to a reaction template.
Creating reactant worksheets
The generic reaction contains at least one generic reactant (a reactant that has one or more R-group attachments).
After you enter the generic reaction in Excel, you create a worksheet for each generic reactant. CombiChem uses the
reactant worksheet(s) to search your database for structures that may be used in synthesis. In multi-step reactions,
CombiChem searches for reactants in the first step; but ignores intermediate reactants.
To create reactant worksheets:
1. Select the Reactions worksheet tab.
2. Go to ChemOffice15> CombiChem>Reactants>Make Reactant Worksheets. A new worksheet is added for
each generic reactant.
CombiChem creates a worksheet for each generic reactant (typically, either one or two reactant worksheets for the
reaction you entered).
Searching for reactants
Reactant worksheets are empty when CombiChem creates them. To populate each worksheet with structures from
your database, you must either import the database as an SD file or use ChemFinder to search for records.
To search for reactants in an SD file:
1. Select a Reactant worksheet tab.
2. Go to ChemOffice15>CombiChem> Reactants>Search for Reactants. A dialog box appears.
3. Select Search Directly to import an SD file to search.
Note: SDfiles have the extension .sdf.
4. Enter the file path in the Database field or click Browse to locate the file.
5. Click OK. Records in the file that match the generic reaction are returned.
To search for reactants using ChemFinder:
1. Go to ChemOffice15>CombiChem> Reactants>Search for Reactants.
2. In the dialog box, select Search in ChemFinder.
3. In the Database field, enter the path to the ChemFinder form to be used to search the ChemFinder database.
Note: ChemFinder form files have the extension .cfx or .cfw.
4. Click OK. ChemFinder launches.
Chapter 12: ChemDraw/Excel and CombiChem
214 of 315
ChemDraw 15.0
After launching, ChemFinder uses the form you entered to search its corresponding database for records that
match the generic reactant. You can browse the search results in ChemFinder before importing them into the
Excel reactant worksheet.
Tip: To omit a record from the search results, navigate to the record in ChemFinder and go to Record>Omit from
List in the ChemFinder main menu.
5. In Excel, go to ChemOffice15>CombiChem>Reactants>Import ChemFinder Hitlist.
Alternatively, you can copy and paste the query structure into ChemFinder to perform a search.
1. In Excel, select the cell that contains the generic reactant.
2. Click the Copy Molecule icon on the ChemOffice toolbar.
3. In ChemFinder, open the database to search.
4. Paste the generic reactant structure into a query form and run the search.
5. In the reactant worksheet in Excel, go to ChemOffice15>CombiChem>Reactants>Import ChemFinder Hitlist
to import the search results. The search results appear in the reactant worksheet(s).
Tip: Use the Show Picture/Hide Picture commands to toggle the display.
Recreating reactant worksheets
You can edit the generic reaction at any time. However, you must then delete and recreate each reactant worksheet.
To recreate a reactant worksheet:
1. Right-click the reactant worksheet tab and select Delete.
2. When prompted, confirm that you want to delete the worksheet.
3. Go to ChemOffice15>CombiChem>Reactants>Make Reactant Worksheets.
4. Go to ChemOffice15>CombiChem> Reactants>Search for Reactants. (For more information, see "Searching
for reactants" on page 214.)
If you try to create new reactant worksheets in a workbook that already contains reactant worksheets, you will be
asked whether you want to delete the existing worksheets. When prompted, choose one of these options:
Click Yes to replace the existing worksheet(s). The existing worksheet is permanently deleted.
Click No. No new worksheet is created and the current worksheet(s) are kept.
To preserve the existing worksheets go to File>Save As and save the workbook. Then, follow the steps above to
recreate the reactant worksheet(s). When prompted to delete each existing worksheet, click Yes. New reactant worksheets will be created and the previous workbook will be available as a saved file.
Creating an experiment
An experiment is a library of product structures that is created when the reactant search results are applied to the generic reaction. You can create or enumerate multiple experiments per workbook.
Chapter 12: ChemDraw/Excel and CombiChem
215 of 315
ChemDraw 15.0
For example, you can take all the reactants you imported and enumerate an experiment containing all possible combinations of reactants. After calculating properties on these products, you might decide that 10% of these products are
worth synthesizing in the lab. You could then create an experiment with just those products that the calculations show
to be promising.
The ‘Use (Y/N)’ column in a reactant list determines whether the associated reactant in the list will be used (‘Y’) in the
experiment or not (‘N’). By default, Y, appears.
Note: Only the Structure and Use (Y/N) columns are necessary. Other columns may also be included but CombiChem ignores them. You can delete them if you want.
To create a new experiment:
1. In each reactant list, select the reactants to use by typing Y in their “Use(Y/N)” column. Type N for those reactants
you do not wish to use.
Note: Cells without “n” or “N” default to “Y”.
2. Go to ChemOffice15>CombiChem>Experiments> New or use the floating experiments form (Combi Options>Experiment>New). A dialog box appears asking whether you want to create the experiment with the selected
number of reactants.
Note: Enumeration of a product library may take a long time, especially if there are many reactants or you are
using a slower processor.
CombiChem/Excel saves your enumeration to a ChemFinder database file.
3. When prompted, save the experiments file.
Note: When the enumeration is done, CombiChem/Excel imports your data to a worksheet.
Experiment worksheets
After you create the experiment, several sheets are added to your workbook:
Experiment Reactant sheets. Contain lists of the reactants used in the experiment. There is one Experiment Reactant sheet for each reactant. These sheets are named Experimentn-Reactantm where n is the designates a specific experiment (in case you create more than one) and m is the reactant for the experiment.
Experiment Product sheet. Contains the generic reaction and the enumerated products in the experiment based on
the reactants you marked ‘Y’ in the reactant worksheet(s). By default, only the products are listed. To list the complete
enumerated reactions:
1. Go to ChemOffice15>CombiChem>Preferences.
2. In the Combi Preferences dialog box, select Show Full Reaction for each product.
3. Select a reactant worksheet.
4. Go to ChemOffice15>CombiChem>Experiments>New. A new experiment is added with the full reactions
appearing in the product worksheet.
Chapter 12: ChemDraw/Excel and CombiChem
216 of 315
ChemDraw 15.0
Note: Whenever you create a new experiment, existing experiment worksheets are retained. If you want to delete
them, right-click each experiment tab and select Delete or use the experiments floating form (Combi Options>Experiment>Delete).
Go to Combi Options>Experiment>Toggle to hide/unhide all the experiment worksheets in the workbook.
Configuring plates
After you create an experiment, you can assign your products to product wells and your experiment reactants to reactant block plates. This is useful if you are going to use a robotic synthesizer. You can configure plates of up to 50 rows
and 50 columns.
To set up assignments:
1. Open either an Experiment Reactant or Experiment Product worksheet.
2. Go to ChemOffice15>CombiChem>Plates>Configure Plates.
The Configure Plates dialog box appears.
3. In the Configuration of: drop-down list, select either Product Plates or Reactant Block Plates.
4. Enter the number of rows and columns to assign to the plate.
The numbered buttons represent wells in the plate you chose.
5. Designate which wells you want to use as controls, synthesized compounds, and left empty. Click a well to
change its designation.
6. When you are finished, click Apply.
Assigning plates
The next step is to assign plates to each reactant and product.
To assign the reactants or products to plates:
1. Select an Experiment-Reactant worksheet.
2. Go to ChemOffice15>CombiChem>Plates>Assign to Wells.
3. Select a product worksheet.
Chapter 12: ChemDraw/Excel and CombiChem
217 of 315
ChemDraw 15.0
4. Go to ChemOffice15>CombiChem>Plates>Assign to Wells.
Three columns are added to the reactant or product worksheet: Well Plate, Well Row, and Well Column.
To change specific plate assignments, edit the values on the worksheet.
To remove all plate well assignments:
1. Select the worksheet where you want to remove assignments.
2. Go to ChemOffice15>CombiChem>Plates> Remove well assignments.
Browsing plates
After assigning reactants or products to wells, you can view which one has been assigned to each well.
1. Select either a reactant or product worksheet.
2. Go to ChemOffice15>CombiChem> Plates>Browse Plates. The Plate Browser dialog box appears.
3. In the Plate scroll list, select or enter the plate number to view.
4. In the dialog box, select the well to view. The worksheet scrolls to the reactant or product assigned to the well you
select.
Viewing related structures
After enumerating an experiment, you may view which reactants went into a product or which products arose from a
given reactant.
Chapter 12: ChemDraw/Excel and CombiChem
218 of 315
ChemDraw 15.0
To view the related structures:
1. Select a row on an Experiment Reactant or Experiment Product sheet.
2. Go to ChemOffice15>CombiChem>Highlight Related Records.
The related records on the Experiment Reactant and Experiment Product sheet are displayed in color.
3. (Optional) To remove the highlighting from all rows, go to ChemOffice15>CombiChem>Highlight>Unhighlight
All.
Setting preferences
CombiChem provides several options for you to choose how and whether certain information appears on each worksheet. Go to ChemOffice15>CombiChem>Preferencesand select from these options:
Add Instructions to Every Sheet. By default, row 1 of each CombiChem worksheet contains instructions.
Select/deselect this option to display or remove them from each new sheet you create.
Show Full Reaction for each product. By default, the reaction arrow and products appear on each Experiment
worksheet. Select this option to display the full reaction on each new Experiment sheet.
Discard duplicate reactions in experiment. Select this option to discard all duplicate reactions in an experiment
and save only unique ones.
Assign Compounds From. Assign rows and columns in plates. Choose Left to Right to assign well numbers by
row (1-1, 1-2, 1-3, etc.). Choose Top to Bottom to assign well numbers by column (1-1, 2-1, 3-1, etc.).
Plate Column Label. Assign numeric or alphabetic labels to plate columns.
Plate Row Label. Assign numeric or alphabetic labels to plate rows.
Chapter 12: ChemDraw/Excel and CombiChem
219 of 315
ChemDraw 15.0
ChemScript
ChemScript is the cheminformatics Software Development Kit (SDK). It contains the programming algorithms that
are common throughout PerkinElmer products. As a software developer, you can apply ChemScript to create your
own scripts to use with ChemOffice applications.
All example script files in the ChemScript library are available in Python and C#/.NET. If you are familiar with either of
these languages, you will find these scripts easy to understand. However, if you are new to either Python or C#/.NET,
we suggest that you refer to the Web sites and books listed at the end of this chapter.
Although ChemScript is available in Python and C#/.NET, we will use Python in this guide to explain ChemScript.
Python is a non-proprietary and widely used programming language.
Why use ChemScript?
ChemScript adds considerable versatility to how you manage your chemical data. Using ChemScript, you can
modify, view, and transfer your data from one place to another using your own custom rules.1
Here are just a few common uses:
Salt splitting and stripping
Identify and remove salt fragments from a drawn structure and register the pure compound.
Canonical codes
Generate canonical codes for a set of structures and use the codes to find duplicates in your data.
File format conversion
Convert structure or reaction files from one format to another.
Generate properties
Execute Struct=Name or generate physical property features found in ChemDraw.
Common scaffold orientation
Enforce standard orientations of structures based on the established orientation of a common substructure.
2D Structure Diagram Generation (SDG) and Cleanup
Generate new 2D structures from connection tables without coordinates and clean up existing 2D structure using the
ChemDraw algorithms.
1ChemScript lets you convert up to 10,000 data records per day. For greater capacity, you will need ChemScript. For information,
contact PerkinElmer.
Chapter 13: ChemScript
220 of 315
ChemDraw 15.0
How ChemScript works
The most fundamental use for ChemScript is to read data from one source, modify the data using a script, and write
the modified data to another location. You can retrieve data from or write to almost any database, file(s), or application.
Figure 13.1: A ChemScript script can retrieve data from one source, modify the data, and write it to another location.
How the data is modified is determined entirely by the script. The script can delete data, calculate or add new data, or
edit existing data. The data can be either text, structures, or both.
Since ChemScript scripts are like any other Python scripts or .NET program, you can execute the scripts using either
the Windows command line or any development environment.
Getting Started
By default, ChemScript and Python 3.2 are installed on your local computer when you install ChemOffice. After the
installation, we suggest that you follow the simple exercises in this section to familiarize yourself with ChemScript.
For editing ChemScript files, we recommend that you use one of the many programming tools that are available. One
of these tools, IDLE, is included with the Python installation. To learn more about IDLE, see the online Help in the
IDLE main menu.
Starting IDLE
From the Start menu, go to All Programs>Python 3.2>IDLE (Python GUI). After Python starts, a Python shell
opens in IDLE and the header indicates a version of Python (Ex. 3.2), and a version of IDLE (Ex. 1.2). A prompt will
also appear: “>>>”
Loading the ChemScript Library
At the command prompt, type the line below and press <Enter>:
import ChemScript15
Note: The command is case-sensitive.
Chapter 13: ChemScript
221 of 315
ChemDraw 15.0
A “Welcome to CS ChemScript” message appears, followed by a command prompt.
ChemScript Help
You can read a description of any ChemScript class within IDLE. For example, enter the line below to return Help for
the ChemScript Atom class.
help(Atom)
The help will begin with a message such as:
“Help on class Atom in module ChemScript15:”
Enter SMILES Data
You can also test to verify that ChemScript is working correctly. One common use for ChemScript is to apply functions to SMILES strings. For example, you can assign a SMILES string to a variable. Type the following line and press
<Enter>:
myMol = Mol.LoadData('C1CCCCC1C')
This message appears:
Open molecule successfully: chemical/x-smiles
Reporting a Chemical Name
You can now use the variable to report the chemical name. For example, at the command prompt type the line below
and press <Enter>:
myMol.chemicalName()
The line methylcyclohexane is returned.
Counting Atoms
To count the atoms in the string, type the following line and press <Enter>:
myMol.CountAtoms()
The command returns the atom count for the structure defined with the chemical/x-smiles format for 'C1CCCCC1C',
which is 7.
Exiting IDLE
To exit, type this line and press <Enter>:
exit()
Confirm any prompts to complete the exit command. Python IDLE exits.
Getting Started Guide
ChemScript includes a Getting Started guide to help you begin developing and using your own scripts. To open the
guide, go to Start>All Programs>ChemOffice2015 >ChemScript 15.0>Getting Started.
The document includes notes on the ChemScript objects and functionality, Python, and an overview of examples
installed.
Editing Scripts
Using IDLE or another development environment, you can either edit the scripts provided with ChemOffice or create
your own. Regardless of how you develop a script, it must include these commands:
from sys import *
from os import *
Chapter 13: ChemScript
222 of 315
ChemDraw 15.0
from os.path import *
from ChemScript15 import *
The first command imports the python system. The second and third commands import the operating system modules. The last command imports all the ChemScript functions. After you include these command lines, how you
develop the rest of your script is entirely up to you.
Introducing the ChemScript API
ChemScript includes a ChemScript API reference guide. You can find the guide at Start>All Programs>ChemOffice 2015>ChemScript 15.0>API Reference. It provides links and information for the ChemScript classes.
The ChemScript object model comprises two fundamental levels of functionality, described below.
ChemScript Classes
At the top level, the API consists of four classes:
Atom
Chemical element, charge, bonds to neighboring atoms, drawing coordinates, 3D coordinates (if available), stereochemistry, etc.
Bond
Bonded atoms, bond order, etc.
Molecule (Mol)
A chemical connection table, which can represent one or more molecular fragments. This class also includes file I/O
capabilities and other advanced chemistry functionality such as stereochemistry.
Reaction (Rxn)
A chemical reaction with one or more steps.
Functions and Algorithms
The secondary level consists of the core set of high-level features that you can modify to meet your specific business
needs. Some examples are described below.
Template Based Normalization
Enforce standard representations of functional group structures in chemical data.
Template Based Product Generation
Automatic generation of products from a set of reactants and a generically defined reaction. For example, reactions
like those between amines and carboxylates.
Chapter 13: ChemScript
223 of 315
ChemDraw 15.0
Substructure Identification and Mapping
Atom-by-atom comparison of a molecule with a substructure. Positive matching provides an atom-by-atom map of the
substructure atoms to those in the molecule.
Salt Stripping
Remove salts from a reaction based on a pre-defined list of salt fragments.
Structure Orientation
Enforce standard orientation of structures based on the established orientation of a common scaffold.
2D Structure Generation and Cleanup
Use ChemDraw-based algorithms to generate structure from scratch or after modifying chemical data using a program.
Canonical Codes
Generate unique identifying codes from a chemical structure.
File Format Conversion
Read and write file data using all PerkinElmer supported file formats (CDX, CDXML, MOL, CHM, SKC, SMILES,
etc.).
Chemical Name and Structure Conversion1
Use the ChemDraw Struct=Name feature to generate structures from chemical names and names from their structures.
Molecular Mechanics
Optimize molecular structures using the MM2 force-field.
The ChemScript API online
PerkinElmer also provides the documentation of the API online. You can find the API at sdk.cambridgesoft.com.
Tutorials
We provide several sample scripts to illustrate how you can develop your own custom code to meet your business
needs. Many of the scripts we use are in the ChemScript samples directory. By default, this directory is where
ChemOffice 2015 auxillary files are installed:
On Windows 7 and 8:
C:\ProgramData\CambridgeSoft\ChemOffice2015\ChemScript\Examples\
1Premium functionality that may be licensed from PerkinElmer.
Chapter 13: ChemScript
224 of 315
ChemDraw 15.0
For the sake of brevity, we won’t repeat the scripts in this manual or try to teach Python. However, we briefly describe
what you can do with the code examples so that you can modify and expand upon them for your own use. As you read
the tutorials, you are encouraged to view the code in IDLE and edit it as desired to see how each example works. For
more on IDLE, see "Getting Started" on page 221.
Example 1: Automated Structure Clean up
This sample script cleans up the structures in multiple ChemDraw files all at the same time. It uses the same cleanup
function that is in ChemDraw. The script is in the directory Example.001/script.py. The script reads the CDX
structure files from a source directory, applies the cleanup feature to each structure, and write the modified files to an
output directory. The original files remain unchanged.
Figure 13.1: The structure cleanup script reads a structure file (left) and creates a new, cleaned up structure file (right).
This example uses the CDXML format. Other formats, such as MDL MOL, may also be applied. You can also force
ChemScript to use specific file formats for reading and writing data.
Example 2: Create an SD file
This example illustrates how you can create an SD file from existing CDXML files. You can find the script at
Example.002/script.py. We begin with a list of CDXML files that each contain a chemical structure. The list of
files is hard-coded into the ChemScript script. When executed, the script uses the SDFileWriter method to create
an SD file that includes all the structures.
Example 3: Create a list of CDXML files
This example illustrates how to read an SD file and write a list of CDXML files. You can find the source file at
Example.003/script.py.
Example 4: Filter an SD file
This example uses the atomByAtomSearch method to demonstrate a simple application of the "atom-by-atom" substructure search in ChemScript. The program reads an SD file and filters structures into one of two output SD files,
structures that contain a phenyl group and structures that don’t. It also illustrates how you can read chemical data
formatted as a SMILES string. See Example.004/script.py.
Example 5: Computing Canonical Codes
This example script checks whether any structures appear in both of two SD files based on the structures’ canonical
codes. The output is a new SD file with the duplicate structures excluded. See Example.005/script.py.
Chapter 13: ChemScript
225 of 315
ChemDraw 15.0
This example first computes the canonical code for each structure. Since the canonical code does not vary with different representations of the same chemical structure, you can use it to determine whether two structures are chemically equivalent.
This example also introduces the Python Dictionary, which is an associative array. The dictionary maps a key to a
value. The dictionary is used to determine whether a canonical code has been previously encountered.
This example uses an alternate looping construct to read an SD file.
Canonical codes should never be permanently stored because their representation can
change among different versions of ChemScript.
Example 6: Structure Overlay
This script introduces the ChemScript structure overlay feature. It uses a scaffold structure file to superimpose two
chemically similar structures. The script first examines the structures in an SD file that contain a common scaffold
substructure. It then aligns these structures so that they have the same orientation with respect to the scaffold. See
Example.006/script.py.
Note: The overlay functionality can also be used to align three dimensional structures.
Example 7: Reaction Transformation
This example demonstrates reaction transformation. This means that you can draw a reaction that defines a transformation of a molecule and then apply that transformation to a set of structure files.
All the files necessary for this tutorial are in the Example.007 directory. The transform1.cdxml file provides the
reaction that defines the transformation. The input.sdf file contains all the structures that will be transformed.
Figure 13.2: The transform file defines how the transformation is applied to the source structures.
The script searches the input file for structures that contain a nitro group, shown as a reactant in the transformation
file. If a structure is found, the script transforms the nitro group to the form shown in the product and copies the entire
structure to a new file. The figure below shows one example.
Chapter 13: ChemScript
226 of 315
ChemDraw 15.0
Figure 13.3: A) before the transformation is applied; B) after transformation.
Structures that don’t meet the search criteria are ignored.
Example 8: Simple salt stripping
The program reads an SD File, identifies and removes salt components (if any are present), and outputs two SD files.
The output structure file contains the original structures without the salt component, and the output salt file contains
the salt components that were stripped, along with a reference to the original structure. See
Example.008/script.py.
Note: This example uses a default set of salts that PerkinElmer provides. However, you can also define a customized salt table that enables you to designate which chemicals are considered salts.
Useful References
There are numerous resources available for learning Python and C#/.NET. Just a few of the many books and Web
sites are listed below.
Books
Python
Beginning Python: From Novice to Professional by Magnus Lie Hetland.
Dive into Python by Mark Pilgrim.
Learning Python by Mark Lutz & David Ascher. This is a beginner/intermediate learning manual and reference.
Python in a Nutshell by Alex Martelli. This book is a brief introduction and good reference to Python.
C#/.NET
C# in a Nutshell by Peter Drayton, Ben Albahari, and Ted Neward.
Pro C# with .NET 3.0 by Andrew Troelsen.
C# Essentials by Ben Albahari, Peter Drayton, and Brad Merrill.
C# 3.0 Cookbook by Jay Hilyard and Stephen Teilhet.
Web Sites
Python
You can find more information on Python at: http://www.python.org. This is the official Python programming language
site.
.NET
For information on .NET, see
http://msdn.microsoft.com
Chapter 13: ChemScript
227 of 315
ChemDraw 15.0
Query Structures
A query is a search for information that is stored in a database. If you have ever searched the Internet using a Web
browser, then you have performed a simple query.
A query structure is a parameter you use to search a chemical database (the database must include structures for the
query to be useful). The query structure can include bond and atom properties that you specify to narrow or broaden
the list of search results. Below are two query structure examples:
Figure 14.1: Two example structure queries. A) The results include any connected atom at the location specified by
‘R’; B) The results include either a single or double bond at the location specified by ‘S/D’.
To perform a query, you first draw the query structure in ChemDraw. You then enter the structure in a database application such as ChemFinder. The application searches one or more databases that you specify and returns the query
results.
Search Limitations
Several factors determine the search results that are returned. To get the results you expect, you must first ensure
that the structure you draw accurately represents the query you want to perform. For example, if your query structure
requires that no carbon atoms in an aromatic structure can be part of any ring, you are likely to return no results or an
error, depending on the query system used.
The search application you use can also affect your query. If the application does not accurately interpret your query
structure, or the structures in the database, you could receive inaccurate results.
Generic Labels
A generic label represents a nonspecific attachment. It can be either an unspecified atom, functional group, or structural feature. When you perform a query, the query looks for structures based on the type of generic label you use and
where it is in the query structure. Records that match the query structure are returned in the search results.
For example, the query structure below uses the letter ‘Q’ to indicate that a nonhydrogen, noncarbon atom must
appear at the specified location.
Chapter 14: Query Structures
228 of 315
ChemDraw 15.0
You can use other generic labels to indicate other types of query criteria. The generic labels that ChemOffice supports
are listed below (all are recognized as chemically significant).
A: Represents any non hydrogen.
M: Represents a metal.
Q: Represents an atom that is neither hydrogen nor carbon.
X: Represents any halide.
R: Unrestricted; represents one or more connected atoms of any kind.
To add a generic label to a structure, do one of the following:
1. Double-click the atom to open a text box, and type in the nickname.
2. Right-click the atom, point to Insert Generic Label on the context menu, and click the label you wish to insert on
the sub-menu.
Generic Nickname Hotkeys
You can assign hotkeys to generic nicknames, just like other nicknames. For information on assigning a hotkey to a
nickname, see "Customizing Hotkeys" on page 32.
Defining Generic Nicknames
The generic nicknames recognized as chemically meaningful are listed in the Generic Nicknames file in the
ChemDraw Items folder.
To edit the generic nickname files, open the Generic Nicknames file in a text editor and make your changes. Follow
examples in the file for the correct format.
Note: If you check a structure that has a generic nickname, a message displays because the structure contains
variable substituents. If you ignore this message, the generic nicknames are ignored, and the chemical formula,
mass, etc., are reported as if the atom label containing the generic nickname were not selected.
Reaxys
Reaxys is a web-based chemical search engine designed for synthetic and medical chemists. The Reaxys database
includes chemical properties, structures, reactions and experimental data. Using ChemDraw for Reaxys® with
ChemDraw, you can draw query structures to search the Reaxys database.
Chapter 14: Query Structures
229 of 315
ChemDraw 15.0
Note: For the Windows version, you need both the Reaxys Structure Editor plug-in and either the ChemDraw
application or plugin installed on your system.
In addition to A, M, Q, X, and R, Reaxys recognizes several other generic atoms.
To add a Reaxys generic label to a structure:
Right-click an atom, point to Insert Generic Label on the context menu, point to Reaxys and click the label in the
sub-menu you wish to insert.
The table below lists the labels and their meaning.
Labels
Meaning
AH
Any or H
MH
Metal or H
QH
Any, except Carbon or H
XH
Halogen or H
G
Unspecified
GH
Unspecified or H
G*
Unspecified, ring closure allowed
GH*
Unspecified, ring closure allowed or H
ACY
Acyclic
ACH
Acyclic or H
ABC
Carbacyclic
ABH
Carbacyclic or H
AYL
Alkynyl
AYH
Alkynyl or H
ALK
Alkyl
ALH
Alkyl or H
AEL
Alkenyl
AEH
Alkenyl or H
AHC
Hetero acyclic
AHH
Hetero acyclic or H
AOX
Alkoxy
AOH
Alkoxy or H
Chapter 14: Query Structures
230 of 315
ChemDraw 15.0
Labels
Meaning
CYC
Cyclic
CYH
Cyclic or H
CBC
Carbocyclic
CBH
Carbocyclic or H
ARY
Aryl
ARH
Aryl or H
CAL
Cycloalkyl
CAH
Cycloalkyl or H
CEL
Cycloalkenyl
CEH
Cycloalkenyl or H
CHC
Heterocyclic
CHH
Heterocyclic or H
HAR
Hetero aryl
HAH
Hetero aryl or H
CXX
No carbon
CXH
No carbon or H
Atom Properties
Atom properties determine the structural features allowed at the site of an atom. For example, you can specify that a
carbon atom must be part of a ring, have at least two attachments, have no attachments, or perhaps be a specific isotope.
Assigning Atom Properties
To assign properties to selected atoms in a structure:
1. Select one or more atoms.
2. To open the Atom Properties dialog, do one of the following:
Right-click, select Atom Properties.
Navigate to Structure>Atom Properties.
Press the hotkey “/ ”.
3. In the Atom Properties dialog, select the properties to associate with the selected atom(s).
4. Click OK.
Chapter 14: Query Structures
231 of 315
ChemDraw 15.0
Query Indicators
Query indicators display the atom properties you assign to a structure, as shown below. If more than one property is
assigned, an indicator for each property appears adjacent to the atom.
Figure 14.2: This structure illustrates several possible atom properties that can be assigned.
The list below describes each indicator:
*— Substituents: Free Sites (Followed by the number of free sites)
U— Substituents: Up to (Followed by the maximum number of substituents)
X— Substituents: Exactly (Followed by the number of substituents)
H— Implicit Hydrogens. See "Implicit Hydrogens " on page 235.
R— Ring Bond Count
S— Unsaturation
C— Reaction Change
T— Reaction Stereo
L— Translation
(none)—Abnormal Valence
Viewing Indicators for an Atom or Bond
Except for the substituents query properties, the characters indicate that a given property is applied, but not the value
of that property.
To find the value of a query property setting:
1. Select the atom.
2. Do one of the following:
Select the atom, right-click, point to an atom, and point to the appropriate property.
Navigate to Structure>Properties and view the settings on the Atom Properties tab.
To display query indicators for an atom or bond:
1. Right-click the atom or bond.
2. Choose Show Query Indicator on the context menu.
Displaying Indicators for a Structure
To display query indicators for a structure:
Chapter 14: Query Structures
232 of 315
ChemDraw 15.0
1. Select the structure.
2. Right-click and navigate to Atom> or Bond>Show Query Indicator on the context menu.
Positioning Query Indicators
You can position a query indicator by either dragging it or entering a numeric value for the new location.
1. Right-click the indicator and choose Position. The Position Indicator dialog appears.
2. Click the appropriate Position option, and type a value:
To Position
Type a value for
From the atom or bond center to
Angle, degrees or clock, o’clock
indicator center
From the atom or bond center to
Offset, horizontal, and vertical
bottom left of indicator baseline
At specified coordinates
Absolute, horizontal, and vertical
Hiding a Query Indicators
To hide an indicator:
1. Right-click the indicator.
2. Choose Hide Indicator on the context menu.
Removing Atom Properties
To remove all properties from an atom:
1. Select the atom.
2. Navigate to Structure>Atom Properties.
3. Click Use Defaults.
To remove specific properties from an atom, do one of the following:
Right-click the atom. In the context menu, select Atom Properties and choose the properties to remove.
Navigate to Structure>Atom Properties and click the atom properties to remove.
With query indicators shown, click the query indicators using the Eraser tool.
Atom Property Options
The properties you can assign to atoms are described below.
Substituents
A substituent is defined as a non-hydrogen atom connected by a bond of any order. The substituents properties specify the number of substituents that may be bonded to the selected atoms.
Chapter 14: Query Structures
233 of 315
ChemDraw 15.0
For example, in the figure below, the carbonyl carbon (B) has a substituents count of two, the alpha carbon (A) and the
aldehyde oxygen. (hydrogen atoms are not counted). The aldehyde oxygen has only one substituent.
The substituent count atom property lets you specify the number of bonds to an atom in the target structure. This
includes bonds already drawn in the query structure.
The substituent options are:
Unspecified. Default. The target base determines the search. Some databases find compounds with any substitution at this atom; other databases (including DARC) find only compounds with substitution exactly as drawn.
Free Sites. Finds compounds in which the selected atoms may contain a range of substituents up to the number specified plus the number of bonds as drawn. A value of zero finds a substituent count as drawn. You can also use the
Free Sites symbol in the Query toolbar to apply free sites. In both the free site, or inexact substitution, you define the
maximum number of substituents an atom can have. The number you use in the inexact count must include the substitution(s) shown in the query structure, whereas, the free site count does not.
Up to. Finds compounds in which the selected atoms may contain a range of substituents up to the number specified.
Exactly. Finds compounds in which the selected atoms contain the exact number of substituents as specified, up to
15 substituents.
Note: You can specify a substituent count of up to ‘4’ using the ‘Substituents’ option from the context menu. To
specify a substituent count of up to ‘15’, select ‘Atom Properties’ option from the context menu. Clicking with the
free site tool selected increments the substituent count upto ‘9’ whereas <Alt>+click decrements the count.
For example:
Query
Finds
Does not find
Free site
Chapter 14: Query Structures
234 of 315
ChemDraw 15.0
Query
Finds
Does not find
Upto
Exact
Implicit Hydrogens
An implicit hydrogen is a hydrogen atom in which it, or its bond, is implied, but is not visible. An explicit hydrogen and
its bond are visible.
Figure 14.3: A) Examples of implicit hydrogens; B) An explicit hydrogen.
The implicit hydrogens property specifies whether additional, implicit hydrogen atoms may be attached to the selected atoms. If implicit hydrogen atoms are not allowed, all valences to that atom must be filled by bonds to non-hydrogen atoms.
Allowed. Default. Finds compounds regardless of whether hydrogen atoms are attached to the selected atoms.
Not allowed. Finds compounds with no additional hydrogen atoms attached to the selected atoms.
Ring Bond Count
The Ring Bond Count specifies the number of bonds attached to an atom that are part of rings of any size. For simple
cases, this also specifies the maximum number of rings in which an atom can reside.
Chapter 14: Query Structures
235 of 315
ChemDraw 15.0
Any. Default. Finds compounds in which the selected atoms can be a member of any type of ring, or a member of no
ring at all.
No ring bonds. Finds compounds in which the selected atoms are acyclic.
As drawn. Finds compounds in which the selected atoms reside in the same type and number of rings as drawn.
Simple ring. Finds compounds in which the selected atoms is a member of only one ring (the atom has two ring
bonds).
Fusion. Finds compounds in which the selected atoms lies at ring fusions (the atom has three ring bonds).
Spiro or higher. Finds compounds in which the selected atoms is a member of a spiro or higher linkage (the atom
has four or more ring bonds).
Unsaturation
The Unsaturation property specifies whether a multiple bond is attached to the selected atoms.
Unspecified. Default. Finds compounds regardless of whether a multiple bond is attached to the atom.
Must be absent. Finds compounds that do not have a multiple bond attached to the selected atoms.
Must be present. Finds compounds that have at least one multiple bond (double, triple or aromatic) attached to the
selected atoms.
Reaction Change
The Reaction Change property specifies whether a change occurs at selected atoms after a reaction. This property is
meaningful only when searching a database that contains chemical reactions. In ChemFinder, only the product atom
is checked. The stereo designation is ignored on reactants.
May be anything. Default. Finds all reactions regardless of any change to selected atoms after a reaction.
Must be as specified. Finds all reactions that are changed at the selected atoms exactly as specified by the reaction
center property in the Atom Properties dialog.
Reaction Stereo
The Reaction Stereo property specifies that the selected atoms are stereocenters in a reaction. This property is meaningful when only searching a database containing chemical reactions.
Chapter 14: Query Structures
236 of 315
ChemDraw 15.0
Figure 14.4: The reaction stereo indicator (circled).
Any. Default. Finds all compounds regardless of the stereochemistry at the selected atoms.
Inversion. Finds compounds in which the selected atoms have an inverted stereo configuration after a reaction.
Retention. Finds compounds whose selected atoms have an unchanged stereo configuration after a reaction.
Free Sites
Using free sites, you can specify the maximum number of substituents a result can have. However, it also requires
that the bonds in the results appear exactly as they appear in the query structure. ChemDraw uses the following notations for free-sites:
*0 (Zero free sites)
*1 (One free sites)
*2 (Two free sites)
*3-*15 (Three through fifteen free sites)
For example, assume you want to use the query structure below to search for as many as two substitutions on the
vinyl carbon atom while maintaining the bond pattern. Your query structure would look something like this:
Some of the results can include:
Figure 14.1: (E)-3-(4-aminophenyl)acrylic acid
Chapter 14: Query Structures
237 of 315
ChemDraw 15.0
Figure 14.2: 4-(cyclohexylidenemethyl)aniline
Figure 14.3: (E)-3-(4-aminophenyl)-2-phenylacrylic acid
To increase the number of free sites:
1. To display the query tools, navigate to View>Other Toolbars>Query Tools or click the Query Tools icon on the
Main Tool palette.
2. Click the Free Site tool on the Query tools palette.
3. Click the atom to which you want to apply free sites.
4. Continue to click the atom to increase the free site number.
To reduce the number of free sites, press <Alt> key while clicking the atom.
You can also change the free sites using the Atom Properties dialog or the shortcut menu. See "Atom Properties" on
page 231.
Translation
The Translation property specifies what is required to match in the structure query and possible database hits in a
Markush DARC query.
Equal. Default. Matches specific to specific or generic to generic terms.
Broad. Translates specific query atoms to corresponding superatoms in the database.
Chapter 14: Query Structures
238 of 315
ChemDraw 15.0
Narrow. Translates query superatoms to corresponding specific atoms or groups in the database.
Any. Translates generic or specific terms to any term.
For more information, see the Markush DARC User Manual.
Isotopic Abundance
The Isotopic Abundance property lets you distinguish different isotopic compounds—for example between mono- and
hexa-deuterobenzene—by specifying a nuclide at any location.
Note: The isotopic abundance property is available in ChemDraw Professional, and ChemDraw Prime only.
Unspecified. Default
Any. For ChemFinder, the same as default. Included for compatibility with other systems where the default may be
different.
Natural . Indicates an isotopically unmodified nuclide.
Enriched. Indicates a mixture of isotopically substituted and isotopically unmodified nuclides.
Deficient. Indicates a depleted label, that is, the nuclide is present in less than the natural ratio.
Nonnatural. Indicates an isotopically substituted nuclide, that is, essentially all the molecules of the compound have
only the indicated nuclide.
Abnormal Valence
The Abnormal Valence property specifies whether selected atoms can have a valence other than normal. “Normal”
valences for each element are defined in the Isotopes Table file in the ChemDraw Items folder.
Note: The Abnormal Valence atom property does not provide a visual indicator.
Not allowed. Default. Finds compounds where the selected atoms have only normal valences. If the Check Structure When Copying to Clipboard or Exporting preference is turned on, an error message warns of abnormal valences.
Allowed. Finds compounds with the specific valence drawn.
Note: If Abnormal Valence is allowed, any Invalid Valence messages for those atoms are ignored by the Check
Structure command.
Bond Properties
An indicator appears next to a bond for each property you assign.
Assigning Bond Properties
To define bond properties:
1. Select one or more bonds in a structure.
2. Do one of the following:
Right-click to open a context menu, point to Bond , point to the property you want, and choose the desired
options.
Chapter 14: Query Structures
239 of 315
ChemDraw 15.0
Navigate to Structure>Bond Properties. On the Bond Properties tab, select the properties from the dropdown list and click OK.
Point to bond and press the hotkey “/ ”. The Bond Properties dialog appears.
3. In the Bond Properties dialog, select the properties to associate with the selected atoms. Click OK.
For more information, see "Query Indicators" on page 232.
The indicators are:
Indicator
Bond Query Property
Any
"Bond Types" on page 241: Any
S/D
"Bond Types" on page 241: Single or Double
D/A
"Bond Types" on page 241: Double or Aromatic
S/A
"Bond Types" on page 241: Single or Aromatic
Rng
"Topology" on page 241: The bond must be part of a
ring.
Chn
"Topology" on page 241: The bond must be part of a
chain and not part of a ring.
R/C
"Topology" on page 241: The bond may be part of a
ring or chain.
Rxn
"Reaction Center" on page 241: The bond must be
part of a reaction center.
Viewing Bond Properties
The descriptor for the Reaction Center query property indicates the property is applied, but not the value of the property.
To find the value of a query bond property setting:
1. Select the bond.
2. Do one of the following:
Right-click to open a context menu, point to Bond Properties, and select to a property.
Navigate to Structure>Bond Properties.
Removing Bond Properties
To remove all query properties from one or more bonds:
1. Select the bonds.
2. Navigate to Structure>Bond Properties.
Chapter 14: Query Structures
240 of 315
ChemDraw 15.0
3. Click Use Defaults.
To remove specific bond properties:
1. Select the bond.
2. Do one of the following:
Right-click to open a context menu, point to the appropriate property, and click the property to remove.
Navigate to Structure>Bond Properties and click the bond property to remove.
Bond Property Options
The properties you can assign to bonds are described below.
Bond Types
This property specifies the bond type of the selected bonds.
The Default bond type corresponds to the current type of the bond (single, double, and so on.) as drawn.
Single (all) and Dative. Finds compounds with the bond type you select for the selected bonds.
Double or Double Bold. Finds compounds whose selected bonds are double.
Double Either. Finds compounds whose selected bonds are double bonds and have either cis/trans stereochemical
configuration.
Aromatic. Finds compounds whose selected bonds are aromatic.
Tautomeric. Finds compounds whose selected bonds are tautomeric.
Triple. Finds compounds whose selected bonds are triple.
Quadruple. Finds compounds whose selected bonds are quadruple.
Any. Finds any compound, regardless of the bond type of the selected bonds.
S/D. Finds compounds whose selected bonds are single or double.
D/A. Finds compounds whose selected bonds are double or aromatic.
S/A. Finds compounds whose selected bonds are single or aromatic.
Note: Not all bond types are supported in all file formats. When an unsupported bond type is saved to a given file
format, it is converted to the closest equivalent that is supported.
Topology
The Topology property specifies the ring environment of the selected bonds.
Unspecified. Default. Finds compounds regardless of topology.
Ring. Finds compounds where the selected bonds are part of a ring.
Chain. Finds compounds where the selected bonds are part of a chain (but not part of a ring).
Ring or Chain. Finds compounds where the selected bonds are part of either a ring or a chain.
Reaction Center
The Reaction Center property specifies how the selected bonds are affected in a reaction. This property is meaningful
only when searching a database containing chemical reactions.
Unspecified. Default. Finds compounds regardless of whether the selected bonds are affected by the reaction.
Chapter 14: Query Structures
241 of 315
ChemDraw 15.0
Center. Finds compounds where the selected bonds are affected by a reaction, but the type of change is unspecified.
Make/Break. Finds compounds where the selected bonds are either broken or created in a reaction.
Change. Finds compounds where the bond order of the selected bonds changes in a reaction.
Make & Change. Finds compounds where the selected bonds are formed, broken, or undergo a change in bond
order.
Not Center. Finds compounds where the selected bonds are not part of the reaction center.
Not Modified. Finds compounds where the selected bond’s orders do not change, but may (or may not) be part of the
reaction center.
Unmapped. Finds all compounds.
Element Lists
An element list is a list of atoms allowed at a specified location. For example, the query structure below allows bromobenzene, Iodobenzene, or chlorobenzene to be returned. An example of an element list is:
Figure 14.4: An element list as an atom label
The elements in the list must be separated by commas. A space after each comma and brackets are optional.
Note: An element list may contain only atomic symbols, plus D (deuterium) and T (tritium).
To create an element list:
1. Open an atom label text box.
2. Type an open bracket ("[") followed by a list of elements separated by commas (“Cl, Br, I”), followed by a close
bracket ("]"), for example: [Cl, Br, I].
3. Close the text box.
The figure below shows a query structure created to find compounds matching the following criteria:
Chapter 14: Query Structures
242 of 315
ChemDraw 15.0
(A) indicates that the atom must match any atom except hydrogen.
The Indicator (B) near the bond indicates that the bond must be single or double, S/D.
The element list (C) specifies that one of these elements must match in the target structures.
Element NOT Lists
The element not-list specifies that the elements in the list are not allowed in the search results. Commas must separate the elements in the element not-list. A space after each comma and brackets are optional.
The word NOT must be in all-caps and must be followed by a space. Alternatively, you can replace the word NOT
with a minus sign.
For example:
Figure 14.5: Element NOT lists
Note: An element not-list may contain only atomic elements, plus D (deuterium) and T (tritium).
To create an element NOT list:
1. Open an atom label text box.
2. Type an open bracket "[", the word NOT, and a space, for example: [NOT , followed by a list of elements separated by commas (“Cl, Br, I”), followed by a close bracket, “]”, for example: [NOT Cl, Br, I].
Polymers
You can indicate polymers using either brackets, parentheses, or braces that enclose repeating structures, or structural fragments. The bracket properties lets you specify the context and orientation of the repeating units.
For example:
Chapter 14: Query Structures
243 of 315
ChemDraw 15.0
To enclose structures with brackets:
1. To display the Bracket toolbar, navigate to View>Other Toolbars>Bracket.
2. On the Bracket toolbar, select one of the double bracket tools.
3. To draw the brackets, click and drag across the structure to enclose.
This gives default value for component order, multiple group repeat count, or single repeating unit label.
Setting Bracket Properties
To set the Bracket Properties:
1. Select a bracket.
2. Navigate to Structure>Bracket Properties. The Bracket Properties dialog appears.
The Flip Type option appears only for ladder polymers. See "Flip Type" on page 248.
You can customize the text that appears to the bottom right of the bracket for these bracket types:
Component (c#)—the component order must be a non-negative integer, and is displayed as the letter “c” followed
by an integer (or “c” alone if an order of zero is specified).
Multiple Group (#)—the repeat count must be a positive integer.
SRU (n)—the SRU label can be any text.
You can also edit the text for these bracket usage types in the document using the Text tool. You cannot edit the text
displayed for other bracket usage types.
Bracket Usage
Polymer Representations are either structure-based or source-based. The type of bracket you use depends on the
type of representation.
Structure-based Polymers
Structure-based representations enclose only part of a structure within brackets. One or more bonds cross each of the
enclosing brackets. The crossing bonds “match up”, making the polymer structure more explicit.
You represent a structure-based polymer by enclosing a portion of a structure in brackets with a bracket type of SRU
(n). IUPAC recommends the subscript “n” to denote structure-based representations of unknown size, but you can
edit the text using the text tool.
A structure-based representation of poly(vinyl chloride) is shown below:
Chapter 14: Query Structures
244 of 315
ChemDraw 15.0
You can also use the bracket usage types “Crosslink (xl)”, “Graft (grf)”, and “Modification (mod)” to represent types of
repeating units in a structure-based representation.
Source-based Polymers
Source-based polymer representations enclose a discrete chemical substance in brackets. The mode of polymerization may be obvious from context or be unknown. Source-based representations are useful when describing
processes where the starting materials are known, but the exact structure of the reaction product is not.
You can create a source-based representation by enclosing a structure in “Monomer (mon)” brackets.
A source-based representation of poly(vinyl chloride) is shown below:
You can use “Mer (mer)” brackets for components of a copolymer where those individual components are known not
to repeat themselves or they alternate with other components. For example:
Copolymers represent substances with more than one repeating unit. In general, you can use bracket type “Component (co)”. You can also use “Copolymer, alternating (alt)”, “Copolymer, random (ran)”, and “Copolymer, block (blk)”
to represent different copolymer types in a source-based representation.
The bracket type, “Mixture, unordered (mix)” may be used to represent a collection of substances that may all be
present, but not necessarily in known amounts. Bracket type “Component (c)” indicates each mixture element, as
shown below:
Chapter 14: Query Structures
245 of 315
ChemDraw 15.0
Figure 14.6: Brackets used to indicate mixtures
Bracket type “Mixture, ordered (f)” is primarily used to describe manufacturing processes, where component order is
critical. As with unordered mixtures, individual elements of an ordered mixture should be surrounded by brackets with
a bracket usage of “Component (c)”. However, components of ordered mixtures must be numbered to show their
order. You can do this by editing the “c” label with the text tool to include a number (“c1”, “c2”, and so on.)
Multiple Groups
You use the bracket type, “Multiple Group (#)” to indicate that the enclosed items are repeated a known number of
times. Multiple group brackets may enclose entire structures, or part of the structures. Some examples are:
Figure 14.7: Brackets to indicate multiple groups
Because multiple group brackets represent a specific repeat count, you can display the molecular weights (and
related data) for the enclosed structures in the Analysis window.
Chapter 14: Query Structures
246 of 315
ChemDraw 15.0
Repeat Pattern
For simple linear polymers, the repeating units may connect head-to-tail or head-to-head (or their repeat pattern might
be a mixture or unknown). You can also assign this property to brackets.
The head-to-tail type is the default repeat pattern, as shown below:
Figure 14.8: Head-to-tail repeat pattern. A and B represent the polymers shown. C represents a mixture of A and B.
Removing Bracket Usage Labels
To remove the bracket usage labels, do one of the following:
Hover on the label and press <delete>.
Use the Eraser tool to delete the label.
Note: Setting the bracket usage type to 'Unspecified' removes any specific bracket usage assignment.
Link Nodes
You can specify a variable-length chain, or ring, by indicating that one of the atoms can repeat a number of times
using link nodes.
Link nodes must have exactly two connecting bonds.
The atom label must meet these conditions:
It must consist of a generic name, or no more than one element symbol.
The last part of the label must be in the form: number hyphen number, with the numbers and hyphen subscripted.
Parentheses or braces can be used instead of brackets.
Note: ChemFinder supports only brackets,’[ ]’, for link nodes. Parentheses or braces cannot be used for link nodes in
ChemFinder.
Brackets can be omitted, if not required for clarity, for example with O1-3
Chapter 14: Query Structures
247 of 315
ChemDraw 15.0
To create a link node:
1. Open an atom label text box.
2. Type the link node in this format:
[CH2]3-7
Flip Type
For ladder polymers (polymers with two connecting bonds on each side) the connection order may be undefined. You
can assign the Flip Type property to define it. This property is only for brackets with exactly two crossing bonds.
Because of its prevalence, the No Flip type does not receive special annotation. The example below illustrates a flip
type in ladder polymers.
Alternative Groups
You can create a search query that contains variable functional groups or substructures. Instead of submitting multiple queries on structures that share a common substructure, you can submit a single query with the parent structure.
The parent structure can have attachment points to a list of alternative groups that you define.
Chapter 14: Query Structures
248 of 315
ChemDraw 15.0
Defining Alternative Groups
You can create alternative group definitions (R, G, and so on.) that represent a set of substituents, each of which is
used in the query.
To define alternative groups:
1. Navigate to View>Other Toolbars>Query Tools to open the Query toolbar.
2. Click the Alternative Group query tool and drag with the tool to create an area large enough to draw the alternative
groups.
3. Type a title, such as R1, in the Alternative Group Title box, and draw the substructure fragments in the Alternative
Group box.
Tip: You can draw the box afterward to enclose the list of alternative groups.
Chapter 14: Query Structures
249 of 315
ChemDraw 15.0
Figure 14.9: Defining an alternative group
Specify where the fragments should bond to the parent structure on the alternative group label by defining attachment
Points.
1. Do one of the following:
Select the diamond-shaped Attachment Point tool on the Chemical Symbols palette (View>Other
Toolbars>Chemical Symbols), and click a substructure fragment where you want to place the attachment point.
Point to a substructure fragment where you want to place the attachment point and press the hotkey “.” (period).
An attachment point symbol appears.
2. Repeat for all fragments.
Figure 14.10: Adding attachment points. An attachment point symbol has been applied to the nitrogen atom.
When you create a structure that contains an alternative group, an attachment point symbol appears next to the label.
The attachment point number matches that found in the definition.
Figure 14.11: Structure with R-group table
The number displayed in the attachment point symbol is the attachment rank order. See the example in "Multiple
Attachment Points" on page 251.
Chapter 14: Query Structures
250 of 315
ChemDraw 15.0
Multiple Attachment Points
You can use R-groups that contain more than one attachment point, for example:
For this type of R-group, you must indicate the attachment point order in your table . If you have well-defined multiple
attachment points on your structure fragments, you can search for specific materials. This type of search is useful for
finding similar structures that conform.
For example, assume you want to find compounds in figure A below, but not compounds in figure B.
Figure 14.12: Multiple attachment points
By specifying the attachment point order, you can exclude the unwanted compounds.
To specify the attachment points order:
1. Draw the structure shown below
2. Create an alternative group box labeled “R1”.
Chapter 14: Query Structures
251 of 315
ChemDraw 15.0
3. Draw the structure fragments and label them with attachment points.
When the alternative group definition is complete, the attachment point symbols appear in the parent compound.
Figure 14.13: R-groups with multi-attachment points
By numbering your attachment points, you specify that the methyl group must be adjacent to the amine group. The
conformations that are not of interest are excluded.
Attachment Point Numbering
Numbered attachment points let you specify how the structure fragments connect to your parent structure.
To set the order of the attachment points, use the Attachment Point tool to click the ends of the bonds in the order you
want.
To change attachment point order:
Click the attachment points with the Attachment Point tool.
Hiding Rank Indicators
You can hide the attachment rank indicators if required. For example, in publication-quality drawings the numbering of
attachment points is implicit and the numbered attachment rank indicators are superfluous.
To hide the attachment rank indicators and remove the numbers from the attachment points:
1. Navigate to File>Preferences.
2. In the Preferences dialog, click Building/Display.
3. Deselect Show Attachment Rank Indicators.
This change affects all documents.
Chapter 14: Query Structures
252 of 315
ChemDraw 15.0
The figure below shows an alternative group definition and a parent structure with the attachment rank indicators hidden.
Figure 14.14: Hidden attachment indicators
R-group reaction queries
You can search and store reactions. In a reaction, one or several compounds (reactants) are transformed into other
compounds (products). Individual reactants (or products) are separated from each other with plus signs. The reactants are separated from the products with an arrow.
You can also search for chemical reactions containing r-groups. An example of a chemical reaction containing rgroups is shown below:
Searching for reactants
Searching for reactants is useful if you have a known starting material and you are interested in learning more about
what substances it can produce. A reactants query is very similar to a reaction search, except that there is nothing to
the right of the arrow. For example, consider the query:
Chapter 14: Query Structures
253 of 315
ChemDraw 15.0
Figure 14.15: Sample r-group reactant query
A likely hit for the above query is shown below:
Searching for products
If you know the desired end product but not how to get there, you can do a products query. A products query is similar
to a reaction search, except that there is nothing to the left of the arrow. For example, consider the query:
Figure 14.16: Sample r-group product query
Anonymous Alternative Groups
Anonymous alternative groups are a cross between an element list and an alternative group. Element lists comprise
single elements, but anonymous alternative groups can contain any structure that can be represented by text, such as
nicknames and generic nicknames. Anonymous alternative groups are shortcut notations for regular alternative
groups, eliminating the need to specify a name, such as “R1”.
You can concisely define your search query using anonymous alternative groups. By labeling an atom position as a
list of substructures you specify that one of these substructures must match in the structure for which you are searching. Commas must separate the items in the anonymous alternative group. A space after each comma and the brackets are optional. Examples of anonymous alternative groups are shown below.
Figure 14.17: Anonymous alternative groups.
To create anonymous alternative groups:
Chapter 14: Query Structures
254 of 315
ChemDraw 15.0
1. Open an atom label text box.
2. Type an open bracket “[”followed by a list of elements, fragments, nicknames, or generic nicknames separated by
commas, followed by a close bracket “]”.
Expand Generic Structures
You can generate multiple structures from an abbreviated combinatorial structure with the Expand Generic Structure
tool. The tool is limited to 500 generated structures. For large combinatorial expansions, use CombiChem for Excel.
Four kinds of abbreviated combinatorial definitions may be used:
Definition
Example
Alternative Groups and
R-tables
Anonymous Alternative Groups
Element
Lists
Variable
Attachment
Chapter 14: Query Structures
255 of 315
ChemDraw 15.0
Definition
Example
Definitions are expanded into multiple complete molecules. If more than one site is present in the selection, the expansion includes all permutations of substitutions. Expansions are generated in a new document.
To expand a generic structure:
1. Select one or more generic structures to expand.
Note: For alternative group/R-tables, you must select the alternative group label and the table must be selected. If
the label is selected but not the table, the label will not change in the expansion, and will appear as a label in all generated structures.
2. Navigate to Structure>Expand Generic Structure.
The structures are generated in a new document.
R-Logic Queries
After you have your generic structure and a set of R-groups, you can use them to run queries against a structure database. This is called an R-Logic query.
When you run an R-Logic query, you search for structures that all have the generic structure and a combination of your
R-groups. The combinations are based on a Boolean expression that you define. To prepare an R-Logic search, navigate to Structure>R-Logic Query to open the R-Logic Query dialog.
To define a query, select one or more R-groups in your structure and how many times it must occur. You can indicate
that if the first R-group condition is met, another R-group must also be found before the structure is returned as a result. For example, consider this query structure:
Chapter 14: Query Structures
256 of 315
ChemDraw 15.0
This structure indicates that both R sites must consist of either a fluorine or chlorine atom and that the R site must
1
2
be either a bromine or iodine atom.
Assume you want to find all structures in your database that have either a F or Cl atom at both R locations and either
1
Br or I at R :
2
1. Navigate to Structure>R-Logic Query.
2. In the R-Group drop down list, select R .
1
3. For Occurrence range, select 2. This indicates that two instances of an R group must occur in a structure for it to
1
be returned as a result.
4. For If R(i), select R . This indicates that the R location must consist of either Br or I.
2
2
5. Click Add.
6. Click OK.
Rest H
Select Rest H in the R-Logic Query dialog to indicate that if you have two possible R-group locations, and only one is
filled, the other must be a hydrogen to return a positive result.
Atom-to-Atom Mapping
You can create correspondences between atoms in different structures for searching a reaction database. The reactions mapped can be single or multi-step. A drawing that includes atom-to-atom mapping can be added to a database
or be used to search.
You can assign atom mapping in two ways:
Automatic mapping (navigate to Structure>Map Reaction Atoms).
Manual mapping, using the Reaction Atom-Atom Map tool on the main tools palette.
Using either method, ChemDraw assigns a reaction center for the reactants and products.
Chapter 14: Query Structures
257 of 315
ChemDraw 15.0
When a reaction map is established, you can point to an atom in one structure with the Reaction Atom-Atom Map tool
to highlight the mapped atom in the other structure.
Displaying and Printing
To display reaction mapping symbols on screen and in print:
1. Navigate to File>Preferences.
2. In the Preferences dialog, click the Building/Display tab.
3. Select Always Display and Print Reaction Mapping.
4. Click OK.
Deselect Always Display and Print Atom Mapping to show the symbols only when you select the Reaction AtomAtom Map tool. The symbols do not print.
Automatic Mapping
To create a reaction map:
1. Select the reaction.
Tip: Double-click the arrow with a selection tool to select the reaction.
2. Navigate to Structure>Map Reaction Atoms.
The symbol Rxn appears next to the bonds in the reactant and product that are modified by the reaction. For more
information about the Reaction Center bond property, see "Bond Properties" on page 239.
Figure 14.18: Automatic reaction mapping
Manual Mapping
When manual atom-to-atom mapping is required, you can use the Reaction Atom-Atom Map tool. This might be necessary when the automatic mapping is applied to complicated reactions, but gives incorrect results. In these cases you
Chapter 14: Query Structures
258 of 315
ChemDraw 15.0
can manually readjust the reaction mapping.
The figure below shows the initial mapping being amended by using the Reaction Atom-Atom Map tool.
Figure 14.19: Automatic mapping to be amended
When you manually map reactions with the Reaction Atom-Atom Map tool, you can suppress automatic re-mapping
of atoms other than your target atom.
To suppress automatic remapping:
1. Navigate to File>Preferences.
2. On the General tab, de-select Automatic Reaction Mapping.
3. Click OK.
To use the Reaction Atom-Atom Map tool to supplement the automatic mapping:
1. Click the Reaction Atom-Atom Map tool on the Query toolbar.
2. Point to the atom in the reactant whose mapping you want to establish. For example, in the following drawing you
would point to the acyclic carbon adjacent to the ether oxygen.
3. Drag from the reactant atom to the corresponding product atom.
The remaining atoms are mapped based on the manual mapping.
Chapter 14: Query Structures
259 of 315
ChemDraw 15.0
Figure 14.20: Finalized mapping
You can set or change the mapping for other atoms in the reaction.
Clearing Reaction Mapping
To clear reaction mapping:
1. Select the structures whose mapping you want to clear.
2. Navigate to Structure>Clear Reaction Map.
Clicking and dragging from any atom to an empty space in the ChemDraw window using the Reaction Atom-Atom
Map tool will clear the mapping from that atom.
Exporting Reaction Mapping
Reaction mapping and reaction center perception information are stored in the *.cdx file format. You can open the file
in ChemDraw for transfer to other applications that read atom mapping, such as ChemFinder. You can also copy
mapped reactions to these same applications using the Clipboard.
Stereochemical Symbols
There are three types of flags that indicate stereochemistry:
Racemic. A racemic mixture.
Absolute. A pure enantiomer of known configuration.
Relative. A pure enantiomer of unknown configuration.
The default atom label size for the document determines font and size for stereochemical flags.
To draw a stereochemical flag:
Chapter 14: Query Structures
260 of 315
ChemDraw 15.0
1. To display the Query tools, navigate to View>Other Toolbars>Query Tools, or click the Query Tools icon on the
Main Tool palette.
2. On the Query tools palette, click the tool for the flag you want to use.
3. Click next to the structure to which you want to assign the flag.
3D Properties
3D queries are useful in pharmacophore searching when looking for a 3D relationship among atoms and bonds, (for
example in a series of potential receptor ligands). To create a 3D query, you add geometries (lines, planes, and so on)
and constraints (specified as ranges) to a query structure. For example, you can specify that two atoms must be
between 4 and 5 Å apart, or that two planes must be separated by 80-100 degrees.
To assign 3D properties to a structure:
1. Select the structure or substructure.
Note: Because some 3D properties specify an order, use SHIFT+Click to select them in the order you want.
2. Navigate to Structure>Add 3D Property and select an option from the table below.
Note: In the table, points may be atoms, centroids, or points. Lines may be lines or normals.
Angle. Defines an angle constraint between three points (in order). Indicated as a range.
Dihedral. Defines a dihedral (torsional) angle constraint among four points (in order), between two lines, or two
planes. Indicated as a range.
Distance. Defines a distance constraint between two points, a point and a line, or a point and a plane. Indicated as a
range, in angstroms.
Line. Defines the best-fit line for the selected points.
Plane. Defines the best-fit plane for the selected points, or for a point and a line.
Exclusion Sphere. Defines an exclusion sphere around a point. If more than one point is selected, the exclusion
sphere is around the first selected point, and the subsequent points are allowed within the exclusion sphere when the
query is evaluated. Indicated as a range, in angstroms, beginning at 0.
Normal. Defines the normal from a defined plane in the direction of a point.
Point. Defines a point positioned at a specified distance from a first point in the direction of a second point (in order),
or in the direction of the normal.
Centroid. Defines a point positioned at the average position of all other points selected.
Note:
All constraint values can be edited with the text tool. Only exclusion spheres show the change.
When you create a point, a dialog appears where you specify the distance from the first selected point to the calculated point. The distance may be an absolute value in Å or a percentage of the distance between the selected
points.
Chapter 14: Query Structures
261 of 315
ChemDraw 15.0
Negative values indicate that the calculated point is further from the second point than the first point is, rather
than between them.
Geometry and constraint objects update when you change the structure; they cannot be moved independently.
They may be used with CDX, MOL, SKC, and TGF files (full read-write compatibility); they are not compatible
with other formats.
They can, however, be saved in print-only formats such as TIFF.
Export Compatibility
Because query properties are useful only in a chemical database, you must transfer your structures from ChemDraw
into your search system. Not all file formats support the same query properties and not all chemical databases support the same file formats. Consult the documentation for your database for which file formats are supported.
The following table lists the query properties that ChemDraw writes to SKC, TGF, and Clipboard file formats. The
CDX format retains all query properties.
.
Exported Query Properties
ISIS™
Mol
Rxn
X
X
X
Free Sites
b
b
b
Up to
a
a
a
Exactly
Xc
Xc
Xc
Not allowed
X
X
X
Allowed
X
X
X
Any
X
X
X
No ring bonds
X
X
X
As drawn
X
X
X
Simple ring
X
X
X
Fusion
X
X
X
Spiro or higher
X
X
X
Atom Properties
Substituents
Unspecified
Implicit Hydrogens
Ring Bond Count
Chapter 14: Query Structures
262 of 315
ChemDraw 15.0
Exported Query Properties
ISIS™
Mol
Rxn
X
X
X
X
X
X
Unsaturation
Unspecified
Must be absent
Must be present
Reaction Change
May be anything
X
X
Must be as specified
X
X
Any
X
X
Inversion
X
X
Retention
X
X
Reaction Stereo
Translation
Equal
Broad
Any
Narrow
Abnormal Valence
Not Allowed
X
X
X
Allowed
X
X
X
Single
X
X
X
Dashed
X
d
X
Hashed
d
d
d
Wedged Hashed
X
X
X
Bond Properties
Bond Type
Chapter 14: Query Structures
263 of 315
ChemDraw 15.0
Exported Query Properties
ISIS™
Mol
Rxn
Bold
X
e
e
Wedged
X
X
X
Wavy
X
X
X
Hollow Wedged
e
e
e
Dative
f
f
f
Double
Xg
X
X
Double Either
X
X
X
Double Bold
h
h
h
Aromatic
X
X
X
Tautomeric
i
i
i
Triple
X
X
X
Quadruple
l
l
l
Any
X
X
X
S/D
X
X
X
D/A
X
X
X
S/A
X
X
X
Unspecified
X
X
X
Ring
X
X
X
Chain
X
X
X
Topology
Reaction Center
Unspecified
X
X
Center
X
X
Make/Break
X
X
Change
X
X
Chapter 14: Query Structures
264 of 315
ChemDraw 15.0
Exported Query Properties
ISIS™
Mol
Rxn
Make&Change
X
X
Not Center
X
X
Other Query Attributes
Generic Nicknames
Xj
Xj
Xj
Element Lists
Xko
Xko
Xko
Element Not Lists
Xk
Xk
Xk
Alternative Groups
X
Xm
Anonymous Alternative
Groups
n
n
Link Nodes
p
p
p
Bracket properties
X
X
X
Atom-Atom mapping
X
X
Variable Attachment Positions
3D query properties
a—Converted to the appropriate number of exact substituents.
b—Free sites counts of zero translated to “Substitution as drawn”; all other free sites values written as substitution
counts equal to the total current valence, plus the free sites value.
c—Substituent counts of greater than 5 are translated to “6 or more”.
d—Converted to wedged hashed.
e—Converted to wedged.
f—Converted to a single, with a positive charge applied to that atom at the base of the dative bond and a negative
charge applied to the atom at the point of the dative bond.
g—Interpreted by ISIS™ as unspecified cis/trans stereochemistry.
h—Converted to double.
i—Converted to aromatic.
j—Only M, X, Q, A; others written as aliases.
k—Truncated to the first 5 elements.
l—Converted to single.
m—An RG file will be created automatically.
n—Converted to non-anonymous alternative groups.
Chapter 14: Query Structures
265 of 315
ChemDraw 15.0
o—Lists of greater than 5 elements converted to alternative groups.
p—The low end of the repeat range is always treated as 1.
Chapter 14: Query Structures
266 of 315
ChemDraw 15.0
Sharing Information
Many of the system commands you commonly use to transfer content from one place to another can also be used in
ChemDraw:
Copy/paste
Import and export content files
When you use the clipboard, the objects you copy can be edited.
The Clipboard
You can use the clipboard to transfer part, or all, information within an active document window between applications
on the same computer or on a network. Use the standard copy-and-paste or cut-and-paste tools to transfer information
to any application that supports these tools. The information is transferred as a drawing object. Double-click the object
to edit it in ChemDraw.
You can also use the Copy As tool to translate a selected structure to a SMILES, SLN, or InChI™ string.
If the Clipboard contains structures and you paste into another ChemDraw document, the pasted information is
scaled to the settings in the new document. For more information, see "Autoscaling" on page 270.
Text Line Notation
Use text line notation1 to expand a line of text into the structure that it represents. Several software packages use
SMILES strings to enter and store chemical structure information.
If you select a reaction and use the Copy As SMILES command, a SMIRKS string is copied to the clipboard. If you
use the Paste Special SMILES command when a SMIRKS string is on the clipboard, a reaction is pasted into your
document.
Creating SMILES Strings
To create the SMILES string for a structure:
1. Select the structure.
2. Navigate to Edit>Copy As>SMILES.
The SMILES string is transferred to the Clipboard.
To display the SMILES string, paste the string in a document window.
When the SMILES string is on the Clipboard, you can transfer it to another application that can interpret SMILES
strings.
If you copy more than one structure from ChemDraw to the Clipboard, the SMILES string are separated by a period.
SMILES supports an alternate notation for aromatic structures using lowercase letters. ChemDraw generates this
type of SMILES string for any structure drawn with explicit aromatic bonds.
1A SMILES string is a line of text that represents the structure of a molecule. A SMIRKS string describes chemical reac-
tions in text.
Chapter 15: Sharing Information
267 of 315
ChemDraw 15.0
Pasting SMILES
To paste a SMILES string as a structure:
1. Select the SMILES string in the source file and press CTRL+C.
2. From ChemDraw, navigate to Edit>Paste Special> SMILES.
Creating SLN Strings
You can copy a structure to the Clipboard as an SLN string for export to other applications.
To copy a structure as an SLN string:
1. Select a structure.
2. Navigate to Edit>Copy As>SLN.
The Structure is copied to the clipboard as an SLN String.
Creating InChI™ Strings
ChemDraw supports IUPAC International Chemical Identifier (InChI™)
l.
To copy structures as InChI™ strings to other documents:
1. Select the structure.
2. Navigate to Edit>Copy As>InChI.
You can copy only legitimate InChI™ structures. If you attempt to copy a structure that the InChI protocol does not
support, a warning informs you that the structure is not supported.
Creating InChIKey Strings
ChemDraw supports Standard InchIKey, available in InChI 1.02. An InChIKey string is a condensed digital representation of an InChI string. All InChiKey strings are the same length whereas InChI strings are not. This standard
makes InChIKey strings useful for Web searching and database indexing.
To copy a structure as an InChIKey string to other documents:
Chapter 15: Sharing Information
268 of 315
ChemDraw 15.0
1. Select the structure.
2. Navigate to Edit>Copy As>InChIKey.
For more information on InChI™ and InChIKey, see www.iupac.org/inchi/.
Creating CDXML, MOL or MOL V3000 Text
To create the CDXML text or MOL text or MOL V3000 text for a structure:
1. Select the structure you want to create the CDXML, MOL or MOL V3000 text for.
2. Navigate to Edit > Copy As > CDXML Text or MOL Text or MOL V3000 Text.
The CDXML text or MOL text or MOL V3000 text is transferred to the clipboard.
Pasting CDXML or MOL Text or MOL V3000 Text
The Paste Special>MOL/CDXML command parses text on the clipboard, and pastes the resulting structure of any
MOL or CDXML formats it finds into the document.
To paste and display the CDXML text or MOL text or MOL V3000 text from the clipboard to the document window:
3. Navigate to Edit > Paste Special > MOL/CDXML Text.
Scrap and Clipping Files
You can use scrap files to copy parts of a drawing to other applications after saving the file in ChemDraw.
To create a scrap or clipping file:
Chapter 15: Sharing Information
269 of 315
ChemDraw 15.0
1. Select an object in a document.
2. Drag the selection out of the document window onto the desktop. The file appears on the desktop.
To view the file contents, double-click its icon. To use contents in a document, drag the file into an open window of an
application that supports drag-and-drop.
Transferring Objects
This section explains behaviors of certain features in ChemDraw when you transfer objects using the clipboard, or
drag and drop from one document to another.
Autoscaling. Objects that you transfer are scaled to match the settings of the destination document.
Bonds. When you copy or move a structure to another document, the structure adopts the new document’s fixedlength value, but retains its scaling factor.
For example, assume the fixed length is set to 1.0 cm in a source document. A benzene ring is resized to 200%. The
bond length is then 2.0 cm. In the destination document, assume the fixed Length set to 1.7 cm. When the benzene
ring is pasted into the destination document, the bonds are scaled by a factor to 200% to a final bond length of 3.4 cm.
Atom Labels. Atom labels are scaled the same way as bonds. For example, in the source document, assume the
atom label font size is set to 16 points. One or two atom labels in the source document are resized to 8 points, a ratio
of 8:16 or a scale factor of 0.5. Assume that the destination document has an atom label font size set to 14 points. If
you paste the atom label into the destination document, the font size is scaled by a factor of 0.5 to give a final atom
label font size of 7 points.
Captions. ChemDraw autoscales captions using the ratio of the fixed length in the destination document to the fixed
length in the source document times the caption font size. The font size of the caption can be any size and is not
related to the setting in the Settings dialog. This ensures that captions are always in proportion to the bonds with
which they are pasted.
For example, if the source document has a fixed length of 1.0 cm and the destination document has a fixed length of
2.0 cm, and the caption you are pasting is 12 points, then the resulting caption size after autoscaling is (2.0 cm /1.0
cm) x 12 points = 24 points.
Non-bond Objects and Color. The document settings do not affect all objects. Objects such as arrows and boxes,
are scaled to maintain the same proportions to bonds that were in the source document.
Except for the foreground and background color, the colors present in the selection to be pasted are added to the destination document’s Color palette if they are not already (up to 20 total colors). The background color in the destination
document remains, and all objects colored using the foreground color are changed to match the foreground color in the
destination document.
Pasting to an Empty Document. If you paste a ChemDraw drawing into an empty document that has different settings, the Change Settings dialog appears.
To change the settings in the destination document to match the settings in the source document, click Change Settings.
Chapter 15: Sharing Information
270 of 315
ChemDraw 15.0
All of the settings in the destination document are changed to match those of the source document. All of the colors in
the Color palette of the destination document are changed to those specified in the source document.
To scale the objects from the source document to the settings in the destination document, click Don’t Change Settings.
The settings from the source document are scaled to those in the destination document using the ratios given above.
Note: If the source document was created in a ChemDraw version earlier than 3.0, the name of the document
appears as “Unknown” in the dialog box.
Embedding Objects
ChemDraw supports the Object Linking and Embedding (OLE) protocol on Windows. This lets you edit structures that
are pasted in other types of documents. ChemDraw is an OLE server, which means it can create OLE objects that
you can copy and paste into other OLE client applications.
When you transfer drawing from ChemDraw to another document type that supports OLE, you can open and edit the
drawing within the new application.
For example, to edit a drawing inserted into Microsoft Word 2003 or later, do one of the following:
In Microsoft Word, select the drawing and navigate to Edit>CS ChemDraw Drawing Object.
Double-click the drawing.
The ChemDraw tools and menus replace those of Word. Use the tools to edit the drawing.
When you finish making changes, click in another area of the Word document. The Word tools and menus are
restored.
Exporting
You can export ChemDraw drawings in various file formats and open them in other applications. Conversely,
ChemDraw recognizes a variety of file formats and can open documents from other applications.
To export a file:
1. Navigate to File>Save As.
2. In the Save As dialog, do the following:
a. Type a name for the file and a location to save it to. Click Go To ChemDraw Items to locate the ChemDraw
Items folder.
b. Select a file format.
c. Click OK.
Some file formats do not support atom labels that contain nicknames or structural fragments. When you save in these
formats, ChemDraw expands all atom labels and saves the file using the expanded form.
These formats do not support nicknames or structural fragments:
Connection Table
MSI MolFile
SMD
Chapter 15: Sharing Information
271 of 315
ChemDraw 15.0
Note: Some versions of ChemDraw do not support all the formats listed.
Some formats can be saved with different options. If a format has no save options, Options is grayed out. These textbased formats can use the Text Options:
ChemDraw XML
CML
Connection Table
ISIS/TGF
ISIS/Reactions
MDL MolFile
Accelrys MolFile
SMD
Other format options are noted in format descriptions.
Importing
You can import graphics or documents from other applications into ChemDraw.
Objects
Inserted objects are OLE files and can be resized and rotated but not flipped. You also can edit it in its native application from within the drawing window.
Files
Files that you insert become part of the drawing. You can edit a file only if it is in a ChemDraw format.
To insert a file:
1. Navigate to Edit>Insert File.
2. In the Open dialog, select the file type from the drop-down list.
3. Select the file and click Open. The file is embedded in the drawing.
To insert an object:
1. Navigate to Edit>Insert Object.
2. In the Insert Object dialog, click Create from File.
3. Browse to the object file and click OK.
Note: You will get an error message if you choose a file type that ChemDraw does not support (such as TXT).
To create an object:
1. Navigate to Edit>Insert Object.
2. Click Create New.
3. Select the Object Type.
Chapter 15: Sharing Information
272 of 315
ChemDraw 15.0
4. Click OK.
ISIS™ Compatibility
ChemDraw Professional, and ChemDraw Prime support ISIS/Sketch including R-Logic and leaving groups.
Attached Data
Using field names, you can attach text to objects such as atoms and bonds. The feature is compatible with the “Data
SGroup” in MDL formats, and is converted to Data SGroups when saved in MDL formats if a field name is specified
and it is attached to a collection of atoms and bonds, or single set of brackets.
When attached to a collection of atoms and bonds and a set of brackets, a field name is converted to two different
Data SGroups.
To attach data to an object:
1. Select the object.
2. Navigate to Object>Attach Data.
The Attach Data dialog box appears.
3. Enter the field name and click OK.
4. Enter the data in the text box under the object.
Note: You cannot edit field names in ChemDraw. While ChemDraw allows any field name length, MDL formats
have their own restrictions. Likewise, ChemDraw allows data to be attached to any object. When saving to MDL
formats, data is lost unless the object meets the conditions noted above.
Modifying Attached Data
Two additional commands appear on the context menu when you select attached data.
Select Linked Objects: Changes the selection to include all of the objects associated with the data.
Position: Lets you position the data relative to the associated structure.
Note: Positioning information is lost whenever you save to MDL formats.
Graphics Export Border Preference
You can specify the border size when exporting pictures. This preference affects the output of all graphical formats,
such as: WMF, PICT, EPS, TIFF, GIF, BMP, and PNG. It applies to the clipboard and saved files. The default value
is 2 points (0.278 in; 0.071 cm).
File Formats
The file formats available in ChemDraw are:
Format
Windows
ChemDraw (CDX)
YES
Chapter 15: Sharing Information
273 of 315
ChemDraw 15.0
Format
Windows
ChemDraw XML (CDXML)
YES
ChemDraw (CHM)
YES
ChemDraw Style Sheets (CDS)
YES
Connection Table (CT)
YES
Chemical Markup Language (CML)
YES
Bitmap (BMP)
YES
TIFF file (TIF)
YES
Graphic Image Format (GIF)
YES
ISIS (SKC, TGF, RXN)
YES
JCAMP (JDX, DX)
YES
JPEG (JPG, JPEG)
YES
MDL SDfile (SDF)
YES
MDL MolFile (MOL)
YES
MSI ChemNote (MSM)
YES
PNG Image (PNG)
YES
Standard Molecular Data 4.2 (SMD)
YES
Galactic Spectra (SPC)
YES
Windows Metafile
YES
(WMF)
EnhancedMetafile (EMF)
YES
ChemDraw Templates CTP)
YES
ChemDraw Templates Style sheets (CTS) YES
PDF
NO
MDL Molfile V3000 (MOL)
YES
MDL SDfileV3000 (SDF)
YES
Reaction Molfile V3000 (RXN)
YES
Chapter 15: Sharing Information
274 of 315
ChemDraw 15.0
Format
Windows
PICT
PICT Scaled 4x
NO
Encapsulated PostScript
YES
Scalable Vector Graphics
YES
ChemDraw supports importing and exporting the file formats listed below. To export in one of these formats, use the
Save As... option. Not all formats are supported in all ChemDraw products. Refer to "Importing" on page 272.
Format
Import Export
ChemDraw (CDX)
YES
YES
ChemDraw XML (CDXML)
YES
YES
ChemDraw 3.5 (CHM)
YES
YES
ChemDraw 2.0 and ChemDraw 2.1 (CHM)
YES
NO
ChemDraw Template (CTP)
YES
YES
ChemDraw Template Style Sheet (CTS)
YES
YES
ChemDraw Style Sheets (CDS)
YES
YES
Connection Table (CT)
YES
YES
Chemical Markup Language (CML)
YES
YES
Bitmap (BMP)
YES
YES
PostScript (EPS)
NO
YES
Graphic Image Format (GIF)
YES
YES
ISIS (SKC, TGF, RXN)
YES
YES
JCAMP (JDX, DX)
YES
NO
JPEG (JPG, JPEG)
YES
YES
MDL MolFile (MOL)
YES
YES
MDL RGFile (MOL)
YES
YES
MDL V3000 MolFile (MOL)
YES
YES
Chapter 15: Sharing Information
275 of 315
ChemDraw 15.0
Format
Import Export
MDL SDfileV3000
YES
YES
MSI ChemNote (MSM)
YES
YES
Portable Network Graphics (PNG)
YES
YES
Standard Molecular Data (SMD)
YES
YES
Structure Data file (SDF)
YES
YES
Galactic Spectra (SPC)
YES
NO
Windows Metafile
YES
YES
Scalable Vector Graphics (SVG)
NO
YES
Portable Document Format (PDF)
YES
YES
Tagged Image File (TIF, TIFF)
YES
YES
(EMF, WMF)
Transferring Across Platforms
You can can open cdx files in either ChemDraw for Macintosh, or Windows. When you transfer files across platforms,
fonts are not transferred. If a font in the transferred document is not available, ChemDraw substitutes fonts for those
that are available on the new platform.
Chapter 15: Sharing Information
276 of 315
ChemDraw 15.0
Chemical Interpretation
ChemDraw converts lines, characters, and other symbols into chemically meaningful figures as you work. This
occurs in the background, but you can also choose to view this chemical data. ChemDraw uses the data when exporting to file formats that support only a subset of the notations that ChemDraw does.
This section describes how ChemDraw interprets drawings.
Database Conventions
Most databases require not only that you draw a structure in a way that makes sense, but that you draw it in the way
that the database expects it. Consider ferrocene, which is represented in at least four different ways in major databases:
Figure 16.1: Representations of ferrocene
Chapter 16: Chemical Interpretation
277 of 315
ChemDraw 15.0
A successful search in one database might not produce results in another. When in doubt, consult the documentation
for the conventions your database uses.
Bond Conventions
The following table describes the chemical conventions ChemDraw recognizes.
Bond
Description
Single bond, unspecified stereo-chemistry.
Single bond, “down” stereochemistry (into the plane of the paper, away from the viewer), from
the first drawn atom to the second drawn atom.
Single bond, “up” stereochemistry (out of the plane of the paper, toward the viewer), from the
first drawn atom to the second drawn atom.
Single bond, mixture of “up” and “down” stereochemistries in some unspecified proportion.
Dative bond. Often used to indicate polar bonds, such as the N-O bond in pyridine N-oxide.
Double bond, with cis/trans stereochemistry as drawn.
Double bond, with cis/trans stereochemistry unknown.
Tautomeric bond, either single or double according to rules of tautomerism.
Aromatic bond, part of a delocalized resonance system.
Triple bond.
Quadruple Bond.
A single bond near a closed circle is recognized as aromatic:
Chapter 16: Chemical Interpretation
278 of 315
ChemDraw 15.0
Atom Labels
A simple atom label may contain any of the following:
A single element.
An element and some number of hydrogen atoms.
A nickname.
Repeating units within parentheses.
A series of any combination of the above.
ChemDraw analyzes atom labels from left to right, applying standard valence rules to determine which atoms are bonded together. The exception is with an atom label in Automatic alignment on the left side of a compound. This type of
atom label is displayed in reverse (H3CO instead OCH3) and is parsed from right to left. Standard valences for each
atom are defined in the Isotopes Table.
By definition, a “simple” atom label has all bonds attached to the first (or last) character. A multi-attached atom label
has bonds connected to more than one character, or has all of its bonds attached to a character in the middle of the
atom label. Multi-attached atom labels are always parsed from beginning to end, but the beginning might be on the
right if the atom label was in Automatic style and on the left side of the original structure:
Chapter 16: Chemical Interpretation
279 of 315
ChemDraw 15.0
A multi-attached label that is parsed from left to right.
A multi-attached label that is parsed from right to left.
A bond attached to the open parenthesis of a repeating
group is treated as if bonded to the first of those groups.
A bond attached to the close parenthesis or repeat count of
a repeating group is treated as if bonded to the last of those
groups.
Multiple fragments within a single label can be specified:
Implicitly, using standard valence rules.
Explicitly, using a space, period (unsuperscripted or unsubscripted), bullet, or combination.
An unsuperscripted, unsubscripted integer at the start of a fragment is recognized as a stoichiometric multiplier and is treated as
if the appropriate number of fragments were drawn explicitly.
Chemically Significant Text
Often, it is simpler to write a chemical formula like MeOH or H2O than to draw an atoms-and-bonds structure.
ChemDraw interprets any unambiguous structural formula. For example, CH3COCH2CH3 is recognized as methyl
Chapter 16: Chemical Interpretation
280 of 315
ChemDraw 15.0
ethyl ketone and MeOH is recognized as methanol. On the other hand, C6H6 might mean benzene, or another isomer.
Generally, empirical formulas (C2H6 and H2SO4) are not recognized, but structural formulas (CH3CH3 and
HOSO2OH) are.
Molecular weight and elemental analyses of empirical structures are possible, but the Expand Label command does
not work with them. Empirical structures are discarded when they are transferred to other applications that require
unambiguous structures.
Chemically-significant text must be entirely in formula or, for isotopes and charges, superscript style. ChemDraw
does not recognize a chemical formula embedded within a larger block of text.
If you draw a bond, add an atom label, and then delete the bond, you
have a chemically meaningful text block whose font, size, and style
match other atom labels.
If you create a caption with the text tool and set it to Formula style,
you have a chemically meaningful text block whose font, size, and
style match other captions.
Charges
You can create charges as part of a atom label or with the appropriate symbol from the Chemical Symbols toolbar.
Charges are always assigned to a specific element in the atom label, whose acceptable valences become those of
the similar isoelectronic neutral element
.
A charge following an element is assigned to that element.
A charge that does not follow an element is assigned to the next element.
Charges that follow a monovalent element with a repeat count are
assigned to the element before that element.
Charges that follow other repeating units are distributed among those
Chapter 16: Chemical Interpretation
281 of 315
ChemDraw 15.0
units.
Charges may be superscripted.
Multiple charges are recognized appropriately.
Charges may have repeat counts as long as both the charge and the
repeat count are superscripted.
A “floating” charge placed with the Chemical Symbols Tool is assigned to
the nearest atom. If no atom is within the distance set as the Fixed Length,
the charge is ignored and not assigned to any atom.
A “floating” charge placed within a delocalized system is recognized by the
Analyze Structure function, but is discarded when saved to formats that
require all charges to be associated with specific atoms.
Isotopes and Elements
By default, all isotopes are recognized in the full Table of the Elements. This data is provided by CRC Press, Inc. Isotopes are defined in the Isotopes Table file. You can edit this file in any text editor to add new isotopes.
A super-scripted number before the element symbol indicates isotope numbers.
Isotopes can be included anywhere that regular elements can.
Deuterium and Tritium appear as one-letter symbols.
Chapter 16: Chemical Interpretation
282 of 315
ChemDraw 15.0
Radicals
Radicals are indicated with the appropriate symbol from the Chemical Symbols palette. As with charges, they are
assigned to the nearest atom. Radicals always occupy one free valence, in addition to any charge effects. Two
examples are:
Note: The lone pair symbol is interpreted as a diradical when it is placed next to an unlabeled carbon atom.
H-Dot/H-Dash
H-Dot and H-Dash symbols from the Chemical Symbols palette indicate the stereochemistry of a single hydrogen
atom. These symbols are most common in fused systems, such as below:
Complexes
Compounds with electron pairs can act as Lewis bases, bonding with Lewis acids that are electron-deficient. Similar
behavior can be seen between lone pairs and metals.
The best representation of these types of interaction is with a dative bond from the electron-pair donor to the acceptor.
Using a plain bond instead of the dative bond, will cause a valence error. The dative bond more accurately represents
the electron donation.
Complexes may also be represented with explicit lone pairs and without any bonds.
If you use a simple bond to indicate a complex, you may want to set Abnormal Valence to Allowed in the Atom Properties dialog.
Multi-center Attachments
Multi-center attachments are meaningful only when created using Structure>Add Multi-Center Attachment. Multicenter attachments create a pseudo-atom that is disregarded during chemical calculations but still lets you create
Chapter 16: Chemical Interpretation
283 of 315
ChemDraw 15.0
diagrams that look meaningful to an experienced chemist. A few examples are shown below:
η3 or π-Allyl complex:
Ferrocene, a π-Aryl complex:
Cp2TiCl2, another π-Aryl complex:
η-C5H5Mn(CO):
Cahn-Ingold-Prelog
Absolute stereochemistry is calculated for tetrahedral atoms and double bonds according to the Cahn-Ingold-Prelog
(CIP) priority rules.
The CIP rules are designed to order ligands by their priority and determine a descriptor based on the orientation of the
ordered ligands in space.
Chapter 16: Chemical Interpretation
284 of 315
ChemDraw 15.0
A ligand is an entity attached to a stereocenter. For example, a tetrahedral carbon has four ligands corresponding to its
four substituents. When a tetrahedral carbon is in a ring, it still has four ligands: the two ligands outside the ring, a third
consisting of the ring “unpeeled” clockwise, and a fourth consisting of the ring “unpeeled” counterclockwise.
Five rules used to determine the priority of ligands are summarized below in simplified form. For more detailed information, see the references.
Rule 1. Higher atomic number precedes lower
Rule 2. Higher atomic mass precedes lower
Rule 3. cis precedes trans
Rule 4. Like pairs of descriptors precede unlike pairs
Rule 5. R precedes S
ChemDraw checks differences up to 15 atoms distant from the stereocenter.
Stereochemical Indicators
After the ligands are ranked, an indicator is assigned as shown in the following table.
Stereocenter
Indicator
Double bond
Z if the highest ranking ligand of each pair are on the same side of the bond; otherwise E.
Tetrahedral atom
When the lowest-ranking ligand is located behind the central atom:
R when remaining 3 ligands are arranged clockwise in descending order
S when remaining 3 ligands are arranged counterclockwise in descending order
r or s is used for pseudo asymmetric atoms
Stereochemical Flags
While the chirality of a specific stereocenter can be indicated with the appropriate wedged, hashed, or plain bond,
sometimes it is useful to indicate the relative stereochemistry of a molecule as a whole, considering the relationship
between all stereo-centers. Stereochemical flags apply to the nearest structure; if no structure is within the distance
specified by the Fixed Length value, the stereochemical flag is not assigned to any structure.
Chapter 16: Chemical Interpretation
285 of 315
ChemDraw 15.0
Figure 16.2: The Absolute flag indicates the exact stereoisomer as drawn.
Figure 16.3: The relative flag indicates the exact stereoisomer as drawn, or its enantiomer.
Chapter 16: Chemical Interpretation
286 of 315
ChemDraw 15.0
Figure 16.4: The racemic flag indicates a mixture of the exact stereoisomer as drawn and its enantiomer.
Polymer Representations
Polymers are represented by brackets used to enclose repeated structures or structural fragments. Bracket properties
specify the orientation and context of the repeating units. For an explanation of the bracket properties, see "Setting
Bracket Properties" on page 244.
Note: The polymer drawing feature is available only in ChemDraw Professional, and ChemDraw Prime.
References
“Graphic Representations (Chemical Formulae) of Macromolecules (Recommendations 1994)” Pure Appl. Chem., 66,
2469-2482 (1994).
“Source-Based Nomenclature for Copolymers (Recommendations 1985)” Pure Appl. Chem., 57, 1427-1440 (1985).
Also available at: http://www.iupac.org/publications/books/pbook/PurpleBook-C7.pdf.
“Basic Definitions of Terms Relating to Polymers (1974)” Pure Appl. Chem., 40, 479-491 (1974) Also available at:
http://www.iupac.org/reports/1996/6812jenkins/index.html.
Also see the Guide for the authors of papers and reports in polymer science and technology from IUPAC.
Analysis Messages
When a structure cannot be fully analyzed, two general types of messages are displayed:
Status messages that report a problem that may not affect the final analysis
Critical messages that may affect the final analysis
Message
Description
There are too many bonds to this
Displayed for every unlabeled atom with more than four filled valences.
unlabeled Carbon.
Filled valences include sum of bond orders, charge, radicals, and free sites.
Chapter 16: Chemical Interpretation
287 of 315
ChemDraw 15.0
Message
Description
Aromatic bonds count 1.5 each, rounded down unless it is the only bond to
the atom. Charge is signed and includes charge implied by dative bonds.
The Substituents query property treats free sites, up to and exactly the
same way: an atom with two explicit bonds and “Substituents: Up To 3” or
“Substituents: Exactly 3” or “Substituents: Free Sites 1” has three filled
valences.
An atom in this label has an invalid Displayed in cases where a place cannot be found to place a bond or a bond
valence.
cannot be found to place an atom. Valid valences for each element are listed in the Isotopes Table file.
ChemDraw can’t interpret this
Displayed when text is found that cannot be identified as an element, nick-
label.
name, generic nickname, or alternative group name.
Parentheses don’t match.
Displayed when parentheses cannot be matched into nested open-close
pairs.
This label has conflicting or unas-
Displayed when a plus and minus charge have been assigned to the same
signable charges.
element, charges have been assigned in more than one way, or a charge
has been assigned to a nickname, generic nickname, or Alternative Group
name.
Formula cannot be computed for
Displayed for every label that contains a generic nickname, an element list
queries.
or an alternative group. This is a status message only; analysis continues
as if the problematic label were not selected.
Text not in Formula style won’t be
Displayed for the first caption that is not an atom label or Alternative Group
interpreted.
name, and which contains any text not in Formula, Subscript, or Superscript style. This is a status message only, and appears only once regardless of how many captions are in the selection.
This named alternative group con-
Displayed for any structure within an Alternative Group Box where the struc-
tains no attachment point.
ture lacks an attachment point. This is a status message only.
This named alternative group con-
Displayed for any Alternative Group Box whose contained structures have
tains fragments with inconsistent
varying numbers of attachment points. Since all structures within an Altern-
valences.
ative Group Box are to be used interchangeably, they must have the same
number of attachments. This is a status message only.
This named alternative group con-
Displayed for any Alternative Group Box that is empty. This is a status mes-
tains no fragment.
sage only.
Chapter 16: Chemical Interpretation
288 of 315
ChemDraw 15.0
Message
Description
Part of a molecule is outside of the Displayed for any Alternative Group Box whose border crosses part of a
alternative group definition.
structure. This is a status message only.
This isolated bond is probably not
Displayed for unlabeled single bonds unattached to other bonds. All bonds
intended to have chemical sig-
are interpreted chemically, usually as C2H6, and may cause unexpected
nificance.
results if intended as a graphical line only. This is a status message only.
The atom is very close to another
Displayed for any atom that is nearly touching another atom or bond but not
atom or bond.
bound to it. If a bond really was intended, the analysis of the structure produces incorrect results. This is a status message only.
The stereocenter has no ste-
Displayed for any asymmetric center without attached wedged, hashed,
reobonds specified.
dashed, or bold bonds. This is a status message only, and appears only
when Show Stereochemistry is tuned on and there is at least one other
wedged, hashed, dashed, or bold bond in the structure.
There is a valence and charge error Displayed for any odd-membered ring drawn as a delocalized system (with
somewhere in this aromatic sys-
a circle in the middle), where there is no corresponding associated charge.
tem.
For example, a delocalized representation of cyclopentadiene must include
either a negative charge or a multicenter attachment.
The stereocenter has conflicting or Displayed for any stereocenter (tetrahedral atom, asymmetric double bond,
ambiguous stereobonds specified. etc.) where the absolute stereochemistry cannot be determined from the
structure as drawn. For example, this message would be shown for a carbon atom attached by bold bonds to four different ligands. This message is
displayed only when Show Stereochemistry is also turned on.
This label has an unrecognized iso- Displayed for every label that has a numeric superscript immediately pretopic mass.
ceding an atomic symbol, where the superscripted number does not correspond to a recognized isotope. For example, 24CH3.
Chapter 16: Chemical Interpretation
289 of 315
ChemDraw 15.0
Property Calculations
You can calculate predicted values of selected physical and thermodynamic properties for structures of up to 200
heavy atoms. This section describes how the values are determined.
LogP
Three fragmentation methods are used to predict the logP values:
Method One: Based on 94 atomic contributions evaluated from 830 molecules by least squares analysis. This
method works with a standard deviation of 0.47 logP units and can handle molecules containing hydrogen, oxygen,
nitrogen, sulfur, and halogens.
Method Two: An extension of method one but is based on 120 atomic contributions evaluated from 893 molecules
by least squares analysis. In addition to the atoms introduced for method one, it can handle molecules that contain
phosphorus and selenium atoms. This method works with a standard deviation of 0.50 logP units.
Method Three: Based on 222 atomic contributions calculated from 1868 molecules by least squares analysis. This
method allows a calculation of logP with a standard deviation of 0.43 logP units and can handle molecules containing hydrogen, oxygen, nitrogen, sulfur, halogens, and phosphorus atoms. If this method is applied to molecules
with internal hydrogen bonds, the standard deviation is 0.83 LogP units.
Henry’s Law
Two methods are used to predict Henry’s Law constant:
Method One: An approach based on the bond contribution method, this method uses 59 bond contribution values
and 15 correction factors. The contributions were calculated by least squares analysis using a data set of 345 chemicals. This method estimates with a mean error of 0.30 units and a standard deviation of 0.45 units, and can handle
molecules containing carbon, hydrogen, oxygen, nitrogen, sulfur, phosphorus and, halogens.
Method Two: Henry’s Law constant is estimated from an equation found using linear regression. Multifunctional
compounds were omitted from this study. This method should not be used for compounds where distant polar interaction is present.
Molar Refractivity
Two fragmentation methods are used to estimate the molar refractivity value:
Method One: Includes 93 atomic contributions evaluated from 504 molecules by using a constrained least squares
technique. This method works with a standard deviation 1.27 cm3/mol and can handle molecules containing hydrogen, oxygen, nitrogen, sulfur, and halogens.
Method Two: Is an extension of method one that includes 120 atomic contributions evaluated from 538 molecules
by using a constrained least squares analysis technique. In addition to the atoms introduced for method one, this
method can handle molecules with phosphorus and selenium atoms. This method works with a standard deviation
of 0.77 cm3/mol.
Chapter 17: Property Calculations
290 of 315
ChemDraw 15.0
pKa, CLogP, and CMR
Specific algorithms for calculating LogP and molar refractivity from fragment-based methods developed by the
Medicinal Chemistry Project and BioByte. For more information, see http://www.biobyte.com/blqsar/index.html.
LogP and CLogP estimate the Octanol/Water Partition Coefficient, but use different methods.
CLogP and CMR are calculated as part of the Chemical Properties window. Several other sources exist for LogP
data, however:
The ChemDraw Report Window for LogP Prediction: The Chemical Properties window shows averaged
LogP and MR values. Via the "Report" button, you can see the original values from each applicable estimation
method. The estimation methods are Crippen's fragmentation, Viswanadhan's fragmentation, and Broto's
method.
The ChemDraw Report Window for LogP Empirical Data: For selected substances, the Chemical Properties window's Report button includes a section "Data from Database," which includes measured values of the
partition coefficient and pKa values, at specified pH levels, with source citations.
The ChemDraw ChemFinder Hotlink Window: Several available databases include LogP and pKa information, including:
--ChemSpider (from InChI link) predicts several variations of LogP and LogD
--ChemINDEX (Physical Properties section, Environment Science Center database) includes empirical pKa and
LogP data
ChemDraw/Excel
The ChemDraw add-in module in Microsoft Excel predicts:
LogP (function CHEMPROPPRO_LOGP)
CLogP (function CLOGP_DRIVER_PARTITION_COEFFICIENT)
MR (function CHEMPROPPRO_ MOL_REFRACTIVITY)
CMR (function CLOGP_DRIVER_MOL_REFRACTIVITY)
ChemFinder/BioViz
The Property Populator predicts:
LogP (server ChemPropPro, property LogP)
CLogP (server CLogP driver, property Partition_Coefficient)
MR (server ChemPropPro, property Mol Refractivity)
CMR (server CLogP driver, property Mol Refractivity)
Chem3D
The Property Picker predicts:
LogP (ChemPropPro LogP)
CLogP (CLogP driver Partition Coefficient)
MR (ChemPropPro Mol Refractivity)
CMR (CLogP driver Mol Refractivity)
Chapter 17: Property Calculations
291 of 315
ChemDraw 15.0
The Chem3D MOPAC Interface
Calculates the pKa of the most acidic hydrogen atom attached to an oxygen. For more information, see
http://www.openmopac.net/pKa_table.html.
For more information, "ChemDraw/Excel Functions" on page 188, "LogP" on page 290, "Property Calculations" on
page 290, and "pKa, CLogP, and CMR" on page 291.
Topological Polar Surface Area
The polar surface area of a molecule (measured in square angstroms) can be used to predict of pharmaceutical transport properties in the body. ChemDraw implements a more innovative algorithm. Historically, this property has been
calculated using time-consuming 3D techniques. However, a recent paper provided a remarkably accurate way of predicting it rapidly.
Other Properties
Normal Boiling Point and Melting Point
Estimated in K using two methods:
Method One: Joback's fragmentation method
Method Two: Joback's fragmentation method as modified by Stein. All boiling points are estimated for a pressure
of 1 atm.
Miscellaneous Properties
Heat of Formation, Gibbs Free Energy, Ideal Gas Thermal Capacity, Freezing Point, Critical Temperature, Critical
Pressure, and Critical Volume are estimated using Joback’s fragmentation method.
Chapter 17: Property Calculations
292 of 315
ChemDraw 15.0
ChemDraw Web Resources
The PerkinElmer Informatics Web site is a valuable source of helpful information. You can:
Register your software.
Search for chemical information by name or ACX number; or, insert a structure into a worksheet.
Get technical support, documentation, software downloads, and more.
You can navigate to the site directly from ChemDraw by selecting the appropriate option in the Search menu.
Registering Online
To activate any ChemOffice application, register with the PerkinElmer Informatics Web site to receive a registration
code. Upon filling out a registration form, you will receive a registration code by e-mail (this does not apply to site
licenses).
If your serial number is invalid or you do not have an Internet connection, contact PerkinElmer Informatics Support to
receive a registration code.
You may use your ChemOffice applications a limited number of times while waiting for the registration process to finish. After you reach the limit, you must register the software.
In addition to registering your software, you can request literature, or register for limited free access to ChemFinder.com, ChemACX.com, and the e-mail edition of ChemNews. To register online, navigate to Search>Register
Online. The user registration Web page opens in your browser.
User’s Guide
The Search menu also lets you find current and previous versions of the documentation. To access the documentation page, navigate to Search>Browse PerkinElmer Documentation.
The Desktop >> Support Documentation Web page appears. Select the Manuals link.
Note: If you do not have a PerkinElmer Informatics user account, you will first be directed to a sign-up page.
Technical Support
The Search menu link Browse PerkinElmer Technical Support opens the Technical Support Web page. Here you
can find desktop support resources, including the PerkinElmer Informatics Knowledge Base, product downloads,
FAQ, and documentation.
1. Navigate to Search>Browse PerkinElmer Technical Support. The Technical Support Web page opens.
2. Click Desktop Support.
Suppliers on ChemACX.com
ChemACX (Available Chemicals Exchange) provides a database of commercially available chemicals. The database
contains catalogs from research and industrial chemical vendors.
To link to the ChemACX.com record of suppliers for compounds that you draw:
Chapter 18: ChemDraw Web Resources
293 of 315
ChemDraw 15.0
1. In ChemDraw, select a structure you have drawn.
2. Navigate to Search>Find Suppliers on ChemACX.com. The ChemACX.com page opens with information
about the selected structure.
For more information on using the ChemACX Web site, see the ChemOffice Enterprise Workgroup & Databases
Guide.
ACX Structures and Numbers
ChemDraw searches ACX and returns information about related structures and numbers. You can place the returned
information in your document.
ACX Structures
There are two ways to find ACX structures, by ACX number or by name.
To find a structure by ACX number:
1. Navigate to Search>Find Structure from ACX Number. The Find Structure from ACX Number dialog appears.
2. Type the ACX registry number in the dialog.
3. Click OK. The structure appears in your document.
To find a structure by name:
1. Navigate to Search>Find Structure from Name at ChemACX.com. The Find Structure from Name dialog
appears.
2. Type either a chemical name or trade name in the dialog.
3. Click OK. The structure appears in your document.
ACX Numbers
To Find an ACX number for a structure:
1. Select the structure.
2. Navigate to Search>Find ACX Numbers from Structure. The ACX number appears in the Find ACX Numbers
from Structure dialog.
Chem3D ActiveX Control
The Chem3D ActiveX Control page provides Chem3D Plugin/ActiveX documentation for end users as well as administrators (web developers) who want to incorporate the controls within the Web pages.
SciStore.com
SciStore offers life science desktop software, enterprise solutions, chemical databases, and consulting services to
biotechnology, pharmaceutical, and chemical industries. To visit SciStore, navigate to Search>Browse SciStore.com, or visit SciStore at www.scistore.com.
Chapter 18: ChemDraw Web Resources
294 of 315
ChemDraw 15.0
PerkinElmer Informatics
To open the PerkinElmer Informatics Home page, navigate to Search>Browse PerkinElmer.com. Check the
PerkinElmer Informatics Web site for new product information. You can also visit ChemNews.Com, and other pages
through PerkinElmer Informatics Home page.
Using the ChemOffice SDK
The ChemOffice Software Developer’s Kit (SDK) lets you customize your applications.
To browse the ChemOffice SDK, navigate to Search>Browse ChemOffice SDK.
The ChemOffice SDK page contains documentation, sample code, and other resources for the Application Programming Interfaces (APIs).
Querying SciFinder® with ChemDraw (Professional Level)
SciFinder® is a research discovery application created by CAS (Chemical Abstract Services) that provides integrated
access to the world's most comprehensive and authoritative source of references, substances, and reactions in chemistry and related sciences.
ChemDraw provides an interface to search SciFinder® with queries created on the desktop. Send a ChemDraw structure or reaction query to SciFinder® using one of the following methods:
Click the SciFinder® icon on the main horizontal toolbar under menu bar.
Navigate to Search > Search SciFinder.
Note: The SciFinder® icon and Search menu item will be grayed out unless the structure(s) being queried is selected.
The Search SciFinder dialog window opens. If you have selected a structure, or multiple structures, you will see the
following window:
Chapter 18: ChemDraw Web Resources
295 of 315
ChemDraw 15.0
You can now choose whether you are interested in a substructure search or an exact search of the substances database, or, if you want to search the reaction database, whether selected structure(s) is a reactant or a product. All reaction searches are substructure searches.
If you have selected an entire reaction sequence, the following window will open to confirm your reaction search.
Press OK and SciFinder® will be launched to retrieve the results of your search and display them in a browser window.
If you submit a second or later search to SciFinder®, you will see an intermediate screen warning that you already
have a SciFinder® answer set. To proceed with the latest search, click OK.
Note: For a search to proceed, you must:
Be connected to the Internet
Chapter 18: ChemDraw Web Resources
296 of 315
ChemDraw 15.0
Have a valid SciFinder® individual subscription to access the database.
Note: If your subscription is through a university and utilizes a proxy server to connect you to SciFinder®, you
must click the Proxy Settings button (Windows), or the arrow next to the Proxy server indicator line (Mac) and
enter the proxy server URL for the account you are using. This will only be necessary for the first search you run.
If you are not logged in or do not have a valid SciFinder® subscription, you will be redirected to the main SciFinder®
page. There you can either log in or find information about how to subscribe. Some of the advanced structure query
creation capabilities of ChemDraw cannot be fully interpreted by SciFinder®. When your query contains specifications that SciFinder® cannot handle, it will try to simplify and interpret them to the best of its ability, and will
display a warning message. The interpreted search structure will be displayed in the SciFinder® sketcher for further
manipulation as needed before starting the search. If the results obtained are not appropriate, please contact Customer Support at CAS, or PerkinElmer, and they will try to address the issue and/or propose an alternate query that
might achieve the results you seek.
Some additional information about searching:
If you select a molecule within a reaction, you can still specify a search of the substances database, rather than a
search of the reaction database.
You can select a portion of a molecule as your search entity. It will be treated just like an entire molecule for exact
or substructure searching. If the selection consists of more than one fragment, these will be treated as independent
moieties, all of which must be contained within the CAS record in order for it to be registered as a hit.
Multi-step reactions or multiple reactions, in a single search, are not supported. Each step in the reaction sequence
must be searched separately.
Chapter 18: ChemDraw Web Resources
297 of 315
ChemDraw 15.0
Tutorials
The tutorials illustrate fundamental drawing techniques. Each tutorial introduces new techniques, or variations of techniques from previous tutorials. We, therefore, suggest that you follow the tutorials in order.
Before you begin, review "Conventions used in this Guide" on page 1 to familiarize yourself with the terminology.
ChemDraw checks for correct chemical syntax as you draw. If there is an error, a red box appears around the erroneous object (the red box does not print). To disable the red box on a specific object, right-click the object and
deselect Display Warnings on the context menu.
Tutorial 1: Drawing a Structure
In this tutorial, we explain how to draw this structure:
If you want the want the bond angles and lengths to be fixed, navigate to Object>Fixed Lengths and Fixed Angles.
This ensures that bond lengths and bond angles are consistent throughout the structure.
Note: The fixed length dimension is set in the Drawing tab of the Document Settings dialog. The fixed angle dimension increments angles by 15 degrees.
To create bonds:
1. Navigate to View>Show Main Toolbar.
2. On the Main toolbar, select the Solid Bond tool.
3. Click in the document window. A bond appears.
4. To add a second bond, click the right-end of the bond you just created.
The two bonds form a 120-degree angle.
Note: The chain angle setting determines the angle between the two bonds. To change the chain angle, see "Drawing Settings" on page 23.
5. To create a tertiary carbon, click the same place, as shown in step 4 above.
Changing Bond Order
To create the double bond, either hover over the center of the bond and type "2" or click on the bond.
Chapter 19: Tutorials
298 of 315
ChemDraw 15.0
Adding Atom Labels
1. Using the Text tool, click the end of the double-bond shown below. A text box appears at the end of the bond.
2. Type an uppercase O in the text box.
3. Press the <Esc> key on your keyboard to close the text box, or choosing another tool.
4. An alternative is hover over the atom at the end of the double bond and hit the "o" key. This is utilizing the Hotkey
functionality of ChemDraw (see Chapter 5 Shortcuts and Hotkeys).
Adding Captions
To name the molecule:
1. Using the Text tool, click below and to the left of the structure. A text box appears.
2. In the text box, type “2-propanone”.
3. Press the <Esc> key on your keyboard to close the text box, or choose another tool.
Tutorial 2: Drawing rings
In this tutorial you use rings to create this structure:
To create the ring system:
1. Using the Benzene tool, SHIFT-click in an empty area of the document.
Note: Hold down the SHIFT key to change resonance structures when using the cyclopentadiene or benzene tools.
2. Point to the center of the lower right bond in the benzene ring.
3. Click to fuse another ring.
Chapter 19: Tutorials
299 of 315
ChemDraw 15.0
4. In the final structure, there is only one double bond in the second ring. To correct the current structure, hover the
mouse over one of the double bonds in the second ring and type ‘1’. Do the same for the other double bond.
Figure 19.1: To change the bond order, type ‘1’.
5. To create the double bond in the second ring, either hover the mouse over the bond and type ‘2’ or click it.
6. Using the bond tool, click the carbon atoms circled in the figure below. Three new bonds will appear.
7. Hover your mouse over one of the bond shown below and type ‘2’. Do the same for the other bond.
Chapter 19: Tutorials
300 of 315
ChemDraw 15.0
8. Hover the mouse over the right-most terminal carbon and type the letter ‘o’ to create the ketone functional group.
9. To connect the left terminal carbons, select the solid bond tool and click-drag a bond from one carbon to the other.
The structure is complete.
Tutorial 3: Fischer projections
This tutorial demonstrates how to create a Fischer projection of glucose:
Chapter 19: Tutorials
301 of 315
ChemDraw 15.0
Figure 19.2: Fischer projections
To draw the first bond:
1. Click the Solid Bond tool.
2. Point in the document window. Drag downward to draw the first bond.
3. Point to the lower atom, and drag downward again to draw the second bond.
The red wavy box appears because Show Chemical Warnings is selected. We will keep it selected for now.
4. Repeat step 3 there are five bonds.
Figure 19.3: Drawing the backbone
Chapter 19: Tutorials
302 of 315
ChemDraw 15.0
Note: When you drag the pointer along the length of the bonds, the pointer alternates between an arrow and a
cross. The arrow indicates you are pointing over the center of a bond, and the cross indicates you are pointing to
an atom.
Add horizontal bonds to the second atom in the string of bonds you created:
1. To add a horizontal bond, point to the uppermost Chemical Warning box and click it.
Note that the red wavy box disappears when you add a bond.
2. Click again to add a horizontal bond in the opposite direction.
3. Repeat steps 1 and 2 with each Chemical Warning box until all horizontal bonds are added.
Figure 19.4: Adding horizontal bonds to the backbone
Add labels to the first and last carbon atoms:
1. Select the Text tool.
2. Click the uppermost carbon atom to create a text box, and type CHO.
3. Click the lower-most carbon atom, and type CH2OH.
Figure 19.5: Adding atom labels
Add the repeating labels for the hydrogens and hydroxyl groups:
1. Click the atom shown in A below and type the letter H.
Chapter 19: Tutorials
303 of 315
ChemDraw 15.0
2. Double-click each of the other atoms labeled as hydrogen in B.
Figure 19.6: Adding repeating atom labels
Tip: Double click an atom with the text tool to repeat the last label.
3. Click one of the remaining atoms and type O.
4. Double-click the remaining atoms to repeat the label.
Figure 19.7: Completing the drawing
View the basic properties of the structure and paste the information into your document:
1. Click a selection tool to select the last structure drawn. If the structure is not selected, double-click the structure.
2. Go to View>Show Analysis Window.
3. In the Analysis window, click Paste. The analysis information appears as a caption below the structure.
Tutorial 4: Perspective Drawings
In this tutorial, we explain how to create a perspective drawing by creating a model of α–D–glucose as a Haworth projection.
Create a new document using the default style:
Chapter 19: Tutorials
304 of 315
ChemDraw 15.0
Go to File>Open Style Sheets>New Document.
Note: If you are following the tutorials in order, ChemDraw will remember your last drawing used the ACS style
sheet and open it as the default.This step resets the default to New Document.
Draw a ring:
1. Click the Cyclohexane Ring tool.
2. Click in an empty area of a document window. A cyclohexane ring appears.
Rotate the ring:
1. Go to Edit>Select All (or type CTRL+A).
2. Go to Object>Rotate (or type CTRL+R)
3. In the Rotate Objects dialog box, enter 30 degrees for an angle and click Rotate. The cyclohexane ring rotates.
Change cyclohexane to tetrahydropyran:
1. Click outside the structure to deselect it.
2. Point to the atom in the figure below, and type the letter o.
Resize horizontally:
1. Go to Edit>Select All (or typeCTRL+A).
2. Using a selection tool, click-drag the right side handle to horizontally resize the ring. Release the mouse button
when the ring is stretched about 200%.
Chapter 19: Tutorials
305 of 315
ChemDraw 15.0
Enlarge the ring:
1. Go to Edit>Select All (or type CTRL+A).
2. Click-drag the ring corner adjustment handle to increase the size of the ring to 150%. A dialog box appears, asking
you whether you want to scale the drawing and text settings.
3. Click No.
Add vertical bonds:
1. Click the Solid Bond tool.
2. Point to the atom shown in the figure below and drag upward to create a bond.
3. Point to the same atom, and drag downward to create another bond.
4. Repeat this procedure four more times, adding the pairs of vertical bonds shown below:
Create OH labels:
You can use the repeating bond label technique in Tutorial 4, or use hotkeys. For the Hotkey method, just point and
type the letter "o". The Text tool method is repeated here, with a slight variation.
1. Select the Solid Bond tool, point to the atom shown in the figure below, and double-click to open a text box.
2. Type OH.
Chapter 19: Tutorials
306 of 315
ChemDraw 15.0
Figure 19.8: Adding the OH labels
3. Move the pointer to the other atoms as shown, and triple-click to repeat the atom label.
Tip: If the drawing is too small to place the labels, go to View> Magnify to enlarge it.
Add the CH2OH label:
1. Triple-click the upper atom of C5.
2. Press ENTER to open the atom label text box. Type CH2 before the OH.
Change the type of the front bonds:
1. Click the Bold Bond tool.
Chapter 19: Tutorials
307 of 315
ChemDraw 15.0
2. Click the bond shown in the figure.
3. The cursor changes to a bold arrow as you point to the bond.
4. Click the Wedge bond tool.
5. Click each ring bond adjacent to the bold bond.
For each bond, point slightly off center in the direction that you want the wide end of the wedge to be oriented and
click.
Tip: If you move the pointer too far, the highlight box disappears. If placing the pointer is difficult, go to View>Magnify.
Note: If the wedge is pointed in the wrong direction, click the bond again to flip its orientation.
The final structure is:
Tutorial 5: Newman projections
This tutorial demonstrates how to draw a Newman projection of ethane:
Chapter 19: Tutorials
308 of 315
ChemDraw 15.0
Draw ethane:
1. Click the Solid Bond tool.
2. In the document window, click-drag downward to create the first bond.
3. Click the atom at the bottom of the bond to add a second bond.
4. Click the bottom atom again to add a third bond.
5. Hover the mouse over the end of each bond (without clicking) and type H to add the hydrogen atoms.
Duplicate the structure:
1. Click a selection tool. The last structure you drew is selected.
2. To create a duplicate, hold down the CTRL key while dragging the selection rectangle upward to the right of the original.
The selection box disappears while you are dragging.
Add a bond between the duplicated structures:
1. Click the Solid Bond tool.
2. Click and drag from the tertiary carbon atom of the lower fragment to the other tertiary carbon.
Note: When connecting existing atoms, the Fixed Length and Fixed Angles commands are ignored.
When you release the mouse button, the ethane structure is complete. Now, create its Newman projection.
Chapter 19: Tutorials
309 of 315
ChemDraw 15.0
Drawing the Newman projection
In this step, you draw the hollow circle that is particular to Newman projections.
1. Click the Orbital tool, and select the s (Open) orbital.
2. Point to the left center carbon and click-drag outward.
The size of the orbital is constrained just as bonds are. The constraint is based on a percentage of the Fixed Length
setting in the Drawing tab of the Document settings dialog box.
Note: Orbitals are not automatically grouped with the structure. To group the orbital with the existing structure so
you can move them together, go to Object>Group.
1. Click the Marquee tool. The orbital is selected. Click an empty space to deselect it.
2. Point above the structure and drag around the upper fragment to select the three bonds. Do not select the bond connecting the two fragments.
Rotate the selection:
1. Double-click the rotation handle to open the Rotate Objects dialog box.
2. Type 180 in the Angle text box and click Rotate.
With the rotated bonds still selected, change the structure layering so that the selection is in front.
3. Go to Object>Bring to Front (there is no visible change when you do this).
Move the front part of the structure to create a Newman projection:
1. Point within the Selection Rectangle so the pointer changes to a hand.
2. Drag the selection until the tertiary carbon is centered within the orbital:
Chapter 19: Tutorials
310 of 315
ChemDraw 15.0
Note: If chemical warnings are turned on, a red warning box appears when you overlay the structure, because the
carbon atoms overlay the C-C bond. To turn off the chemical warning, deselect Chemical Warnings in the View
menu. To disable this type of warning, go to Preferences and deselect Atoms Near Other Bonds in the Warnings tab.
3. Release the mouse button and click outside the Selection Rectangle to deselect the structure.
Tutorial 6: Stereochemistry
This tutorial demonstrates stereochemistry markers and the Flip command.
First, we draw this structure:
To draw the structure:
1. Click the Solid Bond tool.
2. In the document window, click and drag downward to create the first bond.
3. Point at the lower atom and click to add a second bond.
4. Continue pointing at the same atom and click again to add a third bond.
Chapter 19: Tutorials
311 of 315
ChemDraw 15.0
5. Point to the atom shown below and click twice to create two bonds.
6. Pointing to the bond shown below, right-click, and select Double>Plain from the context menu.
7. Click the Wedged Bond tool, point to the atom below, and then click.
Adding atom labels
1. With the Text tool selected, click the atom shown below, and then type 'NH2' in the text box that appears.
2. With the Text tool selected, click the atom shown below, and then type 'O' in the text box that appears.
Chapter 19: Tutorials
312 of 315
ChemDraw 15.0
3. With the Text tool selected, click the atom shown below, and then type 'OH' in the text box that appears.
Displaying stereochemical markers
We now display the stereochemical markers, (R) and (S) for the two isomers.
To add the markers:
1. Select the entire structure with the Lasso or Marquee tool.
2. Go to Object>Show Stereochemistry. The S marker appears.
3. Select the structure and go to Object>Flip Horizontal. The R marker appears.
4. With the structure selected, go to Object>Rotate 180° Vertical. You can also use the object toolbar to rotate the
structure.
Chapter 19: Tutorials
313 of 315
ChemDraw 15.0
The Wedged bond becomes hashed and the (R) stereochemistry is preserved.
Tutorial 7: Templates
ChemDraw comes with an extensive template library of pre-drawn structures and images. You can use a template to
either start a new drawing or to modify one that already exists.
In this tutorial, we use the phenanthrene template to create peroxydibenzene. The template and final drawing are
shown below:
To add the template for phenanthrene:
1. Go to File>Open Style Sheets>New Document.
2. In the Main toolbar, select the template tool. The list of template palettes appears.
3. In the Aromatics palette, select the phenanthrene template.
4. Click in the document window. Phenanthrene appears.
Now you must remove two bonds from the center ring of the structure and add two oxygen atoms.
To modify phenanthrene:
1. In the Main toolbar, select the Eraser tool.
Chapter 19: Tutorials
314 of 315
ChemDraw 15.0
2. Click the bottom bond in the center ring.
3. Click the double bond at the top of the ring. It is now a single bond.
4. In the Main toolbar, select the Text tool.
5. Select one of the carbon atoms in the hydrocarbon chain (what was the middle ring).
6. Type O to change it to an oxygen atom.
7. Select the other carbon atom and change it to an oxygen. Peroxydibenzene is now shown.
Chapter 19: Tutorials
315 of 315