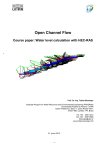
1
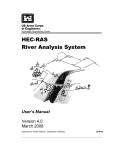
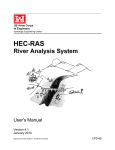
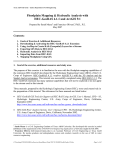
v. 8.4
WMS 8.4 Tutorial
Hydraulics and Floodplain Modeling – HEC-RAS
Analysis
Learn how to setup a basic HEC-RAS analysis using WMS
Objectives
Learn how to build cross sections, stream centerlines, and bank lines in a conceptual model format. Cut
cross sections from digital elevation data, define Manning's roughness polygons, and assign conceptual
model data to an HEC-RAS model. Export and run a HEC-RAS model and read and view the results
from the WMS interface.
Prerequisite Tutorials
Required Components
Time
•
•
•
•
•
•
•
•
•
Introduction – Images
Introduction – Basic Feature
Objects
Editing Elevations – DEM
Basics
Editing Elevations – Using
TINs
Data
Drainage
Map
River
Page 1 of 17
30-60 minutes
© Aquaveo 2011
1
Contents
1
2
3
4
5
6
7
8
2
Contents ...............................................................................................................................2
Introduction.........................................................................................................................2
Objectives.............................................................................................................................2
Preparing the Conceptual Model.......................................................................................2
4.1
Getting a Background Image using the TerraServer ....................................................3
4.2
Open Background Image..............................................................................................3
Tin Display Options ......................................................................................................................
4.3
Creating the Coverages ................................................................................................4
4.4
Creating the Centerline and Bank Arcs ........................................................................4
4.5
Naming the Centerline Arcs .........................................................................................6
4.6
Creating Land Use / Materials Coverage .....................................................................7
4.7
Creating the Cross Sections..........................................................................................9
4.8
Extracting Cross Sections...........................................................................................10
Creating the Network Schematic .....................................................................................11
Creating the HEC-RAS Project File................................................................................13
Using HEC-RAS................................................................................................................14
Post-Processing..................................................................................................................16
Introduction
HEC-RAS was developed by the U.S. Army Corps of Engineers Hydrologic Engineering
Center. HEC-RAS performs a step backwater curve analysis for either steady state or
transient conditions to determine water surface elevations and velocities.
3
Objectives
In this exercise, you will learn how to use the WMS River tools to construct a HEC-RAS
steady flow model. This includes the following:
4
•
Building the conceptual model
•
Mapping the conceptual data to a hydraulic model representation
•
Running the simulation within HEC-RAS
•
Viewing results in WMS
Preparing the Conceptual Model
The first step to creating an HEC-RAS model is to create a conceptual model which
defines the river reaches (layout and attributes), the position of cross sections on those
reaches (orientation and station values), bank locations, and material zones. The
conceptual model will be used to create a network schematic inside the River module.
We will create the conceptual model from a USGS quad map as well as scattered
bathymetric (elevation) data in the form of a TIN.
Page 2 of 17
© Aquaveo 2011
WMS Tutorials
Hydraulics and Floodplain Modeling – HEC-RAS Analysis
1. Close all instances of WMS
2. Open WMS
3. Select File | Open
4. Locate the folder C:\Program Files\WMS84\tutorial\hecras
5. Open “wmsras.tin”
6. Select Edit | Current Coordinates to set your current coordinates
7. Select Global Projection, then the Set Projection button
8. Set Projection to State Plane Coordinate System, Datum to NAD 83,
Planar Units to FEET (U.S. SURVEY), and Zone to North Carolina (FIPS
3200).
9. Select OK
10. Set Vertical Units to U.S. Survey Feet
11. Select OK
Skip section 4.1 if you are not able to connect to the Internet using your computer.
4.1
Getting a Background Image using the TerraServer
Using an Internet connection we will now download the topographic map image directly
from the TerraServer and open it in WMS.
1. Select the Get Data tool
2. Drag a box around the extents of the TIN to define the region of the image
3. Toggle on the TerraServer topo option
4. Select OK to start the downloading process
5. Enter “wmsrasTS” for the name of the file and click Save
6. Select YES to create the .jpg file.
7. Set the map scale to 2m. It may take a few minutes to complete the
downloading process.
8. Select YES when asked to generate image pyramids
WMS will automatically open the image after downloading it. If you were able to
successfully complete all the steps in this section you can skip section 4.2
4.2
Open Background Image
1. Select File | Open
2. Open “wmsras.jpg”
Tin Display Options
The TIN clutters the screen, yet we want to know where it is so we do not create our
conceptual model outside the domain of our bathymetric data. To better see the image,
Page 3 of 17
© Aquaveo 2011
WMS Tutorials
Hydraulics and Floodplain Modeling – HEC-RAS Analysis
we will turn off the display of TIN triangles, vertices, and contours, and turn on the TIN
boundary. To do this:
1. Right-click on the New TIN under Terrain Data in the Project Explorer and
select Display Options
2. On the TIN tab, uncheck the Unlocked vertices toggle box (it may already
be unchecked)
3. Uncheck the Triangles and the TIN Contours toggle boxes
4. Ensure that the Boundaries box is checked
5. Select OK
4.3
Creating the Coverages
We need to create a centerline coverage for our reaches and a cross section coverage for
our cross sections. These will form the core of our conceptual model.
1. Right-click on the Coverages folder within the Project Explorer and choose
New Coverage
2. Change the coverage type to 1D-Hyd Centerline
3. Select OK
4. Create another new coverage and set its coverage type to 1D-Hyd Cross
Section
5. Select OK
6. Activate the centerline coverage by single-clicking on its name in the
Project Explorer
4.4
Creating the Centerline and Bank Arcs
Centerline arcs are used to define the locations and lengths of the study reaches and
assign their attributes. We will have a centerline following the main channel as well as
the tributary on the west. As the flows below the reservoir in the tributary on the East of
the Leith Creek are small, we will disregard that reach in our simulation. To create the
centerline arcs:
Select the Create Feature Arc tool
Following the pattern in Figure 4-1, create the centerline of the main channel
from upstream to downstream (HEC-RAS views a river in the upstream
to downstream direction and it will ultimately help define the left bank and
right bank characteristics) by clicking points on the centerline one at a
time. Double-click the last point to indicate that it is the end of the
centerline.
Page 4 of 17
© Aquaveo 2011
WMS Tutorials
Hydraulics and Floodplain Modeling – HEC-RAS Analysis
Figure 4-1: Creating the Centerline arcs
Create the arc for the west tributary, upstream to downstream, by clicking
points on the centerline. Create the last point where the tributary meets the
main channel by clicking on the main channel centerline. This splits the
centerline of the main channel into two reaches.
This defines the centerline for the model in this simulation. It will consist of two reaches
in the main channel (divided by the tributary), and one reach in the west tributary.
Bank arcs are used to define the locations of the banks and the over-bank distances. The
next step is to create bank arcs along both sides of each centerline arc. To create the bank
arcs:
Select the Create Feature Arc tool
Create new arcs where you estimate the bank locations to be, based upon
contours/colors (roughly follow the green area around the centerline arcs)
on the background image. Use Figure 4-2 as a guide.
Page 5 of 17
© Aquaveo 2011
WMS Tutorials
Hydraulics and Floodplain Modeling – HEC-RAS Analysis
Figure 4-2: Placement of Bank arcs
Choose the Select Feature Arc tool
Select all of the bank arcs (hold the SHIFT key down while selecting in order
to multi-select arcs)
Select Feature Objects | Attributes
Change the Arc Type to Bank
Select OK
1. The background image is no longer necessary; uncheck the toggle box next
to the images folder.
4.5
Naming the Centerline Arcs
Reaches are stream sections where the flow rates and other hydraulic conditions are
assumed to be constant. A river can be comprised of one or more reaches, but only one
flow path. HEC-RAS has the ability to model multiple rivers (flow paths). To assign
names to our rivers and reaches:
1. Double-click the uppermost reach in the main channel
2. Make sure the Arc type is set to Centerline
3. Select OK
4. Enter Leith Creek for the River Name
5. Enter Upper Main for the Reach Name
6. Select OK
Page 6 of 17
© Aquaveo 2011
WMS Tutorials
Hydraulics and Floodplain Modeling – HEC-RAS Analysis
7. Repeat steps 1 to 4 for each reach in the map as shown in Figure 4-3.
NOTE: For the Lower Main reach you can choose Leith Creek from the river name
combo box instead of typing it in.
Figure 4-3: River and Reach Names
4.6
Creating Land Use / Materials Coverage
One of the properties HEC-RAS uses is roughness values. We will designate materials to
different areas of our model. Later we will assign each material a roughness value. The
material zones are stored in WMS as an Area Property coverage. To load the materials
data:
1. Select File | Open
2. Open the file “Materials.map”
3. Select Edit | Materials
4. Click the New button 5 times in order to create 5 new material types
5. Rename the materials as shown below in Figure 4-4
Page 7 of 17
© Aquaveo 2011
WMS Tutorials
Hydraulics and Floodplain Modeling – HEC-RAS Analysis
Figure 4-4: materials for use in the Area Property coverage
6. If you wish, you may set the color and pattern to better match the
descriptions.
7. Select OK to close the Materials Data dialog
8. Make sure the newly created area property coverage, Materials, is active in
the Project Explorer
9. Right-click on the Materials coverage and choose Properties
10. Change the Coverage type to Area Property and enter “Materials” as the
coverage name
11. Select OK
Now that you have defined all the materials, you will assign a material type to each
polygon in the Materials coverage.
12. Select the Select Feature Polygon tool
13. Double-click on the polygon that defines the river area (see Figure 4-5)
14. Set the polygon type to Material and choose river from the drop-down list
15. Select OK
16. Using Figure 4-5 as a guide, define material types for the remaining
polygons (remember you can also double-click on a polygon to bring up
the attributes dialog)
Page 8 of 17
© Aquaveo 2011
WMS Tutorials
Hydraulics and Floodplain Modeling – HEC-RAS Analysis
Figure 4-5: Materials used in HEC-RAS Simulation
4.7
Creating the Cross Sections
HEC-RAS associates most of its model data with cross sections and generates solutions
or output at the cross sections. Therefore, cross sections are the most important part of the
map. HEC-RAS requires at least two cross sections on each reach. To create the cross
sections:
1. Set the current coverage to 1D-Hyd Cross Section by single-clicking on it
in the Project Explorer
2. Select the Create Feature Arc tool
3. Create at least two cross sections on each reach by clicking a point on one
side of the reach then double-clicking a point on the other side of the reach
as shown in Figure 4-6
Page 9 of 17
© Aquaveo 2011
WMS Tutorials
Hydraulics and Floodplain Modeling – HEC-RAS Analysis
Figure 4-6: Cross section coverage
4.8
Extracting Cross Sections
In the cross section coverage, all arcs are cross section arcs. Their position and
orientation define the location of the cross sections in the system, but as of yet, they do
not have any data assigned. We want to assign elevation data, materials, and point
property locations to the cross sections. This information will be extracted from the TIN,
the area property coverage, and the centerline coverage. To extract this data:
1. Select River Tools | Extract Cross Section
WMS will extract an elevation point at every triangle edge along the cross section arc.
The default extraction settings are to use the centerline coverage to generate point
properties and the area property coverage to define material zones.
2. Select OK
3. When WMS prompts you for a filename and location for saving the cross
section database, enter the name “xsecs” and select Save
Each cross section arc now stores a link to a cross section database record which contains
xyz data, materials properties, bank locations, and thalweg locations. To view and edit
the information at a cross section:
4. Choose the Select Feature Arc tool
5. Double-click on any cross section. This brings up the River Cross Section
Attributes dialog
6. Ensure that the reach name is assigned correctly
Page 10 of 17
© Aquaveo 2011
WMS Tutorials
Hydraulics and Floodplain Modeling – HEC-RAS Analysis
7. Click on the Assign Cross Section button. This brings up the Assign Cross
Section Profile dialog, which is used to view the current cross section
shape and select a different cross section from a cross section database if
desired
8. Click on the Edit button. This brings up the Cross-Section Attributes
dialog. This dialog can be used to view and/or edit the cross section
9. Click on the Line Props tab to view the materials that are assigned to the
cross section
10. Click on the Point Props tab to view the locations of the left bank, right
bank, and thalweg
11. Select Cancel until all the dialogs are closed
For this exercise we will use the cross sections as extracted from the TIN, but for a
project you will often need to edit a cross section, or merge surveyed cross sections and
perform other editing procedures. This is the topic of a separate chapter and therefore is
not covered in detail here.
5
Creating the Network Schematic
WMS interacts with HEC-RAS using a HEC-GeoRAS geometry file. This file contains
the cross sectional data used by HEC-RAS in addition to three dimensional
georeferencing data. To create this geometry file, the conceptual model must be
converted to a network schematic diagram in the River module. To convert the
conceptual model to a network schematic:
1. Set the current coverage to 1D-Hyd Centerline by clicking on it in the
Project Explorer
2. Select River Tools | Map -> 1D Schematic
Your screen should appear similar to Figure 5-1
Page 11 of 17
© Aquaveo 2011
WMS Tutorials
Hydraulics and Floodplain Modeling – HEC-RAS Analysis
Figure 5-1: Schematic diagram
Now WMS includes two separate representations of the data. The first you created as a
conceptual model, which is stored as a series of coverages. The second is a numeric
model stored as a schematic of cross sections organized into reaches. Modifications to the
network schematic that can be used by HEC-RAS can be made directly in the River
module, or indirectly by editing the conceptual model in the Map module and mapping to
a new network schematic.
HEC-RAS needs Manning’s roughness values for the materials found in the cross section
database. The roughness values are stored as part of the 1D model in the River module.
To specify the roughness values for the each of the materials:
3. Switch to the River module
4. Select HEC-RAS | Material Properties
5. Enter the roughness values for each material as shown in Figure 5-2
Page 12 of 17
© Aquaveo 2011
WMS Tutorials
Hydraulics and Floodplain Modeling – HEC-RAS Analysis
Figure 5-2: HEC-RAS Material Properties Dialog
6. Select OK
Now we need to tell HEC-RAS which set of line properties in the database should be
used as material types. To do this:
7. Select HEC-RAS | Model Control
8. Select the line property name that stores the roughness values for the cross
section database. In this case, the line property is named Materials which
came from our area property coverage, Materials
9. Select OK
6
Creating the HEC-RAS Project File
Now that the model has been set up, we need to create the HEC-RAS project file. To
create this file:
1. Select HEC-RAS | Export GIS File
2. Name the file hecras.prj
3. Select Save
4. Select Yes to overwrite existing files, if prompted
After saving out the HEC-RAS project file, WMS automatically opens the HEC-RAS
application and loads the project.
Page 13 of 17
© Aquaveo 2011
WMS Tutorials
7
Hydraulics and Floodplain Modeling – HEC-RAS Analysis
Using HEC-RAS
Within HEC-RAS, we will setup and run the simulation and then export the results for
post-processing in WMS. The setup will include entering junction lengths, specifying
flow values, and assigning river boundary conditions.
1. Select Edit | Geometric Data
Your screen should appear similar to Figure 7-1.
Figure 7-1: The Geometric Editor in HEC-RAS.
In the case that an excessive number of points are extracted from the cross section arcs,
HEC-RAS has a tool that will filter points that are too close together to run an analysis.
Since there are many data editing tools available within HEC-RAS in addition to the
filtering tool, we simply make you aware of such tools and suggest that you browse the
HEC-RAS user’s manual for more information.
We will enter junction lengths in the Geometric Data Editor.
2. Click on the node (junction) that joins the West Tributary and Upper Main
reaches.
3. Select Edit Junction from the pop-up menu
The Junction Length value should be entered as the distance stretching across the
junction between adjacent cross sections. We will measure these lengths with the
Measure tool in WMS.
4. Activate the WMS window
5. Switch to the Map module
6. Choose the Measure tool
Page 14 of 17
© Aquaveo 2011
WMS Tutorials
Hydraulics and Floodplain Modeling – HEC-RAS Analysis
7. As shown in the example in figure below, trace the distance along the
centerline arc between the most downstream cross section arc on the West
Tributary reach and the most upstream cross section arc on the Lower Main
reach. Note the length for future use.
Figure 7-2: Measuring Junction Lengths.
8. Revert back to the HEC-RAS Junction Data dialog
9. Enter the measured length in the Junction Length field corresponding to the
“To: West Tributary – West Tributary” line
10. Repeat these steps to measure and enter the Junction Length between the
most downstream cross section arc on the Upper Main reach and the most
upstream cross section arc on the Lower Main reach
11. Once you have finished entering both lengths, select OK
12. Select File | Exit Geometry Data Editor
The next step is to define the flow and boundary conditions for our reaches. To define
this information:
13. Select Edit | Steady Flow Data
14. For Profile 1 (PF 1), enter 4000 for Upper Main; enter 5000 for Lower
Main; enter 1000 for West Tributary
15. Click on the Reach Boundary Conditions button
For our analysis we are going to have HEC-RAS compute normal depths at the
boundaries of our model. To do this:
Page 15 of 17
© Aquaveo 2011
WMS Tutorials
Hydraulics and Floodplain Modeling – HEC-RAS Analysis
16. For each of the blank boxes in the spreadsheet, select the box and click on
the Normal Depth button. In the dialog that appears, enter the following
values for the slopes of each reach: 0.003 for the upper reach, 0.001 for the
lower reach, and 0.005 for the tributary.
17. Select OK
18. Click the Apply Data button
19. Select File | Exit Flow Data Editor
We are now ready to run the steady flow analysis. We first need to set an option to set
flow distribution locations so that velocity profiles will be computed. To set this option
and perform the analysis:
20. Select Run | Steady Flow Analysis
21. Select Options | Flow Distribution Locations
22. Change the Global subsections to 3 in each of the three fields (LOB,
Channel, and ROB)
23. Select OK
24. Click the Compute button. This runs the 1D analysis
25. Close the Steady Flow Analysis Dialog
26. Exit out of the HEC-RAS program and save information, if prompted
8
Post-Processing
Now that HEC-RAS has computed water surface elevations, we can read the solution into
WMS. The water surface elevations are read in as 2D Scatter Points and can be used to
perform a floodplain delineation. To read the solution:
1. In WMS, switch to the River module
2. Select HEC-RAS | Read Solution
Notice that a new scatter point file has been read into WMS. These points contain the
water surface elevations computed by HEC-RAS. Since we used 7 cross sections in our
model, we only have 7 scatter points with which to perform the floodplain delineation.
WMS has a tool that interpolates scatter points along centerline and cross section arcs
which achieves more accurate floodplain delineation.
3. Select the 1D-Hyd Centerline coverage from the Project Explorer
4. Select River Tools | Interpolate Water Surface Elevations
Note that hecras is selected as the Scatter dataset. In this case, it is the only scatter dataset
available. But if you had multiple datasets, you could specify which one to use for the
interpolation.
5. Choose At a specified spacing for the Create a data point option
6. Enter 60 for the spacing
7. Select OK
8. Select the 1D-Hyd Cross Section coverage from the Project Explorer
Page 16 of 17
© Aquaveo 2011
WMS Tutorials
Hydraulics and Floodplain Modeling – HEC-RAS Analysis
9. Select River Tools | Interpolate Water Surface Elevations
10. Select OK
11. Switch to the Terrain Data module
12. Select Flood | Delineate
13. Toggle on the Search radius check box and enter 1000 for the radius
14. Toggle on the Quadrants check box
15. Enter 4 for the number of stages in a quadrant
16. Select OK
17. WMS now computes two new datasets corresponding to floodplain depths
and water surface elevations (river bed elevation and flood depth)
18. Select the data set named W.S. Elev-PF 1 (FLOOD)
19. Select Display | Display Options
20. Choose TIN Data
21. Toggle on TIN Contours and choose the Options button
22. Choose Color fill under Contour Method
23. Under Data Range, select Specify a Range
24. Deselect Fill below and Fill above
25. Select OK twice to exit both dialogs
These color-filled contours, shown in Figure 8-1, represent the varying water surface
elevations in the computed floodplain. For more information and practice on floodplain
delineation, see the third chapter of this volume, entitled Floodplain Delineation. A
second HEC-RAS exercise where surveyed cross sections are used can be found in the
next chapter.
Figure 8-1: Resulting TIN from the Floodplain Delineation
Page 17 of 17
© Aquaveo 2011